Washington Map & Demographics
Washington Map
Washington Overview
Nov 11, 1889
INCORPORATED
71,298
TOTAL AREA [ SQ MI ]
66,449
LAND AREA [ SQ MI ]
4,849
WATER AREA [ SQ MI ]
1,700
ELEVATION AVG [ FT ]
14,410
ELEVATION HIGH [ FT ]
Sea Level
ELEVATION LOW [ FT ]
115.7
POP DENSITY [ PPL / SQ MI ]
$48,685
PER CAPITA INCOME
$108,285
AVG FAMILY INCOME
$90,325
AVG HOUSEHOLD INCOME
30.9%
WAGE / INCOME GAP [ % ]
69.1¢/ $1
WAGE / INCOME GAP [ $ ]
$11,222
FAMILY INCOME DEFICIT
0.46
INEQUALITY / GINI INDEX
99301
LARGEST ZIP CODE
Seattle
LARGEST CITY
King County
LARGEST COUNTY
7,688,549
TOTAL POPULATION
3,877,918
MALE POPULATION
3,810,631
FEMALE POPULATION
101.77
MALES / 100 FEMALES
98.26
FEMALES / 100 MALES
38.0
MEDIAN AGE
3.1
AVG FAMILY SIZE
2.5
AVG HOUSEHOLD SIZE
4,011,152
LABOR FORCE [ PEOPLE ]
64.6%
PERCENT IN LABOR FORCE
5.0%
UNEMPLOYMENT RATE
Income in Washington
Income Overview in Washington
Per Capita Income in Washington is $48,685, while median incomes of families and households are $108,285 and $90,325 respectively.
| Characteristic | Number | Measure |
| Per Capita Income | 7,688,549 | $48,685 |
| Median Family Income | 1,910,770 | $108,285 |
| Mean Family Income | 1,910,770 | $142,582 |
| Median Household Income | 2,979,272 | $90,325 |
| Mean Household Income | 2,979,272 | $122,880 |
| Income Deficit | 1,910,770 | $11,222 |
| Wage / Income Gap (%) | 7,688,549 | 30.93% |
| Wage / Income Gap ($) | 7,688,549 | 69.07¢ per $1 |
| Gini / Inequality Index | 7,688,549 | 0.46 |
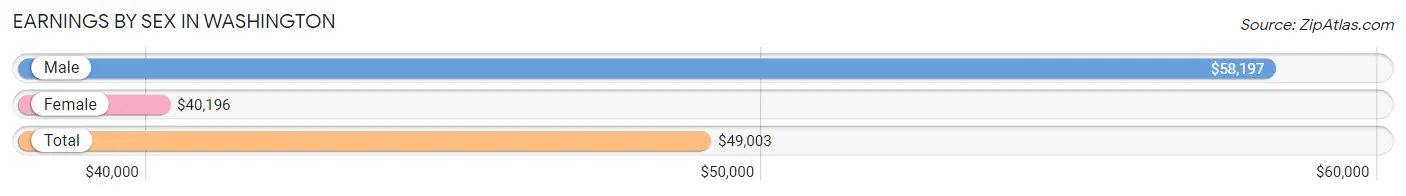
Earnings by Sex in Washington
Average Earnings in Washington are $49,003, $58,197 for men and $40,196 for women, a difference of 30.9%.
| Sex | Number | Average Earnings |
| Male | 2,285,343 (54.2%) | $58,197 |
| Female | 1,926,987 (45.8%) | $40,196 |
| Total | 4,212,330 (100.0%) | $49,003 |
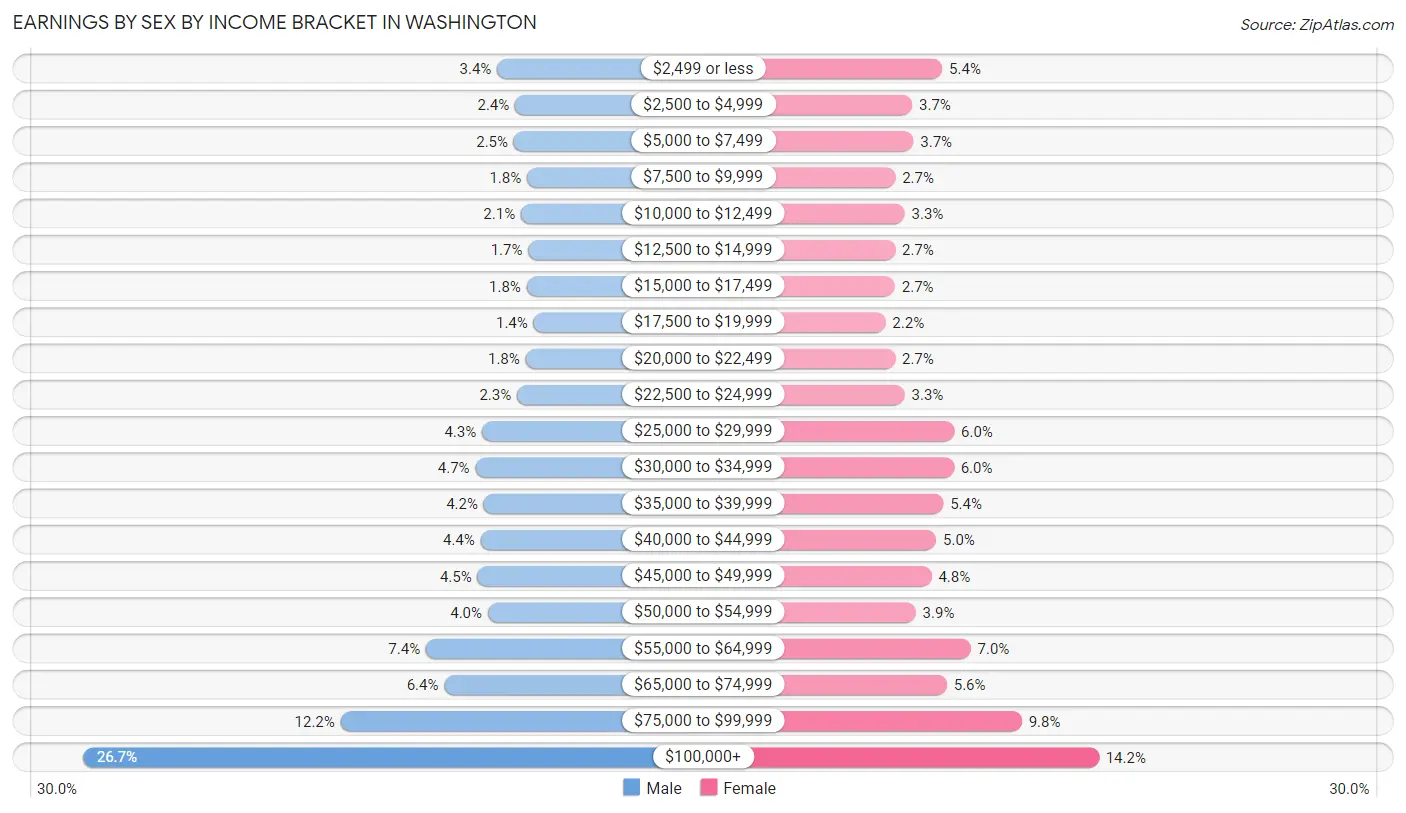
Earnings by Sex by Income Bracket in Washington
The most common earnings brackets in Washington are $100,000+ for men (609,413 | 26.7%) and $100,000+ for women (272,931 | 14.2%).
| Income | Male | Female |
| $2,499 or less | 78,664 (3.4%) | 103,354 (5.4%) |
| $2,500 to $4,999 | 55,586 (2.4%) | 70,719 (3.7%) |
| $5,000 to $7,499 | 57,107 (2.5%) | 72,096 (3.7%) |
| $7,500 to $9,999 | 40,182 (1.8%) | 52,507 (2.7%) |
| $10,000 to $12,499 | 47,918 (2.1%) | 62,718 (3.3%) |
| $12,500 to $14,999 | 38,685 (1.7%) | 52,278 (2.7%) |
| $15,000 to $17,499 | 40,692 (1.8%) | 52,036 (2.7%) |
| $17,500 to $19,999 | 31,689 (1.4%) | 41,872 (2.2%) |
| $20,000 to $22,499 | 42,080 (1.8%) | 52,312 (2.7%) |
| $22,500 to $24,999 | 53,056 (2.3%) | 62,705 (3.3%) |
| $25,000 to $29,999 | 98,129 (4.3%) | 116,148 (6.0%) |
| $30,000 to $34,999 | 106,407 (4.7%) | 115,845 (6.0%) |
| $35,000 to $39,999 | 95,673 (4.2%) | 104,535 (5.4%) |
| $40,000 to $44,999 | 99,825 (4.4%) | 96,701 (5.0%) |
| $45,000 to $49,999 | 103,652 (4.5%) | 91,648 (4.8%) |
| $50,000 to $54,999 | 90,403 (4.0%) | 74,564 (3.9%) |
| $55,000 to $64,999 | 169,926 (7.4%) | 134,162 (7.0%) |
| $65,000 to $74,999 | 146,499 (6.4%) | 108,392 (5.6%) |
| $75,000 to $99,999 | 279,757 (12.2%) | 189,464 (9.8%) |
| $100,000+ | 609,413 (26.7%) | 272,931 (14.2%) |
| Total | 2,285,343 (100.0%) | 1,926,987 (100.0%) |
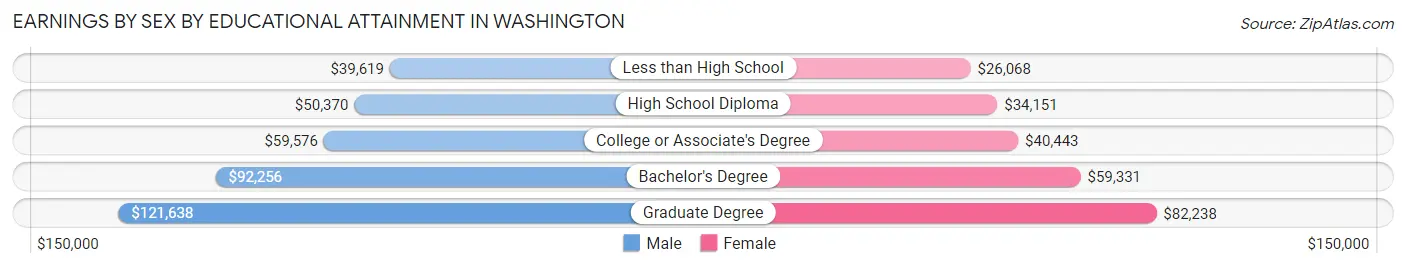
Earnings by Sex by Educational Attainment in Washington
Average earnings in Washington are $67,188 for men and $46,362 for women, a difference of 31.0%. Men with an educational attainment of graduate degree enjoy the highest average annual earnings of $121,638, while those with less than high school education earn the least with $39,619. Women with an educational attainment of graduate degree earn the most with the average annual earnings of $82,238, while those with less than high school education have the smallest earnings of $26,068.
| Educational Attainment | Male Income | Female Income |
| Less than High School | $39,619 | $26,068 |
| High School Diploma | $50,370 | $34,151 |
| College or Associate's Degree | $59,576 | $40,443 |
| Bachelor's Degree | $92,256 | $59,331 |
| Graduate Degree | $121,638 | $82,238 |
| Total | $67,188 | $46,362 |
Family Income in Washington
Family Income Brackets in Washington
According to the Washington family income data, there are 412,726 families falling into the $100,000 to $149,999 income range, which is the most common income bracket and makes up 21.6% of all families. Conversely, the $10,000 to $14,999 income bracket is the least frequent group with only 22,929 families (1.2%) belonging to this category.
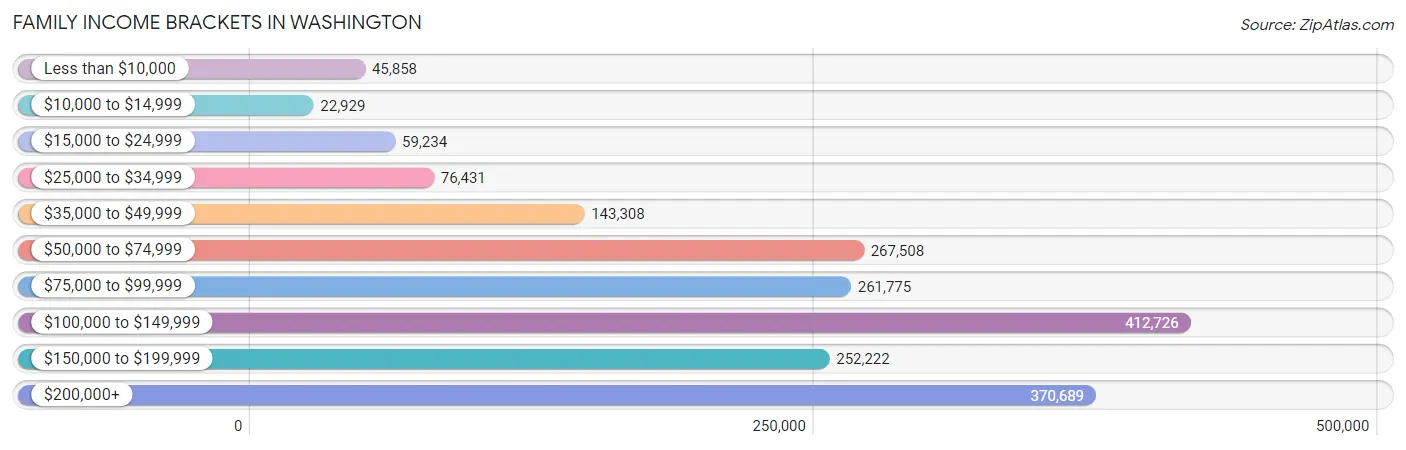
| Income Bracket | # Families | % Families |
| Less than $10,000 | 45,858 | 2.4% |
| $10,000 to $14,999 | 22,929 | 1.2% |
| $15,000 to $24,999 | 59,234 | 3.1% |
| $25,000 to $34,999 | 76,431 | 4.0% |
| $35,000 to $49,999 | 143,308 | 7.5% |
| $50,000 to $74,999 | 267,508 | 14.0% |
| $75,000 to $99,999 | 261,775 | 13.7% |
| $100,000 to $149,999 | 412,726 | 21.6% |
| $150,000 to $199,999 | 252,222 | 13.2% |
| $200,000+ | 370,689 | 19.4% |
Family Income by Famaliy Size in Washington
4-person families (353,836 | 18.5%) account for the highest median family income in Washington with $131,054 per family, while 2-person families (905,599 | 47.4%) have the highest median income of $47,944 per family member.
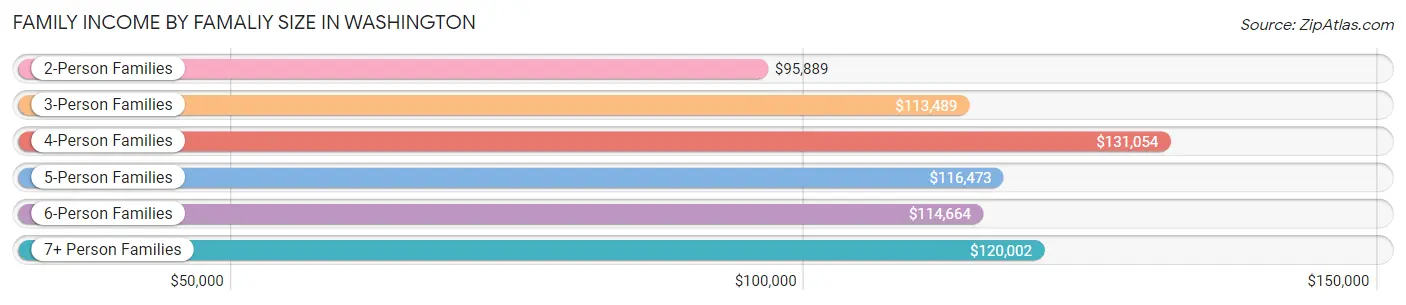
| Income Bracket | # Families | Median Income |
| 2-Person Families | 905,599 (47.4%) | $95,889 |
| 3-Person Families | 414,719 (21.7%) | $113,489 |
| 4-Person Families | 353,836 (18.5%) | $131,054 |
| 5-Person Families | 145,979 (7.6%) | $116,473 |
| 6-Person Families | 56,110 (2.9%) | $114,664 |
| 7+ Person Families | 34,527 (1.8%) | $120,002 |
| Total | 1,910,770 (100.0%) | $108,285 |
Family Income by Number of Earners in Washington
The median family income in Washington is $108,285, with families comprising 3+ earners (209,880) having the highest median family income of $159,285, while families with no earners (276,448) have the lowest median family income of $61,447, accounting for 11.0% and 14.5% of families, respectively.
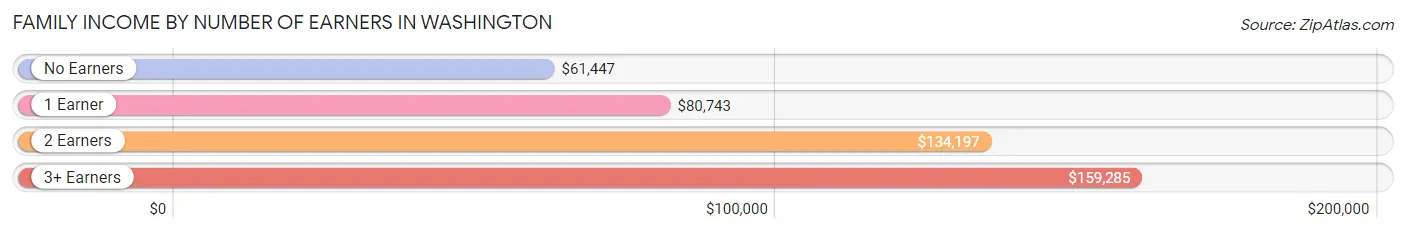
| Number of Earners | # Families | Median Income |
| No Earners | 276,448 (14.5%) | $61,447 |
| 1 Earner | 597,295 (31.3%) | $80,743 |
| 2 Earners | 827,147 (43.3%) | $134,197 |
| 3+ Earners | 209,880 (11.0%) | $159,285 |
| Total | 1,910,770 (100.0%) | $108,285 |
Household Income in Washington
Household Income Brackets in Washington
With 566,062 households falling in the category, the $100,000 to $149,999 income range is the most frequent in Washington, accounting for 19.0% of all households. In contrast, only 83,420 households (2.8%) fall into the $10,000 to $14,999 income bracket, making it the least populous group.
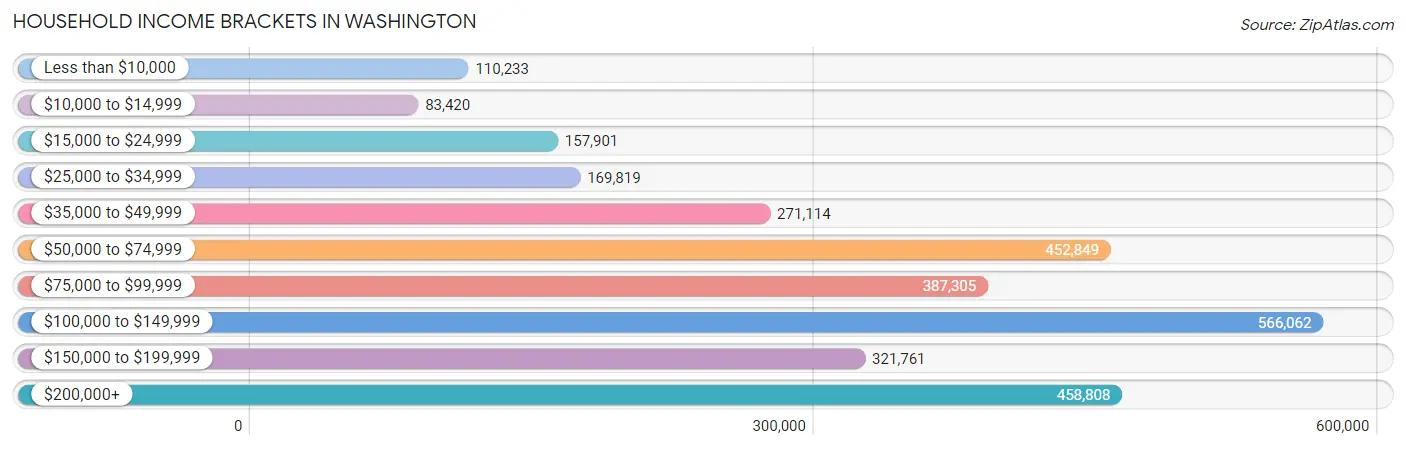
| Income Bracket | # Households | % Households |
| Less than $10,000 | 110,233 | 3.7% |
| $10,000 to $14,999 | 83,420 | 2.8% |
| $15,000 to $24,999 | 157,901 | 5.3% |
| $25,000 to $34,999 | 169,819 | 5.7% |
| $35,000 to $49,999 | 271,114 | 9.1% |
| $50,000 to $74,999 | 452,849 | 15.2% |
| $75,000 to $99,999 | 387,305 | 13.0% |
| $100,000 to $149,999 | 566,062 | 19.0% |
| $150,000 to $199,999 | 321,761 | 10.8% |
| $200,000+ | 458,808 | 15.4% |
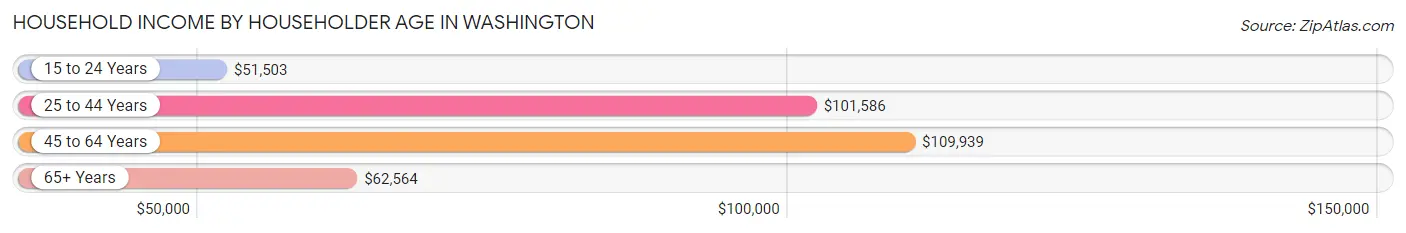
Household Income by Householder Age in Washington
The median household income in Washington is $90,325, with the highest median household income of $109,939 found in the 45 to 64 years age bracket for the primary householder. A total of 1,045,712 households (35.1%) fall into this category. Meanwhile, the 15 to 24 years age bracket for the primary householder has the lowest median household income of $51,503, with 123,362 households (4.1%) in this group.
| Income Bracket | # Households | Median Income |
| 15 to 24 Years | 123,362 (4.1%) | $51,503 |
| 25 to 44 Years | 1,064,127 (35.7%) | $101,586 |
| 45 to 64 Years | 1,045,712 (35.1%) | $109,939 |
| 65+ Years | 746,071 (25.0%) | $62,564 |
| Total | 2,979,272 (100.0%) | $90,325 |
Poverty in Washington
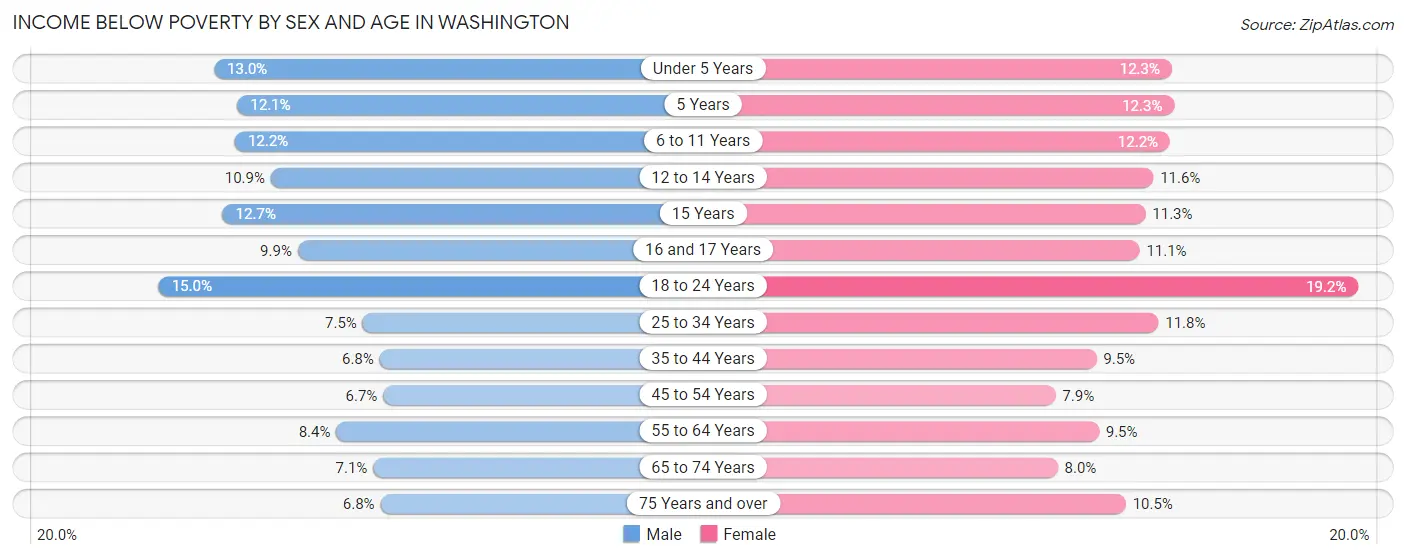
Income Below Poverty by Sex and Age in Washington
With 8.9% poverty level for males and 10.8% for females among the residents of Washington, 18 to 24 year old males and 18 to 24 year old females are the most vulnerable to poverty, with 48,680 males (15.0%) and 58,165 females (19.2%) in their respective age groups living below the poverty level.
| Age Bracket | Male | Female |
| Under 5 Years | 28,744 (13.0%) | 25,682 (12.2%) |
| 5 Years | 5,556 (12.1%) | 5,339 (12.3%) |
| 6 to 11 Years | 34,825 (12.2%) | 32,667 (12.2%) |
| 12 to 14 Years | 15,492 (10.9%) | 16,031 (11.6%) |
| 15 Years | 6,171 (12.7%) | 5,288 (11.3%) |
| 16 and 17 Years | 9,212 (9.9%) | 9,866 (11.1%) |
| 18 to 24 Years | 48,680 (15.0%) | 58,165 (19.2%) |
| 25 to 34 Years | 44,344 (7.4%) | 65,138 (11.7%) |
| 35 to 44 Years | 36,963 (6.8%) | 48,707 (9.5%) |
| 45 to 54 Years | 31,685 (6.7%) | 36,099 (7.9%) |
| 55 to 64 Years | 39,787 (8.4%) | 45,677 (9.5%) |
| 65 to 74 Years | 25,115 (7.1%) | 31,118 (8.0%) |
| 75 Years and over | 13,510 (6.8%) | 27,677 (10.5%) |
| Total | 340,084 (8.9%) | 407,454 (10.8%) |
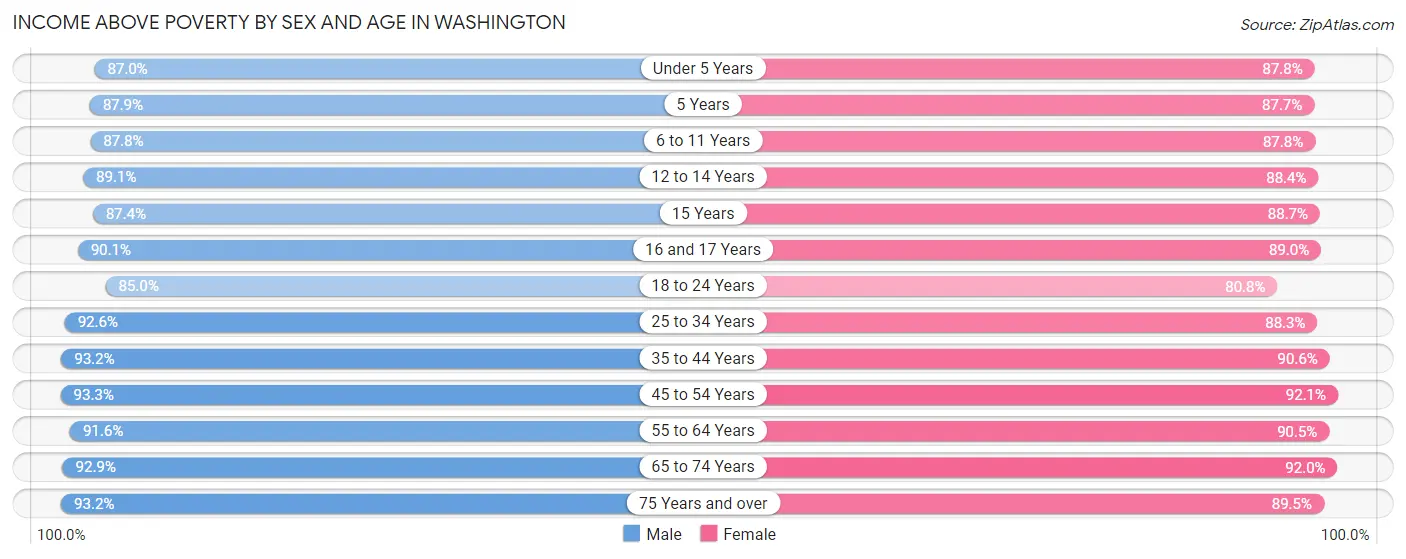
Income Above Poverty by Sex and Age in Washington
According to the poverty statistics in Washington, males aged 45 to 54 years and females aged 45 to 54 years are the age groups that are most secure financially, with 93.3% of males and 92.1% of females in these age groups living above the poverty line.
| Age Bracket | Male | Female |
| Under 5 Years | 192,874 (87.0%) | 184,025 (87.7%) |
| 5 Years | 40,346 (87.9%) | 37,940 (87.7%) |
| 6 to 11 Years | 250,825 (87.8%) | 235,527 (87.8%) |
| 12 to 14 Years | 127,167 (89.1%) | 122,590 (88.4%) |
| 15 Years | 42,604 (87.4%) | 41,620 (88.7%) |
| 16 and 17 Years | 84,186 (90.1%) | 79,458 (88.9%) |
| 18 to 24 Years | 275,409 (85.0%) | 245,198 (80.8%) |
| 25 to 34 Years | 551,130 (92.5%) | 489,382 (88.2%) |
| 35 to 44 Years | 504,673 (93.2%) | 466,568 (90.5%) |
| 45 to 54 Years | 441,767 (93.3%) | 419,264 (92.1%) |
| 55 to 64 Years | 431,992 (91.6%) | 432,992 (90.5%) |
| 65 to 74 Years | 330,513 (92.9%) | 357,611 (92.0%) |
| 75 Years and over | 185,468 (93.2%) | 234,975 (89.5%) |
| Total | 3,458,954 (91.0%) | 3,347,150 (89.1%) |
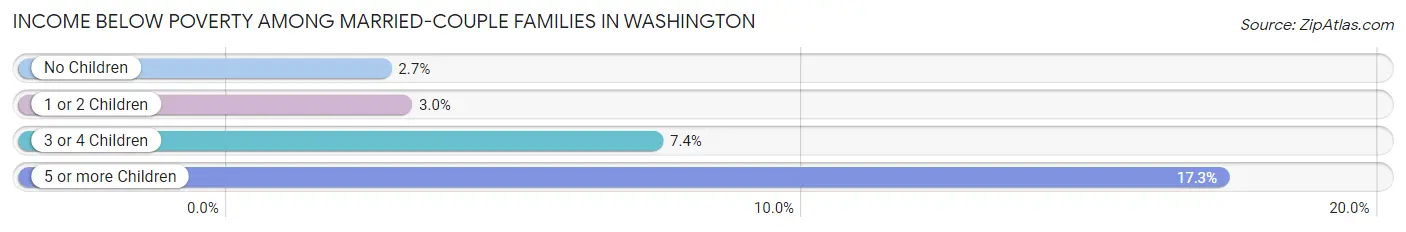
Income Below Poverty Among Married-Couple Families in Washington
The poverty statistics for married-couple families in Washington show that 3.3% or 48,682 of the total 1,482,230 families live below the poverty line. Families with 5 or more children have the highest poverty rate of 17.2%, comprising of 2,252 families. On the other hand, families with no children have the lowest poverty rate of 2.7%, which includes 22,945 families.
| Children | Above Poverty | Below Poverty |
| No Children | 837,758 (97.3%) | 22,945 (2.7%) |
| 1 or 2 Children | 478,550 (97.0%) | 14,973 (3.0%) |
| 3 or 4 Children | 106,439 (92.6%) | 8,512 (7.4%) |
| 5 or more Children | 10,801 (82.8%) | 2,252 (17.2%) |
| Total | 1,433,548 (96.7%) | 48,682 (3.3%) |
Income Below Poverty Among Single-Parent Households in Washington
According to the poverty data in Washington, 9.3% or 13,111 single-father households and 20.7% or 59,519 single-mother households are living below the poverty line. Among single-father households, those with 5 or more children have the highest poverty rate, with 596 households (54.4%) experiencing poverty. Likewise, among single-mother households, those with 5 or more children have the highest poverty rate, with 1,685 households (61.7%) falling below the poverty line.
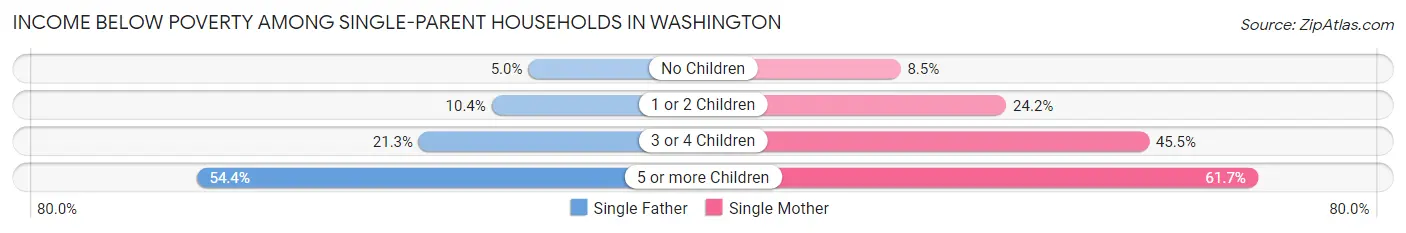
| Children | Single Father | Single Mother |
| No Children | 2,983 (5.0%) | 9,165 (8.5%) |
| 1 or 2 Children | 7,212 (10.4%) | 35,682 (24.2%) |
| 3 or 4 Children | 2,320 (21.2%) | 12,987 (45.5%) |
| 5 or more Children | 596 (54.4%) | 1,685 (61.7%) |
| Total | 13,111 (9.3%) | 59,519 (20.7%) |
Income Below Poverty Among Married-Couple vs Single-Parent Households in Washington
The poverty data for Washington shows that 48,682 of the married-couple family households (3.3%) and 72,630 of the single-parent households (17.0%) are living below the poverty level. Within the married-couple family households, those with 5 or more children have the highest poverty rate, with 2,252 households (17.2%) falling below the poverty line. Among the single-parent households, those with 5 or more children have the highest poverty rate, with 2,281 household (59.6%) living below poverty.
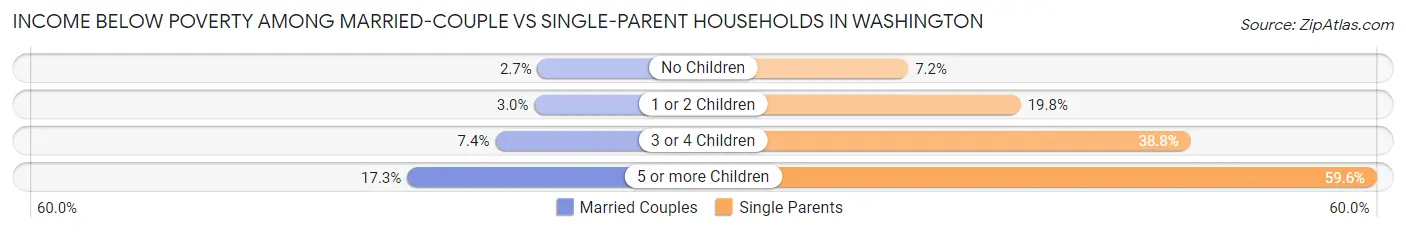
| Children | Married-Couple Families | Single-Parent Households |
| No Children | 22,945 (2.7%) | 12,148 (7.2%) |
| 1 or 2 Children | 14,973 (3.0%) | 42,894 (19.8%) |
| 3 or 4 Children | 8,512 (7.4%) | 15,307 (38.8%) |
| 5 or more Children | 2,252 (17.2%) | 2,281 (59.6%) |
| Total | 48,682 (3.3%) | 72,630 (17.0%) |
Largest Zip Codes by Population in Washington
The largest zip codes in Washington by population are 99301 (85,210), 98052 (77,324), 98012 (75,555), 98682 (66,821), and 98208 (60,723).
1.99301
85,210 (1.11%)
2.98052
77,324 (1.01%)
3.98012
75,555 (0.98%)
4.98682
66,821 (0.87%)
5.98208
60,723 (0.79%)
6.99208
58,172 (0.76%)
7.98391
56,646 (0.74%)
8.98115
54,457 (0.71%)
9.98270
52,794 (0.69%)
10.98034
52,636 (0.68%)
11.98103
51,878 (0.67%)
12.98387
51,384 (0.67%)
13.98003
51,329 (0.67%)
14.99336
51,329 (0.67%)
15.98133
50,921 (0.66%)
16.98632
50,837 (0.66%)
17.98023
50,778 (0.66%)
18.98092
50,679 (0.66%)
19.98258
50,582 (0.66%)
20.98105
50,302 (0.65%)
21.98661
49,910 (0.65%)
22.98225
49,667 (0.65%)
23.98042
49,338 (0.64%)
24.98118
48,874 (0.64%)
25.98837
46,959 (0.61%)
26.98501
46,796 (0.61%)
27.98223
46,117 (0.60%)
28.98902
45,929 (0.60%)
29.98226
45,703 (0.59%)
30.98374
45,555 (0.59%)
Largest Cities by Population in Washington
The largest cities in Washington by population are Seattle (734,603), Spokane (227,922), Tacoma (219,234), Vancouver (190,700), and Bellevue (150,606).
1.Seattle
734,603 (9.55%)
2.Spokane
227,922 (2.96%)
3.Tacoma
219,234 (2.85%)
190,700 (2.48%)
5.Bellevue
150,606 (1.96%)
6.Kent
135,169 (1.76%)
7.Everett
110,847 (1.44%)
8.Renton
105,355 (1.37%)
103,761 (1.35%)
10.Federal Way
99,614 (1.30%)
11.Yakima
96,764 (1.26%)
12.Kirkland
92,015 (1.20%)
13.Bellingham
91,353 (1.19%)
14.Auburn
85,623 (1.11%)
15.Kennewick
83,823 (1.09%)
16.Pasco
77,274 (1.01%)
17.Redmond
73,728 (0.96%)
18.Marysville
70,847 (0.92%)
19.South Hill
67,835 (0.88%)
20.Sammamish
66,586 (0.87%)
21.Lakewood
63,142 (0.82%)
22.Richland
60,867 (0.79%)
23.Shoreline
58,673 (0.76%)
24.Lacey
56,263 (0.73%)
25.Olympia
55,151 (0.72%)
26.Burien
51,505 (0.67%)
27.Bothell
47,917 (0.62%)
28.Bremerton
43,983 (0.57%)
29.Edmonds
42,705 (0.56%)
30.Puyallup
42,610 (0.55%)
Largest Counties by Population in Washington
The largest counties in Washington by population are King County (2,254,371), Pierce County (918,993), Snohomish County (828,337), Spokane County (538,711), and Clark County (504,091).
2,254,371 (29.32%)
918,993 (11.95%)
828,337 (10.77%)
538,711 (7.01%)
504,091 (6.56%)
294,272 (3.83%)
275,411 (3.58%)
256,143 (3.33%)
226,523 (2.95%)
207,560 (2.70%)
129,480 (1.68%)
110,621 (1.44%)
13.Grant County
99,145 (1.29%)
96,692 (1.26%)
86,510 (1.13%)
16.Lewis County
82,663 (1.08%)
79,076 (1.03%)
77,333 (1.01%)
75,672 (0.98%)
20.Mason County
66,053 (0.86%)
62,150 (0.81%)
47,141 (0.61%)
46,774 (0.61%)
44,424 (0.58%)
43,189 (0.56%)
42,336 (0.55%)
33,006 (0.43%)
23,396 (0.30%)
22,798 (0.30%)
22,370 (0.29%)
Race in Washington
The most populous races in Washington are White / Caucasian (5,374,874 | 69.9%), Hispanic or Latino (1,037,153 | 13.5%), and Two or more Races (759,279 | 9.9%).
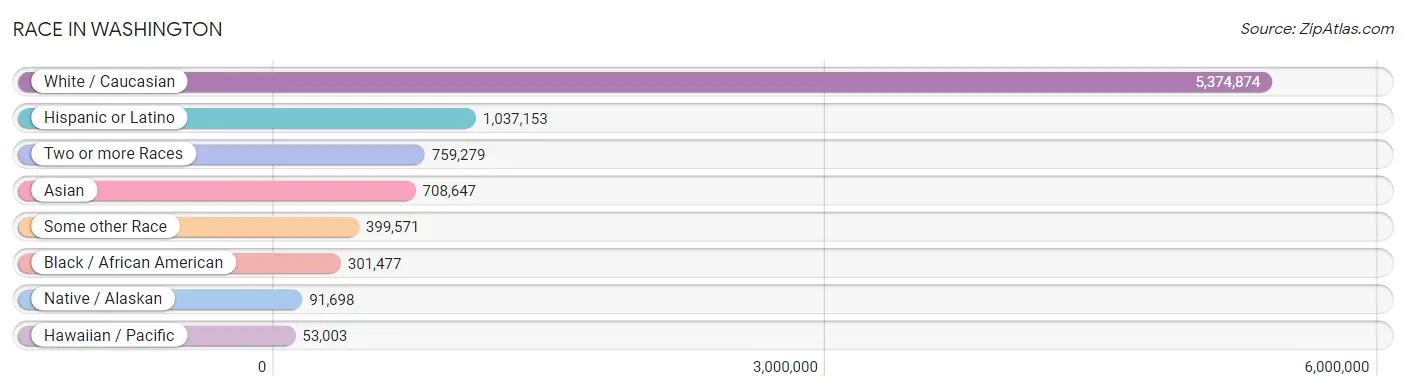
| Race | # Population | % Population |
| Asian | 708,647 | 9.2% |
| Black / African American | 301,477 | 3.9% |
| Hawaiian / Pacific | 53,003 | 0.7% |
| Hispanic or Latino | 1,037,153 | 13.5% |
| Native / Alaskan | 91,698 | 1.2% |
| White / Caucasian | 5,374,874 | 69.9% |
| Two or more Races | 759,279 | 9.9% |
| Some other Race | 399,571 | 5.2% |
| Total | 7,688,549 | 100.0% |
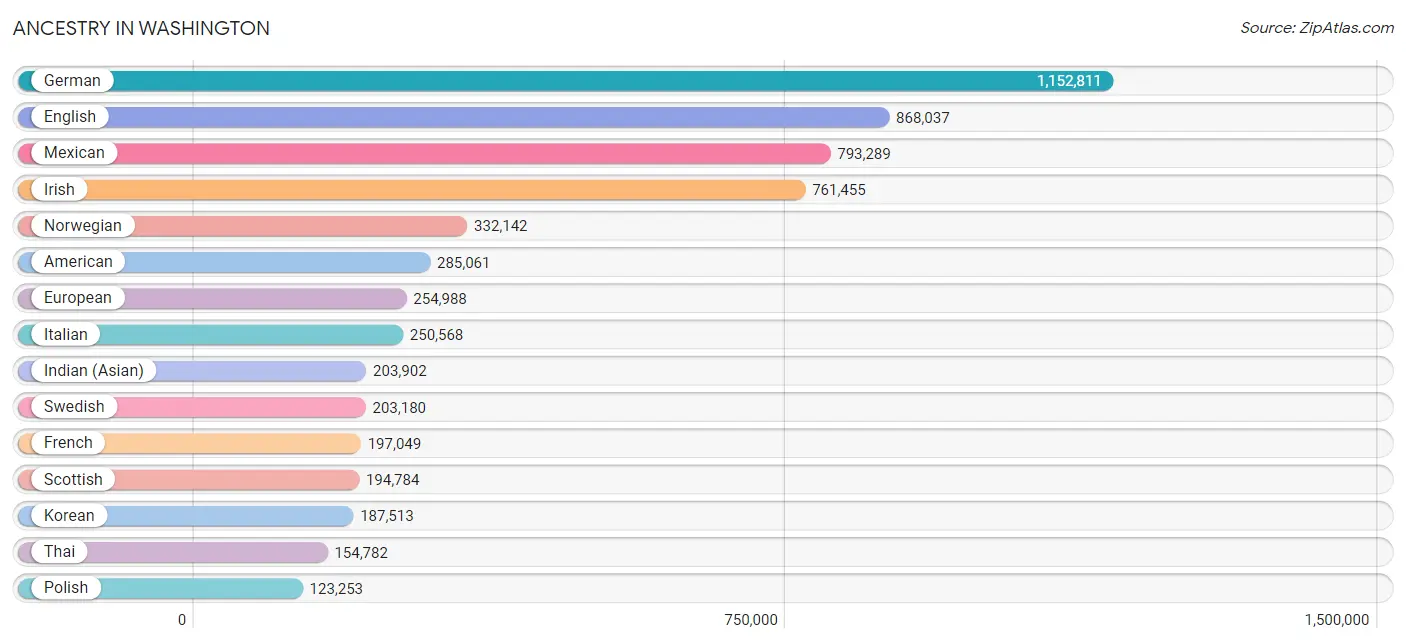
Ancestry in Washington
The most populous ancestries reported in Washington are German (1,152,811 | 15.0%), English (868,037 | 11.3%), Mexican (793,289 | 10.3%), Irish (761,455 | 9.9%), and Norwegian (332,142 | 4.3%), together accounting for 50.8% of all Washington residents.
| Ancestry | # Population | % Population |
| Afghan | 5,996 | 0.1% |
| African | 33,788 | 0.4% |
| Alaska Native | 2,432 | 0.0% |
| Alaskan Athabascan | 1,796 | 0.0% |
| Albanian | 1,400 | 0.0% |
| Aleut | 3,039 | 0.0% |
| Alsatian | 301 | 0.0% |
| American | 285,061 | 3.7% |
| Apache | 3,953 | 0.1% |
| Arab | 39,659 | 0.5% |
| Arapaho | 115 | 0.0% |
| Argentinean | 3,791 | 0.1% |
| Armenian | 6,949 | 0.1% |
| Assyrian / Chaldean / Syriac | 420 | 0.0% |
| Australian | 4,610 | 0.1% |
| Austrian | 17,898 | 0.2% |
| Bahamian | 314 | 0.0% |
| Bangladeshi | 4,730 | 0.1% |
| Barbadian | 386 | 0.0% |
| Basque | 3,128 | 0.0% |
| Belgian | 7,529 | 0.1% |
| Belizean | 775 | 0.0% |
| Bermudan | 50 | 0.0% |
| Bhutanese | 93,123 | 1.2% |
| Blackfeet | 12,776 | 0.2% |
| Bolivian | 1,391 | 0.0% |
| Brazilian | 8,346 | 0.1% |
| British | 69,537 | 0.9% |
| British West Indian | 578 | 0.0% |
| Bulgarian | 4,563 | 0.1% |
| Burmese | 100,159 | 1.3% |
| Cajun | 1,088 | 0.0% |
| Cambodian | 2,565 | 0.0% |
| Canadian | 26,310 | 0.3% |
| Cape Verdean | 121 | 0.0% |
| Carpatho Rusyn | 260 | 0.0% |
| Celtic | 2,275 | 0.0% |
| Central American | 73,272 | 0.9% |
| Central American Indian | 6,112 | 0.1% |
| Cherokee | 29,466 | 0.4% |
| Cheyenne | 842 | 0.0% |
| Chickasaw | 1,790 | 0.0% |
| Chilean | 4,369 | 0.1% |
| Chinese | 622 | 0.0% |
| Chippewa | 7,750 | 0.1% |
| Choctaw | 6,139 | 0.1% |
| Colombian | 11,884 | 0.2% |
| Colville | 8,885 | 0.1% |
| Comanche | 791 | 0.0% |
| Costa Rican | 3,253 | 0.0% |
| Cree | 1,144 | 0.0% |
| Creek | 1,775 | 0.0% |
| Croatian | 13,639 | 0.2% |
| Crow | 588 | 0.0% |
| Cuban | 11,594 | 0.2% |
| Cypriot | 67 | 0.0% |
| Czech | 27,570 | 0.4% |
| Czechoslovakian | 6,244 | 0.1% |
| Danish | 61,497 | 0.8% |
| Delaware | 660 | 0.0% |
| Dominican | 4,272 | 0.1% |
| Dutch | 123,131 | 1.6% |
| Dutch West Indian | 90 | 0.0% |
| Eastern European | 21,487 | 0.3% |
| Ecuadorian | 3,489 | 0.1% |
| Egyptian | 4,881 | 0.1% |
| English | 868,037 | 11.3% |
| Estonian | 1,583 | 0.0% |
| Ethiopian | 25,575 | 0.3% |
| European | 254,988 | 3.3% |
| Fijian | 4,916 | 0.1% |
| Filipino | 14,505 | 0.2% |
| Finnish | 47,192 | 0.6% |
| French | 197,049 | 2.6% |
| French American Indian | 2,909 | 0.0% |
| French Canadian | 44,181 | 0.6% |
| German | 1,152,811 | 15.0% |
| German Russian | 733 | 0.0% |
| Ghanaian | 1,430 | 0.0% |
| Greek | 24,978 | 0.3% |
| Guamanian / Chamorro | 20,359 | 0.3% |
| Guatemalan | 23,052 | 0.3% |
| Guyanese | 741 | 0.0% |
| Haitian | 3,007 | 0.0% |
| Hmong | 48 | 0.0% |
| Honduran | 11,072 | 0.1% |
| Hopi | 508 | 0.0% |
| Houma | 58 | 0.0% |
| Hungarian | 20,483 | 0.3% |
| Icelander | 5,727 | 0.1% |
| Indian (Asian) | 203,902 | 2.6% |
| Indonesian | 5,207 | 0.1% |
| Inupiat | 1,927 | 0.0% |
| Iranian | 15,015 | 0.2% |
| Iraqi | 5,191 | 0.1% |
| Irish | 761,455 | 9.9% |
| Iroquois | 2,593 | 0.0% |
| Israeli | 2,211 | 0.0% |
| Italian | 250,568 | 3.3% |
| Jamaican | 7,707 | 0.1% |
| Japanese | 28,118 | 0.4% |
| Jordanian | 2,235 | 0.0% |
| Kenyan | 8,304 | 0.1% |
| Kiowa | 236 | 0.0% |
| Korean | 187,513 | 2.4% |
| Laotian | 5,455 | 0.1% |
| Latvian | 3,346 | 0.0% |
| Lebanese | 8,774 | 0.1% |
| Liberian | 1,386 | 0.0% |
| Lithuanian | 12,543 | 0.2% |
| Lumbee | 233 | 0.0% |
| Luxembourger | 899 | 0.0% |
| Macedonian | 869 | 0.0% |
| Malaysian | 11,855 | 0.2% |
| Maltese | 533 | 0.0% |
| Marshallese | 1,241 | 0.0% |
| Menominee | 219 | 0.0% |
| Mexican | 793,289 | 10.3% |
| Mexican American Indian | 15,097 | 0.2% |
| Mongolian | 1,358 | 0.0% |
| Moroccan | 2,736 | 0.0% |
| Native Hawaiian | 30,431 | 0.4% |
| Navajo | 4,192 | 0.1% |
| Nepalese | 952 | 0.0% |
| New Zealander | 1,414 | 0.0% |
| Nicaraguan | 3,605 | 0.1% |
| Nigerian | 6,514 | 0.1% |
| Northern European | 36,418 | 0.5% |
| Norwegian | 332,142 | 4.3% |
| Okinawan | 727 | 0.0% |
| Osage | 808 | 0.0% |
| Ottawa | 168 | 0.0% |
| Paiute | 496 | 0.0% |
| Pakistani | 14,463 | 0.2% |
| Palestinian | 2,574 | 0.0% |
| Panamanian | 4,874 | 0.1% |
| Paraguayan | 232 | 0.0% |
| Pennsylvania German | 2,520 | 0.0% |
| Peruvian | 8,692 | 0.1% |
| Pima | 81 | 0.0% |
| Polish | 123,253 | 1.6% |
| Portuguese | 27,049 | 0.4% |
| Potawatomi | 1,296 | 0.0% |
| Pueblo | 1,292 | 0.0% |
| Puerto Rican | 41,469 | 0.5% |
| Puget Sound Salish | 19,593 | 0.3% |
| Romanian | 20,051 | 0.3% |
| Russian | 81,632 | 1.1% |
| Salvadoran | 26,976 | 0.4% |
| Samoan | 25,010 | 0.3% |
| Scandinavian | 72,440 | 0.9% |
| Scotch-Irish | 78,138 | 1.0% |
| Scottish | 194,784 | 2.5% |
| Seminole | 708 | 0.0% |
| Senegalese | 526 | 0.0% |
| Serbian | 3,344 | 0.0% |
| Shoshone | 617 | 0.0% |
| Sierra Leonean | 176 | 0.0% |
| Sioux | 7,698 | 0.1% |
| Slavic | 3,961 | 0.1% |
| Slovak | 6,531 | 0.1% |
| Slovene | 3,146 | 0.0% |
| Somali | 15,832 | 0.2% |
| South African | 2,192 | 0.0% |
| South American | 38,956 | 0.5% |
| South American Indian | 1,135 | 0.0% |
| Soviet Union | 10 | 0.0% |
| Spaniard | 26,962 | 0.4% |
| Spanish | 19,823 | 0.3% |
| Spanish American | 489 | 0.0% |
| Spanish American Indian | 124 | 0.0% |
| Sri Lankan | 103,901 | 1.3% |
| Subsaharan African | 107,128 | 1.4% |
| Sudanese | 1,739 | 0.0% |
| Swedish | 203,180 | 2.6% |
| Swiss | 30,910 | 0.4% |
| Syrian | 2,363 | 0.0% |
| Taiwanese | 70 | 0.0% |
| Thai | 154,782 | 2.0% |
| Tlingit-Haida | 6,322 | 0.1% |
| Tohono O'Odham | 143 | 0.0% |
| Tongan | 2,373 | 0.0% |
| Trinidadian and Tobagonian | 1,623 | 0.0% |
| Tsimshian | 863 | 0.0% |
| Turkish | 8,589 | 0.1% |
| U.S. Virgin Islander | 116 | 0.0% |
| Ugandan | 1,316 | 0.0% |
| Ukrainian | 64,073 | 0.8% |
| Uruguayan | 582 | 0.0% |
| Ute | 323 | 0.0% |
| Venezuelan | 4,252 | 0.1% |
| Vietnamese | 1,537 | 0.0% |
| Welsh | 65,396 | 0.9% |
| West Indian | 1,977 | 0.0% |
| Yakama | 8,720 | 0.1% |
| Yaqui | 1,197 | 0.0% |
| Yugoslavian | 9,126 | 0.1% |
| Yuman | 92 | 0.0% |
| Yup'ik | 1,091 | 0.0% |
| Zimbabwean | 146 | 0.0% | View All 200 Rows |
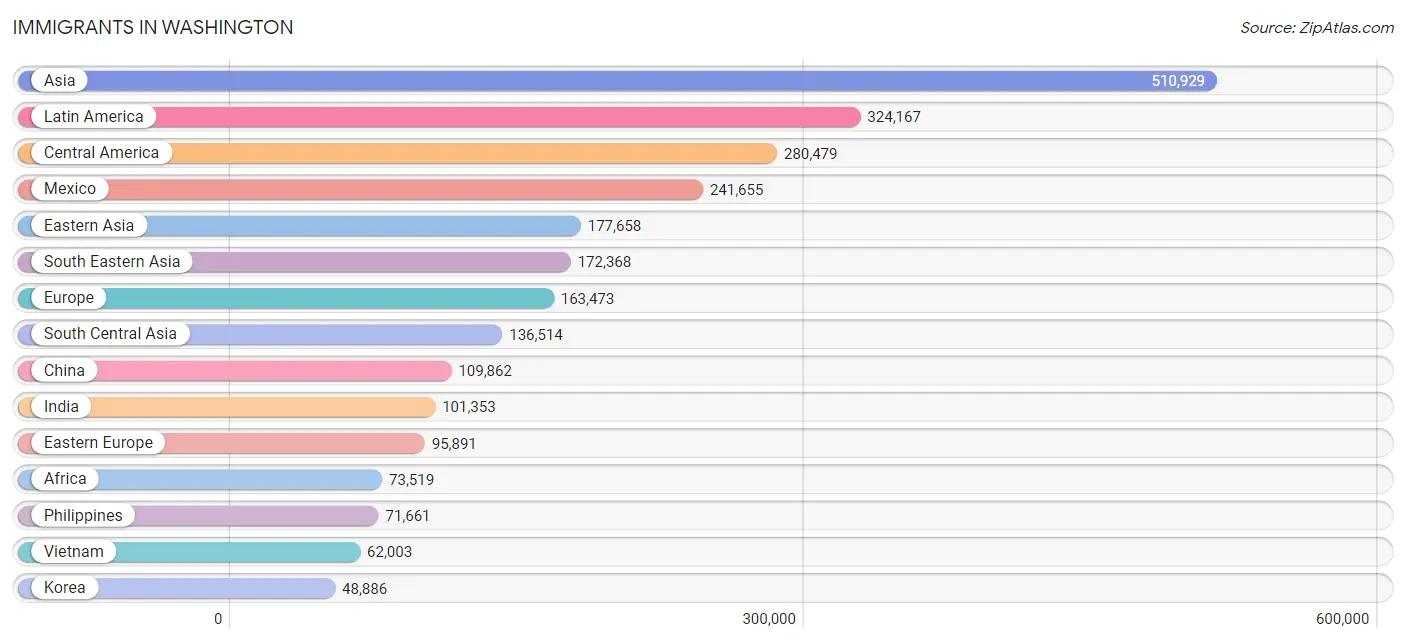
Immigrants in Washington
The most numerous immigrant groups reported in Washington came from Asia (510,929 | 6.7%), Latin America (324,167 | 4.2%), Central America (280,479 | 3.6%), Mexico (241,655 | 3.1%), and Eastern Asia (177,658 | 2.3%), together accounting for 20.0% of all Washington residents.
| Immigration Origin | # Population | % Population |
| Afghanistan | 5,851 | 0.1% |
| Africa | 73,519 | 1.0% |
| Albania | 503 | 0.0% |
| Argentina | 2,284 | 0.0% |
| Armenia | 1,170 | 0.0% |
| Asia | 510,929 | 6.7% |
| Australia | 4,499 | 0.1% |
| Austria | 709 | 0.0% |
| Azores | 65 | 0.0% |
| Bahamas | 164 | 0.0% |
| Bangladesh | 1,536 | 0.0% |
| Barbados | 94 | 0.0% |
| Belarus | 4,177 | 0.1% |
| Belgium | 861 | 0.0% |
| Belize | 502 | 0.0% |
| Bolivia | 720 | 0.0% |
| Bosnia and Herzegovina | 3,825 | 0.1% |
| Brazil | 9,359 | 0.1% |
| Bulgaria | 2,858 | 0.0% |
| Cambodia | 10,993 | 0.1% |
| Cameroon | 301 | 0.0% |
| Canada | 47,238 | 0.6% |
| Caribbean | 12,627 | 0.2% |
| Central America | 280,479 | 3.6% |
| Chile | 2,221 | 0.0% |
| China | 109,862 | 1.4% |
| Colombia | 5,640 | 0.1% |
| Congo | 420 | 0.0% |
| Costa Rica | 1,357 | 0.0% |
| Croatia | 465 | 0.0% |
| Cuba | 3,147 | 0.0% |
| Czechoslovakia | 1,768 | 0.0% |
| Denmark | 1,642 | 0.0% |
| Dominica | 75 | 0.0% |
| Dominican Republic | 1,313 | 0.0% |
| Eastern Africa | 48,153 | 0.6% |
| Eastern Asia | 177,658 | 2.3% |
| Eastern Europe | 95,891 | 1.3% |
| Ecuador | 1,559 | 0.0% |
| Egypt | 3,083 | 0.0% |
| El Salvador | 13,745 | 0.2% |
| England | 9,457 | 0.1% |
| Eritrea | 4,688 | 0.1% |
| Ethiopia | 17,938 | 0.2% |
| Europe | 163,473 | 2.1% |
| Fiji | 2,314 | 0.0% |
| France | 4,951 | 0.1% |
| Germany | 17,761 | 0.2% |
| Ghana | 1,702 | 0.0% |
| Greece | 819 | 0.0% |
| Grenada | 53 | 0.0% |
| Guatemala | 13,855 | 0.2% |
| Guyana | 412 | 0.0% |
| Haiti | 2,421 | 0.0% |
| Honduras | 6,500 | 0.1% |
| Hong Kong | 8,785 | 0.1% |
| Hungary | 1,673 | 0.0% |
| India | 101,353 | 1.3% |
| Indonesia | 3,995 | 0.1% |
| Iran | 10,499 | 0.1% |
| Iraq | 6,259 | 0.1% |
| Ireland | 2,812 | 0.0% |
| Israel | 2,506 | 0.0% |
| Italy | 2,551 | 0.0% |
| Jamaica | 3,471 | 0.1% |
| Japan | 17,453 | 0.2% |
| Jordan | 1,707 | 0.0% |
| Kazakhstan | 2,424 | 0.0% |
| Kenya | 12,735 | 0.2% |
| Korea | 48,886 | 0.6% |
| Kuwait | 587 | 0.0% |
| Laos | 5,926 | 0.1% |
| Latin America | 324,167 | 4.2% |
| Latvia | 895 | 0.0% |
| Lebanon | 2,031 | 0.0% |
| Liberia | 1,150 | 0.0% |
| Lithuania | 781 | 0.0% |
| Malaysia | 2,941 | 0.0% |
| Mexico | 241,655 | 3.1% |
| Micronesia | 4,144 | 0.1% |
| Middle Africa | 2,062 | 0.0% |
| Moldova | 4,536 | 0.1% |
| Morocco | 1,755 | 0.0% |
| Nepal | 2,647 | 0.0% |
| Netherlands | 3,414 | 0.0% |
| Nicaragua | 1,349 | 0.0% |
| Nigeria | 2,660 | 0.0% |
| North Macedonia | 277 | 0.0% |
| Northern Africa | 7,149 | 0.1% |
| Northern Europe | 31,955 | 0.4% |
| Norway | 1,460 | 0.0% |
| Oceania | 23,885 | 0.3% |
| Pakistan | 6,294 | 0.1% |
| Panama | 1,444 | 0.0% |
| Peru | 4,914 | 0.1% |
| Philippines | 71,661 | 0.9% |
| Poland | 4,963 | 0.1% |
| Portugal | 801 | 0.0% |
| Romania | 7,568 | 0.1% |
| Russia | 21,540 | 0.3% |
| Saudi Arabia | 1,970 | 0.0% |
| Scotland | 2,020 | 0.0% |
| Senegal | 462 | 0.0% |
| Serbia | 517 | 0.0% |
| Sierra Leone | 198 | 0.0% |
| Singapore | 1,675 | 0.0% |
| Somalia | 8,540 | 0.1% |
| South Africa | 3,373 | 0.0% |
| South America | 31,061 | 0.4% |
| South Central Asia | 136,514 | 1.8% |
| South Eastern Asia | 172,368 | 2.2% |
| Southern Europe | 6,329 | 0.1% |
| Spain | 2,090 | 0.0% |
| Sri Lanka | 833 | 0.0% |
| St. Vincent and the Grenadines | 23 | 0.0% |
| Sudan | 1,316 | 0.0% |
| Sweden | 2,194 | 0.0% |
| Switzerland | 1,259 | 0.0% |
| Syria | 1,624 | 0.0% |
| Taiwan | 16,607 | 0.2% |
| Thailand | 9,937 | 0.1% |
| Trinidad and Tobago | 1,351 | 0.0% |
| Turkey | 2,970 | 0.0% |
| Uganda | 1,754 | 0.0% |
| Ukraine | 35,872 | 0.5% |
| Uruguay | 396 | 0.0% |
| Uzbekistan | 2,695 | 0.0% |
| Venezuela | 3,180 | 0.0% |
| Vietnam | 62,003 | 0.8% |
| West Indies | 93 | 0.0% |
| Western Africa | 11,136 | 0.1% |
| Western Asia | 23,576 | 0.3% |
| Western Europe | 29,051 | 0.4% |
| Yemen | 456 | 0.0% |
| Zaire | 1,182 | 0.0% |
| Zimbabwe | 412 | 0.0% | View All 136 Rows |
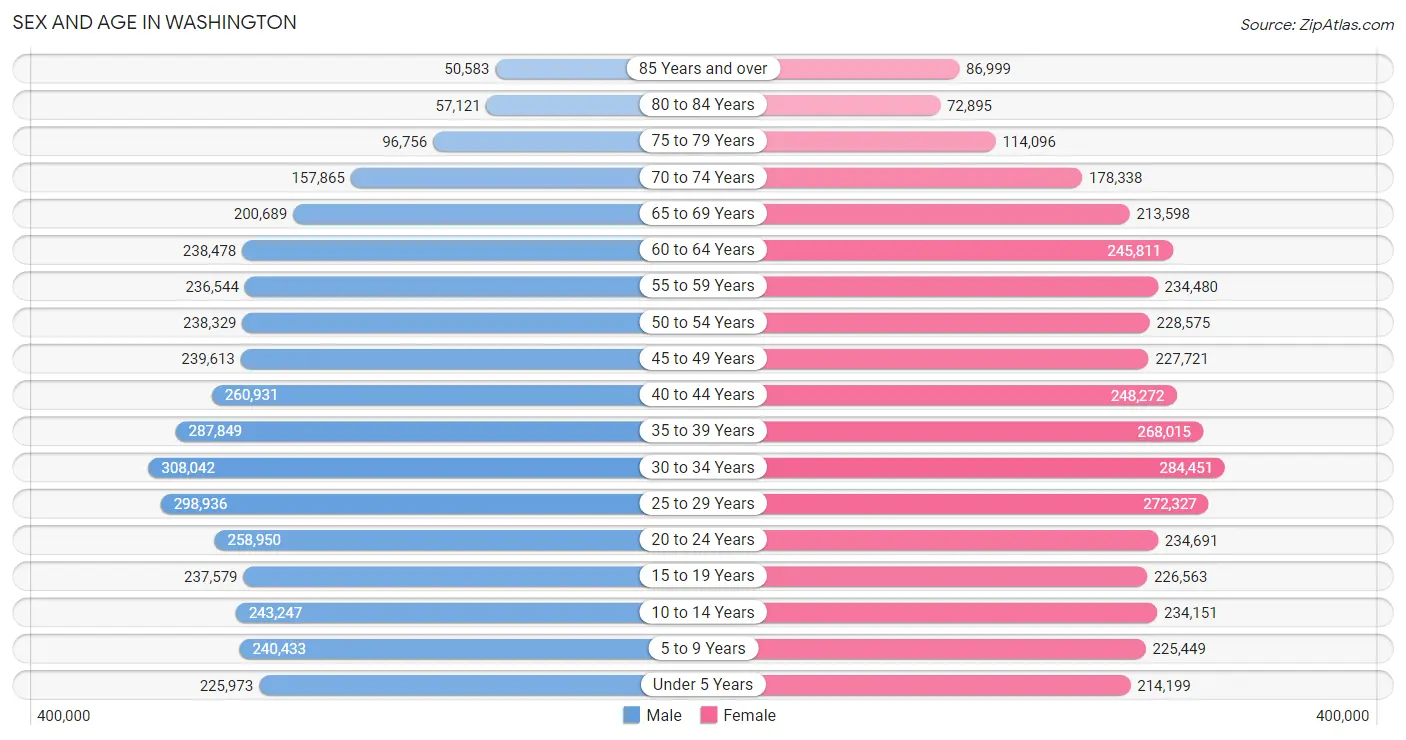
Sex and Age in Washington
Sex and Age in Washington
The most populous age groups in Washington are 30 to 34 Years (308,042 | 7.9%) for men and 30 to 34 Years (284,451 | 7.5%) for women.
| Age Bracket | Male | Female |
| Under 5 Years | 225,973 (5.8%) | 214,199 (5.6%) |
| 5 to 9 Years | 240,433 (6.2%) | 225,449 (5.9%) |
| 10 to 14 Years | 243,247 (6.3%) | 234,151 (6.1%) |
| 15 to 19 Years | 237,579 (6.1%) | 226,563 (5.9%) |
| 20 to 24 Years | 258,950 (6.7%) | 234,691 (6.2%) |
| 25 to 29 Years | 298,936 (7.7%) | 272,327 (7.1%) |
| 30 to 34 Years | 308,042 (7.9%) | 284,451 (7.5%) |
| 35 to 39 Years | 287,849 (7.4%) | 268,015 (7.0%) |
| 40 to 44 Years | 260,931 (6.7%) | 248,272 (6.5%) |
| 45 to 49 Years | 239,613 (6.2%) | 227,721 (6.0%) |
| 50 to 54 Years | 238,329 (6.1%) | 228,575 (6.0%) |
| 55 to 59 Years | 236,544 (6.1%) | 234,480 (6.1%) |
| 60 to 64 Years | 238,478 (6.1%) | 245,811 (6.5%) |
| 65 to 69 Years | 200,689 (5.2%) | 213,598 (5.6%) |
| 70 to 74 Years | 157,865 (4.1%) | 178,338 (4.7%) |
| 75 to 79 Years | 96,756 (2.5%) | 114,096 (3.0%) |
| 80 to 84 Years | 57,121 (1.5%) | 72,895 (1.9%) |
| 85 Years and over | 50,583 (1.3%) | 86,999 (2.3%) |
| Total | 3,877,918 (100.0%) | 3,810,631 (100.0%) |
Families and Households in Washington
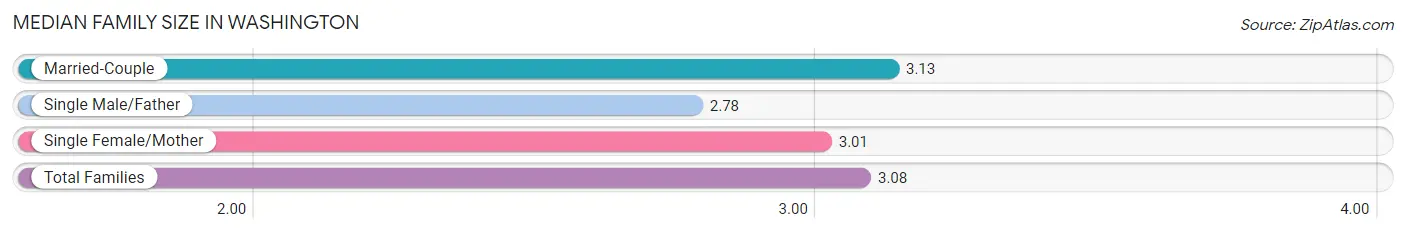
Median Family Size in Washington
The median family size in Washington is 3.08 persons per family, with married-couple families (1,482,230 | 77.6%) accounting for the largest median family size of 3.13 persons per family. On the other hand, single male/father families (141,548 | 7.4%) represent the smallest median family size with 2.78 persons per family.
| Family Type | # Families | Family Size |
| Married-Couple | 1,482,230 (77.6%) | 3.13 |
| Single Male/Father | 141,548 (7.4%) | 2.78 |
| Single Female/Mother | 286,992 (15.0%) | 3.01 |
| Total Families | 1,910,770 (100.0%) | 3.08 |
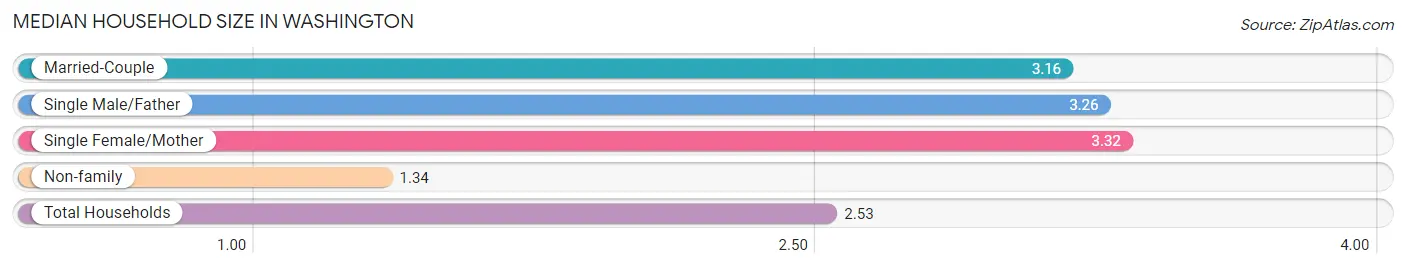
Median Household Size in Washington
The median household size in Washington is 2.53 persons per household, with single female/mother households (286,992 | 9.6%) accounting for the largest median household size of 3.32 persons per household. non-family households (1,068,502 | 35.9%) represent the smallest median household size with 1.34 persons per household.
| Household Type | # Households | Household Size |
| Married-Couple | 1,482,230 (49.7%) | 3.16 |
| Single Male/Father | 141,548 (4.8%) | 3.26 |
| Single Female/Mother | 286,992 (9.6%) | 3.32 |
| Non-family | 1,068,502 (35.9%) | 1.34 |
| Total Households | 2,979,272 (100.0%) | 2.53 |
Household Size by Marriage Status in Washington
Out of a total of 2,979,272 households in Washington, 1,910,770 (64.1%) are family households, while 1,068,502 (35.9%) are nonfamily households. The most numerous type of family households are 2-person households, comprising 835,054, and the most common type of nonfamily households are 1-person households, comprising 803,383.
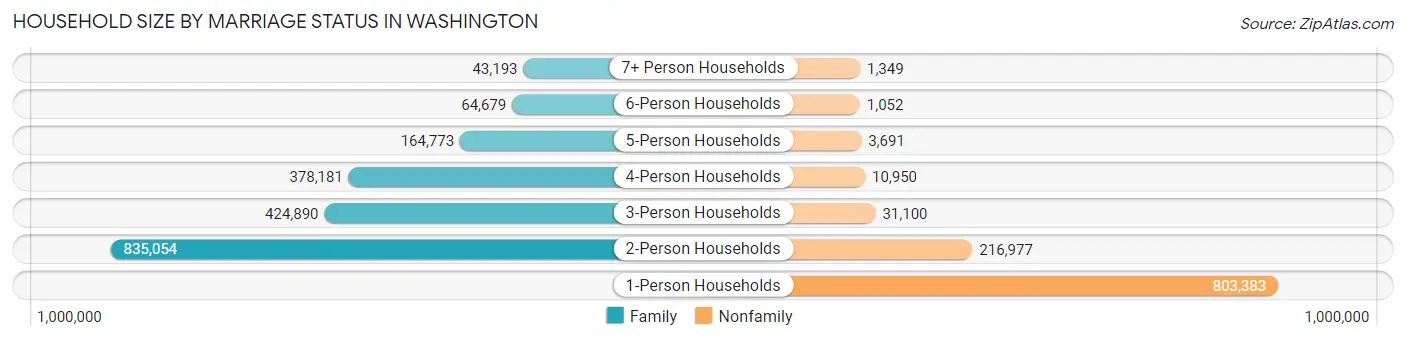
| Household Size | Family Households | Nonfamily Households |
| 1-Person Households | - | 803,383 (27.0%) |
| 2-Person Households | 835,054 (28.0%) | 216,977 (7.3%) |
| 3-Person Households | 424,890 (14.3%) | 31,100 (1.0%) |
| 4-Person Households | 378,181 (12.7%) | 10,950 (0.4%) |
| 5-Person Households | 164,773 (5.5%) | 3,691 (0.1%) |
| 6-Person Households | 64,679 (2.2%) | 1,052 (0.0%) |
| 7+ Person Households | 43,193 (1.5%) | 1,349 (0.1%) |
| Total | 1,910,770 (64.1%) | 1,068,502 (35.9%) |
Female Fertility in Washington
Fertility by Age in Washington
Average fertility rate in Washington is 53.0 births per 1,000 women. Women in the age bracket of 20 to 34 years have the highest fertility rate with 83.0 births per 1,000 women. Women in the age bracket of 20 to 34 years acount for 69.3% of all women with births.
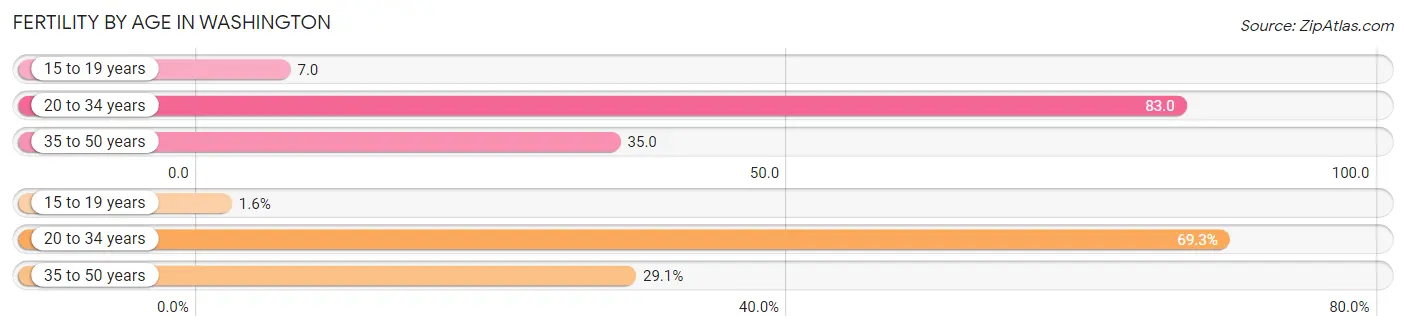
| Age Bracket | Women with Births | Births / 1,000 Women |
| 15 to 19 years | 1,545 (1.6%) | 7.0 |
| 20 to 34 years | 65,946 (69.3%) | 83.0 |
| 35 to 50 years | 27,628 (29.0%) | 35.0 |
| Total | 95,119 (100.0%) | 53.0 |
Fertility by Age by Marriage Status in Washington
75.9% of women with births (95,119) in Washington are married. The highest percentage of unmarried women with births falls into 15 to 19 years age bracket with 82.8% of them unmarried at the time of birth, while the lowest percentage of unmarried women with births belong to 35 to 50 years age bracket with 15.4% of them unmarried.
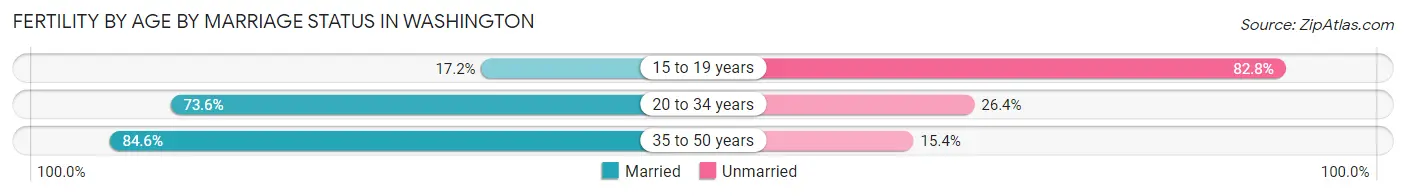
| Age Bracket | Married | Unmarried |
| 15 to 19 years | 266 (17.2%) | 1,279 (82.8%) |
| 20 to 34 years | 48,536 (73.6%) | 17,410 (26.4%) |
| 35 to 50 years | 23,373 (84.6%) | 4,255 (15.4%) |
| Total | 72,195 (75.9%) | 22,924 (24.1%) |
Fertility by Education in Washington
Average fertility rate in Washington is 53.0 births per 1,000 women. Women with the education attainment of high school diploma have the highest fertility rate of 60.0 births per 1,000 women, while women with the education attainment of less than high school have the lowest fertility at 30.0 births per 1,000 women. Women with the education attainment of college or associate's degree represent 32.0% of all women with births.
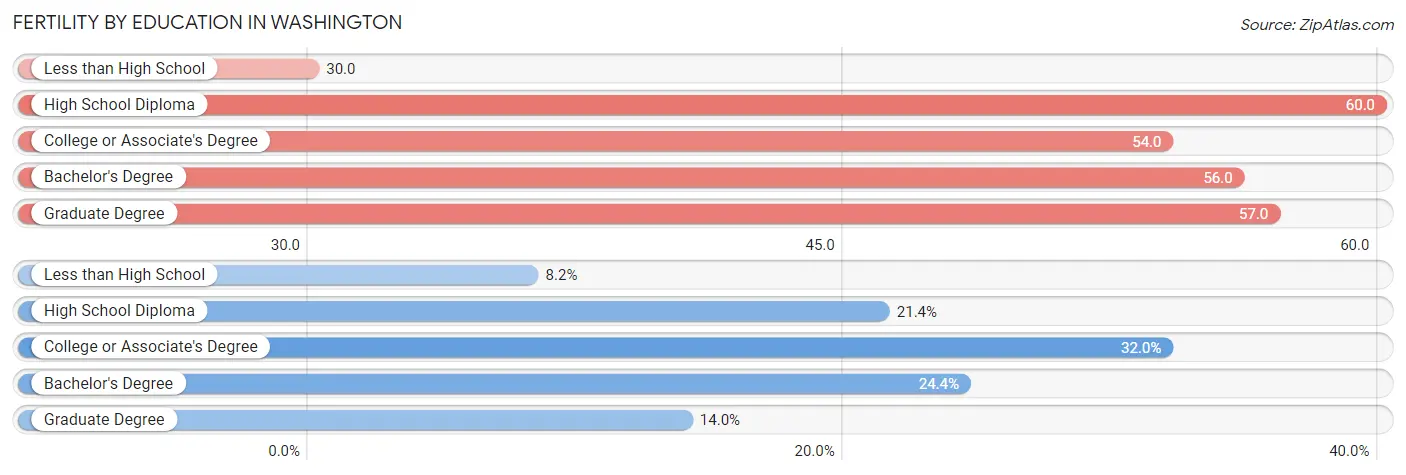
| Educational Attainment | Women with Births | Births / 1,000 Women |
| Less than High School | 7,818 (8.2%) | 30.0 |
| High School Diploma | 20,339 (21.4%) | 60.0 |
| College or Associate's Degree | 30,433 (32.0%) | 54.0 |
| Bachelor's Degree | 23,216 (24.4%) | 56.0 |
| Graduate Degree | 13,313 (14.0%) | 57.0 |
| Total | 95,119 (100.0%) | 53.0 |
Fertility by Education by Marriage Status in Washington
24.1% of women with births in Washington are unmarried. Women with the educational attainment of graduate degree are most likely to be married with 95.5% of them married at childbirth, while women with the educational attainment of high school diploma are least likely to be married with 41.2% of them unmarried at childbirth.
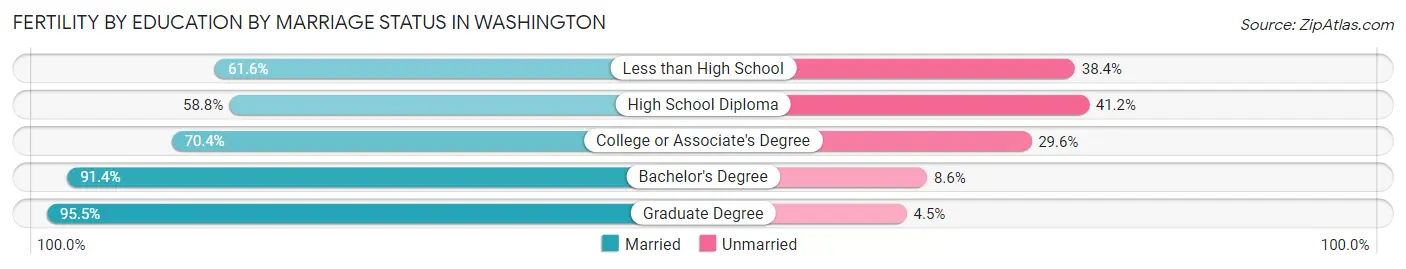
| Educational Attainment | Married | Unmarried |
| Less than High School | 4,816 (61.6%) | 3,002 (38.4%) |
| High School Diploma | 11,959 (58.8%) | 8,380 (41.2%) |
| College or Associate's Degree | 21,425 (70.4%) | 9,008 (29.6%) |
| Bachelor's Degree | 21,219 (91.4%) | 1,997 (8.6%) |
| Graduate Degree | 12,714 (95.5%) | 599 (4.5%) |
| Total | 72,195 (75.9%) | 22,924 (24.1%) |
Employment Characteristics in Washington
Employment by Class of Employer in Washington
Among the 3,722,716 employed individuals in Washington, private company employees (2,423,449 | 65.1%), not-for-profit organizations (309,688 | 8.3%), and local government employees (264,023 | 7.1%) make up the most common classes of employment.
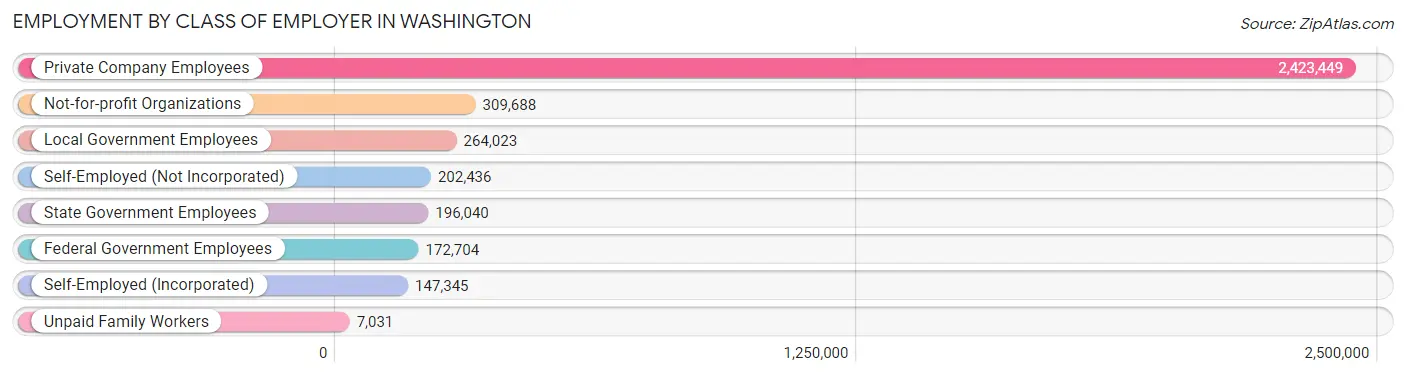
| Employer Class | # Employees | % Employees |
| Private Company Employees | 2,423,449 | 65.1% |
| Self-Employed (Incorporated) | 147,345 | 4.0% |
| Self-Employed (Not Incorporated) | 202,436 | 5.4% |
| Not-for-profit Organizations | 309,688 | 8.3% |
| Local Government Employees | 264,023 | 7.1% |
| State Government Employees | 196,040 | 5.3% |
| Federal Government Employees | 172,704 | 4.6% |
| Unpaid Family Workers | 7,031 | 0.2% |
| Total | 3,722,716 | 100.0% |
Employment Status by Age in Washington
According to the labor force statistics for Washington, out of the total population over 16 years of age (6,209,213), 64.6% or 4,011,152 individuals are in the labor force, with 5.0% or 200,558 of them unemployed. The age group with the highest labor force participation rate is 25 to 29 years, with 84.5% or 482,717 individuals in the labor force. Within the labor force, the 16 to 19 years age range has the highest percentage of unemployed individuals, with 16.6% or 24,391 of them being unemployed.
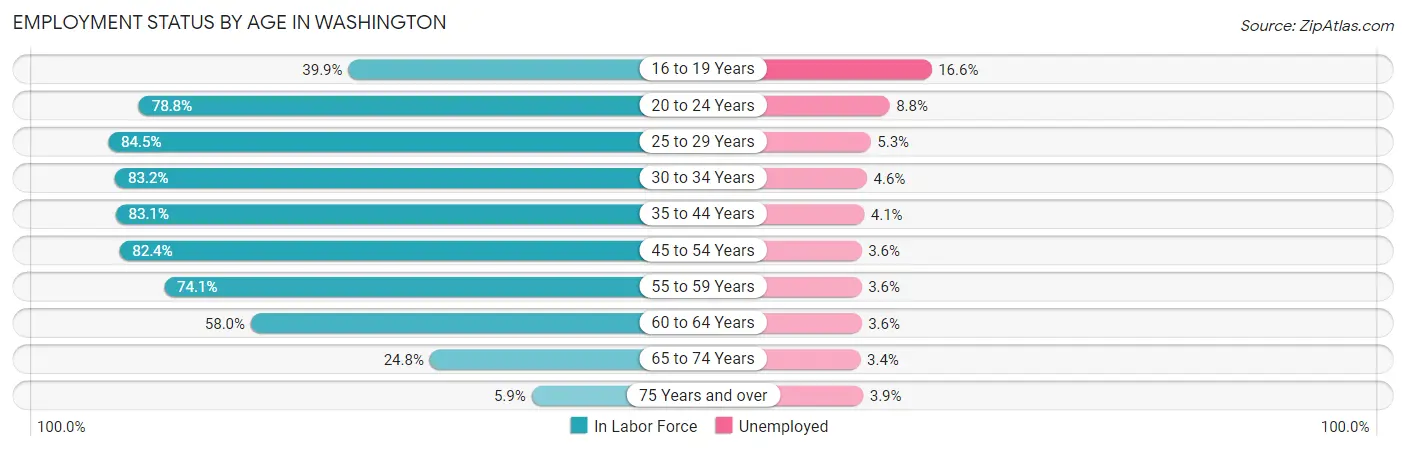
| Age Bracket | In Labor Force | Unemployed |
| 16 to 19 Years | 146,935 (39.9%) | 24,391 (16.6%) |
| 20 to 24 Years | 388,989 (78.8%) | 34,231 (8.8%) |
| 25 to 29 Years | 482,717 (84.5%) | 25,584 (5.3%) |
| 30 to 34 Years | 492,954 (83.2%) | 22,676 (4.6%) |
| 35 to 44 Years | 885,071 (83.1%) | 36,288 (4.1%) |
| 45 to 54 Years | 769,812 (82.4%) | 27,713 (3.6%) |
| 55 to 59 Years | 349,029 (74.1%) | 12,565 (3.6%) |
| 60 to 64 Years | 280,888 (58.0%) | 10,112 (3.6%) |
| 65 to 74 Years | 186,122 (24.8%) | 6,328 (3.4%) |
| 75 Years and over | 28,229 (5.9%) | 1,101 (3.9%) |
| Total | 4,011,152 (64.6%) | 200,558 (5.0%) |
Employment Status by Educational Attainment in Washington
According to labor force statistics for Washington, 79.2% of individuals (3,261,752) out of the total population between 25 and 64 years of age (4,118,374) are in the labor force, with 4.1% or 133,732 of them being unemployed. The group with the highest labor force participation rate are those with the educational attainment of bachelor's degree or higher, with 86.3% or 1,380,535 individuals in the labor force. Within the labor force, individuals with less than high school education have the highest percentage of unemployment, with 7.0% or 15,078 of them being unemployed.
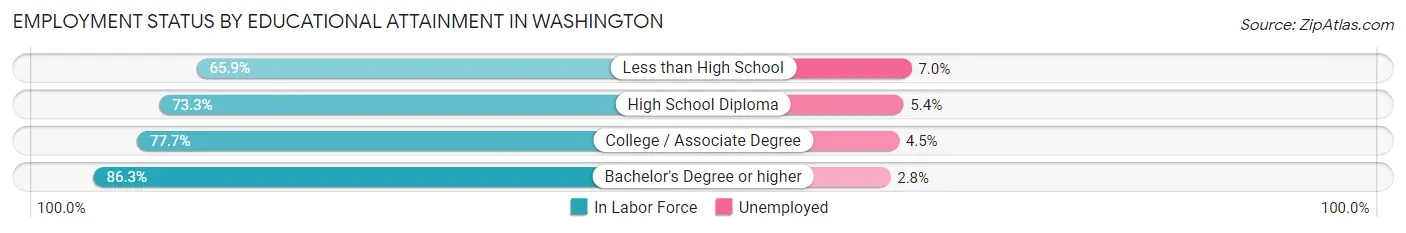
| Educational Attainment | In Labor Force | Unemployed |
| Less than High School | 215,403 (65.9%) | 22,880 (7.0%) |
| High School Diploma | 643,691 (73.3%) | 47,421 (5.4%) |
| College / Associate Degree | 1,020,712 (77.7%) | 59,115 (4.5%) |
| Bachelor's Degree or higher | 1,380,535 (86.3%) | 44,791 (2.8%) |
| Total | 3,261,752 (79.2%) | 168,853 (4.1%) |
Employment Occupations by Sex in Washington
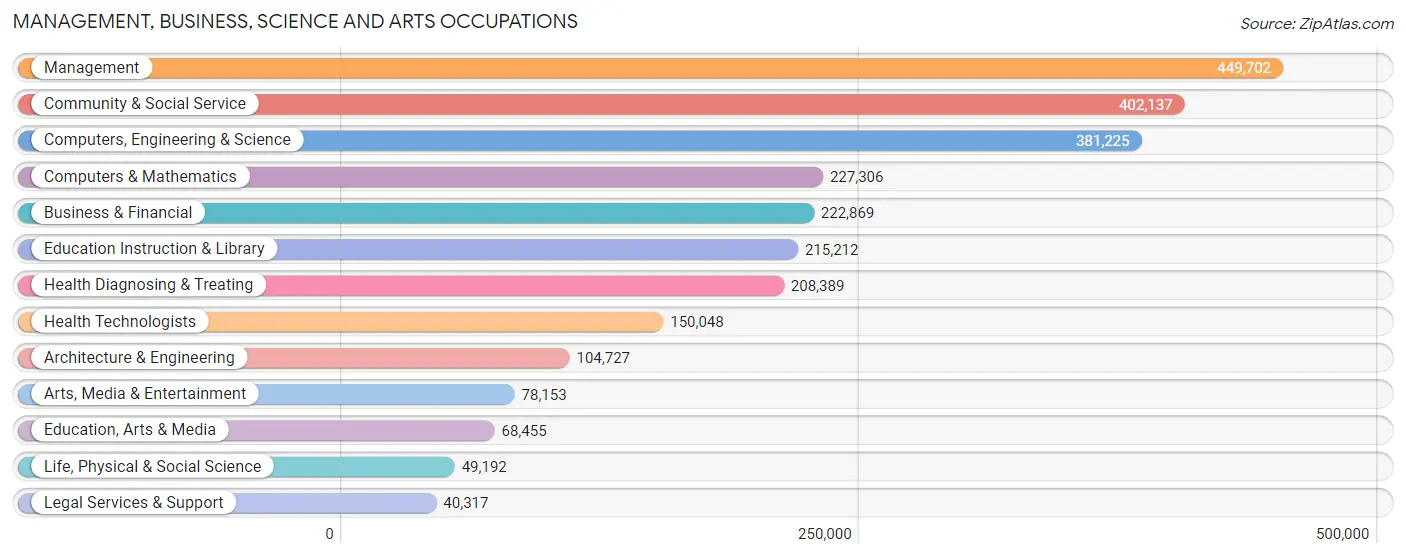
Management, Business, Science and Arts Occupations
The most common Management, Business, Science and Arts occupations in Washington are Management (449,702 | 12.0%), Community & Social Service (402,137 | 10.7%), Computers, Engineering & Science (381,225 | 10.2%), Computers & Mathematics (227,306 | 6.1%), and Business & Financial (222,869 | 5.9%).
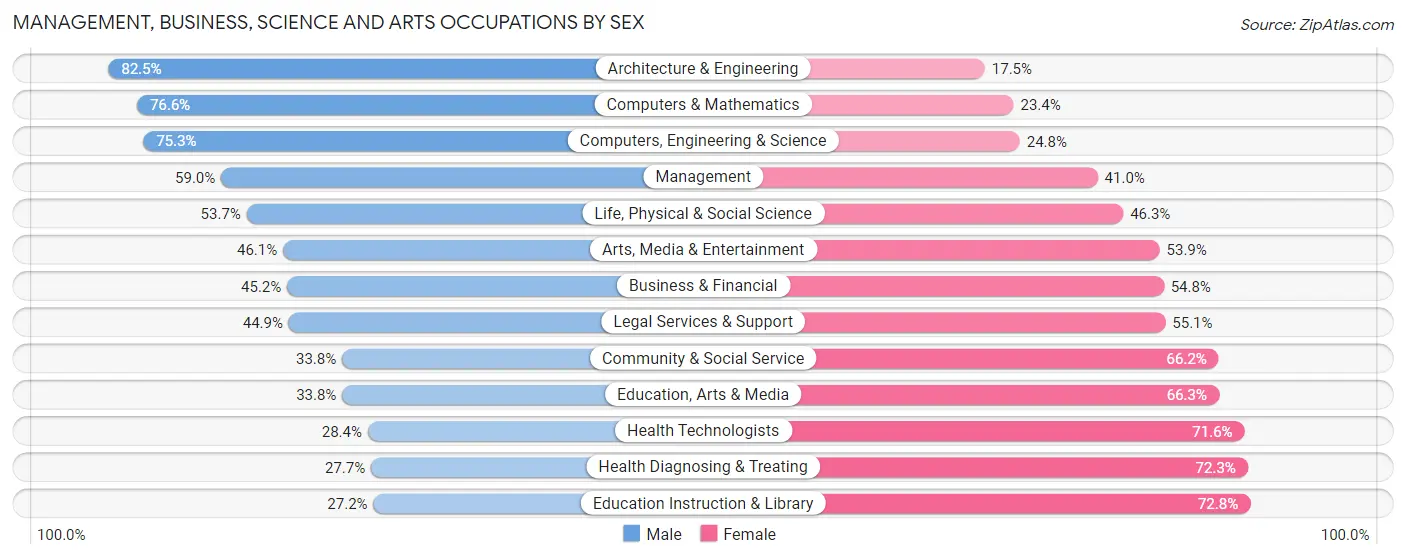
Management, Business, Science and Arts Occupations by Sex
Within the Management, Business, Science and Arts occupations in Washington, the most male-oriented occupations are Architecture & Engineering (82.5%), Computers & Mathematics (76.6%), and Computers, Engineering & Science (75.2%), while the most female-oriented occupations are Education Instruction & Library (72.8%), Health Diagnosing & Treating (72.3%), and Health Technologists (71.6%).
| Occupation | Male | Female |
| Management | 265,363 (59.0%) | 184,339 (41.0%) |
| Business & Financial | 100,818 (45.2%) | 122,051 (54.8%) |
| Computers, Engineering & Science | 286,866 (75.2%) | 94,359 (24.7%) |
| Computers & Mathematics | 174,021 (76.6%) | 53,285 (23.4%) |
| Architecture & Engineering | 86,439 (82.5%) | 18,288 (17.5%) |
| Life, Physical & Social Science | 26,406 (53.7%) | 22,786 (46.3%) |
| Community & Social Service | 135,849 (33.8%) | 266,288 (66.2%) |
| Education, Arts & Media | 23,106 (33.8%) | 45,349 (66.2%) |
| Legal Services & Support | 18,097 (44.9%) | 22,220 (55.1%) |
| Education Instruction & Library | 58,624 (27.2%) | 156,588 (72.8%) |
| Arts, Media & Entertainment | 36,022 (46.1%) | 42,131 (53.9%) |
| Health Diagnosing & Treating | 57,791 (27.7%) | 150,598 (72.3%) |
| Health Technologists | 42,628 (28.4%) | 107,420 (71.6%) |
| Total (Category) | 846,687 (50.9%) | 817,635 (49.1%) |
| Total (Overall) | 2,027,819 (54.0%) | 1,724,257 (46.0%) |
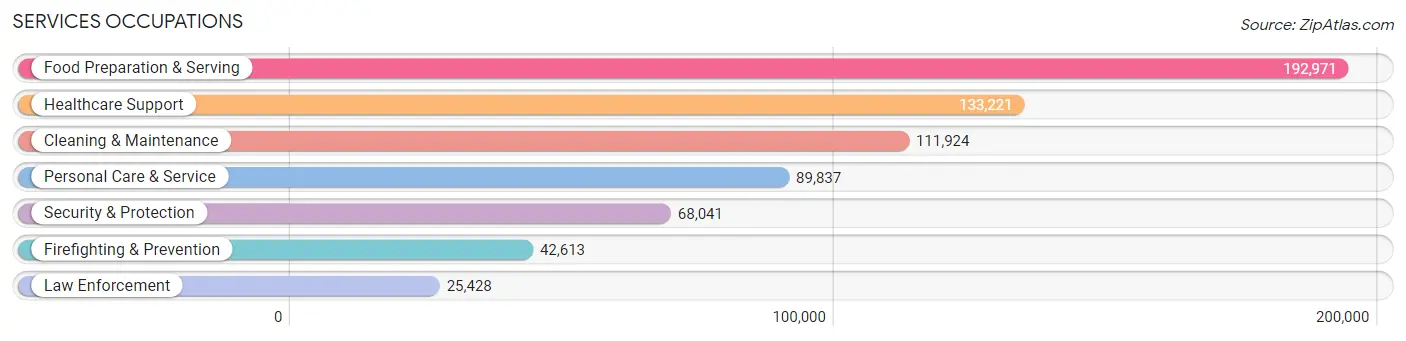
Services Occupations
The most common Services occupations in Washington are Food Preparation & Serving (192,971 | 5.1%), Healthcare Support (133,221 | 3.5%), Cleaning & Maintenance (111,924 | 3.0%), Personal Care & Service (89,837 | 2.4%), and Security & Protection (68,041 | 1.8%).
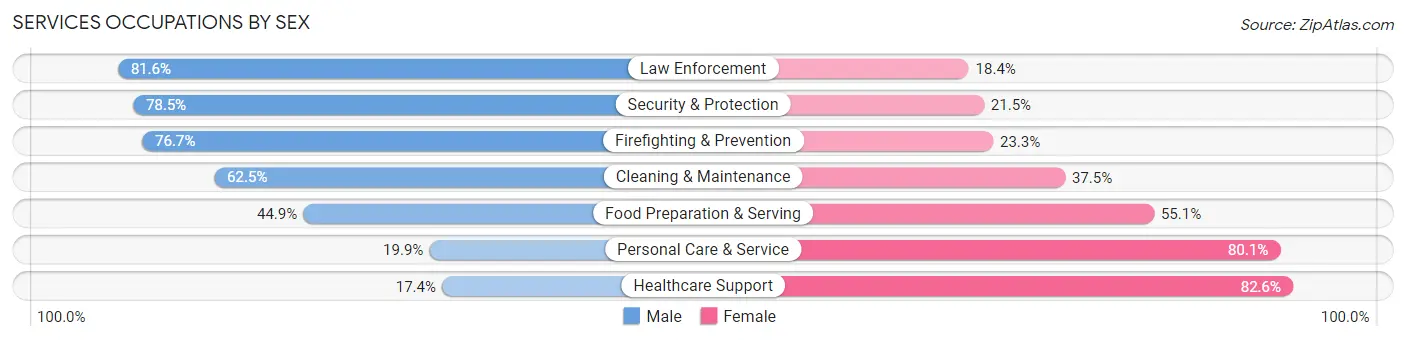
Services Occupations by Sex
Within the Services occupations in Washington, the most male-oriented occupations are Law Enforcement (81.6%), Security & Protection (78.5%), and Firefighting & Prevention (76.7%), while the most female-oriented occupations are Healthcare Support (82.6%), Personal Care & Service (80.1%), and Food Preparation & Serving (55.1%).
| Occupation | Male | Female |
| Healthcare Support | 23,171 (17.4%) | 110,050 (82.6%) |
| Security & Protection | 53,441 (78.5%) | 14,600 (21.5%) |
| Firefighting & Prevention | 32,702 (76.7%) | 9,911 (23.3%) |
| Law Enforcement | 20,739 (81.6%) | 4,689 (18.4%) |
| Food Preparation & Serving | 86,575 (44.9%) | 106,396 (55.1%) |
| Cleaning & Maintenance | 69,946 (62.5%) | 41,978 (37.5%) |
| Personal Care & Service | 17,870 (19.9%) | 71,967 (80.1%) |
| Total (Category) | 251,003 (42.1%) | 344,991 (57.9%) |
| Total (Overall) | 2,027,819 (54.0%) | 1,724,257 (46.0%) |
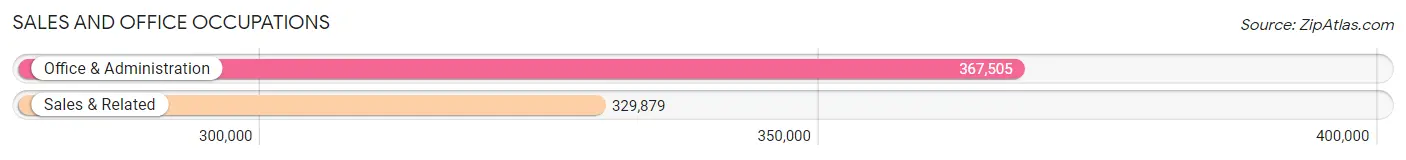
Sales and Office Occupations
The most common Sales and Office occupations in Washington are Office & Administration (367,505 | 9.8%), and Sales & Related (329,879 | 8.8%).
Sales and Office Occupations by Sex
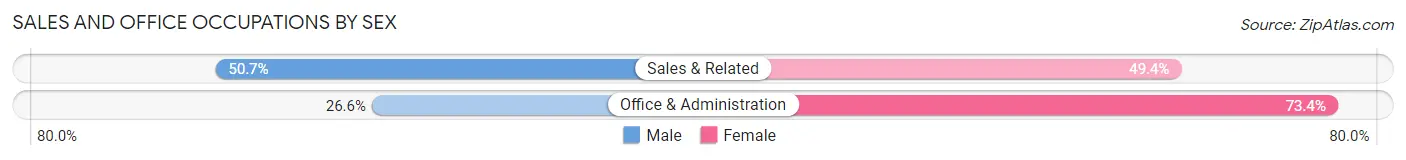
| Occupation | Male | Female |
| Sales & Related | 167,088 (50.6%) | 162,791 (49.3%) |
| Office & Administration | 97,719 (26.6%) | 269,786 (73.4%) |
| Total (Category) | 264,807 (38.0%) | 432,577 (62.0%) |
| Total (Overall) | 2,027,819 (54.0%) | 1,724,257 (46.0%) |
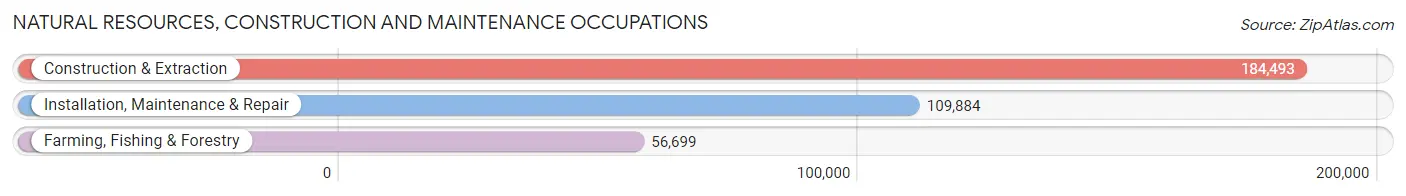
Natural Resources, Construction and Maintenance Occupations
The most common Natural Resources, Construction and Maintenance occupations in Washington are Construction & Extraction (184,493 | 4.9%), Installation, Maintenance & Repair (109,884 | 2.9%), and Farming, Fishing & Forestry (56,699 | 1.5%).
Natural Resources, Construction and Maintenance Occupations by Sex
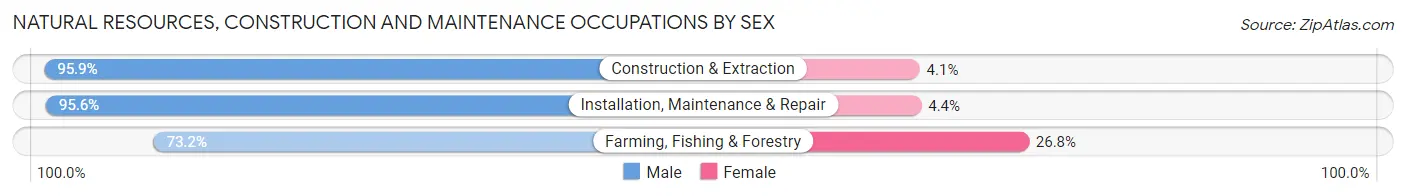
| Occupation | Male | Female |
| Farming, Fishing & Forestry | 41,489 (73.2%) | 15,210 (26.8%) |
| Construction & Extraction | 176,915 (95.9%) | 7,578 (4.1%) |
| Installation, Maintenance & Repair | 105,005 (95.6%) | 4,879 (4.4%) |
| Total (Category) | 323,409 (92.1%) | 27,667 (7.9%) |
| Total (Overall) | 2,027,819 (54.0%) | 1,724,257 (46.0%) |
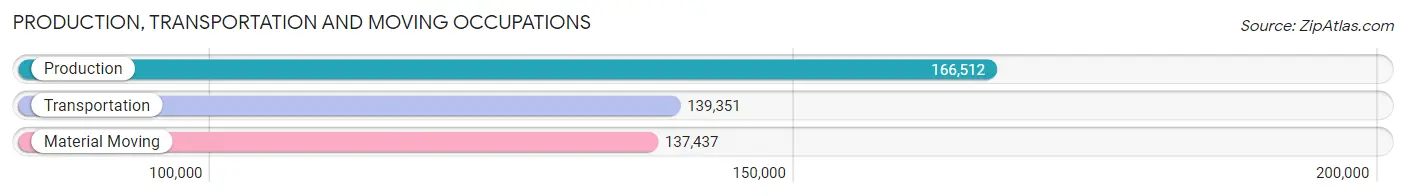
Production, Transportation and Moving Occupations
The most common Production, Transportation and Moving occupations in Washington are Production (166,512 | 4.4%), Transportation (139,351 | 3.7%), and Material Moving (137,437 | 3.7%).
Production, Transportation and Moving Occupations by Sex
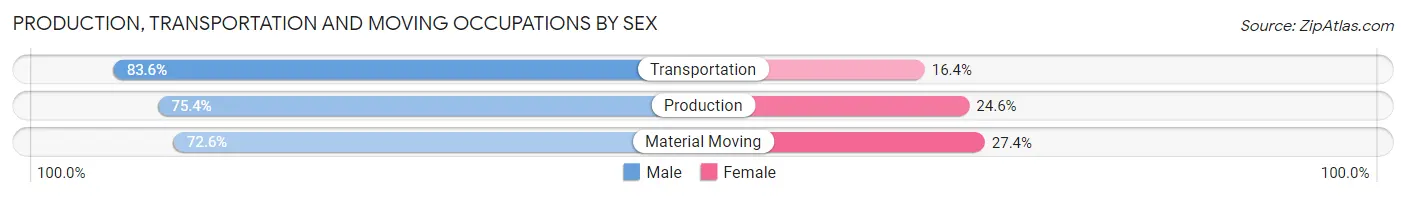
| Occupation | Male | Female |
| Production | 125,619 (75.4%) | 40,893 (24.6%) |
| Transportation | 116,519 (83.6%) | 22,832 (16.4%) |
| Material Moving | 99,775 (72.6%) | 37,662 (27.4%) |
| Total (Category) | 341,913 (77.1%) | 101,387 (22.9%) |
| Total (Overall) | 2,027,819 (54.0%) | 1,724,257 (46.0%) |
Employment Industries by Sex in Washington
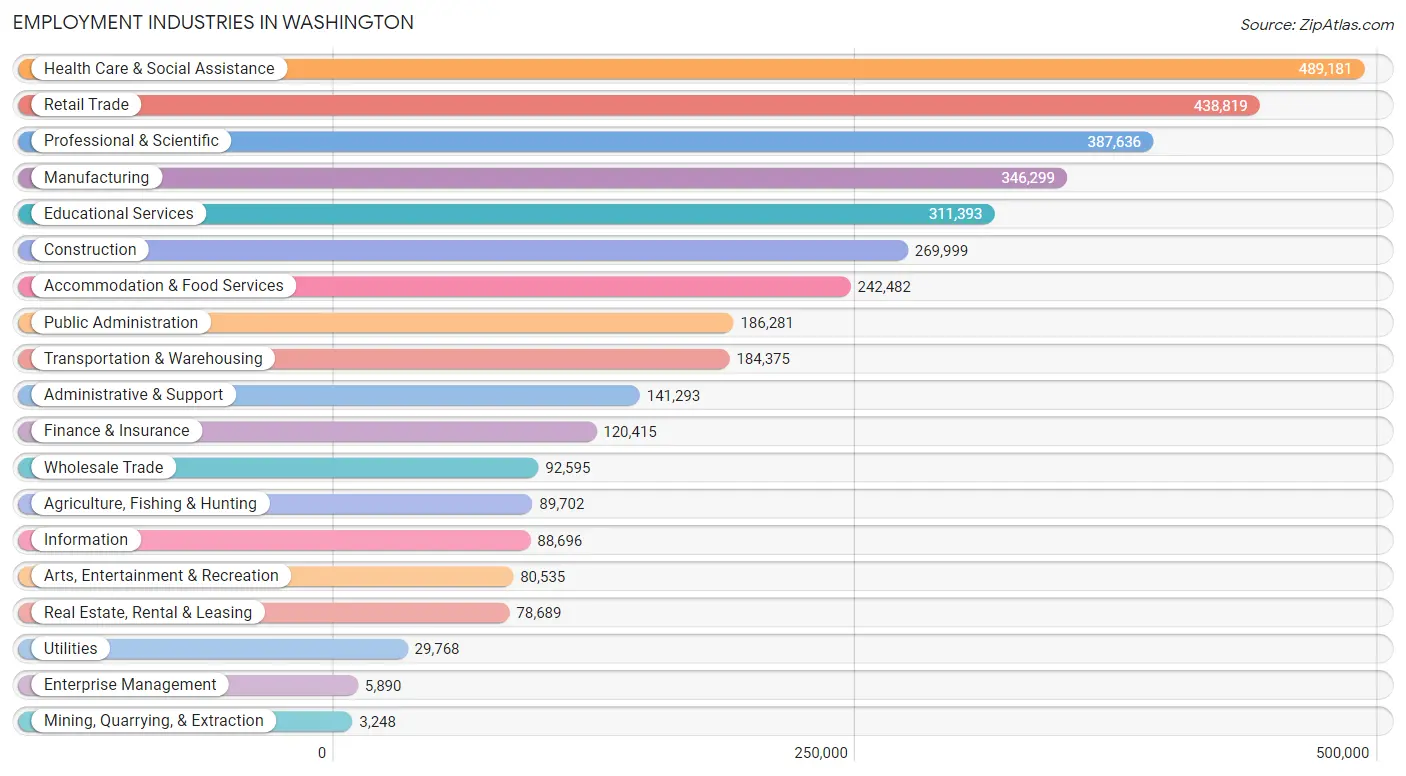
Employment Industries in Washington
The major employment industries in Washington include Health Care & Social Assistance (489,181 | 13.0%), Retail Trade (438,819 | 11.7%), Professional & Scientific (387,636 | 10.3%), Manufacturing (346,299 | 9.2%), and Educational Services (311,393 | 8.3%).
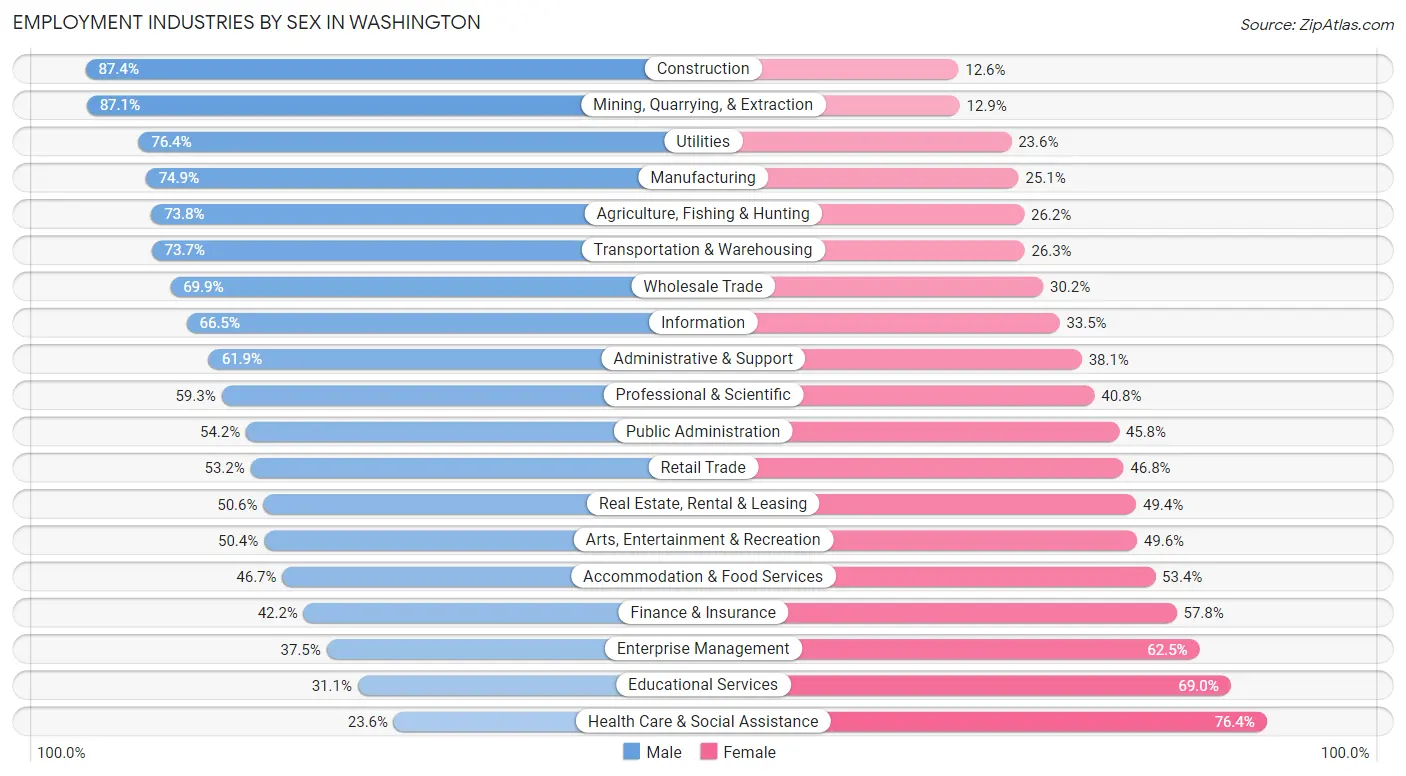
Employment Industries by Sex in Washington
The Washington industries that see more men than women are Construction (87.4%), Mining, Quarrying, & Extraction (87.1%), and Utilities (76.4%), whereas the industries that tend to have a higher number of women are Health Care & Social Assistance (76.4%), Educational Services (69.0%), and Enterprise Management (62.5%).
| Industry | Male | Female |
| Agriculture, Fishing & Hunting | 66,189 (73.8%) | 23,513 (26.2%) |
| Mining, Quarrying, & Extraction | 2,830 (87.1%) | 418 (12.9%) |
| Construction | 235,960 (87.4%) | 34,039 (12.6%) |
| Manufacturing | 259,463 (74.9%) | 86,836 (25.1%) |
| Wholesale Trade | 64,682 (69.9%) | 27,913 (30.1%) |
| Retail Trade | 233,577 (53.2%) | 205,242 (46.8%) |
| Transportation & Warehousing | 135,904 (73.7%) | 48,471 (26.3%) |
| Utilities | 22,756 (76.4%) | 7,012 (23.6%) |
| Information | 58,949 (66.5%) | 29,747 (33.5%) |
| Finance & Insurance | 50,849 (42.2%) | 69,566 (57.8%) |
| Real Estate, Rental & Leasing | 39,817 (50.6%) | 38,872 (49.4%) |
| Professional & Scientific | 229,681 (59.3%) | 157,955 (40.7%) |
| Enterprise Management | 2,208 (37.5%) | 3,682 (62.5%) |
| Administrative & Support | 87,407 (61.9%) | 53,886 (38.1%) |
| Educational Services | 96,685 (31.0%) | 214,708 (69.0%) |
| Health Care & Social Assistance | 115,295 (23.6%) | 373,886 (76.4%) |
| Arts, Entertainment & Recreation | 40,614 (50.4%) | 39,921 (49.6%) |
| Accommodation & Food Services | 113,118 (46.7%) | 129,364 (53.3%) |
| Public Administration | 100,912 (54.2%) | 85,369 (45.8%) |
| Total | 2,027,819 (54.0%) | 1,724,257 (46.0%) |
Education in Washington
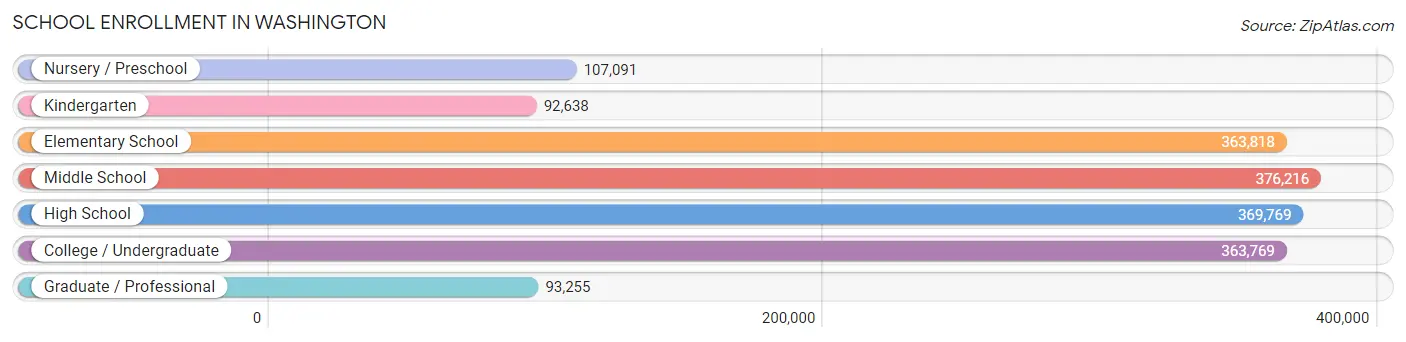
School Enrollment in Washington
The most common levels of schooling among the 1,766,556 students in Washington are middle school (376,216 | 21.3%), high school (369,769 | 20.9%), and elementary school (363,818 | 20.6%).
| School Level | # Students | % Students |
| Nursery / Preschool | 107,091 | 6.1% |
| Kindergarten | 92,638 | 5.2% |
| Elementary School | 363,818 | 20.6% |
| Middle School | 376,216 | 21.3% |
| High School | 369,769 | 20.9% |
| College / Undergraduate | 363,769 | 20.6% |
| Graduate / Professional | 93,255 | 5.3% |
| Total | 1,766,556 | 100.0% |
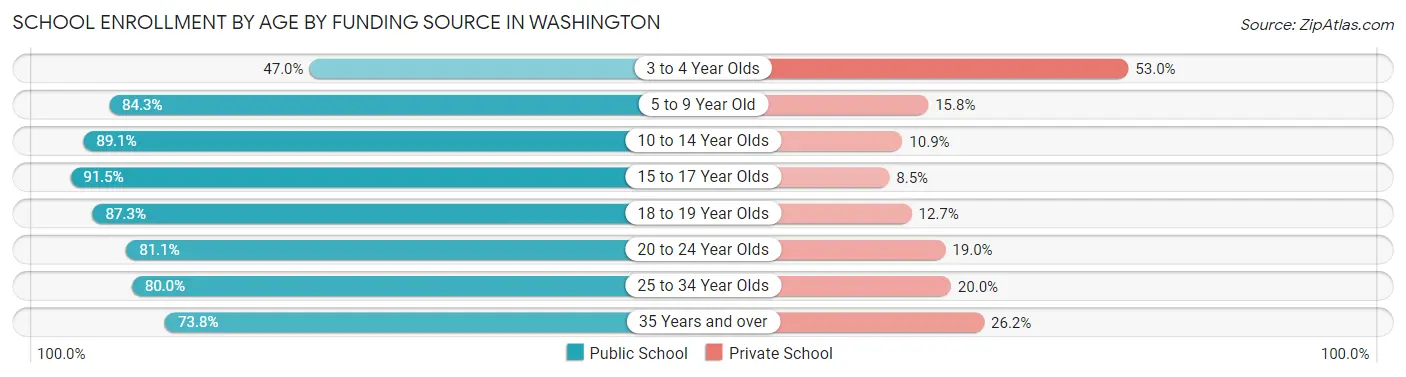
School Enrollment by Age by Funding Source in Washington
Out of a total of 1,766,556 students who are enrolled in schools in Washington, 282,649 (16.0%) attend a private institution, while the remaining 1,483,907 (84.0%) are enrolled in public schools. The age group of 3 to 4 year olds has the highest likelihood of being enrolled in private schools, with 42,419 (53.0% in the age bracket) enrolled. Conversely, the age group of 15 to 17 year olds has the lowest likelihood of being enrolled in a private school, with 247,719 (91.5% in the age bracket) attending a public institution.
| Age Bracket | Public School | Private School |
| 3 to 4 Year Olds | 37,556 (47.0%) | 42,419 (53.0%) |
| 5 to 9 Year Old | 364,991 (84.3%) | 68,230 (15.8%) |
| 10 to 14 Year Olds | 414,944 (89.1%) | 50,955 (10.9%) |
| 15 to 17 Year Olds | 247,719 (91.5%) | 23,054 (8.5%) |
| 18 to 19 Year Olds | 110,923 (87.3%) | 16,077 (12.7%) |
| 20 to 24 Year Olds | 133,945 (81.0%) | 31,314 (19.0%) |
| 25 to 34 Year Olds | 96,799 (80.0%) | 24,158 (20.0%) |
| 35 Years and over | 76,408 (73.8%) | 27,064 (26.2%) |
| Total | 1,483,907 (84.0%) | 282,649 (16.0%) |
Educational Attainment by Field of Study in Washington
Business (346,697 | 15.6%), engineering (218,982 | 9.8%), social sciences (206,964 | 9.3%), education (196,488 | 8.8%), and science & technology (194,628 | 8.7%) are the most common fields of study among 2,226,841 individuals in Washington who have obtained a bachelor's degree or higher.
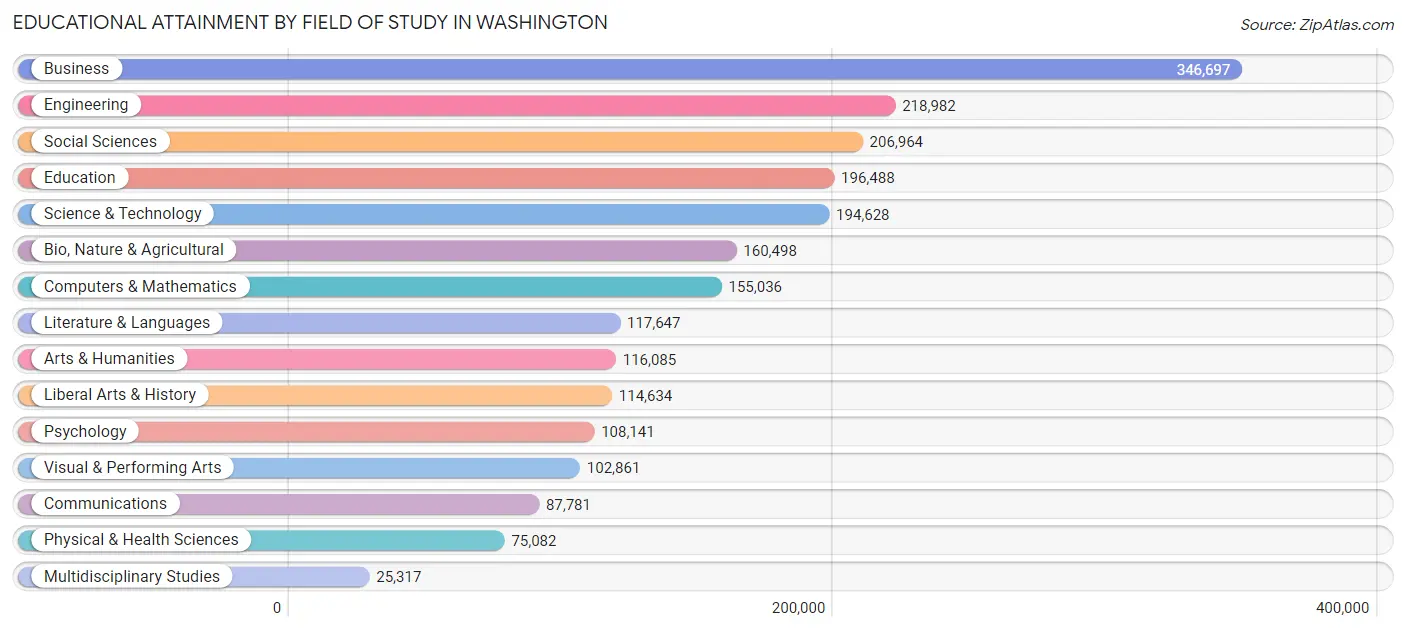
| Field of Study | # Graduates | % Graduates |
| Computers & Mathematics | 155,036 | 7.0% |
| Bio, Nature & Agricultural | 160,498 | 7.2% |
| Physical & Health Sciences | 75,082 | 3.4% |
| Psychology | 108,141 | 4.9% |
| Social Sciences | 206,964 | 9.3% |
| Engineering | 218,982 | 9.8% |
| Multidisciplinary Studies | 25,317 | 1.1% |
| Science & Technology | 194,628 | 8.7% |
| Business | 346,697 | 15.6% |
| Education | 196,488 | 8.8% |
| Literature & Languages | 117,647 | 5.3% |
| Liberal Arts & History | 114,634 | 5.1% |
| Visual & Performing Arts | 102,861 | 4.6% |
| Communications | 87,781 | 3.9% |
| Arts & Humanities | 116,085 | 5.2% |
| Total | 2,226,841 | 100.0% |
Transportation & Commute in Washington
Vehicle Availability by Sex in Washington
The most prevalent vehicle ownership categories in Washington are males with 2 vehicles (781,475, accounting for 38.8%) and females with 2 vehicles (633,573, making up 46.7%).
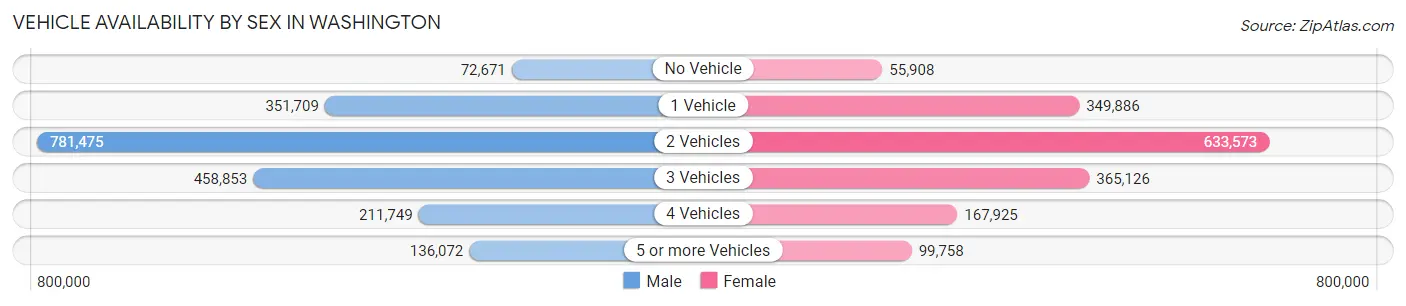
| Vehicles Available | Male | Female |
| No Vehicle | 72,671 (3.6%) | 55,908 (3.3%) |
| 1 Vehicle | 351,709 (17.5%) | 349,886 (20.9%) |
| 2 Vehicles | 781,475 (38.8%) | 633,573 (37.9%) |
| 3 Vehicles | 458,853 (22.8%) | 365,126 (21.8%) |
| 4 Vehicles | 211,749 (10.5%) | 167,925 (10.0%) |
| 5 or more Vehicles | 136,072 (6.8%) | 99,758 (6.0%) |
| Total | 2,012,529 (100.0%) | 1,672,176 (100.0%) |
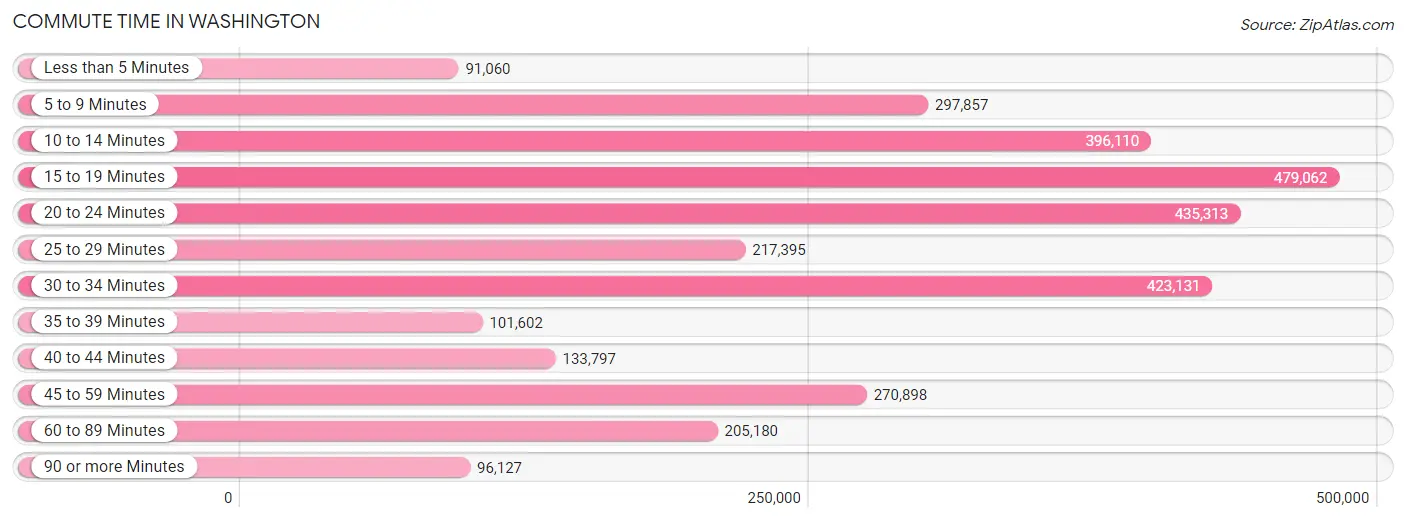
Commute Time in Washington
The most frequently occuring commute durations in Washington are 15 to 19 minutes (479,062 commuters, 15.2%), 20 to 24 minutes (435,313 commuters, 13.8%), and 30 to 34 minutes (423,131 commuters, 13.4%).
| Commute Time | # Commuters | % Commuters |
| Less than 5 Minutes | 91,060 | 2.9% |
| 5 to 9 Minutes | 297,857 | 9.5% |
| 10 to 14 Minutes | 396,110 | 12.6% |
| 15 to 19 Minutes | 479,062 | 15.2% |
| 20 to 24 Minutes | 435,313 | 13.8% |
| 25 to 29 Minutes | 217,395 | 6.9% |
| 30 to 34 Minutes | 423,131 | 13.4% |
| 35 to 39 Minutes | 101,602 | 3.2% |
| 40 to 44 Minutes | 133,797 | 4.3% |
| 45 to 59 Minutes | 270,898 | 8.6% |
| 60 to 89 Minutes | 205,180 | 6.5% |
| 90 or more Minutes | 96,127 | 3.0% |
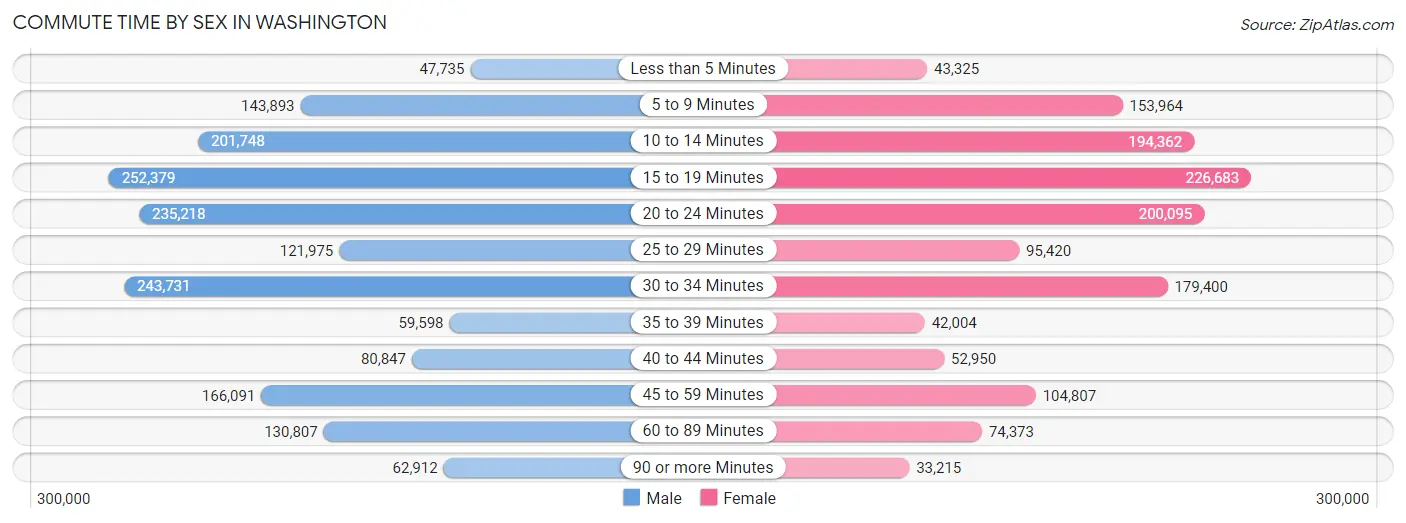
Commute Time by Sex in Washington
The most common commute times in Washington are 15 to 19 minutes (252,379 commuters, 14.4%) for males and 15 to 19 minutes (226,683 commuters, 16.2%) for females.
| Commute Time | Male | Female |
| Less than 5 Minutes | 47,735 (2.7%) | 43,325 (3.1%) |
| 5 to 9 Minutes | 143,893 (8.2%) | 153,964 (11.0%) |
| 10 to 14 Minutes | 201,748 (11.6%) | 194,362 (13.9%) |
| 15 to 19 Minutes | 252,379 (14.4%) | 226,683 (16.2%) |
| 20 to 24 Minutes | 235,218 (13.5%) | 200,095 (14.3%) |
| 25 to 29 Minutes | 121,975 (7.0%) | 95,420 (6.8%) |
| 30 to 34 Minutes | 243,731 (14.0%) | 179,400 (12.8%) |
| 35 to 39 Minutes | 59,598 (3.4%) | 42,004 (3.0%) |
| 40 to 44 Minutes | 80,847 (4.6%) | 52,950 (3.8%) |
| 45 to 59 Minutes | 166,091 (9.5%) | 104,807 (7.5%) |
| 60 to 89 Minutes | 130,807 (7.5%) | 74,373 (5.3%) |
| 90 or more Minutes | 62,912 (3.6%) | 33,215 (2.4%) |
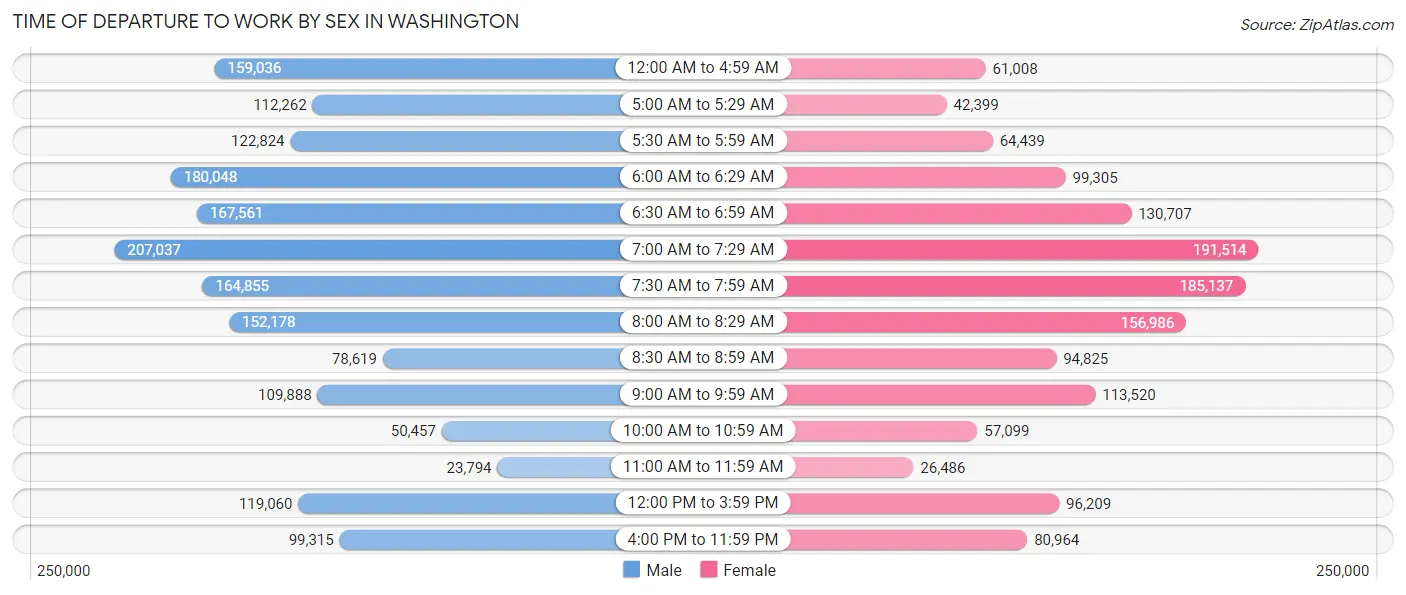
Time of Departure to Work by Sex in Washington
The most frequent times of departure to work in Washington are 7:00 AM to 7:29 AM (207,037, 11.8%) for males and 7:00 AM to 7:29 AM (191,514, 13.7%) for females.
| Time of Departure | Male | Female |
| 12:00 AM to 4:59 AM | 159,036 (9.1%) | 61,008 (4.4%) |
| 5:00 AM to 5:29 AM | 112,262 (6.4%) | 42,399 (3.0%) |
| 5:30 AM to 5:59 AM | 122,824 (7.0%) | 64,439 (4.6%) |
| 6:00 AM to 6:29 AM | 180,048 (10.3%) | 99,305 (7.1%) |
| 6:30 AM to 6:59 AM | 167,561 (9.6%) | 130,707 (9.3%) |
| 7:00 AM to 7:29 AM | 207,037 (11.8%) | 191,514 (13.7%) |
| 7:30 AM to 7:59 AM | 164,855 (9.4%) | 185,137 (13.2%) |
| 8:00 AM to 8:29 AM | 152,178 (8.7%) | 156,986 (11.2%) |
| 8:30 AM to 8:59 AM | 78,619 (4.5%) | 94,825 (6.8%) |
| 9:00 AM to 9:59 AM | 109,888 (6.3%) | 113,520 (8.1%) |
| 10:00 AM to 10:59 AM | 50,457 (2.9%) | 57,099 (4.1%) |
| 11:00 AM to 11:59 AM | 23,794 (1.4%) | 26,486 (1.9%) |
| 12:00 PM to 3:59 PM | 119,060 (6.8%) | 96,209 (6.9%) |
| 4:00 PM to 11:59 PM | 99,315 (5.7%) | 80,964 (5.8%) |
| Total | 1,746,934 (100.0%) | 1,400,598 (100.0%) |
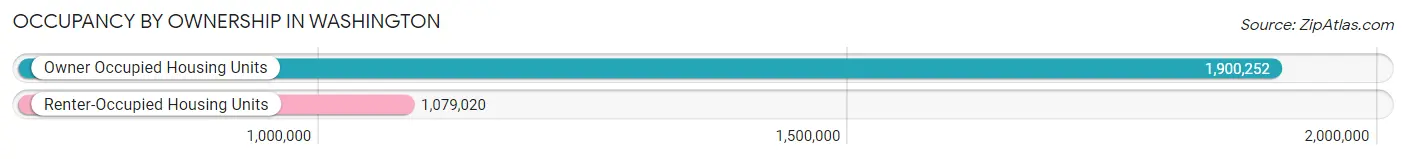
Housing Occupancy in Washington
Occupancy by Ownership in Washington
Of the total 2,979,272 dwellings in Washington, owner-occupied units account for 1,900,252 (63.8%), while renter-occupied units make up 1,079,020 (36.2%).
| Occupancy | # Housing Units | % Housing Units |
| Owner Occupied Housing Units | 1,900,252 | 63.8% |
| Renter-Occupied Housing Units | 1,079,020 | 36.2% |
| Total Occupied Housing Units | 2,979,272 | 100.0% |
Occupancy by Household Size in Washington
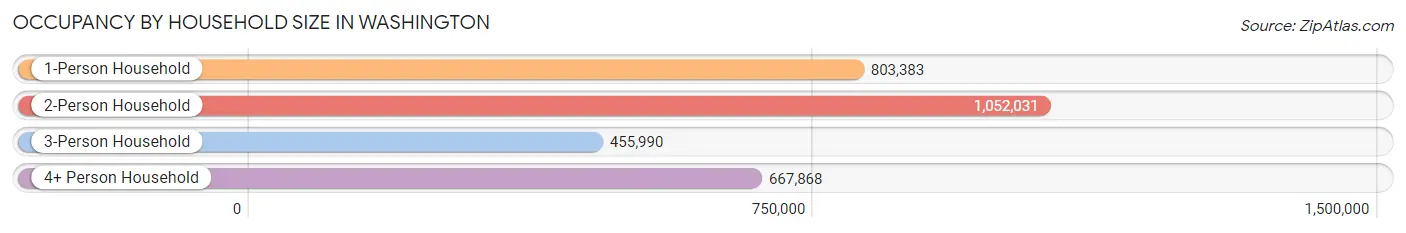
| Household Size | # Housing Units | % Housing Units |
| 1-Person Household | 803,383 | 27.0% |
| 2-Person Household | 1,052,031 | 35.3% |
| 3-Person Household | 455,990 | 15.3% |
| 4+ Person Household | 667,868 | 22.4% |
| Total Housing Units | 2,979,272 | 100.0% |
Occupancy by Ownership by Household Size in Washington
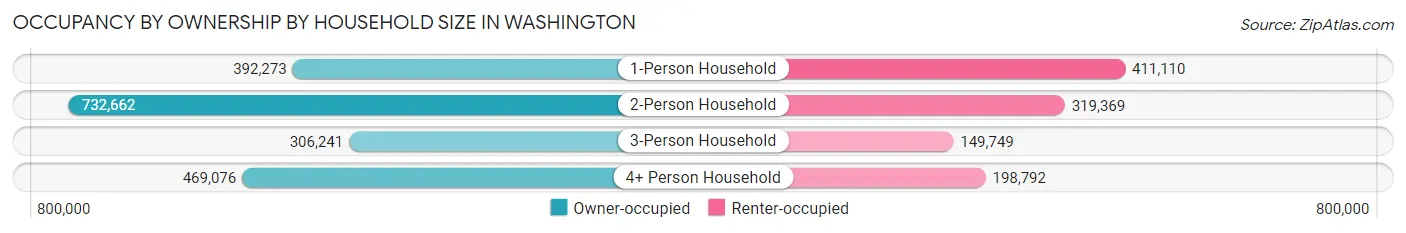
| Household Size | Owner-occupied | Renter-occupied |
| 1-Person Household | 392,273 (48.8%) | 411,110 (51.2%) |
| 2-Person Household | 732,662 (69.6%) | 319,369 (30.4%) |
| 3-Person Household | 306,241 (67.2%) | 149,749 (32.8%) |
| 4+ Person Household | 469,076 (70.2%) | 198,792 (29.8%) |
| Total Housing Units | 1,900,252 (63.8%) | 1,079,020 (36.2%) |
Occupancy by Educational Attainment in Washington
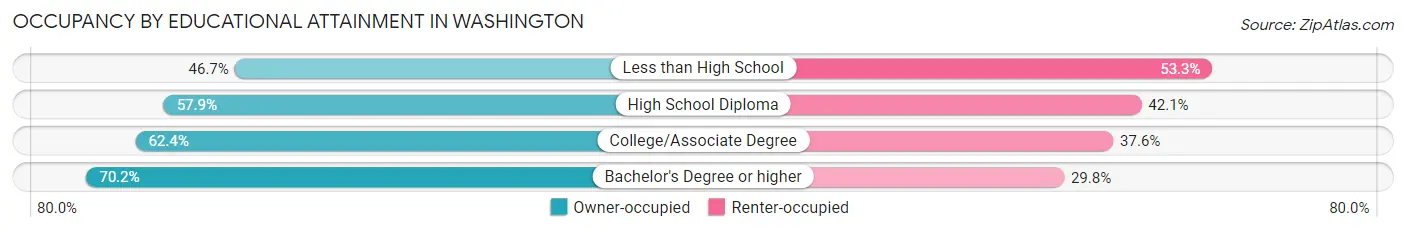
| Household Size | Owner-occupied | Renter-occupied |
| Less than High School | 87,491 (46.7%) | 99,896 (53.3%) |
| High School Diploma | 318,758 (57.9%) | 231,462 (42.1%) |
| College/Associate Degree | 639,345 (62.4%) | 385,065 (37.6%) |
| Bachelor's Degree or higher | 854,658 (70.2%) | 362,597 (29.8%) |
Occupancy by Age of Householder in Washington
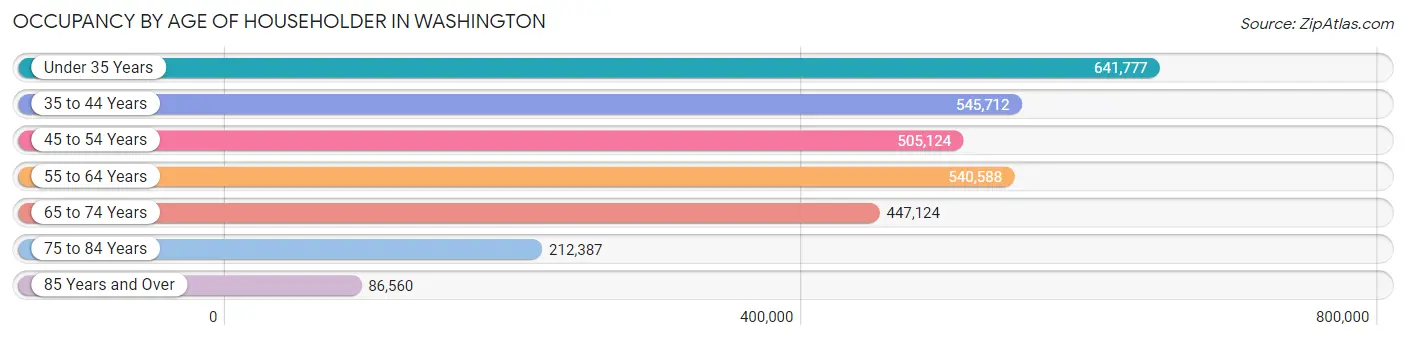
| Age Bracket | # Households | % Households |
| Under 35 Years | 641,777 | 21.5% |
| 35 to 44 Years | 545,712 | 18.3% |
| 45 to 54 Years | 505,124 | 17.0% |
| 55 to 64 Years | 540,588 | 18.1% |
| 65 to 74 Years | 447,124 | 15.0% |
| 75 to 84 Years | 212,387 | 7.1% |
| 85 Years and Over | 86,560 | 2.9% |
| Total | 2,979,272 | 100.0% |
Housing Finances in Washington
Median Income by Occupancy in Washington
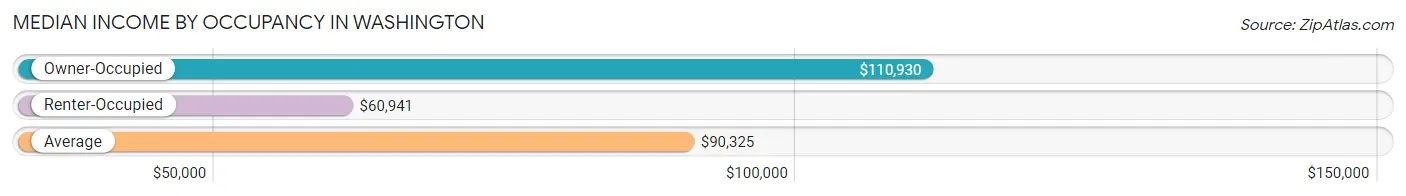
| Occupancy Type | # Households | Median Income |
| Owner-Occupied | 1,900,252 (63.8%) | $110,930 |
| Renter-Occupied | 1,079,020 (36.2%) | $60,941 |
| Average | 2,979,272 (100.0%) | $90,325 |
Occupancy by Householder Income Bracket in Washington
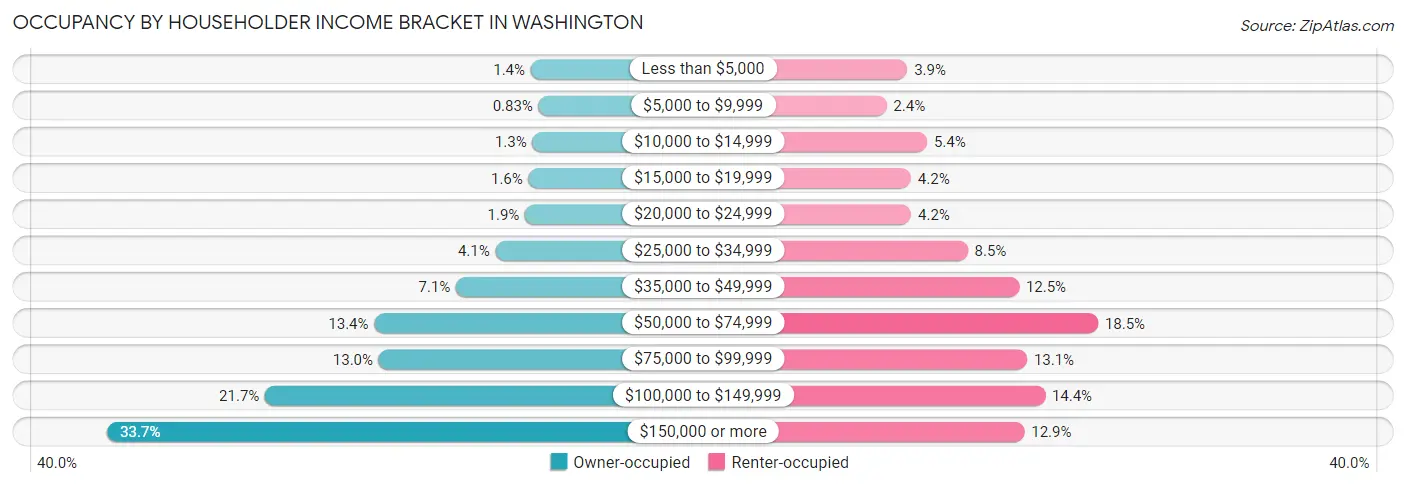
| Income Bracket | Owner-occupied | Renter-occupied |
| Less than $5,000 | 27,126 (1.4%) | 42,474 (3.9%) |
| $5,000 to $9,999 | 15,680 (0.8%) | 25,308 (2.4%) |
| $10,000 to $14,999 | 24,618 (1.3%) | 58,701 (5.4%) |
| $15,000 to $19,999 | 30,397 (1.6%) | 45,558 (4.2%) |
| $20,000 to $24,999 | 35,293 (1.9%) | 45,677 (4.2%) |
| $25,000 to $34,999 | 78,332 (4.1%) | 92,166 (8.5%) |
| $35,000 to $49,999 | 135,313 (7.1%) | 134,379 (12.4%) |
| $50,000 to $74,999 | 253,612 (13.4%) | 199,304 (18.5%) |
| $75,000 to $99,999 | 247,256 (13.0%) | 140,941 (13.1%) |
| $100,000 to $149,999 | 411,786 (21.7%) | 155,723 (14.4%) |
| $150,000 or more | 640,839 (33.7%) | 138,789 (12.9%) |
| Total | 1,900,252 (100.0%) | 1,079,020 (100.0%) |
Monthly Housing Cost Tiers in Washington
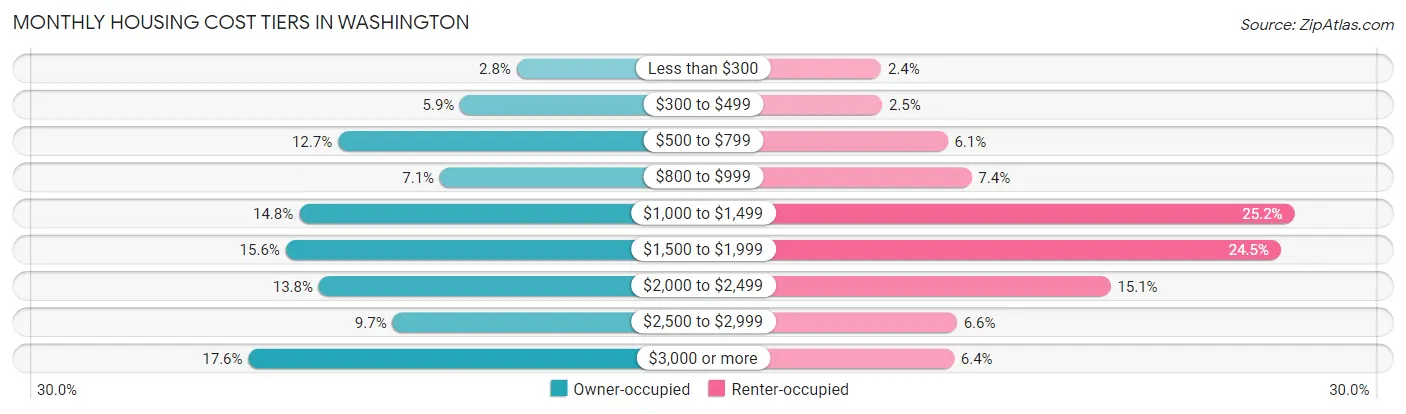
| Monthly Cost | Owner-occupied | Renter-occupied |
| Less than $300 | 53,591 (2.8%) | 26,007 (2.4%) |
| $300 to $499 | 112,865 (5.9%) | 26,567 (2.5%) |
| $500 to $799 | 241,207 (12.7%) | 65,589 (6.1%) |
| $800 to $999 | 134,111 (7.1%) | 79,862 (7.4%) |
| $1,000 to $1,499 | 281,964 (14.8%) | 272,391 (25.2%) |
| $1,500 to $1,999 | 296,017 (15.6%) | 264,300 (24.5%) |
| $2,000 to $2,499 | 261,286 (13.8%) | 162,728 (15.1%) |
| $2,500 to $2,999 | 183,919 (9.7%) | 71,068 (6.6%) |
| $3,000 or more | 335,292 (17.6%) | 69,377 (6.4%) |
| Total | 1,900,252 (100.0%) | 1,079,020 (100.0%) |
Physical Housing Characteristics in Washington
Housing Structures in Washington
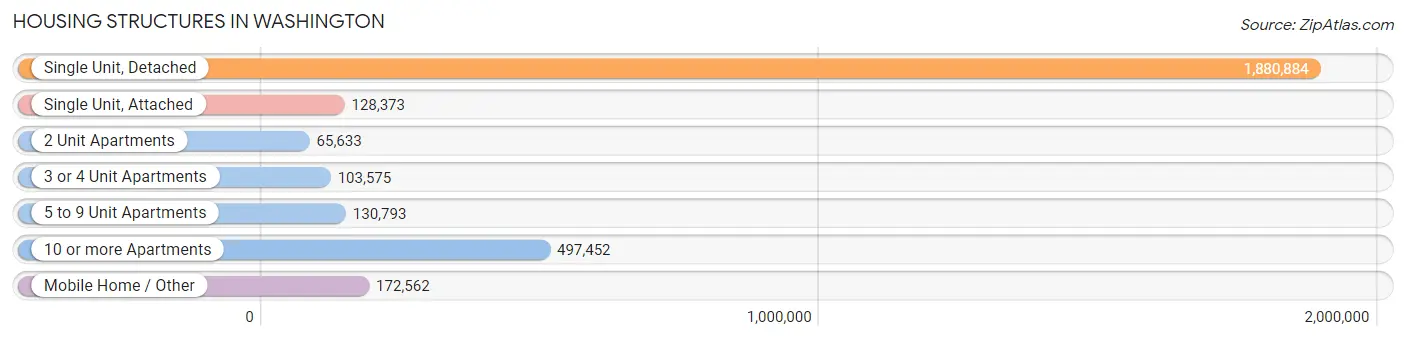
| Structure Type | # Housing Units | % Housing Units |
| Single Unit, Detached | 1,880,884 | 63.1% |
| Single Unit, Attached | 128,373 | 4.3% |
| 2 Unit Apartments | 65,633 | 2.2% |
| 3 or 4 Unit Apartments | 103,575 | 3.5% |
| 5 to 9 Unit Apartments | 130,793 | 4.4% |
| 10 or more Apartments | 497,452 | 16.7% |
| Mobile Home / Other | 172,562 | 5.8% |
| Total | 2,979,272 | 100.0% |
Housing Structures by Occupancy in Washington
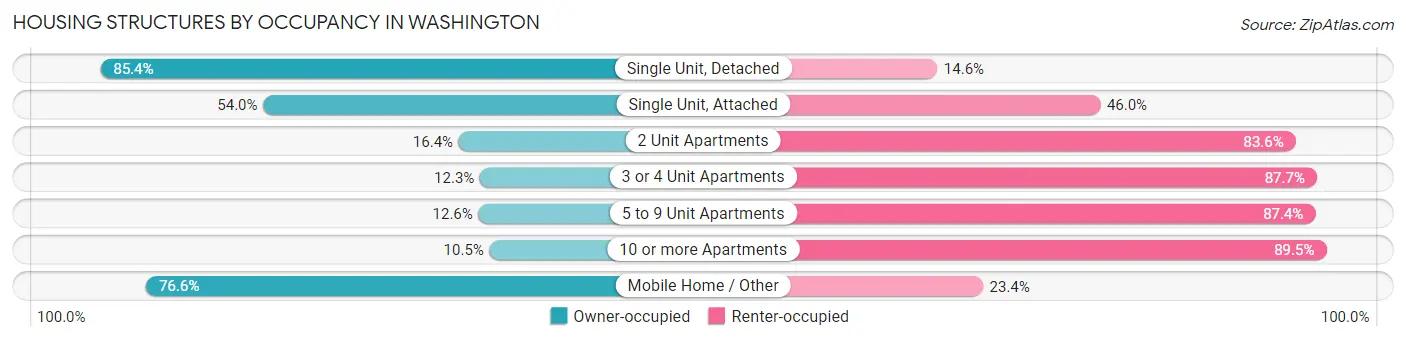
| Structure Type | Owner-occupied | Renter-occupied |
| Single Unit, Detached | 1,606,707 (85.4%) | 274,177 (14.6%) |
| Single Unit, Attached | 69,358 (54.0%) | 59,015 (46.0%) |
| 2 Unit Apartments | 10,752 (16.4%) | 54,881 (83.6%) |
| 3 or 4 Unit Apartments | 12,733 (12.3%) | 90,842 (87.7%) |
| 5 to 9 Unit Apartments | 16,463 (12.6%) | 114,330 (87.4%) |
| 10 or more Apartments | 52,027 (10.5%) | 445,425 (89.5%) |
| Mobile Home / Other | 132,212 (76.6%) | 40,350 (23.4%) |
| Total | 1,900,252 (63.8%) | 1,079,020 (36.2%) |
Housing Structures by Number of Rooms in Washington
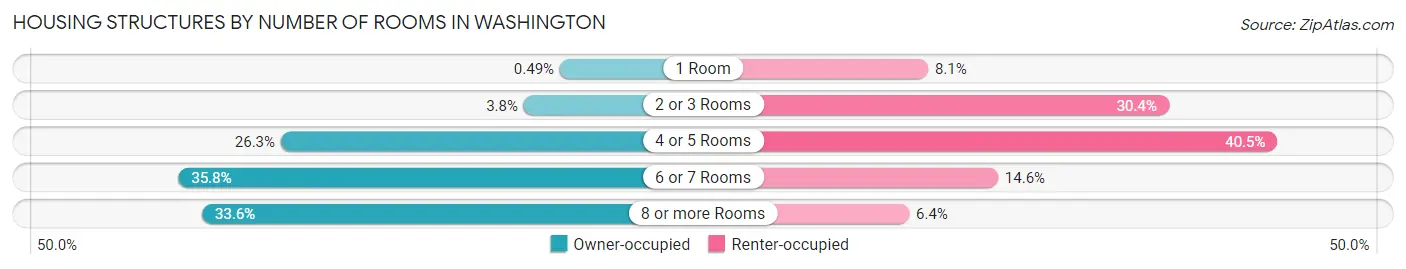
| Number of Rooms | Owner-occupied | Renter-occupied |
| 1 Room | 9,326 (0.5%) | 87,824 (8.1%) |
| 2 or 3 Rooms | 72,778 (3.8%) | 328,077 (30.4%) |
| 4 or 5 Rooms | 499,821 (26.3%) | 436,420 (40.5%) |
| 6 or 7 Rooms | 679,841 (35.8%) | 157,671 (14.6%) |
| 8 or more Rooms | 638,486 (33.6%) | 69,028 (6.4%) |
| Total | 1,900,252 (100.0%) | 1,079,020 (100.0%) |
Housing Structure by Heating Type in Washington
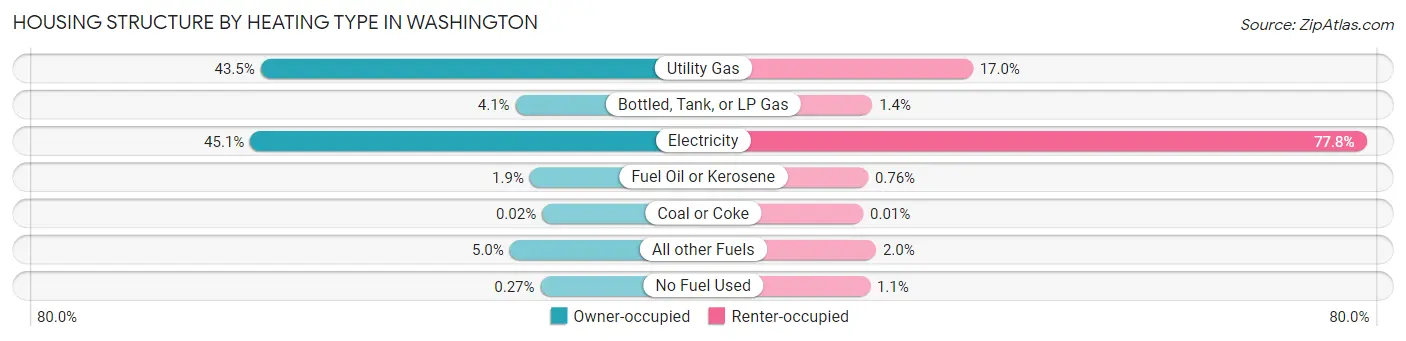
| Heating Type | Owner-occupied | Renter-occupied |
| Utility Gas | 827,255 (43.5%) | 182,919 (17.0%) |
| Bottled, Tank, or LP Gas | 78,330 (4.1%) | 15,343 (1.4%) |
| Electricity | 857,512 (45.1%) | 839,268 (77.8%) |
| Fuel Oil or Kerosene | 36,330 (1.9%) | 8,222 (0.8%) |
| Coal or Coke | 337 (0.0%) | 124 (0.0%) |
| All other Fuels | 95,407 (5.0%) | 21,574 (2.0%) |
| No Fuel Used | 5,081 (0.3%) | 11,570 (1.1%) |
| Total | 1,900,252 (100.0%) | 1,079,020 (100.0%) |
Household Vehicle Usage in Washington
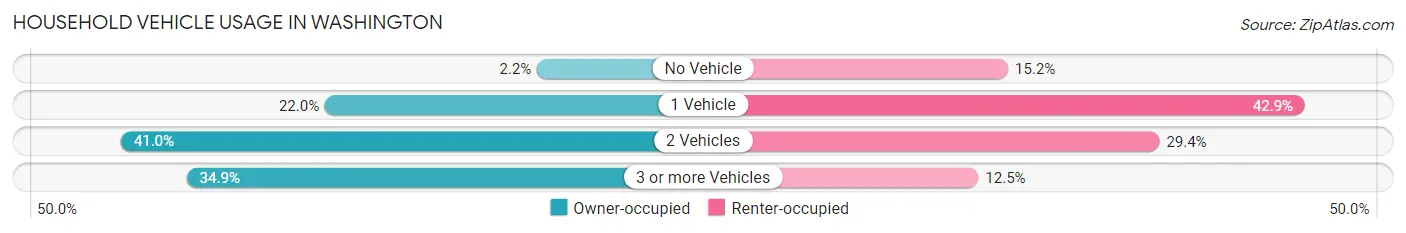
| Vehicles per Household | Owner-occupied | Renter-occupied |
| No Vehicle | 40,914 (2.1%) | 164,477 (15.2%) |
| 1 Vehicle | 417,337 (22.0%) | 463,367 (42.9%) |
| 2 Vehicles | 779,328 (41.0%) | 316,757 (29.4%) |
| 3 or more Vehicles | 662,673 (34.9%) | 134,419 (12.5%) |
| Total | 1,900,252 (100.0%) | 1,079,020 (100.0%) |
Real Estate & Mortgages in Washington
Real Estate and Mortgage Overview in Washington
| Characteristic | Without Mortgage | With Mortgage |
| Housing Units | 623,188 | 1,277,064 |
| Median Property Value | $431,700 | $490,200 |
| Median Household Income | $78,097 | $505,985 |
| Monthly Housing Costs | $703 | $330,654 |
| Real Estate Taxes | $3,892 | $25,488 |
Property Value by Mortgage Status in Washington
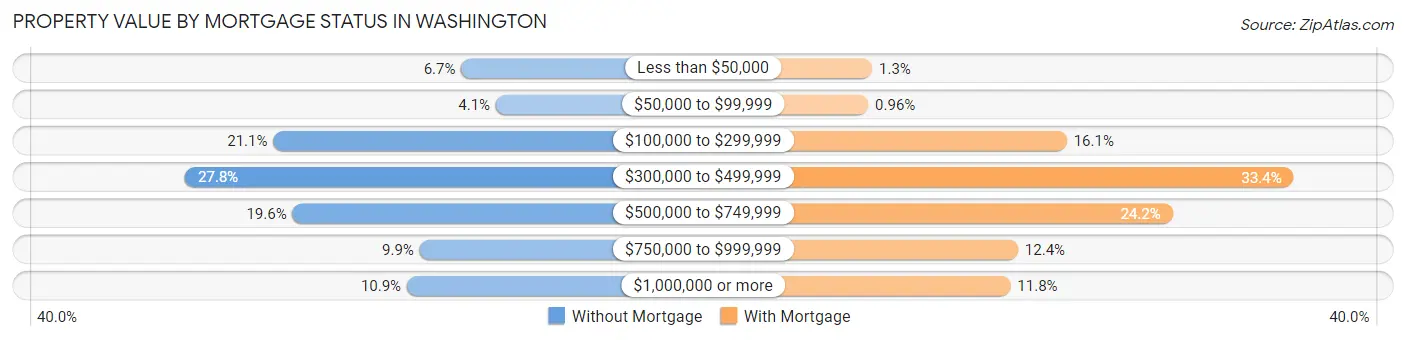
| Property Value | Without Mortgage | With Mortgage |
| Less than $50,000 | 41,925 (6.7%) | 16,072 (1.3%) |
| $50,000 to $99,999 | 25,501 (4.1%) | 12,292 (1.0%) |
| $100,000 to $299,999 | 131,175 (21.0%) | 205,427 (16.1%) |
| $300,000 to $499,999 | 173,129 (27.8%) | 426,129 (33.4%) |
| $500,000 to $749,999 | 122,055 (19.6%) | 308,510 (24.2%) |
| $750,000 to $999,999 | 61,693 (9.9%) | 157,979 (12.4%) |
| $1,000,000 or more | 67,710 (10.9%) | 150,655 (11.8%) |
| Total | 623,188 (100.0%) | 1,277,064 (100.0%) |
Household Income by Mortgage Status in Washington
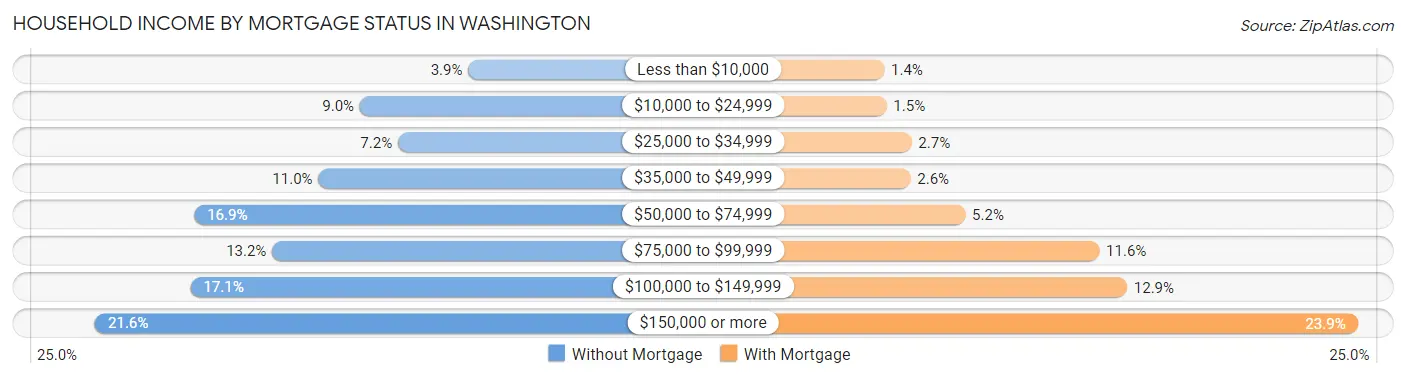
| Household Income | Without Mortgage | With Mortgage |
| Less than $10,000 | 24,096 (3.9%) | 17,396 (1.4%) |
| $10,000 to $24,999 | 56,287 (9.0%) | 18,710 (1.5%) |
| $25,000 to $34,999 | 45,011 (7.2%) | 34,021 (2.7%) |
| $35,000 to $49,999 | 68,612 (11.0%) | 33,321 (2.6%) |
| $50,000 to $74,999 | 105,431 (16.9%) | 66,701 (5.2%) |
| $75,000 to $99,999 | 82,320 (13.2%) | 148,181 (11.6%) |
| $100,000 to $149,999 | 106,577 (17.1%) | 164,936 (12.9%) |
| $150,000 or more | 134,854 (21.6%) | 305,209 (23.9%) |
| Total | 623,188 (100.0%) | 1,277,064 (100.0%) |
Property Value to Household Income Ratio in Washington
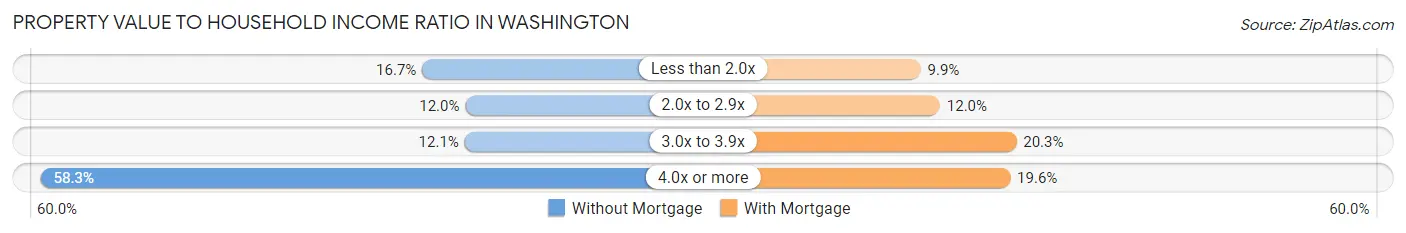
| Value-to-Income Ratio | Without Mortgage | With Mortgage |
| Less than 2.0x | 103,960 (16.7%) | 126,200 (9.9%) |
| 2.0x to 2.9x | 74,652 (12.0%) | 152,961 (12.0%) |
| 3.0x to 3.9x | 75,101 (12.0%) | 259,311 (20.3%) |
| 4.0x or more | 363,000 (58.3%) | 250,857 (19.6%) |
| Total | 623,188 (100.0%) | 1,277,064 (100.0%) |
Real Estate Taxes by Mortgage Status in Washington
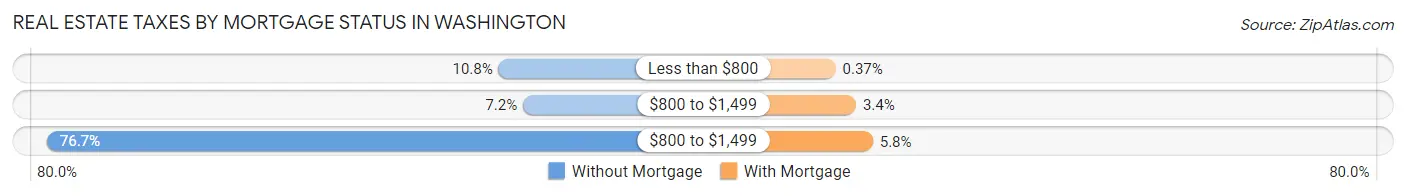
| Property Taxes | Without Mortgage | With Mortgage |
| Less than $800 | 67,000 (10.7%) | 4,680 (0.4%) |
| $800 to $1,499 | 44,703 (7.2%) | 42,771 (3.4%) |
| $800 to $1,499 | 478,221 (76.7%) | 74,139 (5.8%) |
| Total | 623,188 (100.0%) | 1,277,064 (100.0%) |
Health & Disability in Washington
Health Insurance Coverage by Age in Washington
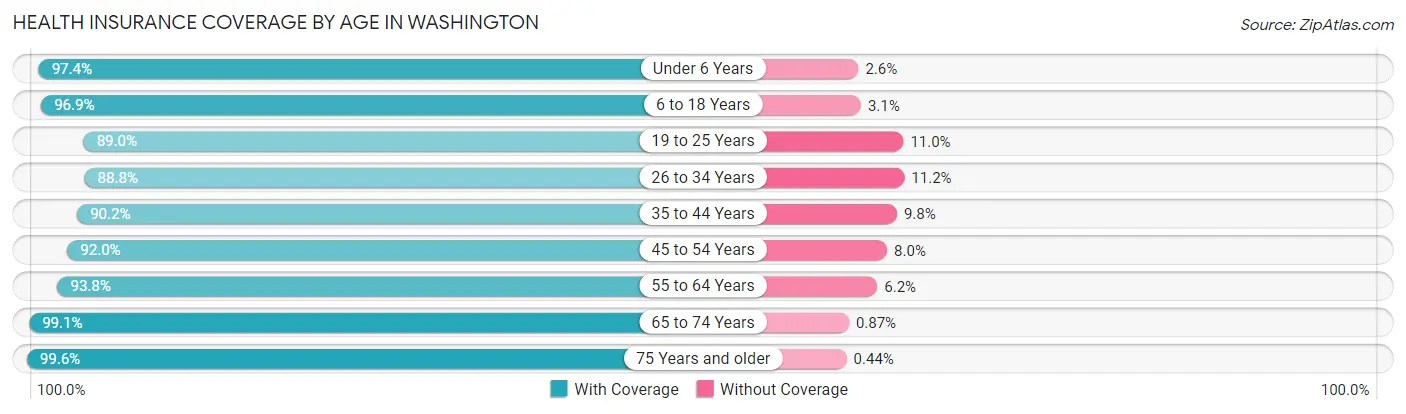
| Age Bracket | With Coverage | Without Coverage |
| Under 6 Years | 517,043 (97.4%) | 13,993 (2.6%) |
| 6 to 18 Years | 1,187,719 (96.9%) | 38,101 (3.1%) |
| 19 to 25 Years | 588,806 (89.0%) | 73,002 (11.0%) |
| 26 to 34 Years | 909,322 (88.8%) | 114,809 (11.2%) |
| 35 to 44 Years | 943,439 (90.2%) | 102,739 (9.8%) |
| 45 to 54 Years | 852,322 (92.0%) | 74,013 (8.0%) |
| 55 to 64 Years | 891,704 (93.8%) | 58,533 (6.2%) |
| 65 to 74 Years | 737,864 (99.1%) | 6,493 (0.9%) |
| 75 Years and older | 459,594 (99.6%) | 2,036 (0.4%) |
| Total | 7,087,813 (93.6%) | 483,719 (6.4%) |
Health Insurance Coverage by Citizenship Status in Washington
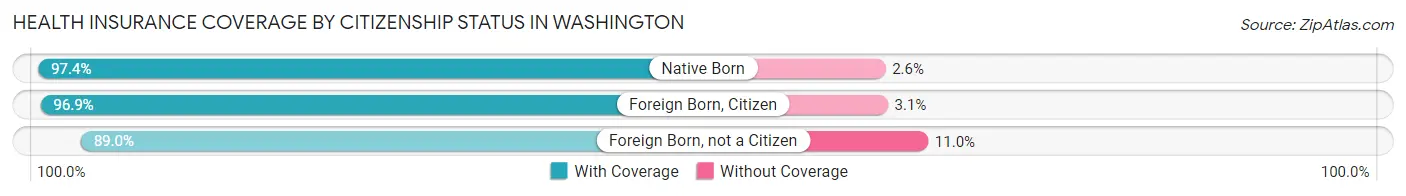
| Citizenship Status | With Coverage | Without Coverage |
| Native Born | 517,043 (97.4%) | 13,993 (2.6%) |
| Foreign Born, Citizen | 1,187,719 (96.9%) | 38,101 (3.1%) |
| Foreign Born, not a Citizen | 588,806 (89.0%) | 73,002 (11.0%) |
Health Insurance Coverage by Household Income in Washington
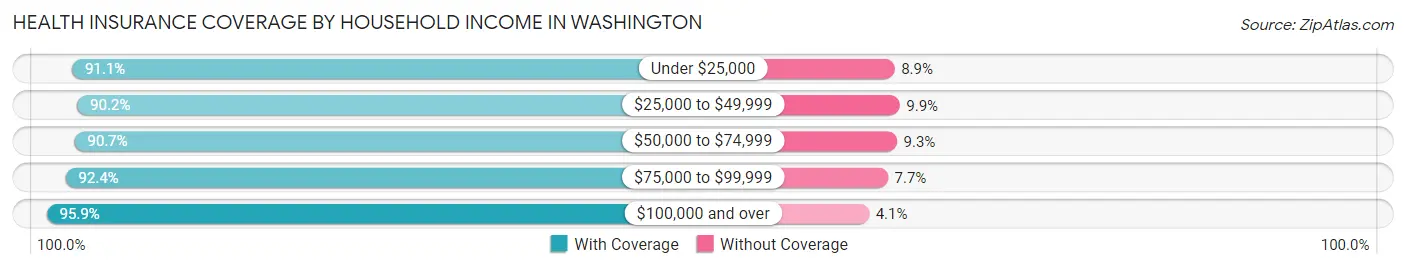
| Household Income | With Coverage | Without Coverage |
| Under $25,000 | 530,562 (91.1%) | 51,679 (8.9%) |
| $25,000 to $49,999 | 801,383 (90.1%) | 87,566 (9.9%) |
| $50,000 to $74,999 | 941,384 (90.7%) | 96,813 (9.3%) |
| $75,000 to $99,999 | 916,502 (92.3%) | 75,957 (7.6%) |
| $100,000 and over | 3,824,514 (95.9%) | 163,466 (4.1%) |
Public vs Private Health Insurance Coverage by Age in Washington
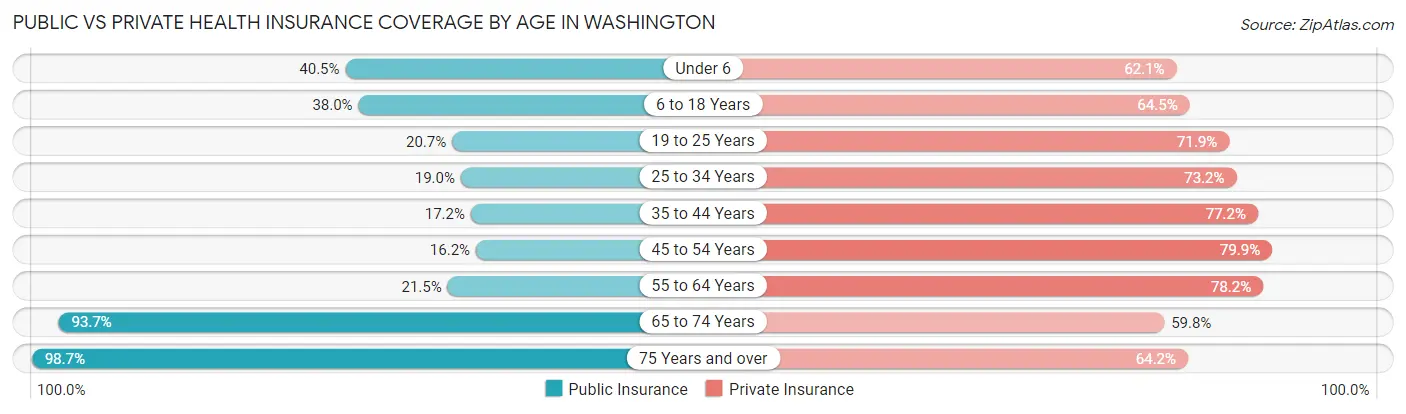
| Age Bracket | Public Insurance | Private Insurance |
| Under 6 | 214,832 (40.5%) | 329,829 (62.1%) |
| 6 to 18 Years | 466,153 (38.0%) | 791,137 (64.5%) |
| 19 to 25 Years | 136,738 (20.7%) | 475,796 (71.9%) |
| 25 to 34 Years | 194,959 (19.0%) | 749,982 (73.2%) |
| 35 to 44 Years | 179,686 (17.2%) | 807,800 (77.2%) |
| 45 to 54 Years | 150,334 (16.2%) | 739,721 (79.8%) |
| 55 to 64 Years | 204,308 (21.5%) | 742,945 (78.2%) |
| 65 to 74 Years | 697,553 (93.7%) | 445,424 (59.8%) |
| 75 Years and over | 455,503 (98.7%) | 296,497 (64.2%) |
| Total | 2,700,066 (35.7%) | 5,379,131 (71.0%) |
Disability Status by Sex by Age in Washington
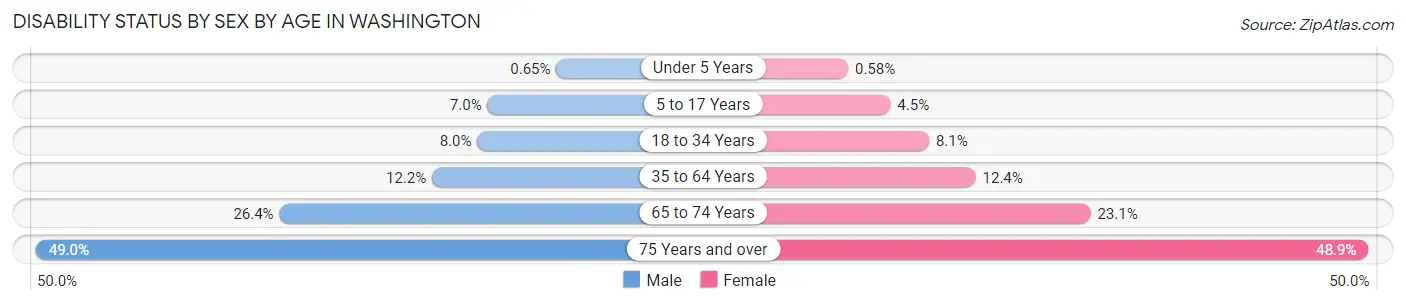
| Age Bracket | Male | Female |
| Under 5 Years | 1,458 (0.6%) | 1,238 (0.6%) |
| 5 to 17 Years | 44,069 (7.0%) | 26,876 (4.5%) |
| 18 to 34 Years | 72,678 (8.0%) | 70,542 (8.1%) |
| 35 to 64 Years | 179,758 (12.2%) | 179,827 (12.4%) |
| 65 to 74 Years | 93,708 (26.4%) | 89,736 (23.1%) |
| 75 Years and over | 97,426 (49.0%) | 128,339 (48.9%) |
Disability Class by Sex by Age in Washington
Disability Class: Hearing Difficulty
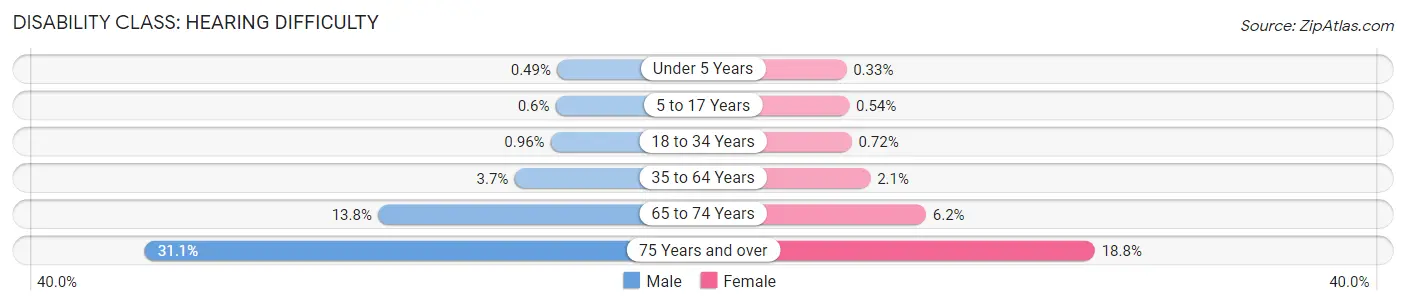
| Age Bracket | Male | Female |
| Under 5 Years | 1,101 (0.5%) | 697 (0.3%) |
| 5 to 17 Years | 3,752 (0.6%) | 3,241 (0.5%) |
| 18 to 34 Years | 8,726 (1.0%) | 6,272 (0.7%) |
| 35 to 64 Years | 53,831 (3.6%) | 30,519 (2.1%) |
| 65 to 74 Years | 48,997 (13.8%) | 24,262 (6.2%) |
| 75 Years and over | 61,824 (31.1%) | 49,334 (18.8%) |
Disability Class: Vision Difficulty
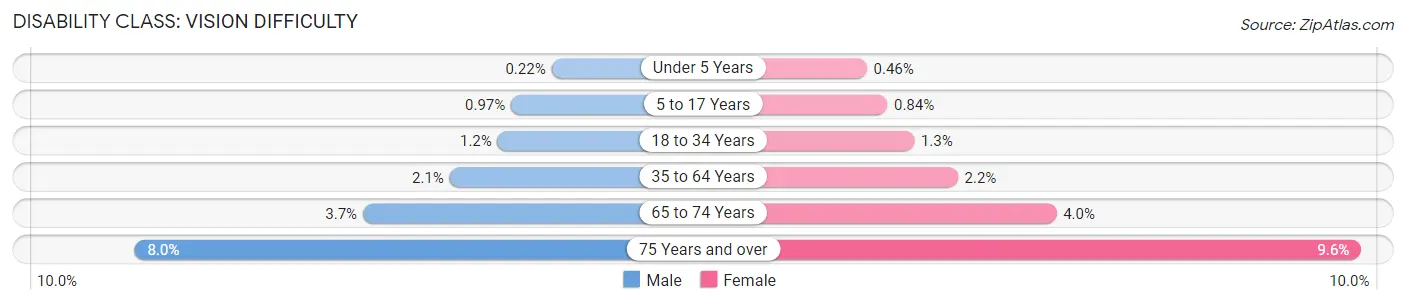
| Age Bracket | Male | Female |
| Under 5 Years | 498 (0.2%) | 987 (0.5%) |
| 5 to 17 Years | 6,041 (1.0%) | 5,024 (0.8%) |
| 18 to 34 Years | 11,115 (1.2%) | 11,639 (1.3%) |
| 35 to 64 Years | 31,051 (2.1%) | 31,066 (2.1%) |
| 65 to 74 Years | 13,220 (3.7%) | 15,482 (4.0%) |
| 75 Years and over | 15,838 (8.0%) | 25,309 (9.6%) |
Disability Class: Cognitive Difficulty
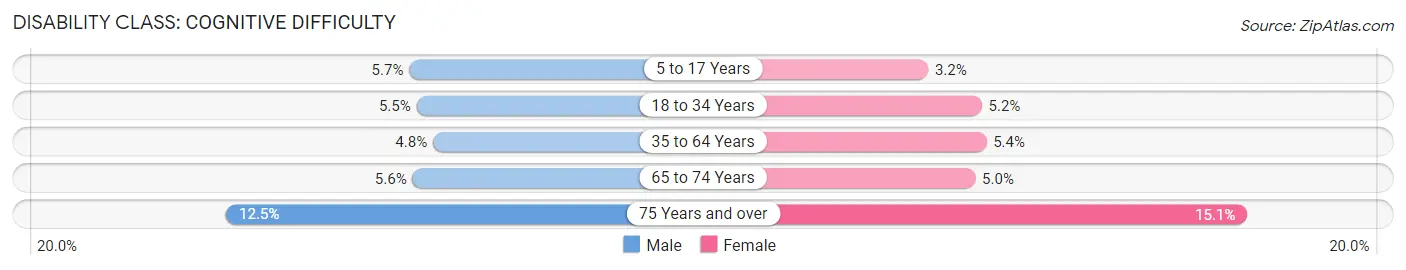
| Age Bracket | Male | Female |
| 5 to 17 Years | 35,817 (5.7%) | 19,059 (3.2%) |
| 18 to 34 Years | 49,547 (5.4%) | 45,280 (5.2%) |
| 35 to 64 Years | 71,411 (4.8%) | 77,585 (5.4%) |
| 65 to 74 Years | 19,920 (5.6%) | 19,245 (5.0%) |
| 75 Years and over | 24,916 (12.5%) | 39,541 (15.0%) |
Disability Class: Ambulatory Difficulty
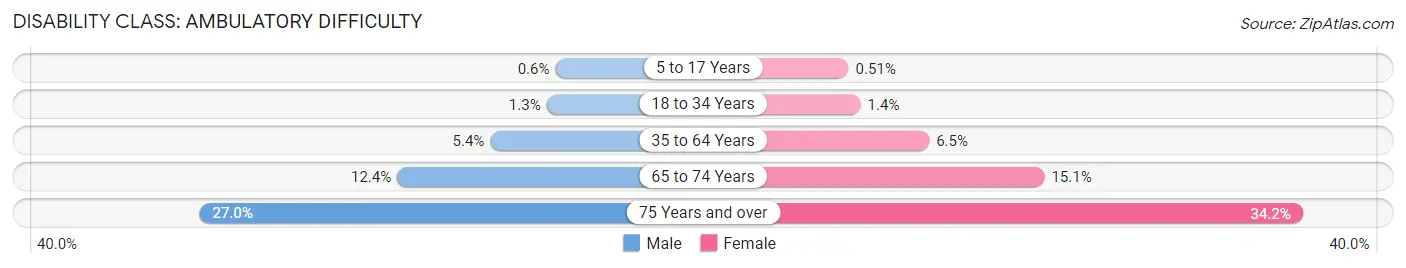
| Age Bracket | Male | Female |
| 5 to 17 Years | 3,759 (0.6%) | 3,021 (0.5%) |
| 18 to 34 Years | 11,343 (1.3%) | 12,236 (1.4%) |
| 35 to 64 Years | 80,147 (5.4%) | 93,938 (6.5%) |
| 65 to 74 Years | 43,917 (12.3%) | 58,493 (15.0%) |
| 75 Years and over | 53,738 (27.0%) | 89,843 (34.2%) |
Disability Class: Self-Care Difficulty
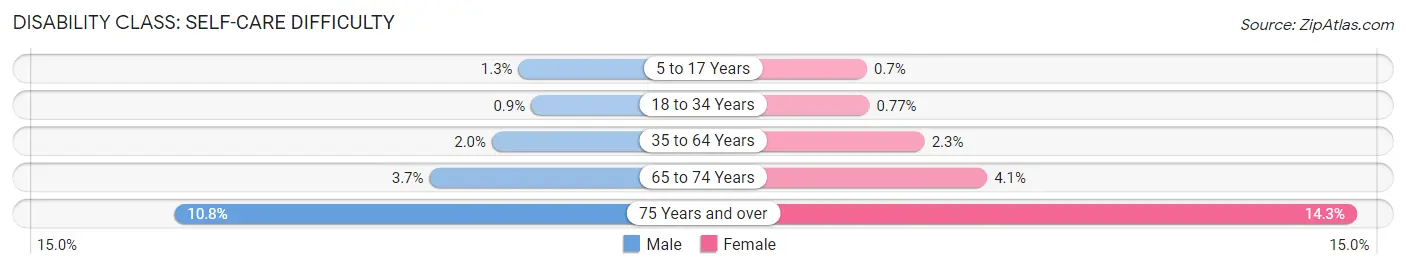
| Age Bracket | Male | Female |
| 5 to 17 Years | 7,846 (1.3%) | 4,173 (0.7%) |
| 18 to 34 Years | 8,192 (0.9%) | 6,731 (0.8%) |
| 35 to 64 Years | 29,356 (2.0%) | 33,455 (2.3%) |
| 65 to 74 Years | 13,269 (3.7%) | 15,730 (4.1%) |
| 75 Years and over | 21,550 (10.8%) | 37,661 (14.3%) |
Technology Access in Washington
Computing Device Access in Washington
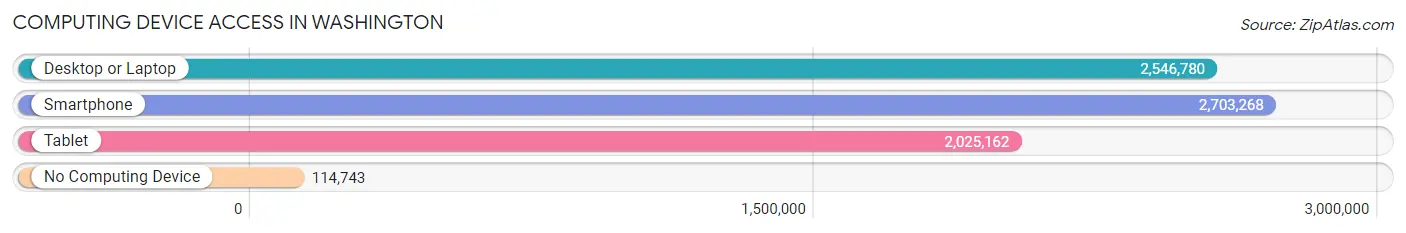
| Device Type | # Households | % Households |
| Desktop or Laptop | 2,546,780 | 85.5% |
| Smartphone | 2,703,268 | 90.7% |
| Tablet | 2,025,162 | 68.0% |
| No Computing Device | 114,743 | 3.8% |
| Total | 2,979,272 | 100.0% |
Internet Access in Washington
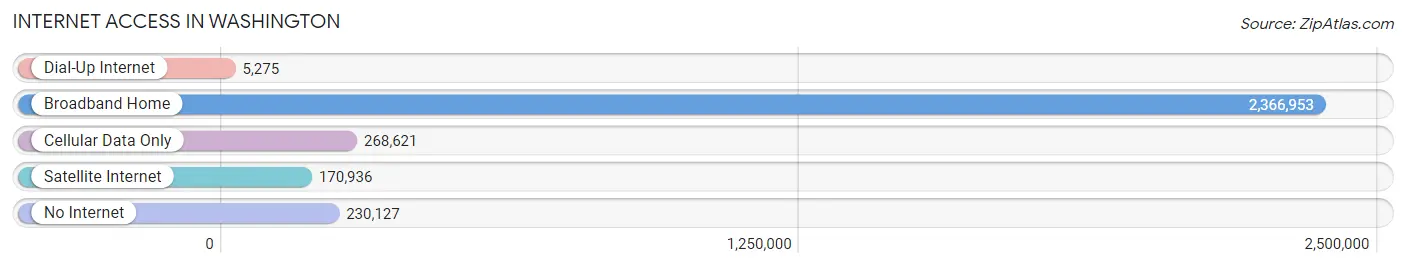
| Internet Type | # Households | % Households |
| Dial-Up Internet | 5,275 | 0.2% |
| Broadband Home | 2,366,953 | 79.4% |
| Cellular Data Only | 268,621 | 9.0% |
| Satellite Internet | 170,936 | 5.7% |
| No Internet | 230,127 | 7.7% |
| Total | 2,979,272 | 100.0% |
Washington Summary
Washington State is located in the Pacific Northwest region of the United States. It is bordered by the Canadian province of British Columbia to the north, Idaho to the east, Oregon to the south, and the Pacific Ocean to the west. Washington is the 18th largest state in the United States, with an area of 71,362 square miles, and the 13th most populous state, with a population of 7.4 million as of 2019.
History
The area that is now Washington State has been inhabited by Native American tribes for thousands of years. The first European explorers to visit the area were Spanish explorers in the late 1700s. In 1775, British explorer Captain George Vancouver explored the area and claimed it for Britain. In 1818, the United States and Britain signed the Treaty of 1818, which established the 49th parallel as the boundary between the two countries.
In 1853, Washington Territory was established, and in 1889, Washington became the 42nd state in the Union. During the late 19th and early 20th centuries, Washington experienced a period of rapid growth and development, as the population increased and the economy diversified. The state was also the site of several major labor disputes, including the Seattle General Strike of 1919.
Geography
Washington State is located in the Pacific Northwest region of the United States. It is bordered by the Canadian province of British Columbia to the north, Idaho to the east, Oregon to the south, and the Pacific Ocean to the west. Washington is the 18th largest state in the United States, with an area of 71,362 square miles.
The state is divided into two distinct regions: the Cascade Mountains and the Columbia Plateau. The Cascade Mountains run north to south through the western part of the state, and are home to several active volcanoes, including Mount Rainier, the highest peak in the state. The Columbia Plateau is located in the eastern part of the state, and is characterized by rolling hills and wide, open plains.
Economy
Washington State has a diverse and robust economy. The state’s largest industries include aerospace, agriculture, technology, and tourism. The state is also home to several major corporations, including Microsoft, Amazon, and Boeing.
In 2000, the state’s gross domestic product (GDP) was $206.3 billion, and the per capita income was $31,845. The unemployment rate was 4.9%, and the median household income was $50,902.
Demographics
As of 2019, the population of Washington State was estimated to be 7.4 million. The state is ethnically and racially diverse, with the largest ethnic groups being White (77.2%), Hispanic or Latino (11.2%), and Asian (7.2%).
The largest cities in the state are Seattle, Spokane, Tacoma, Vancouver, Bellevue, and Everett. The state capital is Olympia.
Conclusion
Washington State is a diverse and vibrant state located in the Pacific Northwest region of the United States. It has a rich history, diverse geography, and a robust economy. The state is home to a diverse population, with the largest ethnic groups being White, Hispanic or Latino, and Asian. Washington State is an important part of the United States, and its economy and population continue to grow and thrive.
Common Questions
When was Washington Incorporated?
Washington was Incorporated into the Union on Nov 11, 1889.
What is the Total Area of Washington?
Total Area of Washington is 71,298 Square Miles.
What is the Total Land Area of Washington?
Total Land Area of Washington is 66,449 Square Miles.
What is the Total Water Area of Washington?
Total Water Area of Washington is 4,849 Square Miles.
What is the Average Elevation in Washington?
Average Elevation in Washington is 1,700 Feet.
What is the Highest Elevation in Washington?
Highest Elevation in Washington is 14,410 Feet.
What is the Lowest Elevation in Washington?
Lowest Elevation in Washington is 0 Feet.
What is the Population Density in Washington?
Population Density in Washington is 115.7 People per Square Mile.
What is Per Capita Income in Washington?
Per Capita income in Washington is $48,685.
What is the Median Family Income in Washington?
Median Family Income in Washington is $108,285.
What is the Median Household income in Washington?
Median Household Income in Washington is $90,325.
What is Income or Wage Gap in Washington?
Income or Wage Gap in Washington is 30.9%.
Women in Washington earn 69.1 cents for every dollar earned by a man.
What is Family Income Deficit in Washington?
Family Income Deficit in Washington is $11,222.
Families that are below poverty line in Washington earn $11,222 less on average than the poverty threshold level.
What is Inequality or Gini Index in Washington?
Inequality or Gini Index in Washington is 0.46.
What is the Total Population of Washington?
Total Population of Washington is 7,688,549.
What is the Total Male Population of Washington?
Total Male Population of Washington is 3,877,918.
What is the Total Female Population of Washington?
Total Female Population of Washington is 3,810,631.
What is the Ratio of Males per 100 Females in Washington?
There are 101.77 Males per 100 Females in Washington.
What is the Ratio of Females per 100 Males in Washington?
There are 98.26 Females per 100 Males in Washington.
What is the Median Population Age in Washington?
Median Population Age in Washington is 38.0 Years.
What is the Average Family Size in Washington
Average Family Size in Washington is 3.1 People.
What is the Average Household Size in Washington
Average Household Size in Washington is 2.5 People.
How Large is the Labor Force in Washington?
There are 4,011,152 People in the Labor Forcein in Washington.
What is the Percentage of People in the Labor Force in Washington?
64.6% of People are in the Labor Force in Washington.
What is the Unemployment Rate in Washington?
Unemployment Rate in Washington is 5.0%.