Cities with the Most Immigrants from Zaire in the United States
RELATED REPORTS & OPTIONS
Zaire
United States
Compare Cities
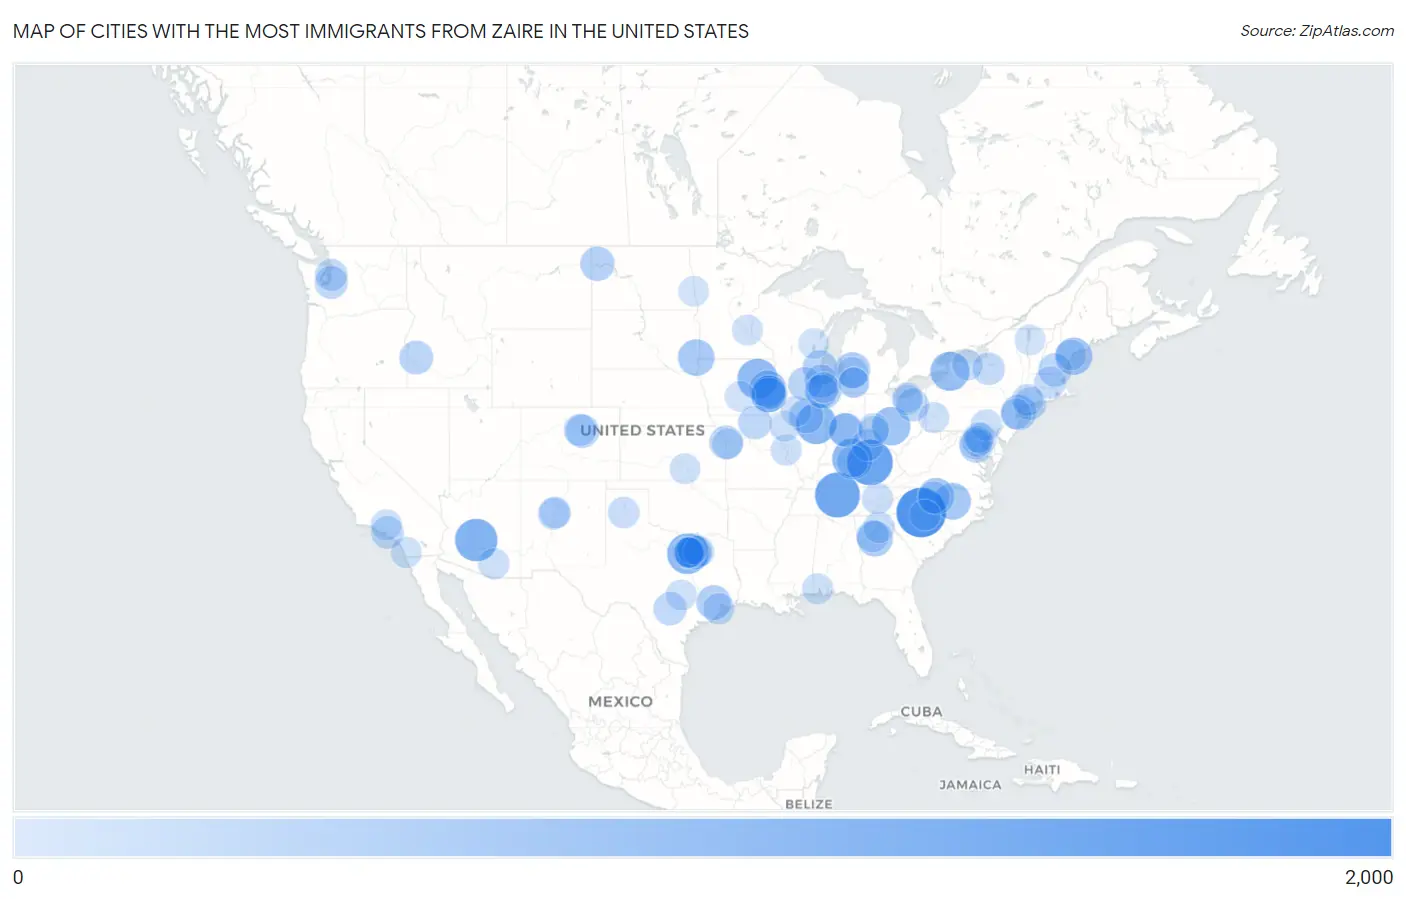
Map of Cities with the Most Immigrants from Zaire in the United States
0
2,000
Cities with the Most Immigrants from Zaire in the United States
| City | Zaire | vs State | vs National | |
| 1. | Charlotte | 1,711 | 4,046(42.29%)#1 | 56,604(3.02%)#1 |
| 2. | Lexington | 1,384 | 3,435(40.29%)#1 | 56,604(2.45%)#2 |
| 3. | Nashville | 1,315 | 1,886(69.72%)#1 | 56,604(2.32%)#3 |
| 4. | Phoenix | 1,115 | 1,580(70.57%)#1 | 56,604(1.97%)#4 |
| 5. | Champaign | 965 | 4,414(21.86%)#1 | 56,604(1.70%)#5 |
| 6. | Fort Worth | 964 | 5,522(17.46%)#1 | 56,604(1.70%)#6 |
| 7. | Louisville | 952 | 3,435(27.71%)#2 | 56,604(1.68%)#7 |
| 8. | Waterloo | 927 | 3,735(24.82%)#1 | 56,604(1.64%)#8 |
| 9. | Buffalo | 840 | 2,563(32.77%)#1 | 56,604(1.48%)#9 |
| 10. | Naugatuck Borough | 787 | 1,660(47.41%)#1 | 56,604(1.39%)#10 |
| 11. | Columbus | 776 | 2,154(36.03%)#1 | 56,604(1.37%)#11 |
| 12. | Portland | 686 | 1,020(67.25%)#1 | 56,604(1.21%)#12 |
| 13. | Coralville | 659 | 3,735(17.64%)#2 | 56,604(1.16%)#13 |
| 14. | Raleigh | 647 | 4,046(15.99%)#2 | 56,604(1.14%)#14 |
| 15. | Cedar Rapids | 641 | 3,735(17.16%)#3 | 56,604(1.13%)#15 |
| 16. | Greensboro | 623 | 4,046(15.40%)#3 | 56,604(1.10%)#16 |
| 17. | Sioux Falls | 621 | 672(92.41%)#1 | 56,604(1.10%)#17 |
| 18. | Grand Rapids | 540 | 1,416(38.14%)#1 | 56,604(0.95%)#18 |
| 19. | Stonecrest | 537 | 3,069(17.50%)#1 | 56,604(0.95%)#19 |
| 20. | Chicago | 510 | 4,414(11.55%)#2 | 56,604(0.90%)#20 |
| 21. | New York | 506 | 2,563(19.74%)#2 | 56,604(0.89%)#21 |
| 22. | Irving | 487 | 5,522(8.82%)#2 | 56,604(0.86%)#22 |
| 23. | Houston | 482 | 5,522(8.73%)#3 | 56,604(0.85%)#23 |
| 24. | Iowa City | 465 | 3,735(12.45%)#4 | 56,604(0.82%)#24 |
| 25. | Milwaukee | 456 | 808(56.44%)#1 | 56,604(0.81%)#25 |
| 26. | Williston | 451 | 595(75.80%)#1 | 56,604(0.80%)#26 |
| 27. | Normal | 440 | 4,414(9.97%)#3 | 56,604(0.78%)#27 |
| 28. | North Liberty | 435 | 3,735(11.65%)#5 | 56,604(0.77%)#28 |
| 29. | Meridian | 409 | 577(70.88%)#1 | 56,604(0.72%)#29 |
| 30. | Kansas City | 406 | 1,850(21.95%)#1 | 56,604(0.72%)#30 |
| 31. | Indianapolis | 398 | 1,221(32.60%)#1 | 56,604(0.70%)#31 |
| 32. | Rockford | 396 | 4,414(8.97%)#4 | 56,604(0.70%)#32 |
| 33. | Dallas | 394 | 5,522(7.14%)#4 | 56,604(0.70%)#33 |
| 34. | Speedway | 393 | 1,221(32.19%)#2 | 56,604(0.69%)#34 |
| 35. | Manchester | 384 | 437(87.87%)#1 | 56,604(0.68%)#35 |
| 36. | Waukegan | 383 | 4,414(8.68%)#5 | 56,604(0.68%)#36 |
| 37. | Aurora | 382 | 968(39.46%)#1 | 56,604(0.67%)#37 |
| 38. | Kirksville | 377 | 1,850(20.38%)#2 | 56,604(0.67%)#38 |
| 39. | Hillside | 369 | 4,414(8.36%)#6 | 56,604(0.65%)#39 |
| 40. | San Antonio | 354 | 5,522(6.41%)#5 | 56,604(0.63%)#40 |
| 41. | Washington | 347 | 347(100.00%)#1 | 56,604(0.61%)#41 |
| 42. | Federal Way | 334 | 1,182(28.26%)#1 | 56,604(0.59%)#42 |
| 43. | Akron | 333 | 2,154(15.46%)#2 | 56,604(0.59%)#43 |
| 44. | Los Angeles | 310 | 1,613(19.22%)#1 | 56,604(0.55%)#44 |
| 45. | Bridgeport | 306 | 1,660(18.43%)#2 | 56,604(0.54%)#45 |
| 46. | Syracuse | 303 | 2,563(11.82%)#3 | 56,604(0.54%)#46 |
| 47. | Euless | 294 | 5,522(5.32%)#6 | 56,604(0.52%)#47 |
| 48. | Clarkston | 285 | 3,069(9.29%)#2 | 56,604(0.50%)#48 |
| 49. | Denver | 277 | 968(28.62%)#2 | 56,604(0.49%)#49 |
| 50. | Seattle | 275 | 1,182(23.27%)#2 | 56,604(0.49%)#50 |
| 51. | High Point | 273 | 4,046(6.75%)#4 | 56,604(0.48%)#51 |
| 52. | Florence | 269 | 3,435(7.83%)#3 | 56,604(0.48%)#52 |
| 53. | Worcester | 267 | 738(36.18%)#1 | 56,604(0.47%)#53 |
| 54. | Hillview | 259 | 3,435(7.54%)#4 | 56,604(0.46%)#54 |
| 55. | Albuquerque | 238 | 459(51.85%)#1 | 56,604(0.42%)#55 |
| 56. | Lodi Borough | 233 | 655(35.57%)#1 | 56,604(0.41%)#56 |
| 57. | Haltom City | 228 | 5,522(4.13%)#7 | 56,604(0.40%)#57 |
| 58. | Bethel | 223 | 1,660(13.43%)#3 | 56,604(0.39%)#58 |
| 59. | North Valley | 221 | 459(48.15%)#2 | 56,604(0.39%)#59 |
| 60. | League City | 219 | 5,522(3.97%)#8 | 56,604(0.39%)#60 |
| 61. | Amarillo | 216 | 5,522(3.91%)#9 | 56,604(0.38%)#61 |
| 62. | Cutlerville | 214 | 1,416(15.11%)#2 | 56,604(0.38%)#62 |
| 63. | Wheaton | 213 | 1,861(11.45%)#1 | 56,604(0.38%)#63 |
| 64. | Baltimore | 210 | 1,861(11.28%)#2 | 56,604(0.37%)#64 |
| 65. | Gainesville | 210 | 3,069(6.84%)#3 | 56,604(0.37%)#65 |
| 66. | Lancaster | 201 | 1,033(19.46%)#1 | 56,604(0.36%)#66 |
| 67. | Dayton | 200 | 2,154(9.29%)#3 | 56,604(0.35%)#67 |
| 68. | Tucson | 190 | 1,580(12.03%)#2 | 56,604(0.34%)#68 |
| 69. | Knoxville | 190 | 1,886(10.07%)#2 | 56,604(0.34%)#69 |
| 70. | Monroe | 187 | 4,046(4.62%)#5 | 56,604(0.33%)#70 |
| 71. | Rowlett | 183 | 5,522(3.31%)#10 | 56,604(0.32%)#71 |
| 72. | San Diego | 180 | 1,613(11.16%)#2 | 56,604(0.32%)#72 |
| 73. | Columbia | 179 | 1,861(9.62%)#3 | 56,604(0.32%)#73 |
| 74. | Pittsburgh | 178 | 1,033(17.23%)#2 | 56,604(0.31%)#74 |
| 75. | Santa Clarita | 177 | 1,613(10.97%)#3 | 56,604(0.31%)#75 |
| 76. | Overland | 177 | 1,850(9.57%)#3 | 56,604(0.31%)#76 |
| 77. | Rochester | 176 | 2,563(6.87%)#4 | 56,604(0.31%)#77 |
| 78. | Mobile | 175 | 248(70.56%)#1 | 56,604(0.31%)#78 |
| 79. | St Paul | 171 | 551(31.03%)#1 | 56,604(0.30%)#79 |
| 80. | Beardstown | 170 | 4,414(3.85%)#7 | 56,604(0.30%)#80 |
| 81. | Lewisville | 169 | 5,522(3.06%)#11 | 56,604(0.30%)#81 |
| 82. | Skokie | 166 | 4,414(3.76%)#8 | 56,604(0.29%)#82 |
| 83. | Wichita | 162 | 277(58.48%)#1 | 56,604(0.29%)#83 |
| 84. | Austin | 159 | 5,522(2.88%)#12 | 56,604(0.28%)#84 |
| 85. | Westbrook | 159 | 1,020(15.59%)#2 | 56,604(0.28%)#85 |
| 86. | Peoria | 158 | 4,414(3.58%)#9 | 56,604(0.28%)#86 |
| 87. | Elizabeth | 157 | 655(23.97%)#2 | 56,604(0.28%)#87 |
| 88. | Appleton | 155 | 808(19.18%)#2 | 56,604(0.27%)#88 |
| 89. | Burlington | 151 | 333(45.35%)#1 | 56,604(0.27%)#89 |
| 90. | Bedford | 149 | 5,522(2.70%)#13 | 56,604(0.26%)#90 |
| 91. | Raytown | 149 | 1,850(8.05%)#4 | 56,604(0.26%)#91 |
| 92. | Kettering | 148 | 2,154(6.87%)#4 | 56,604(0.26%)#92 |
| 93. | Fargo | 144 | 595(24.20%)#2 | 56,604(0.25%)#93 |
| 94. | Lakewood | 142 | 2,154(6.59%)#5 | 56,604(0.25%)#94 |
| 95. | Randallstown | 141 | 1,861(7.58%)#4 | 56,604(0.25%)#95 |
| 96. | Kalamazoo | 140 | 1,416(9.89%)#3 | 56,604(0.25%)#96 |
| 97. | Westwood | 140 | 1,416(9.89%)#4 | 56,604(0.25%)#97 |
| 98. | Des Moines | 137 | 3,735(3.67%)#6 | 56,604(0.24%)#98 |
| 99. | Brook Park | 137 | 2,154(6.36%)#6 | 56,604(0.24%)#99 |
| 100. | Hurst | 135 | 5,522(2.44%)#14 | 56,604(0.24%)#100 |
Common Questions
What are the Top 10 Cities with the Most Immigrants from Zaire in the United States?
Top 10 Cities with the Most Immigrants from Zaire in the United States are:
What city has the Most Immigrants from Zaire in the United States?
Charlotte has the Most Immigrants from Zaire in the United States with 1,711.
What is the Total Immigrants from Zaire in the United States?
Total Immigrants from Zaire in the United States is 56,604.