Greenville, SC Map & Demographics
Greenville Map
Greenville Overview
$52,404
PER CAPITA INCOME
$98,535
AVG FAMILY INCOME
$65,519
AVG HOUSEHOLD INCOME
33.6%
WAGE / INCOME GAP [ % ]
66.4¢/ $1
WAGE / INCOME GAP [ $ ]
$12,029
FAMILY INCOME DEFICIT
0.55
INEQUALITY / GINI INDEX
70,838
TOTAL POPULATION
33,978
MALE POPULATION
36,860
FEMALE POPULATION
92.18
MALES / 100 FEMALES
108.48
FEMALES / 100 MALES
33.8
MEDIAN AGE
2.8
AVG FAMILY SIZE
2.0
AVG HOUSEHOLD SIZE
40,836
LABOR FORCE [ PEOPLE ]
68.5%
PERCENT IN LABOR FORCE
3.8%
UNEMPLOYMENT RATE
Greenville Area Codes
Income in Greenville
Income Overview in Greenville
Per Capita Income in Greenville is $52,404, while median incomes of families and households are $98,535 and $65,519 respectively.
| Characteristic | Number | Measure |
| Per Capita Income | 70,838 | $52,404 |
| Median Family Income | 15,748 | $98,535 |
| Mean Family Income | 15,748 | $156,334 |
| Median Household Income | 33,550 | $65,519 |
| Mean Household Income | 33,550 | $108,873 |
| Income Deficit | 15,748 | $12,029 |
| Wage / Income Gap (%) | 70,838 | 33.59% |
| Wage / Income Gap ($) | 70,838 | 66.41¢ per $1 |
| Gini / Inequality Index | 70,838 | 0.55 |
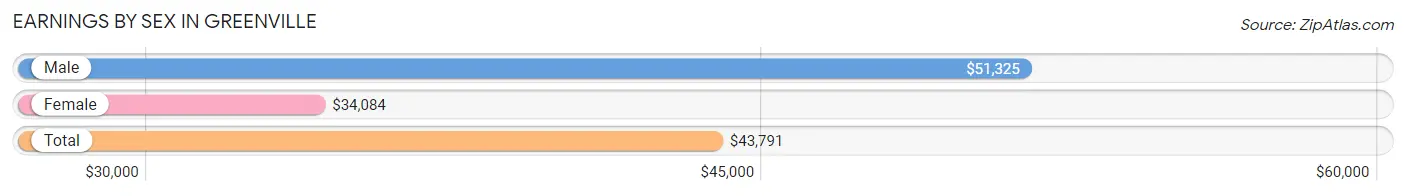
Earnings by Sex in Greenville
Average Earnings in Greenville are $43,791, $51,325 for men and $34,084 for women, a difference of 33.6%.
| Sex | Number | Average Earnings |
| Male | 22,061 (51.0%) | $51,325 |
| Female | 21,223 (49.0%) | $34,084 |
| Total | 43,284 (100.0%) | $43,791 |
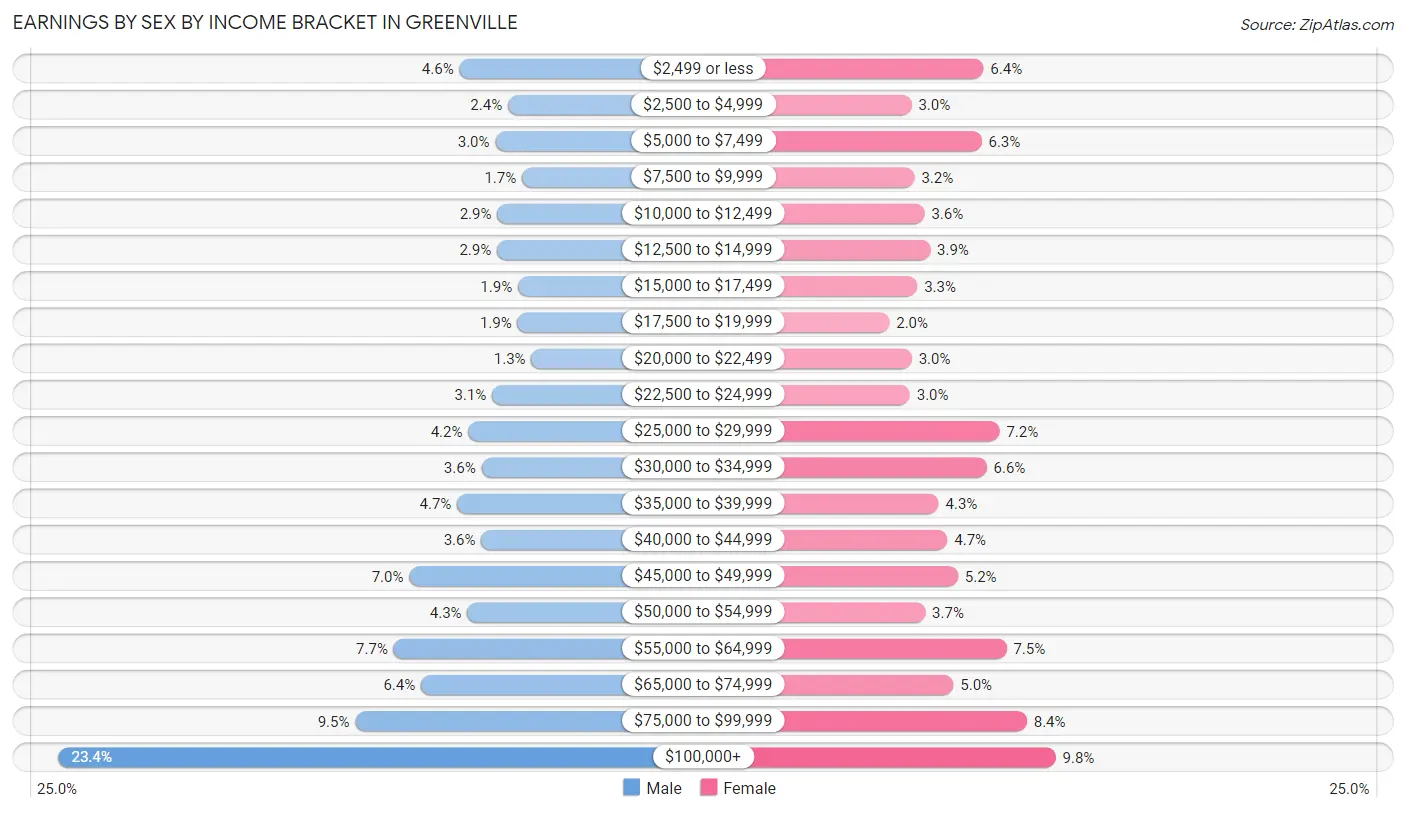
Earnings by Sex by Income Bracket in Greenville
The most common earnings brackets in Greenville are $100,000+ for men (5,165 | 23.4%) and $100,000+ for women (2,076 | 9.8%).
| Income | Male | Female |
| $2,499 or less | 1,022 (4.6%) | 1,358 (6.4%) |
| $2,500 to $4,999 | 520 (2.4%) | 644 (3.0%) |
| $5,000 to $7,499 | 651 (2.9%) | 1,340 (6.3%) |
| $7,500 to $9,999 | 374 (1.7%) | 673 (3.2%) |
| $10,000 to $12,499 | 632 (2.9%) | 772 (3.6%) |
| $12,500 to $14,999 | 634 (2.9%) | 827 (3.9%) |
| $15,000 to $17,499 | 416 (1.9%) | 701 (3.3%) |
| $17,500 to $19,999 | 422 (1.9%) | 422 (2.0%) |
| $20,000 to $22,499 | 277 (1.3%) | 645 (3.0%) |
| $22,500 to $24,999 | 684 (3.1%) | 626 (2.9%) |
| $25,000 to $29,999 | 930 (4.2%) | 1,518 (7.1%) |
| $30,000 to $34,999 | 795 (3.6%) | 1,390 (6.6%) |
| $35,000 to $39,999 | 1,046 (4.7%) | 912 (4.3%) |
| $40,000 to $44,999 | 797 (3.6%) | 1,000 (4.7%) |
| $45,000 to $49,999 | 1,539 (7.0%) | 1,104 (5.2%) |
| $50,000 to $54,999 | 940 (4.3%) | 779 (3.7%) |
| $55,000 to $64,999 | 1,700 (7.7%) | 1,587 (7.5%) |
| $65,000 to $74,999 | 1,418 (6.4%) | 1,060 (5.0%) |
| $75,000 to $99,999 | 2,099 (9.5%) | 1,789 (8.4%) |
| $100,000+ | 5,165 (23.4%) | 2,076 (9.8%) |
| Total | 22,061 (100.0%) | 21,223 (100.0%) |
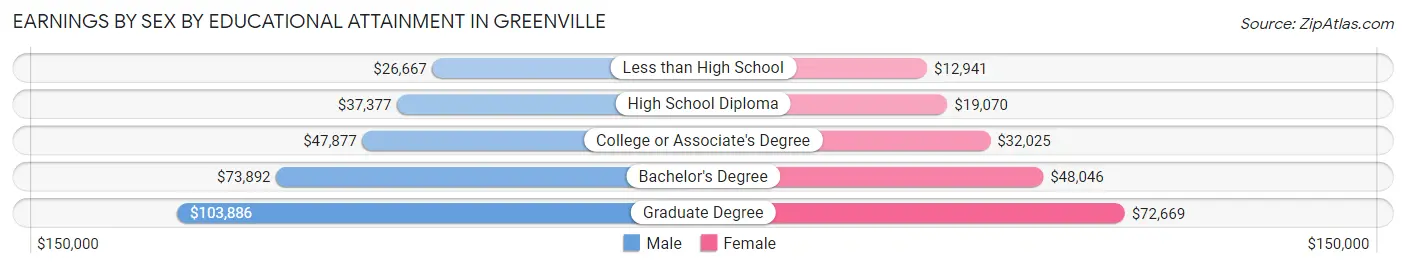
Earnings by Sex by Educational Attainment in Greenville
Average earnings in Greenville are $60,607 for men and $42,583 for women, a difference of 29.7%. Men with an educational attainment of graduate degree enjoy the highest average annual earnings of $103,886, while those with less than high school education earn the least with $26,667. Women with an educational attainment of graduate degree earn the most with the average annual earnings of $72,669, while those with less than high school education have the smallest earnings of $12,941.
| Educational Attainment | Male Income | Female Income |
| Less than High School | $26,667 | $12,941 |
| High School Diploma | $37,377 | $19,070 |
| College or Associate's Degree | $47,877 | $32,025 |
| Bachelor's Degree | $73,892 | $48,046 |
| Graduate Degree | $103,886 | $72,669 |
| Total | $60,607 | $42,583 |
Family Income in Greenville
Family Income Brackets in Greenville
According to the Greenville family income data, there are 3,465 families falling into the $200,000+ income range, which is the most common income bracket and makes up 22.0% of all families. Conversely, the $10,000 to $14,999 income bracket is the least frequent group with only 189 families (1.2%) belonging to this category.
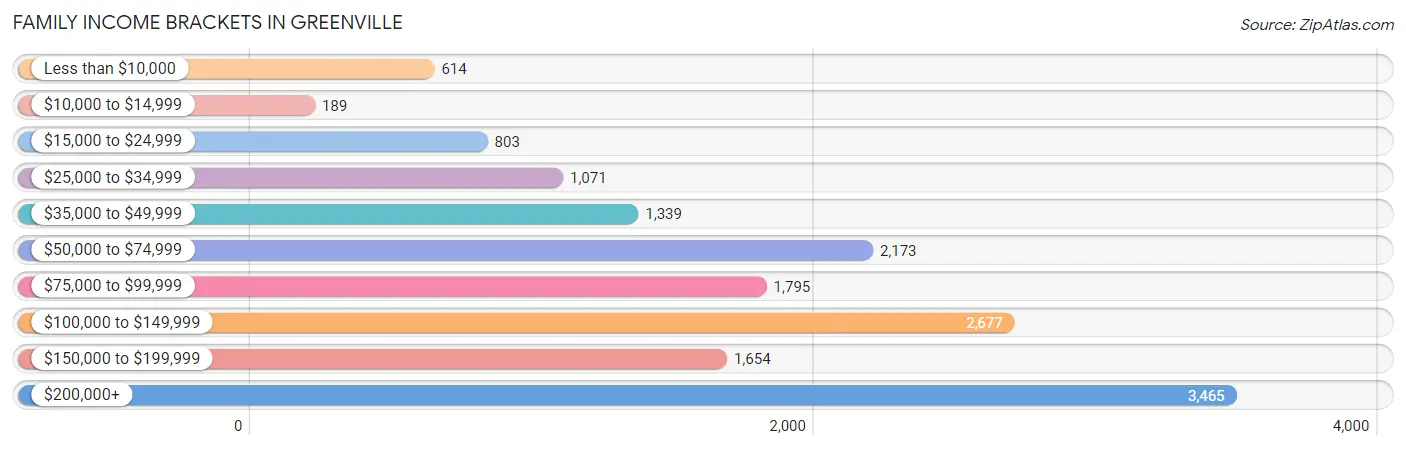
| Income Bracket | # Families | % Families |
| Less than $10,000 | 614 | 3.9% |
| $10,000 to $14,999 | 189 | 1.2% |
| $15,000 to $24,999 | 803 | 5.1% |
| $25,000 to $34,999 | 1,071 | 6.8% |
| $35,000 to $49,999 | 1,339 | 8.5% |
| $50,000 to $74,999 | 2,173 | 13.8% |
| $75,000 to $99,999 | 1,795 | 11.4% |
| $100,000 to $149,999 | 2,677 | 17.0% |
| $150,000 to $199,999 | 1,654 | 10.5% |
| $200,000+ | 3,465 | 22.0% |
Family Income by Famaliy Size in Greenville
5-person families (848 | 5.4%) account for the highest median family income in Greenville with $145,395 per family, while 2-person families (9,018 | 57.3%) have the highest median income of $48,760 per family member.
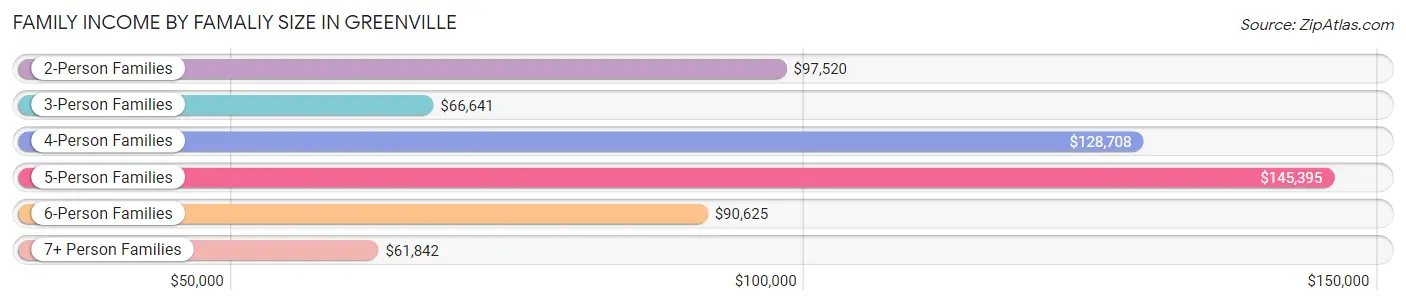
| Income Bracket | # Families | Median Income |
| 2-Person Families | 9,018 (57.3%) | $97,520 |
| 3-Person Families | 3,016 (19.2%) | $66,641 |
| 4-Person Families | 2,555 (16.2%) | $128,708 |
| 5-Person Families | 848 (5.4%) | $145,395 |
| 6-Person Families | 283 (1.8%) | $90,625 |
| 7+ Person Families | 28 (0.2%) | $61,842 |
| Total | 15,748 (100.0%) | $98,535 |
Family Income by Number of Earners in Greenville
The median family income in Greenville is $98,535, with families comprising 2 earners (6,885) having the highest median family income of $132,579, while families with 1 earner (5,615) have the lowest median family income of $59,903, accounting for 43.7% and 35.7% of families, respectively.
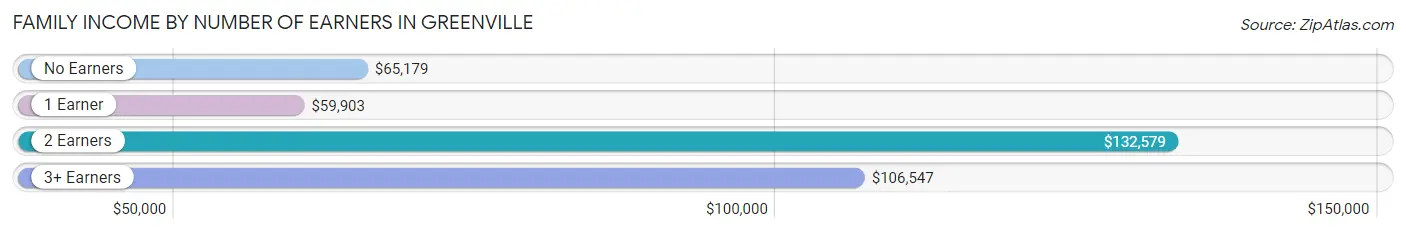
| Number of Earners | # Families | Median Income |
| No Earners | 2,109 (13.4%) | $65,179 |
| 1 Earner | 5,615 (35.7%) | $59,903 |
| 2 Earners | 6,885 (43.7%) | $132,579 |
| 3+ Earners | 1,139 (7.2%) | $106,547 |
| Total | 15,748 (100.0%) | $98,535 |
Household Income in Greenville
Household Income Brackets in Greenville
With 5,771 households falling in the category, the $50,000 to $74,999 income range is the most frequent in Greenville, accounting for 17.2% of all households. In contrast, only 1,879 households (5.6%) fall into the $10,000 to $14,999 income bracket, making it the least populous group.
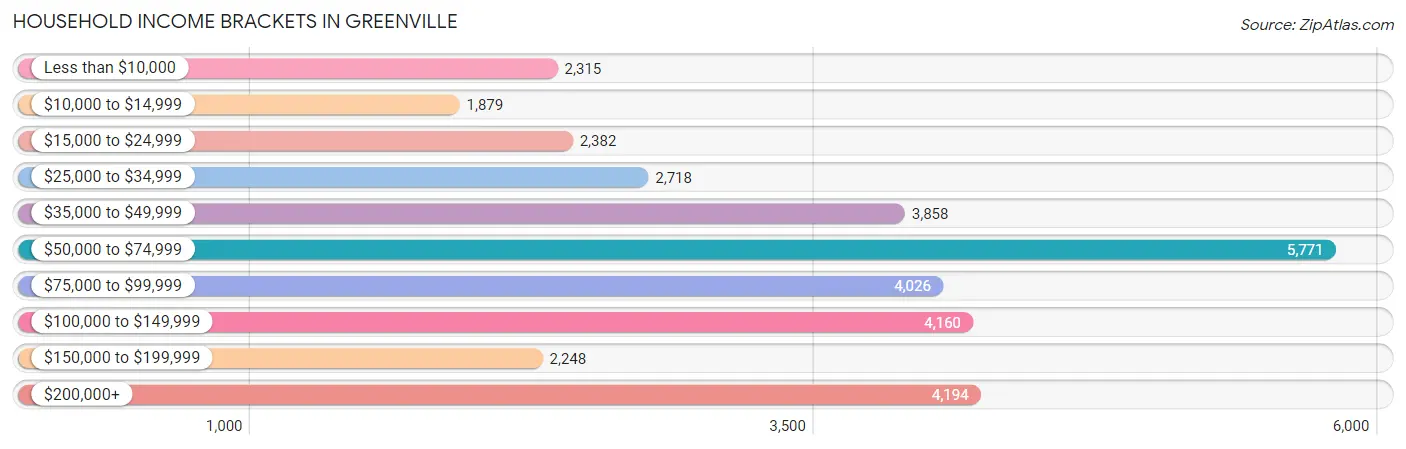
| Income Bracket | # Households | % Households |
| Less than $10,000 | 2,315 | 6.9% |
| $10,000 to $14,999 | 1,879 | 5.6% |
| $15,000 to $24,999 | 2,382 | 7.1% |
| $25,000 to $34,999 | 2,718 | 8.1% |
| $35,000 to $49,999 | 3,858 | 11.5% |
| $50,000 to $74,999 | 5,771 | 17.2% |
| $75,000 to $99,999 | 4,026 | 12.0% |
| $100,000 to $149,999 | 4,160 | 12.4% |
| $150,000 to $199,999 | 2,248 | 6.7% |
| $200,000+ | 4,194 | 12.5% |
Household Income by Householder Age in Greenville
The median household income in Greenville is $65,519, with the highest median household income of $81,337 found in the 45 to 64 years age bracket for the primary householder. A total of 9,822 households (29.3%) fall into this category. Meanwhile, the 65+ years age bracket for the primary householder has the lowest median household income of $42,813, with 7,234 households (21.6%) in this group.
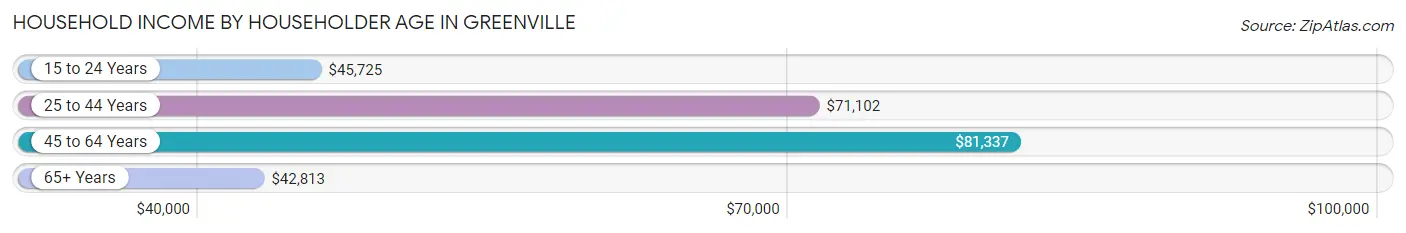
| Income Bracket | # Households | Median Income |
| 15 to 24 Years | 2,524 (7.5%) | $45,725 |
| 25 to 44 Years | 13,970 (41.6%) | $71,102 |
| 45 to 64 Years | 9,822 (29.3%) | $81,337 |
| 65+ Years | 7,234 (21.6%) | $42,813 |
| Total | 33,550 (100.0%) | $65,519 |
Poverty in Greenville
Income Below Poverty by Sex and Age in Greenville
With 13.0% poverty level for males and 15.6% for females among the residents of Greenville, under 5 year old males and under 5 year old females are the most vulnerable to poverty, with 520 males (30.8%) and 422 females (20.8%) in their respective age groups living below the poverty level.
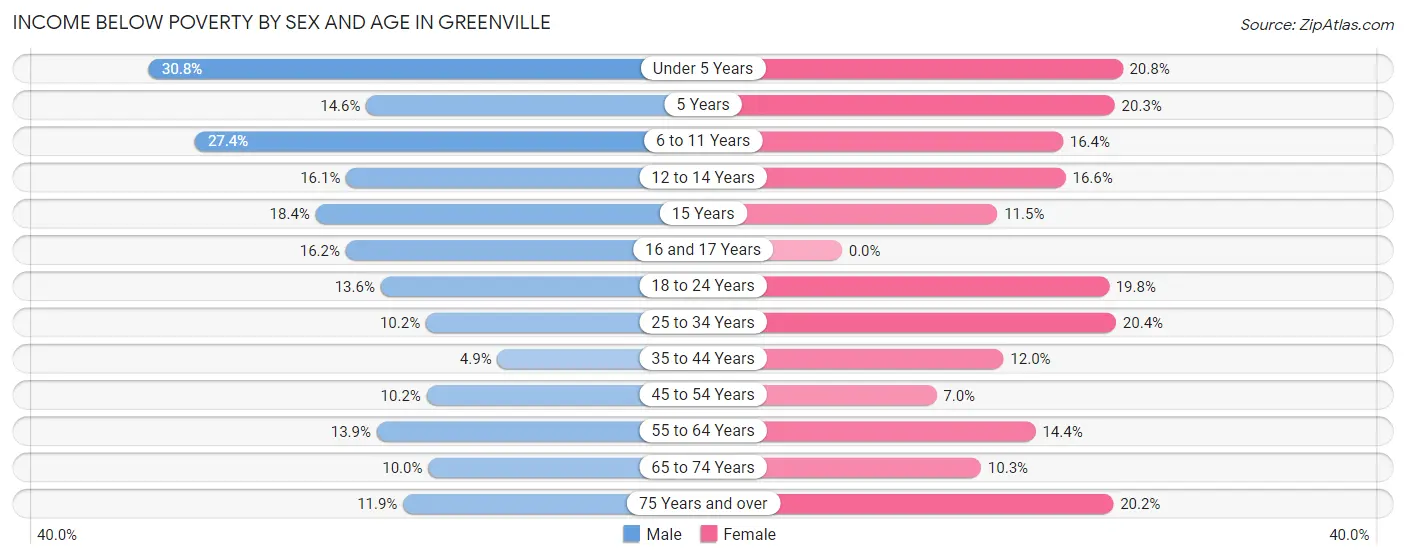
| Age Bracket | Male | Female |
| Under 5 Years | 520 (30.8%) | 422 (20.8%) |
| 5 Years | 66 (14.6%) | 78 (20.3%) |
| 6 to 11 Years | 533 (27.4%) | 309 (16.4%) |
| 12 to 14 Years | 183 (16.1%) | 158 (16.6%) |
| 15 Years | 64 (18.4%) | 30 (11.5%) |
| 16 and 17 Years | 114 (16.2%) | 0 (0.0%) |
| 18 to 24 Years | 406 (13.6%) | 711 (19.8%) |
| 25 to 34 Years | 702 (10.2%) | 1,557 (20.3%) |
| 35 to 44 Years | 194 (4.9%) | 517 (12.0%) |
| 45 to 54 Years | 392 (10.2%) | 256 (7.0%) |
| 55 to 64 Years | 491 (13.9%) | 592 (14.4%) |
| 65 to 74 Years | 253 (10.0%) | 334 (10.3%) |
| 75 Years and over | 210 (11.9%) | 517 (20.2%) |
| Total | 4,128 (13.0%) | 5,481 (15.6%) |
Income Above Poverty by Sex and Age in Greenville
According to the poverty statistics in Greenville, males aged 35 to 44 years and females aged 16 and 17 years are the age groups that are most secure financially, with 95.1% of males and 100.0% of females in these age groups living above the poverty line.
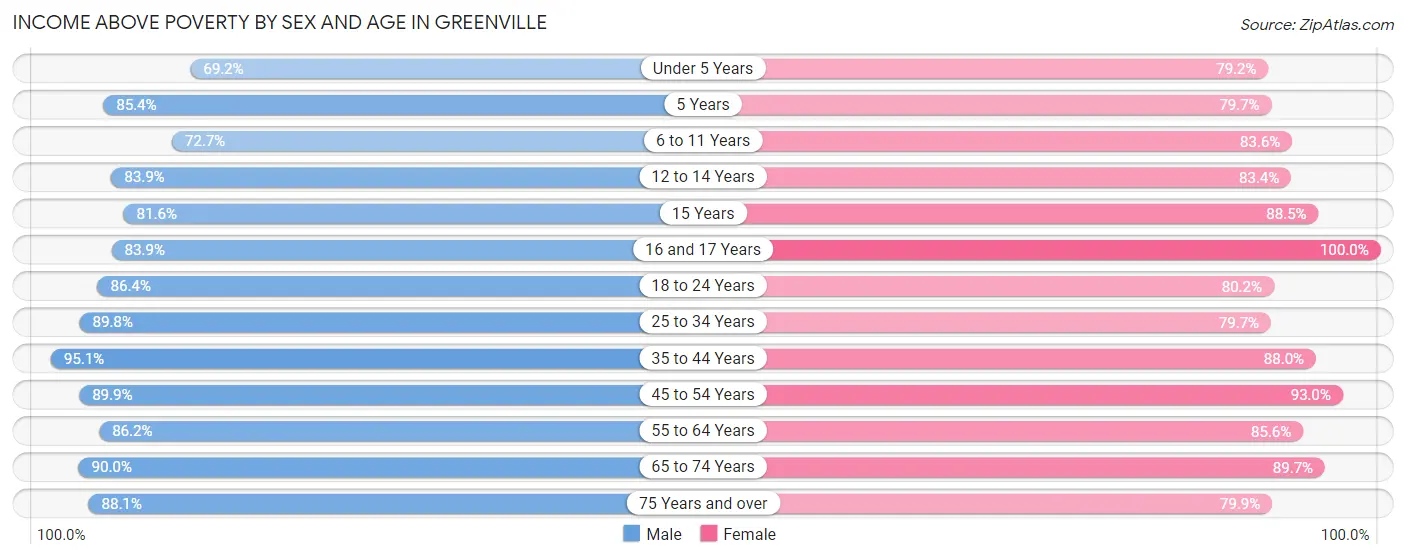
| Age Bracket | Male | Female |
| Under 5 Years | 1,170 (69.2%) | 1,603 (79.2%) |
| 5 Years | 385 (85.4%) | 307 (79.7%) |
| 6 to 11 Years | 1,416 (72.7%) | 1,574 (83.6%) |
| 12 to 14 Years | 952 (83.9%) | 793 (83.4%) |
| 15 Years | 284 (81.6%) | 230 (88.5%) |
| 16 and 17 Years | 592 (83.9%) | 442 (100.0%) |
| 18 to 24 Years | 2,588 (86.4%) | 2,876 (80.2%) |
| 25 to 34 Years | 6,179 (89.8%) | 6,095 (79.6%) |
| 35 to 44 Years | 3,772 (95.1%) | 3,792 (88.0%) |
| 45 to 54 Years | 3,470 (89.8%) | 3,389 (93.0%) |
| 55 to 64 Years | 3,054 (86.2%) | 3,526 (85.6%) |
| 65 to 74 Years | 2,269 (90.0%) | 2,898 (89.7%) |
| 75 Years and over | 1,556 (88.1%) | 2,049 (79.8%) |
| Total | 27,687 (87.0%) | 29,574 (84.4%) |
Income Below Poverty Among Married-Couple Families in Greenville
The poverty statistics for married-couple families in Greenville show that 2.2% or 251 of the total 11,206 families live below the poverty line. Families with 3 or 4 children have the highest poverty rate of 5.7%, comprising of 45 families. On the other hand, families with 5 or more children have the lowest poverty rate of 0.0%, which includes 0 families.
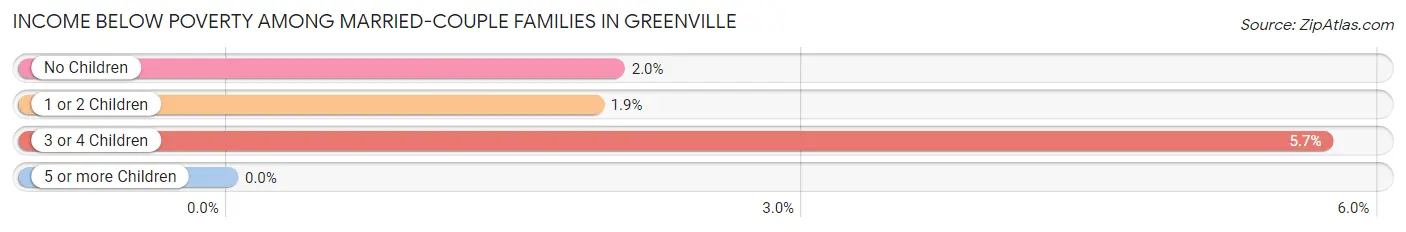
| Children | Above Poverty | Below Poverty |
| No Children | 6,997 (98.0%) | 144 (2.0%) |
| 1 or 2 Children | 3,192 (98.1%) | 62 (1.9%) |
| 3 or 4 Children | 742 (94.3%) | 45 (5.7%) |
| 5 or more Children | 24 (100.0%) | 0 (0.0%) |
| Total | 10,955 (97.8%) | 251 (2.2%) |
Income Below Poverty Among Single-Parent Households in Greenville
According to the poverty data in Greenville, 14.8% or 132 single-father households and 28.9% or 1,056 single-mother households are living below the poverty line. Among single-father households, those with 1 or 2 children have the highest poverty rate, with 110 households (27.0%) experiencing poverty. Likewise, among single-mother households, those with 3 or 4 children have the highest poverty rate, with 327 households (80.1%) falling below the poverty line.
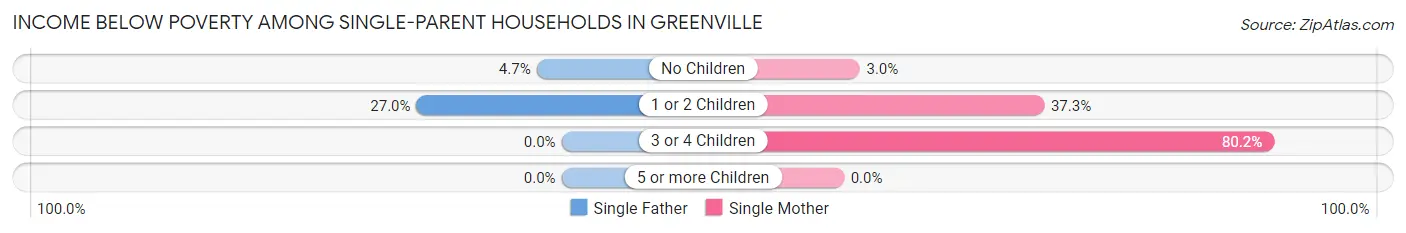
| Children | Single Father | Single Mother |
| No Children | 22 (4.6%) | 41 (3.0%) |
| 1 or 2 Children | 110 (27.0%) | 688 (37.3%) |
| 3 or 4 Children | 0 (0.0%) | 327 (80.1%) |
| 5 or more Children | 0 (0.0%) | 0 (0.0%) |
| Total | 132 (14.8%) | 1,056 (28.9%) |
Income Below Poverty Among Married-Couple vs Single-Parent Households in Greenville
The poverty data for Greenville shows that 251 of the married-couple family households (2.2%) and 1,188 of the single-parent households (26.2%) are living below the poverty level. Within the married-couple family households, those with 3 or 4 children have the highest poverty rate, with 45 households (5.7%) falling below the poverty line. Among the single-parent households, those with 3 or 4 children have the highest poverty rate, with 327 household (77.9%) living below poverty.
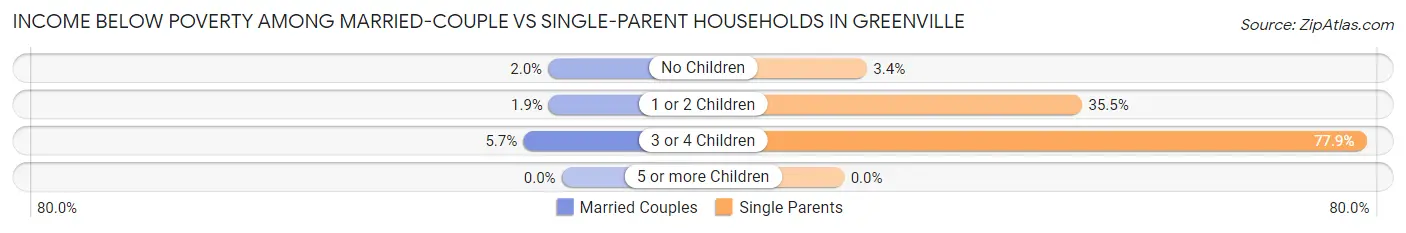
| Children | Married-Couple Families | Single-Parent Households |
| No Children | 144 (2.0%) | 63 (3.4%) |
| 1 or 2 Children | 62 (1.9%) | 798 (35.4%) |
| 3 or 4 Children | 45 (5.7%) | 327 (77.9%) |
| 5 or more Children | 0 (0.0%) | 0 (0.0%) |
| Total | 251 (2.2%) | 1,188 (26.2%) |
Race in Greenville
The most populous races in Greenville are White / Caucasian (48,081 | 67.9%), Black / African American (16,113 | 22.8%), and Hispanic or Latino (4,377 | 6.2%).
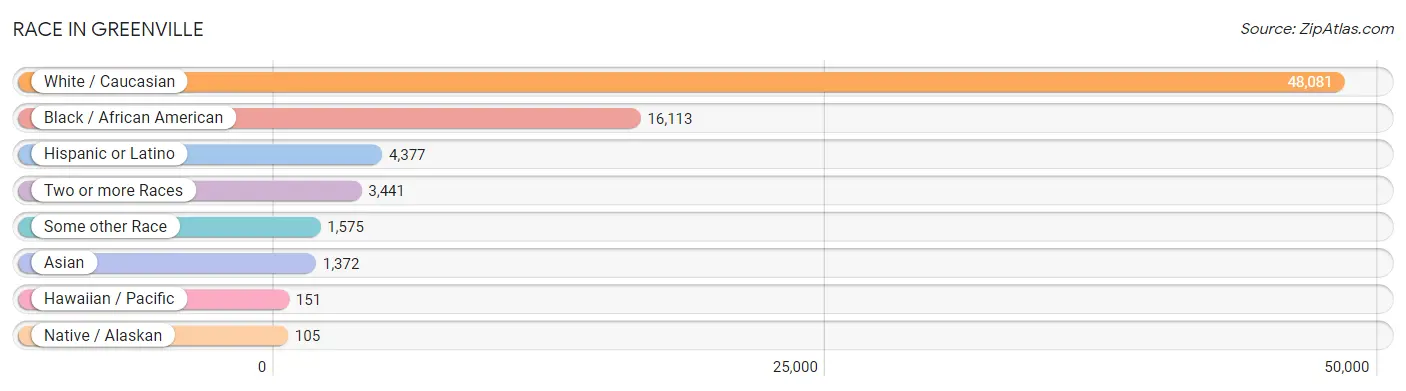
| Race | # Population | % Population |
| Asian | 1,372 | 1.9% |
| Black / African American | 16,113 | 22.8% |
| Hawaiian / Pacific | 151 | 0.2% |
| Hispanic or Latino | 4,377 | 6.2% |
| Native / Alaskan | 105 | 0.2% |
| White / Caucasian | 48,081 | 67.9% |
| Two or more Races | 3,441 | 4.9% |
| Some other Race | 1,575 | 2.2% |
| Total | 70,838 | 100.0% |
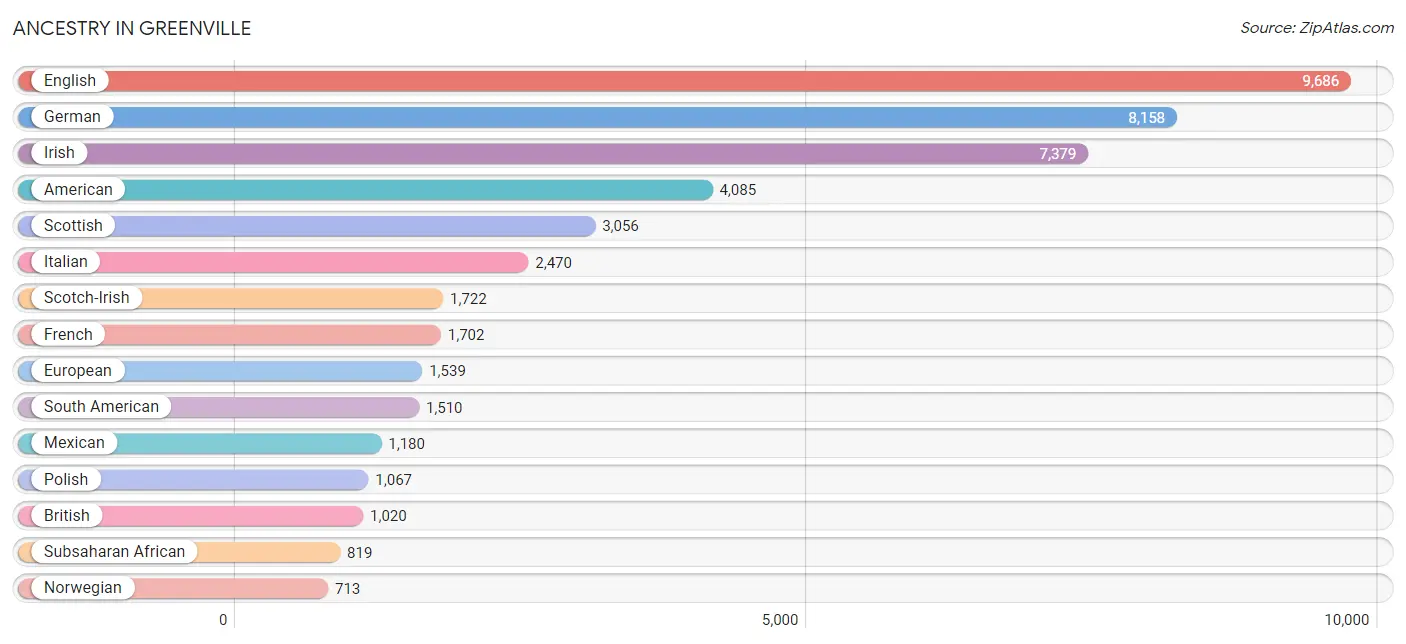
Ancestry in Greenville
The most populous ancestries reported in Greenville are English (9,686 | 13.7%), German (8,158 | 11.5%), Irish (7,379 | 10.4%), American (4,085 | 5.8%), and Scottish (3,056 | 4.3%), together accounting for 45.7% of all Greenville residents.
| Ancestry | # Population | % Population |
| African | 425 | 0.6% |
| Alsatian | 7 | 0.0% |
| American | 4,085 | 5.8% |
| Arab | 365 | 0.5% |
| Argentinean | 24 | 0.0% |
| Armenian | 251 | 0.4% |
| Australian | 35 | 0.1% |
| Austrian | 116 | 0.2% |
| Bahamian | 14 | 0.0% |
| Belgian | 70 | 0.1% |
| Belizean | 2 | 0.0% |
| Bhutanese | 138 | 0.2% |
| Blackfeet | 71 | 0.1% |
| Bolivian | 16 | 0.0% |
| Brazilian | 60 | 0.1% |
| British | 1,020 | 1.4% |
| Bulgarian | 34 | 0.1% |
| Burmese | 393 | 0.5% |
| Cambodian | 30 | 0.0% |
| Canadian | 199 | 0.3% |
| Central American | 430 | 0.6% |
| Central American Indian | 20 | 0.0% |
| Cherokee | 167 | 0.2% |
| Chilean | 30 | 0.0% |
| Choctaw | 11 | 0.0% |
| Colombian | 682 | 1.0% |
| Costa Rican | 16 | 0.0% |
| Cree | 2 | 0.0% |
| Creek | 4 | 0.0% |
| Croatian | 72 | 0.1% |
| Cuban | 135 | 0.2% |
| Czech | 130 | 0.2% |
| Czechoslovakian | 25 | 0.0% |
| Danish | 279 | 0.4% |
| Dominican | 246 | 0.4% |
| Dutch | 665 | 0.9% |
| Eastern European | 441 | 0.6% |
| Ecuadorian | 46 | 0.1% |
| Egyptian | 6 | 0.0% |
| English | 9,686 | 13.7% |
| Ethiopian | 8 | 0.0% |
| European | 1,539 | 2.2% |
| Filipino | 37 | 0.1% |
| Finnish | 129 | 0.2% |
| French | 1,702 | 2.4% |
| French Canadian | 171 | 0.2% |
| German | 8,158 | 11.5% |
| Ghanaian | 26 | 0.0% |
| Greek | 289 | 0.4% |
| Guamanian / Chamorro | 36 | 0.1% |
| Guatemalan | 221 | 0.3% |
| Haitian | 58 | 0.1% |
| Honduran | 164 | 0.2% |
| Hungarian | 150 | 0.2% |
| Icelander | 4 | 0.0% |
| Indian (Asian) | 573 | 0.8% |
| Iranian | 12 | 0.0% |
| Irish | 7,379 | 10.4% |
| Iroquois | 10 | 0.0% |
| Italian | 2,470 | 3.5% |
| Jamaican | 316 | 0.4% |
| Japanese | 29 | 0.0% |
| Korean | 252 | 0.4% |
| Laotian | 14 | 0.0% |
| Latvian | 7 | 0.0% |
| Lebanese | 224 | 0.3% |
| Liberian | 7 | 0.0% |
| Lithuanian | 42 | 0.1% |
| Lumbee | 35 | 0.1% |
| Luxembourger | 27 | 0.0% |
| Malaysian | 13 | 0.0% |
| Mexican | 1,180 | 1.7% |
| Mexican American Indian | 65 | 0.1% |
| Moroccan | 10 | 0.0% |
| Native Hawaiian | 54 | 0.1% |
| New Zealander | 23 | 0.0% |
| Nicaraguan | 5 | 0.0% |
| Nigerian | 354 | 0.5% |
| Northern European | 229 | 0.3% |
| Norwegian | 713 | 1.0% |
| Pakistani | 20 | 0.0% |
| Palestinian | 41 | 0.1% |
| Panamanian | 24 | 0.0% |
| Paraguayan | 20 | 0.0% |
| Pennsylvania German | 27 | 0.0% |
| Peruvian | 62 | 0.1% |
| Polish | 1,067 | 1.5% |
| Portuguese | 229 | 0.3% |
| Potawatomi | 6 | 0.0% |
| Puerto Rican | 504 | 0.7% |
| Romanian | 53 | 0.1% |
| Russian | 327 | 0.5% |
| Scandinavian | 87 | 0.1% |
| Scotch-Irish | 1,722 | 2.4% |
| Scottish | 3,056 | 4.3% |
| Serbian | 32 | 0.1% |
| Slovak | 73 | 0.1% |
| Slovene | 11 | 0.0% |
| South African | 14 | 0.0% |
| South American | 1,510 | 2.1% |
| South American Indian | 16 | 0.0% |
| Spaniard | 203 | 0.3% |
| Spanish | 58 | 0.1% |
| Sri Lankan | 65 | 0.1% |
| Subsaharan African | 819 | 1.2% |
| Swedish | 683 | 1.0% |
| Swiss | 162 | 0.2% |
| Syrian | 50 | 0.1% |
| Thai | 537 | 0.8% |
| Trinidadian and Tobagonian | 69 | 0.1% |
| Turkish | 123 | 0.2% |
| Ugandan | 6 | 0.0% |
| Ukrainian | 53 | 0.1% |
| Uruguayan | 104 | 0.2% |
| Venezuelan | 526 | 0.7% |
| Welsh | 413 | 0.6% |
| West Indian | 35 | 0.1% |
| Yugoslavian | 105 | 0.2% |
| Zimbabwean | 4 | 0.0% | View All 119 Rows |
Immigrants in Greenville
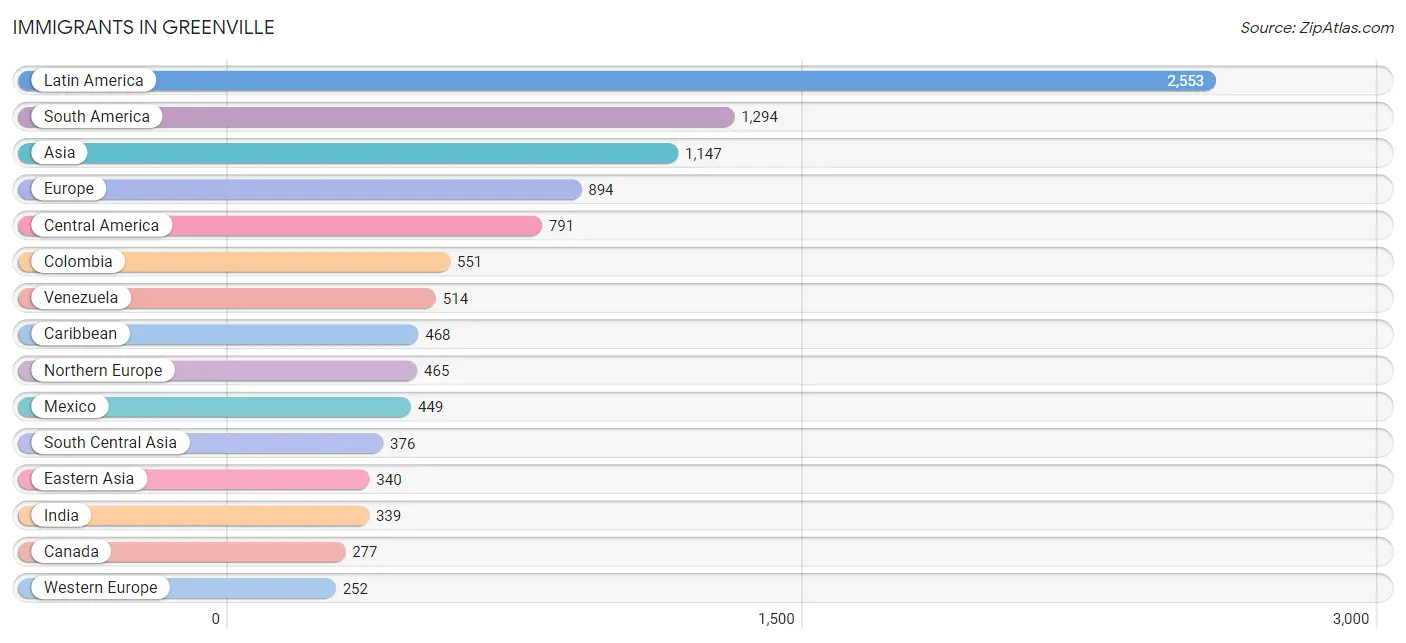
The most numerous immigrant groups reported in Greenville came from Latin America (2,553 | 3.6%), South America (1,294 | 1.8%), Asia (1,147 | 1.6%), Europe (894 | 1.3%), and Central America (791 | 1.1%), together accounting for 9.4% of all Greenville residents.
| Immigration Origin | # Population | % Population |
| Africa | 133 | 0.2% |
| Argentina | 11 | 0.0% |
| Armenia | 3 | 0.0% |
| Asia | 1,147 | 1.6% |
| Australia | 34 | 0.1% |
| Austria | 26 | 0.0% |
| Bahamas | 8 | 0.0% |
| Belize | 2 | 0.0% |
| Bolivia | 16 | 0.0% |
| Brazil | 70 | 0.1% |
| Bulgaria | 7 | 0.0% |
| Cambodia | 29 | 0.0% |
| Canada | 277 | 0.4% |
| Caribbean | 468 | 0.7% |
| Central America | 791 | 1.1% |
| Chile | 8 | 0.0% |
| China | 203 | 0.3% |
| Colombia | 551 | 0.8% |
| Costa Rica | 16 | 0.0% |
| Cuba | 22 | 0.0% |
| Czechoslovakia | 12 | 0.0% |
| Denmark | 21 | 0.0% |
| Dominican Republic | 201 | 0.3% |
| Eastern Africa | 22 | 0.0% |
| Eastern Asia | 340 | 0.5% |
| Eastern Europe | 93 | 0.1% |
| Ecuador | 3 | 0.0% |
| Egypt | 6 | 0.0% |
| England | 177 | 0.3% |
| Ethiopia | 8 | 0.0% |
| Europe | 894 | 1.3% |
| France | 105 | 0.2% |
| Germany | 96 | 0.1% |
| Greece | 13 | 0.0% |
| Guatemala | 196 | 0.3% |
| Haiti | 68 | 0.1% |
| Honduras | 120 | 0.2% |
| India | 339 | 0.5% |
| Indonesia | 5 | 0.0% |
| Iran | 25 | 0.0% |
| Ireland | 14 | 0.0% |
| Italy | 10 | 0.0% |
| Jamaica | 124 | 0.2% |
| Japan | 40 | 0.1% |
| Jordan | 74 | 0.1% |
| Korea | 82 | 0.1% |
| Latin America | 2,553 | 3.6% |
| Liberia | 7 | 0.0% |
| Mexico | 449 | 0.6% |
| Micronesia | 56 | 0.1% |
| Moldova | 10 | 0.0% |
| Netherlands | 19 | 0.0% |
| Nigeria | 51 | 0.1% |
| North Macedonia | 18 | 0.0% |
| Northern Africa | 18 | 0.0% |
| Northern Europe | 465 | 0.7% |
| Oceania | 102 | 0.1% |
| Panama | 8 | 0.0% |
| Peru | 17 | 0.0% |
| Philippines | 94 | 0.1% |
| Portugal | 15 | 0.0% |
| Romania | 11 | 0.0% |
| Russia | 18 | 0.0% |
| Saudi Arabia | 11 | 0.0% |
| Scotland | 104 | 0.2% |
| South Africa | 15 | 0.0% |
| South America | 1,294 | 1.8% |
| South Central Asia | 376 | 0.5% |
| South Eastern Asia | 223 | 0.3% |
| Southern Europe | 84 | 0.1% |
| Spain | 46 | 0.1% |
| Sri Lanka | 12 | 0.0% |
| Switzerland | 6 | 0.0% |
| Syria | 50 | 0.1% |
| Thailand | 47 | 0.1% |
| Trinidad and Tobago | 45 | 0.1% |
| Turkey | 70 | 0.1% |
| Uganda | 10 | 0.0% |
| Ukraine | 17 | 0.0% |
| Uruguay | 104 | 0.2% |
| Venezuela | 514 | 0.7% |
| Vietnam | 48 | 0.1% |
| Western Africa | 78 | 0.1% |
| Western Asia | 208 | 0.3% |
| Western Europe | 252 | 0.4% |
| Zimbabwe | 4 | 0.0% | View All 86 Rows |
Sex and Age in Greenville
Sex and Age in Greenville
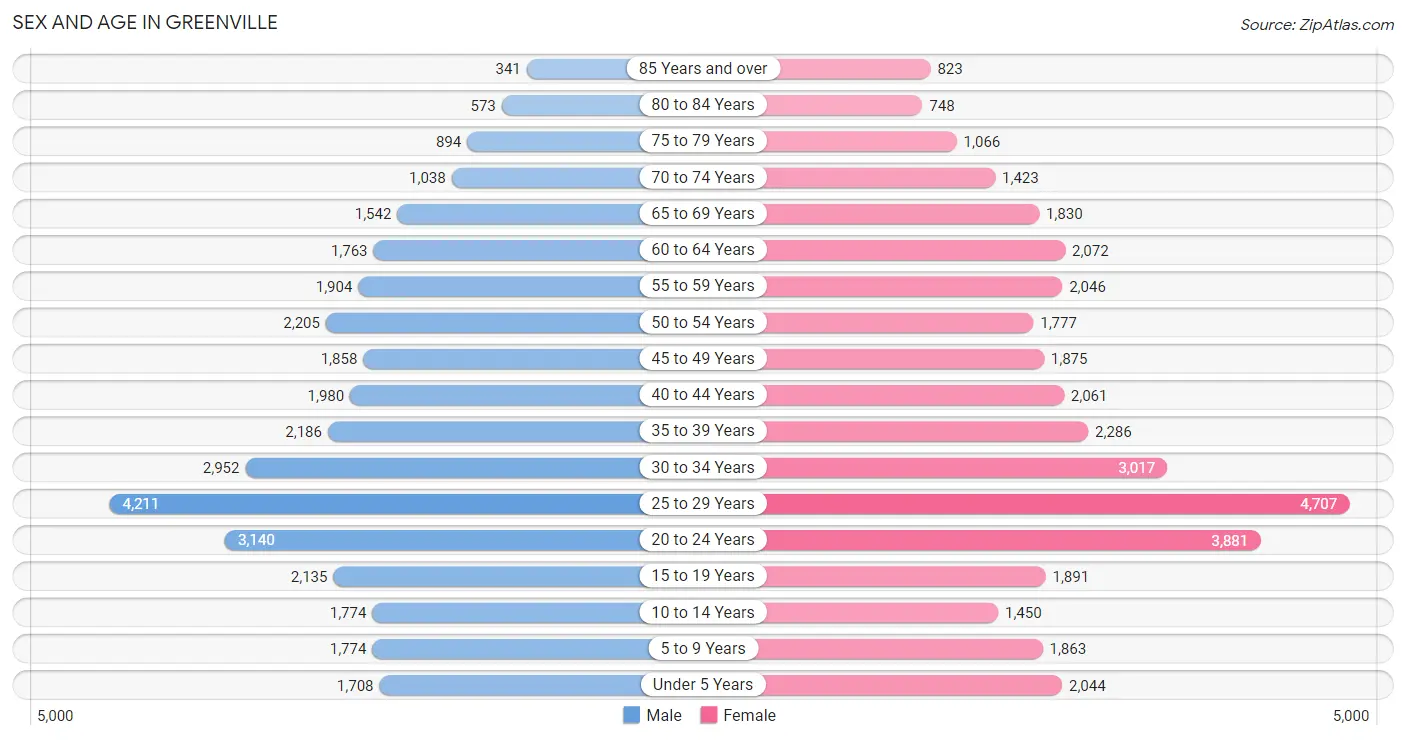
The most populous age groups in Greenville are 25 to 29 Years (4,211 | 12.4%) for men and 25 to 29 Years (4,707 | 12.8%) for women.
| Age Bracket | Male | Female |
| Under 5 Years | 1,708 (5.0%) | 2,044 (5.6%) |
| 5 to 9 Years | 1,774 (5.2%) | 1,863 (5.1%) |
| 10 to 14 Years | 1,774 (5.2%) | 1,450 (3.9%) |
| 15 to 19 Years | 2,135 (6.3%) | 1,891 (5.1%) |
| 20 to 24 Years | 3,140 (9.2%) | 3,881 (10.5%) |
| 25 to 29 Years | 4,211 (12.4%) | 4,707 (12.8%) |
| 30 to 34 Years | 2,952 (8.7%) | 3,017 (8.2%) |
| 35 to 39 Years | 2,186 (6.4%) | 2,286 (6.2%) |
| 40 to 44 Years | 1,980 (5.8%) | 2,061 (5.6%) |
| 45 to 49 Years | 1,858 (5.5%) | 1,875 (5.1%) |
| 50 to 54 Years | 2,205 (6.5%) | 1,777 (4.8%) |
| 55 to 59 Years | 1,904 (5.6%) | 2,046 (5.6%) |
| 60 to 64 Years | 1,763 (5.2%) | 2,072 (5.6%) |
| 65 to 69 Years | 1,542 (4.5%) | 1,830 (5.0%) |
| 70 to 74 Years | 1,038 (3.0%) | 1,423 (3.9%) |
| 75 to 79 Years | 894 (2.6%) | 1,066 (2.9%) |
| 80 to 84 Years | 573 (1.7%) | 748 (2.0%) |
| 85 Years and over | 341 (1.0%) | 823 (2.2%) |
| Total | 33,978 (100.0%) | 36,860 (100.0%) |
Families and Households in Greenville
Median Family Size in Greenville
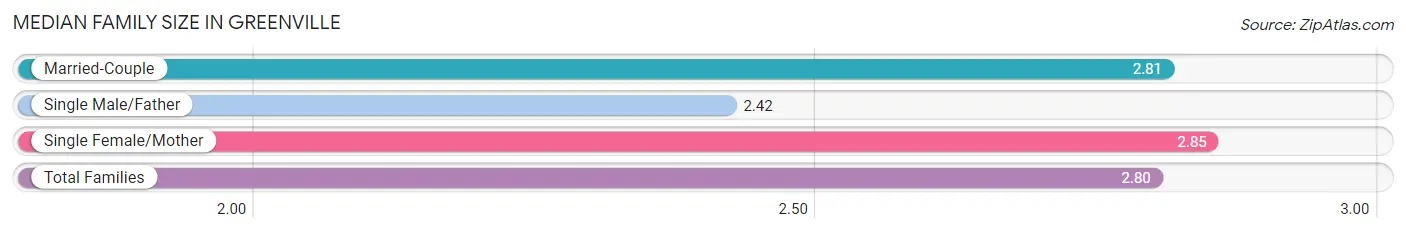
The median family size in Greenville is 2.80 persons per family, with single female/mother families (3,650 | 23.2%) accounting for the largest median family size of 2.85 persons per family. On the other hand, single male/father families (892 | 5.7%) represent the smallest median family size with 2.42 persons per family.
| Family Type | # Families | Family Size |
| Married-Couple | 11,206 (71.2%) | 2.81 |
| Single Male/Father | 892 (5.7%) | 2.42 |
| Single Female/Mother | 3,650 (23.2%) | 2.85 |
| Total Families | 15,748 (100.0%) | 2.80 |
Median Household Size in Greenville
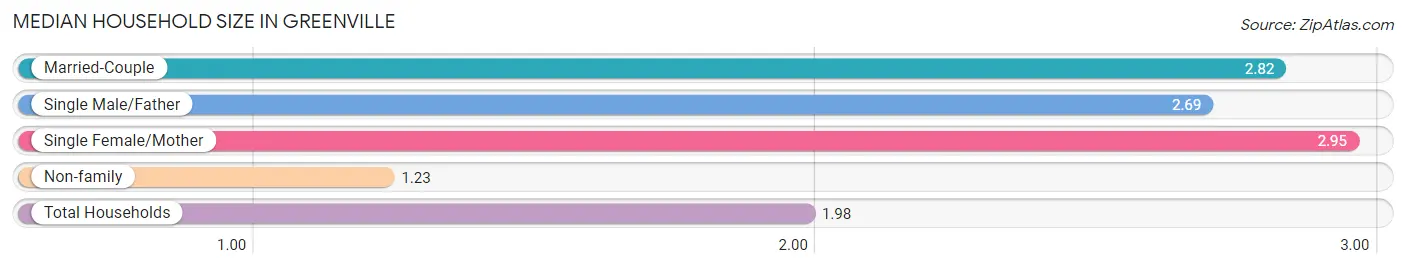
The median household size in Greenville is 1.98 persons per household, with single female/mother households (3,650 | 10.9%) accounting for the largest median household size of 2.95 persons per household. non-family households (17,802 | 53.1%) represent the smallest median household size with 1.23 persons per household.
| Household Type | # Households | Household Size |
| Married-Couple | 11,206 (33.4%) | 2.82 |
| Single Male/Father | 892 (2.7%) | 2.69 |
| Single Female/Mother | 3,650 (10.9%) | 2.95 |
| Non-family | 17,802 (53.1%) | 1.23 |
| Total Households | 33,550 (100.0%) | 1.98 |
Household Size by Marriage Status in Greenville
Out of a total of 33,550 households in Greenville, 15,748 (46.9%) are family households, while 17,802 (53.1%) are nonfamily households. The most numerous type of family households are 2-person households, comprising 8,687, and the most common type of nonfamily households are 1-person households, comprising 14,313.
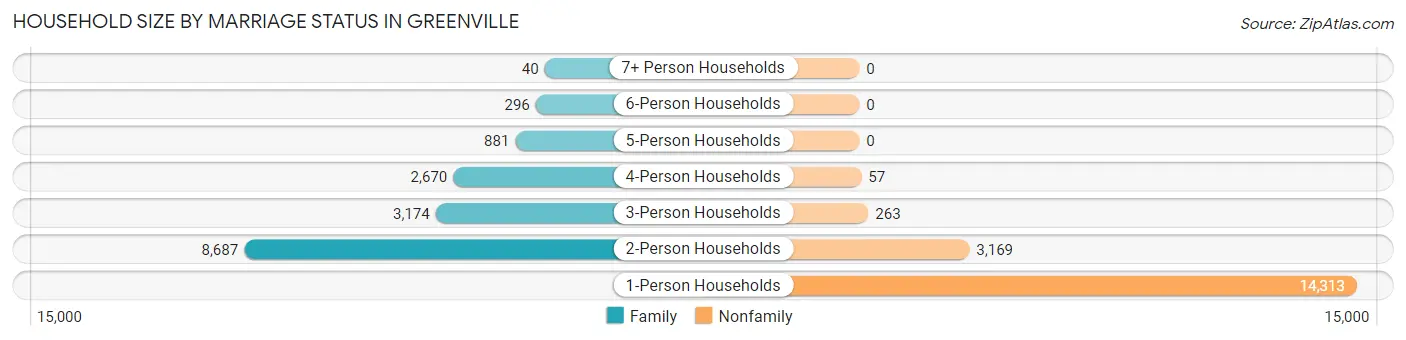
| Household Size | Family Households | Nonfamily Households |
| 1-Person Households | - | 14,313 (42.7%) |
| 2-Person Households | 8,687 (25.9%) | 3,169 (9.5%) |
| 3-Person Households | 3,174 (9.5%) | 263 (0.8%) |
| 4-Person Households | 2,670 (8.0%) | 57 (0.2%) |
| 5-Person Households | 881 (2.6%) | 0 (0.0%) |
| 6-Person Households | 296 (0.9%) | 0 (0.0%) |
| 7+ Person Households | 40 (0.1%) | 0 (0.0%) |
| Total | 15,748 (46.9%) | 17,802 (53.1%) |
Female Fertility in Greenville
Fertility by Age in Greenville
Average fertility rate in Greenville is 49.0 births per 1,000 women. Women in the age bracket of 20 to 34 years have the highest fertility rate with 59.0 births per 1,000 women. Women in the age bracket of 20 to 34 years acount for 69.8% of all women with births.
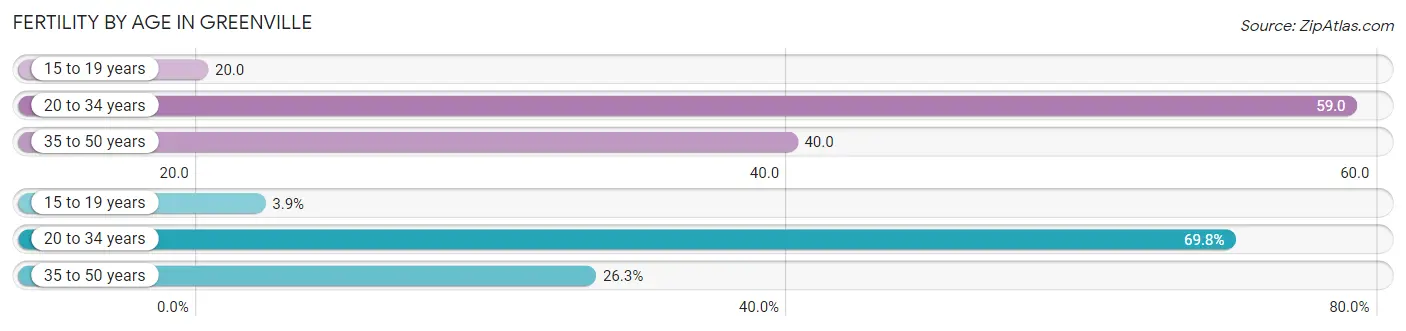
| Age Bracket | Women with Births | Births / 1,000 Women |
| 15 to 19 years | 38 (3.9%) | 20.0 |
| 20 to 34 years | 681 (69.8%) | 59.0 |
| 35 to 50 years | 257 (26.3%) | 40.0 |
| Total | 976 (100.0%) | 49.0 |
Fertility by Age by Marriage Status in Greenville
72.1% of women with births (976) in Greenville are married. The highest percentage of unmarried women with births falls into 15 to 19 years age bracket with 100.0% of them unmarried at the time of birth, while the lowest percentage of unmarried women with births belong to 35 to 50 years age bracket with 0.0% of them unmarried.
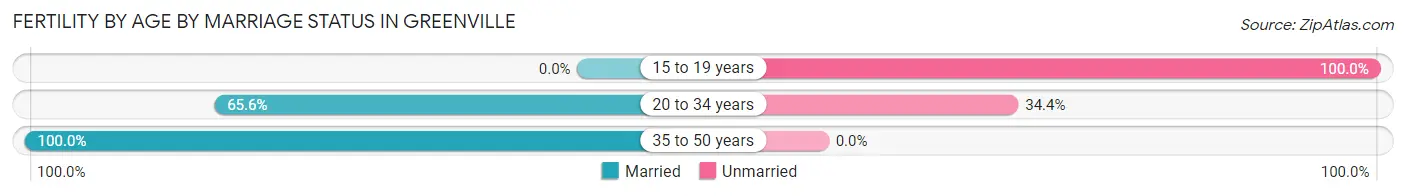
| Age Bracket | Married | Unmarried |
| 15 to 19 years | 0 (0.0%) | 38 (100.0%) |
| 20 to 34 years | 447 (65.6%) | 234 (34.4%) |
| 35 to 50 years | 257 (100.0%) | 0 (0.0%) |
| Total | 704 (72.1%) | 272 (27.9%) |
Fertility by Education in Greenville
Average fertility rate in Greenville is 49.0 births per 1,000 women. Women with the education attainment of graduate degree have the highest fertility rate of 90.0 births per 1,000 women, while women with the education attainment of college or associate's degree have the lowest fertility at 2.0 births per 1,000 women. Women with the education attainment of bachelor's degree represent 37.2% of all women with births.
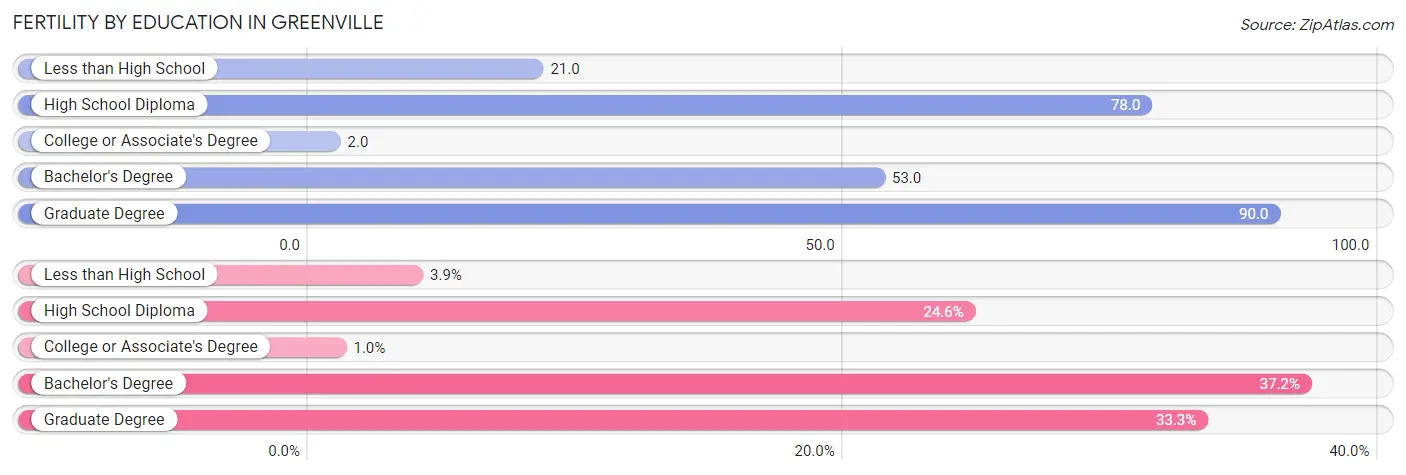
| Educational Attainment | Women with Births | Births / 1,000 Women |
| Less than High School | 38 (3.9%) | 21.0 |
| High School Diploma | 240 (24.6%) | 78.0 |
| College or Associate's Degree | 10 (1.0%) | 2.0 |
| Bachelor's Degree | 363 (37.2%) | 53.0 |
| Graduate Degree | 325 (33.3%) | 90.0 |
| Total | 976 (100.0%) | 49.0 |
Fertility by Education by Marriage Status in Greenville
27.9% of women with births in Greenville are unmarried. Women with the educational attainment of college or associate's degree are most likely to be married with 100.0% of them married at childbirth, while women with the educational attainment of less than high school are least likely to be married with 100.0% of them unmarried at childbirth.
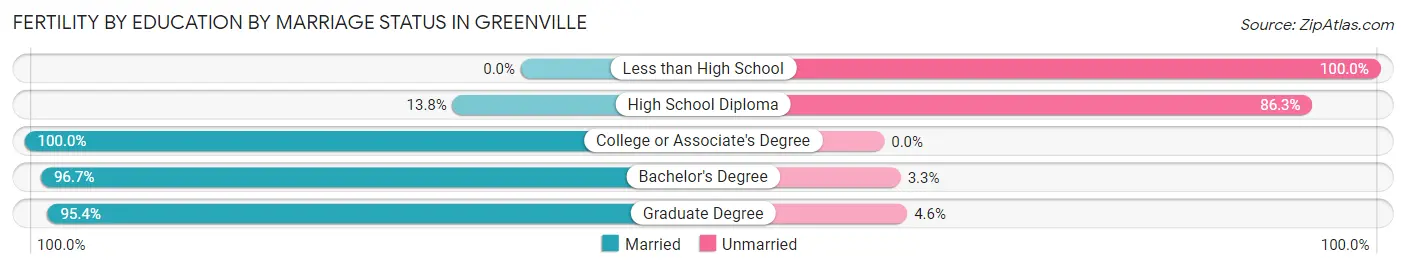
| Educational Attainment | Married | Unmarried |
| Less than High School | 0 (0.0%) | 38 (100.0%) |
| High School Diploma | 33 (13.8%) | 207 (86.3%) |
| College or Associate's Degree | 10 (100.0%) | 0 (0.0%) |
| Bachelor's Degree | 351 (96.7%) | 12 (3.3%) |
| Graduate Degree | 310 (95.4%) | 15 (4.6%) |
| Total | 704 (72.1%) | 272 (27.9%) |
Employment Characteristics in Greenville
Employment by Class of Employer in Greenville
Among the 38,184 employed individuals in Greenville, private company employees (27,376 | 71.7%), not-for-profit organizations (3,833 | 10.0%), and self-employed (not incorporated) (1,756 | 4.6%) make up the most common classes of employment.
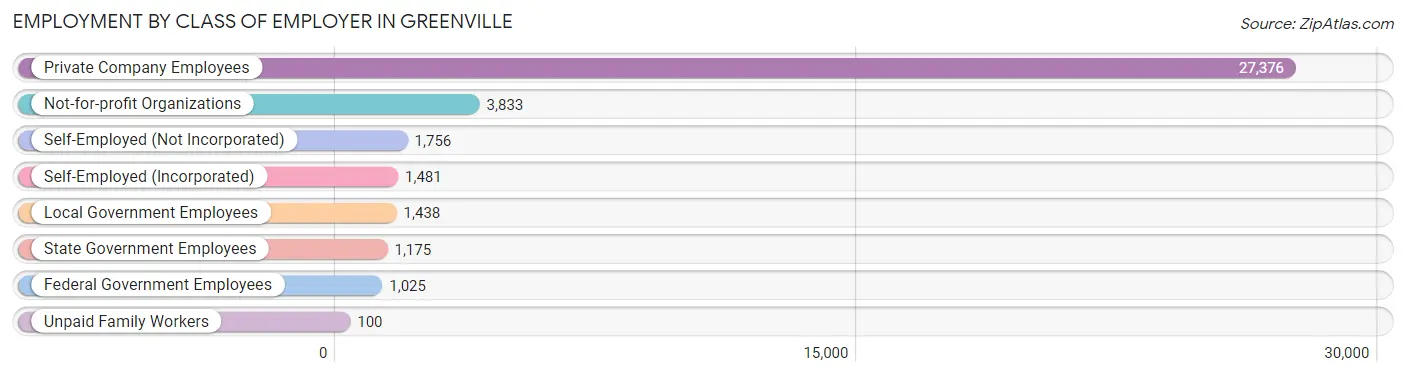
| Employer Class | # Employees | % Employees |
| Private Company Employees | 27,376 | 71.7% |
| Self-Employed (Incorporated) | 1,481 | 3.9% |
| Self-Employed (Not Incorporated) | 1,756 | 4.6% |
| Not-for-profit Organizations | 3,833 | 10.0% |
| Local Government Employees | 1,438 | 3.8% |
| State Government Employees | 1,175 | 3.1% |
| Federal Government Employees | 1,025 | 2.7% |
| Unpaid Family Workers | 100 | 0.3% |
| Total | 38,184 | 100.0% |
Employment Status by Age in Greenville
According to the labor force statistics for Greenville, out of the total population over 16 years of age (59,614), 68.5% or 40,836 individuals are in the labor force, with 3.8% or 1,552 of them unemployed. The age group with the highest labor force participation rate is 30 to 34 years, with 86.6% or 5,169 individuals in the labor force. Within the labor force, the 16 to 19 years age range has the highest percentage of unemployed individuals, with 8.1% or 129 of them being unemployed.
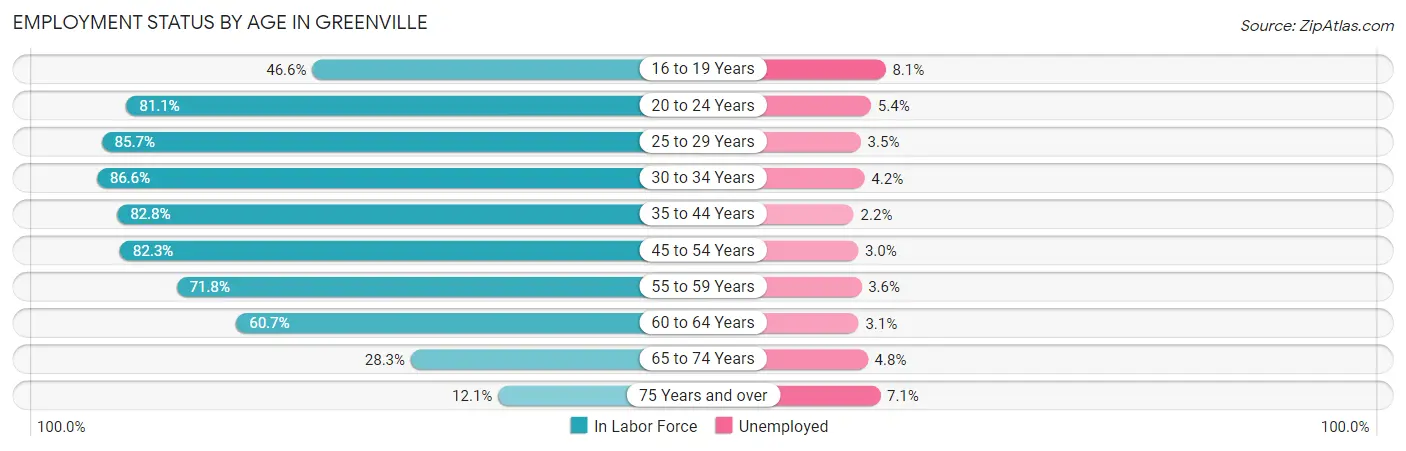
| Age Bracket | In Labor Force | Unemployed |
| 16 to 19 Years | 1,591 (46.6%) | 129 (8.1%) |
| 20 to 24 Years | 5,694 (81.1%) | 307 (5.4%) |
| 25 to 29 Years | 7,643 (85.7%) | 268 (3.5%) |
| 30 to 34 Years | 5,169 (86.6%) | 217 (4.2%) |
| 35 to 44 Years | 7,049 (82.8%) | 155 (2.2%) |
| 45 to 54 Years | 6,349 (82.3%) | 190 (3.0%) |
| 55 to 59 Years | 2,836 (71.8%) | 102 (3.6%) |
| 60 to 64 Years | 2,328 (60.7%) | 72 (3.1%) |
| 65 to 74 Years | 1,651 (28.3%) | 79 (4.8%) |
| 75 Years and over | 538 (12.1%) | 38 (7.1%) |
| Total | 40,836 (68.5%) | 1,552 (3.8%) |
Employment Status by Educational Attainment in Greenville
According to labor force statistics for Greenville, 80.7% of individuals (31,392) out of the total population between 25 and 64 years of age (38,900) are in the labor force, with 3.2% or 1,005 of them being unemployed. The group with the highest labor force participation rate are those with the educational attainment of bachelor's degree or higher, with 87.1% or 18,916 individuals in the labor force. Within the labor force, individuals with less than high school education have the highest percentage of unemployment, with 5.8% or 71 of them being unemployed.
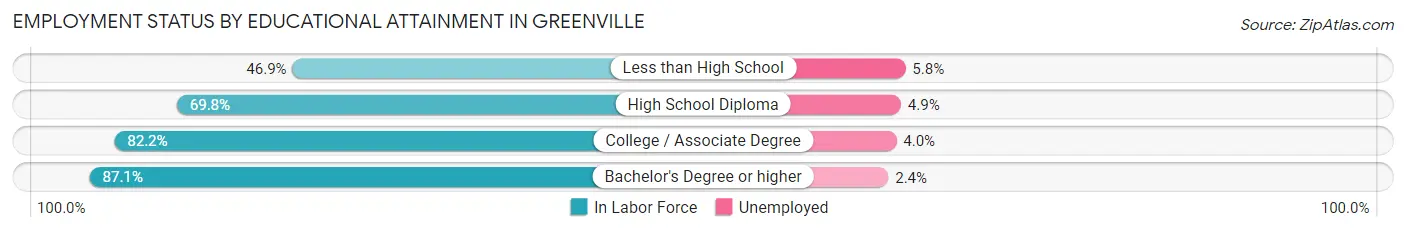
| Educational Attainment | In Labor Force | Unemployed |
| Less than High School | 1,218 (46.9%) | 151 (5.8%) |
| High School Diploma | 4,273 (69.8%) | 300 (4.9%) |
| College / Associate Degree | 6,957 (82.2%) | 339 (4.0%) |
| Bachelor's Degree or higher | 18,916 (87.1%) | 521 (2.4%) |
| Total | 31,392 (80.7%) | 1,245 (3.2%) |
Employment Occupations by Sex in Greenville
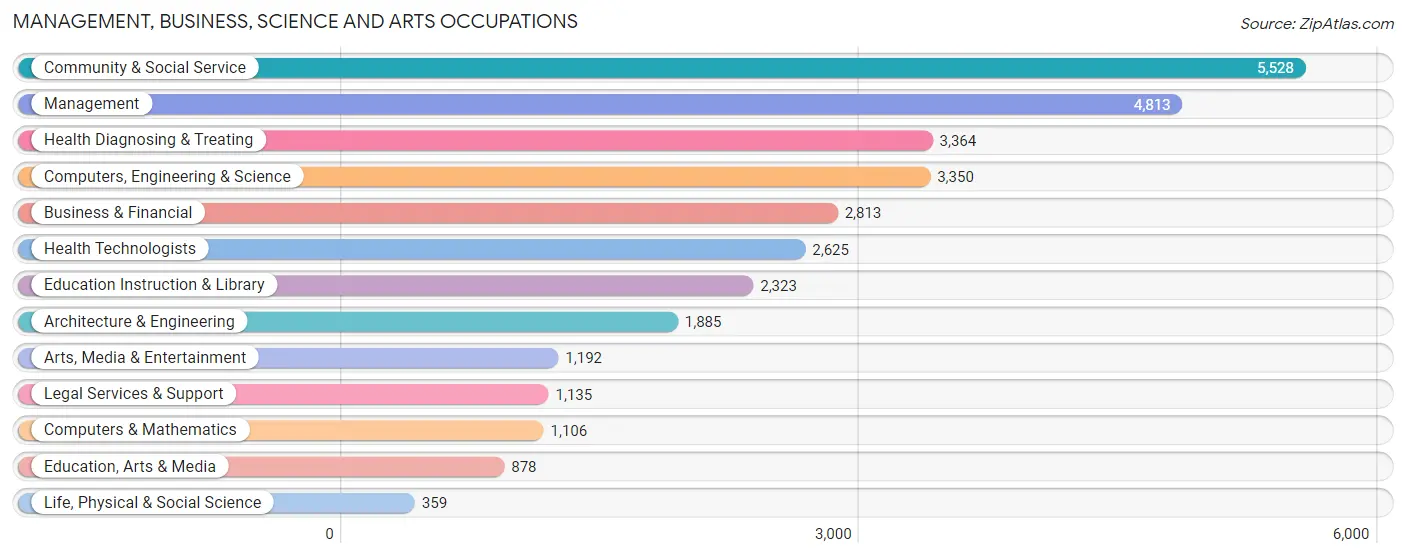
Management, Business, Science and Arts Occupations
The most common Management, Business, Science and Arts occupations in Greenville are Community & Social Service (5,528 | 14.1%), Management (4,813 | 12.3%), Health Diagnosing & Treating (3,364 | 8.6%), Computers, Engineering & Science (3,350 | 8.6%), and Business & Financial (2,813 | 7.2%).
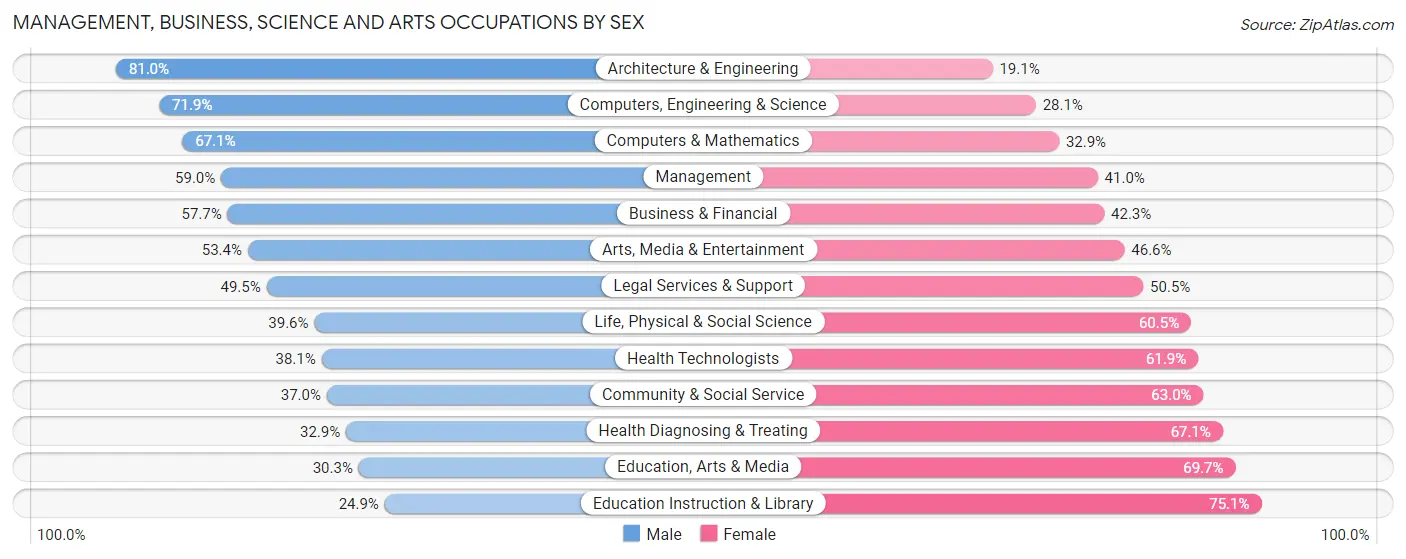
Management, Business, Science and Arts Occupations by Sex
Within the Management, Business, Science and Arts occupations in Greenville, the most male-oriented occupations are Architecture & Engineering (80.9%), Computers, Engineering & Science (71.9%), and Computers & Mathematics (67.1%), while the most female-oriented occupations are Education Instruction & Library (75.1%), Education, Arts & Media (69.7%), and Health Diagnosing & Treating (67.1%).
| Occupation | Male | Female |
| Management | 2,840 (59.0%) | 1,973 (41.0%) |
| Business & Financial | 1,622 (57.7%) | 1,191 (42.3%) |
| Computers, Engineering & Science | 2,410 (71.9%) | 940 (28.1%) |
| Computers & Mathematics | 742 (67.1%) | 364 (32.9%) |
| Architecture & Engineering | 1,526 (80.9%) | 359 (19.1%) |
| Life, Physical & Social Science | 142 (39.6%) | 217 (60.5%) |
| Community & Social Service | 2,043 (37.0%) | 3,485 (63.0%) |
| Education, Arts & Media | 266 (30.3%) | 612 (69.7%) |
| Legal Services & Support | 562 (49.5%) | 573 (50.5%) |
| Education Instruction & Library | 578 (24.9%) | 1,745 (75.1%) |
| Arts, Media & Entertainment | 637 (53.4%) | 555 (46.6%) |
| Health Diagnosing & Treating | 1,108 (32.9%) | 2,256 (67.1%) |
| Health Technologists | 999 (38.1%) | 1,626 (61.9%) |
| Total (Category) | 10,023 (50.4%) | 9,845 (49.5%) |
| Total (Overall) | 19,774 (50.4%) | 19,425 (49.5%) |
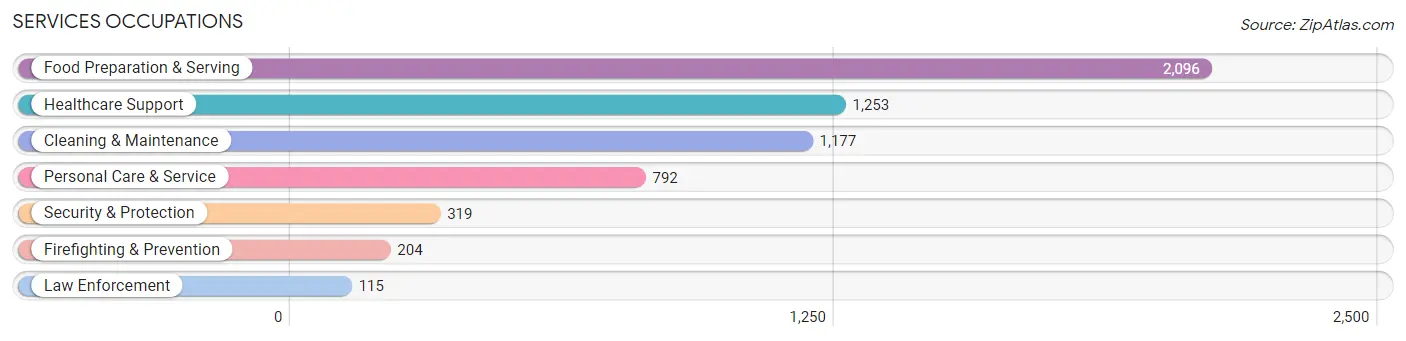
Services Occupations
The most common Services occupations in Greenville are Food Preparation & Serving (2,096 | 5.3%), Healthcare Support (1,253 | 3.2%), Cleaning & Maintenance (1,177 | 3.0%), Personal Care & Service (792 | 2.0%), and Security & Protection (319 | 0.8%).
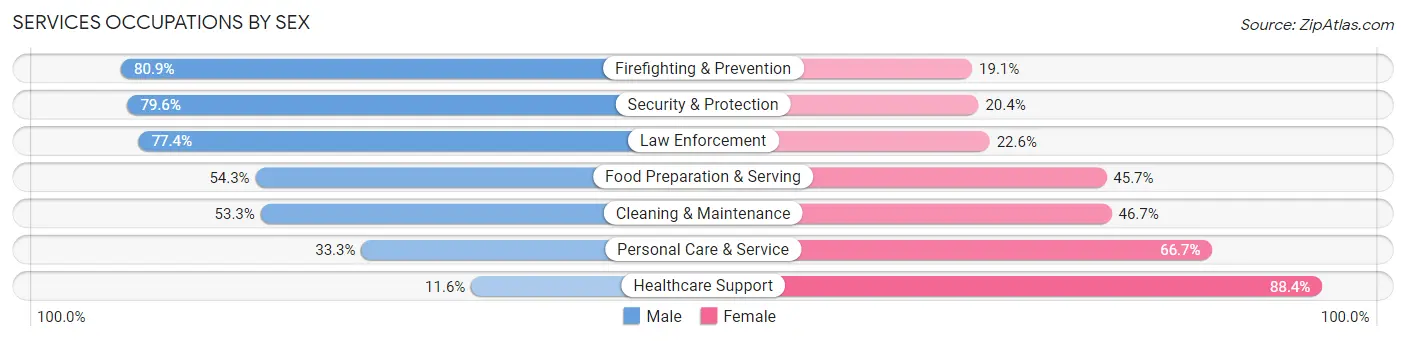
Services Occupations by Sex
Within the Services occupations in Greenville, the most male-oriented occupations are Firefighting & Prevention (80.9%), Security & Protection (79.6%), and Law Enforcement (77.4%), while the most female-oriented occupations are Healthcare Support (88.4%), Personal Care & Service (66.7%), and Cleaning & Maintenance (46.7%).
| Occupation | Male | Female |
| Healthcare Support | 145 (11.6%) | 1,108 (88.4%) |
| Security & Protection | 254 (79.6%) | 65 (20.4%) |
| Firefighting & Prevention | 165 (80.9%) | 39 (19.1%) |
| Law Enforcement | 89 (77.4%) | 26 (22.6%) |
| Food Preparation & Serving | 1,138 (54.3%) | 958 (45.7%) |
| Cleaning & Maintenance | 627 (53.3%) | 550 (46.7%) |
| Personal Care & Service | 264 (33.3%) | 528 (66.7%) |
| Total (Category) | 2,428 (43.1%) | 3,209 (56.9%) |
| Total (Overall) | 19,774 (50.4%) | 19,425 (49.5%) |
Sales and Office Occupations
The most common Sales and Office occupations in Greenville are Sales & Related (4,044 | 10.3%), and Office & Administration (3,971 | 10.1%).

Sales and Office Occupations by Sex
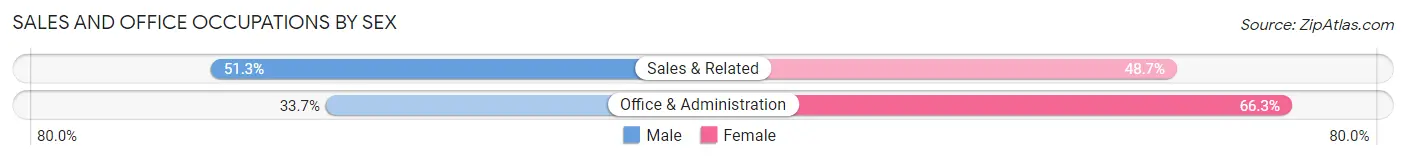
| Occupation | Male | Female |
| Sales & Related | 2,076 (51.3%) | 1,968 (48.7%) |
| Office & Administration | 1,337 (33.7%) | 2,634 (66.3%) |
| Total (Category) | 3,413 (42.6%) | 4,602 (57.4%) |
| Total (Overall) | 19,774 (50.4%) | 19,425 (49.5%) |
Natural Resources, Construction and Maintenance Occupations
The most common Natural Resources, Construction and Maintenance occupations in Greenville are Construction & Extraction (918 | 2.3%), Installation, Maintenance & Repair (623 | 1.6%), and Farming, Fishing & Forestry (91 | 0.2%).

Natural Resources, Construction and Maintenance Occupations by Sex
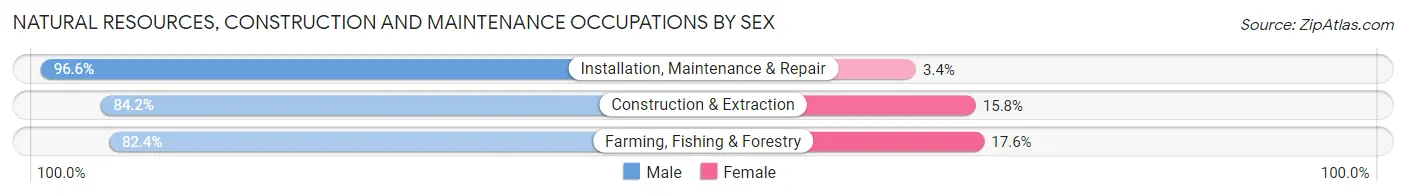
| Occupation | Male | Female |
| Farming, Fishing & Forestry | 75 (82.4%) | 16 (17.6%) |
| Construction & Extraction | 773 (84.2%) | 145 (15.8%) |
| Installation, Maintenance & Repair | 602 (96.6%) | 21 (3.4%) |
| Total (Category) | 1,450 (88.8%) | 182 (11.2%) |
| Total (Overall) | 19,774 (50.4%) | 19,425 (49.5%) |
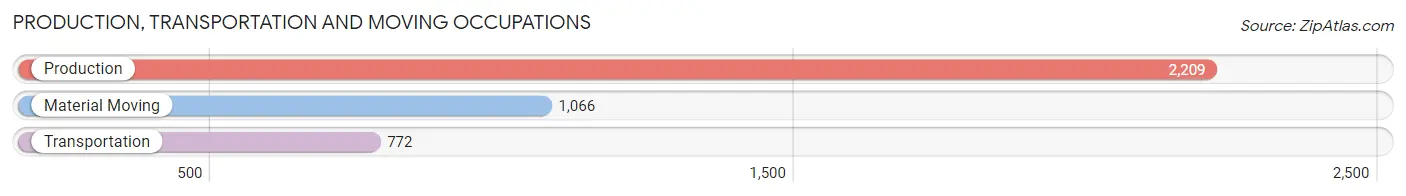
Production, Transportation and Moving Occupations
The most common Production, Transportation and Moving occupations in Greenville are Production (2,209 | 5.6%), Material Moving (1,066 | 2.7%), and Transportation (772 | 2.0%).
Production, Transportation and Moving Occupations by Sex
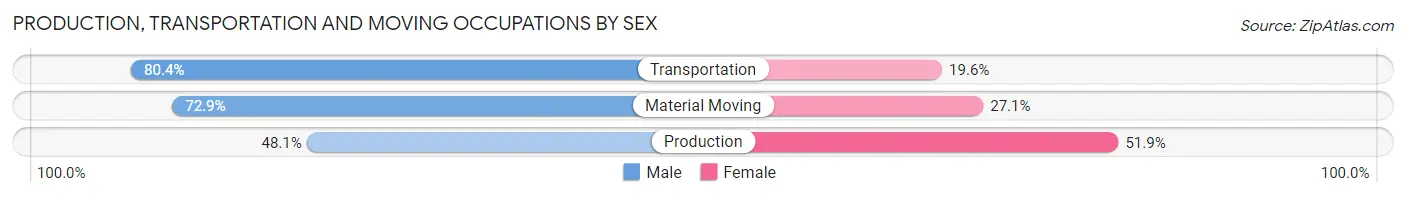
| Occupation | Male | Female |
| Production | 1,062 (48.1%) | 1,147 (51.9%) |
| Transportation | 621 (80.4%) | 151 (19.6%) |
| Material Moving | 777 (72.9%) | 289 (27.1%) |
| Total (Category) | 2,460 (60.8%) | 1,587 (39.2%) |
| Total (Overall) | 19,774 (50.4%) | 19,425 (49.5%) |
Employment Industries by Sex in Greenville
Employment Industries in Greenville
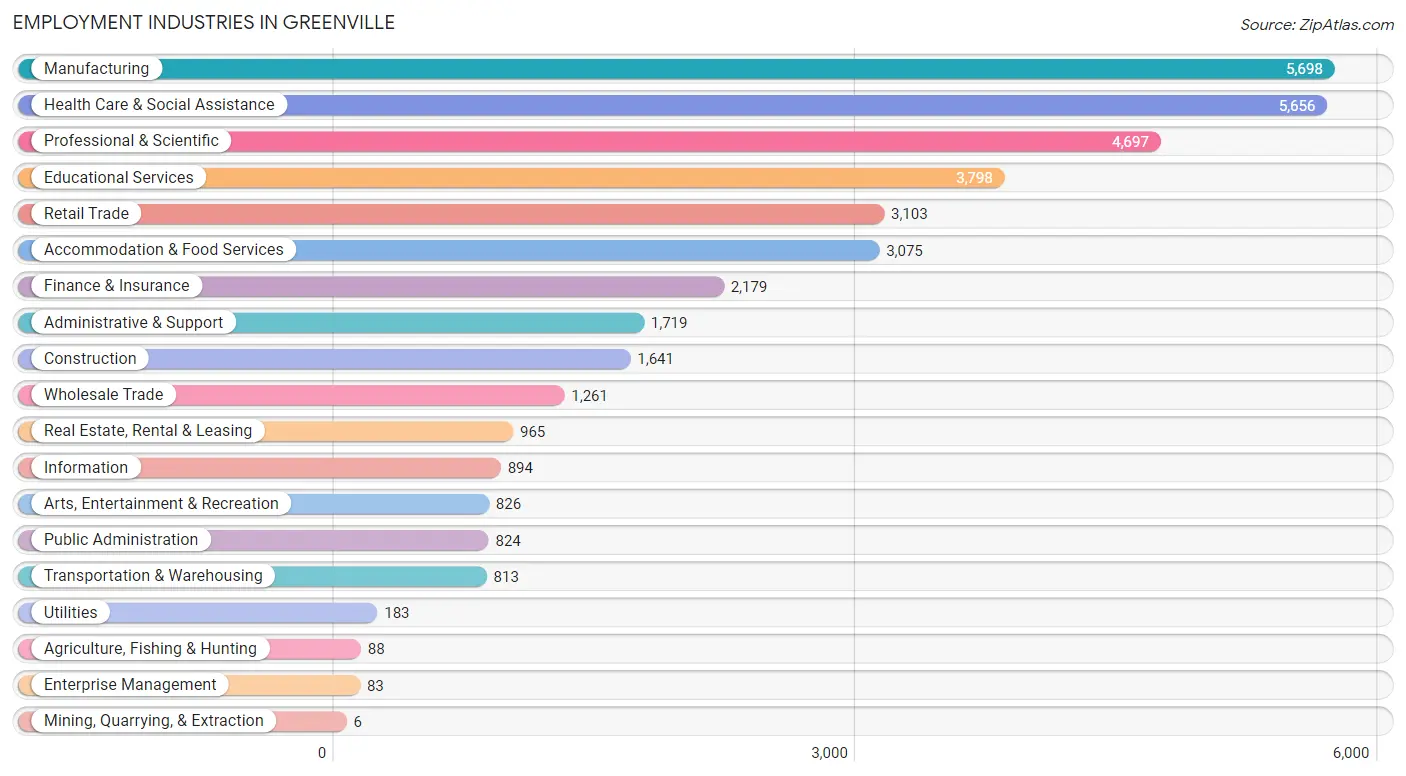
The major employment industries in Greenville include Manufacturing (5,698 | 14.5%), Health Care & Social Assistance (5,656 | 14.4%), Professional & Scientific (4,697 | 12.0%), Educational Services (3,798 | 9.7%), and Retail Trade (3,103 | 7.9%).
Employment Industries by Sex in Greenville
The Greenville industries that see more men than women are Mining, Quarrying, & Extraction (100.0%), Enterprise Management (98.8%), and Construction (80.3%), whereas the industries that tend to have a higher number of women are Health Care & Social Assistance (74.5%), Educational Services (70.3%), and Public Administration (70.2%).
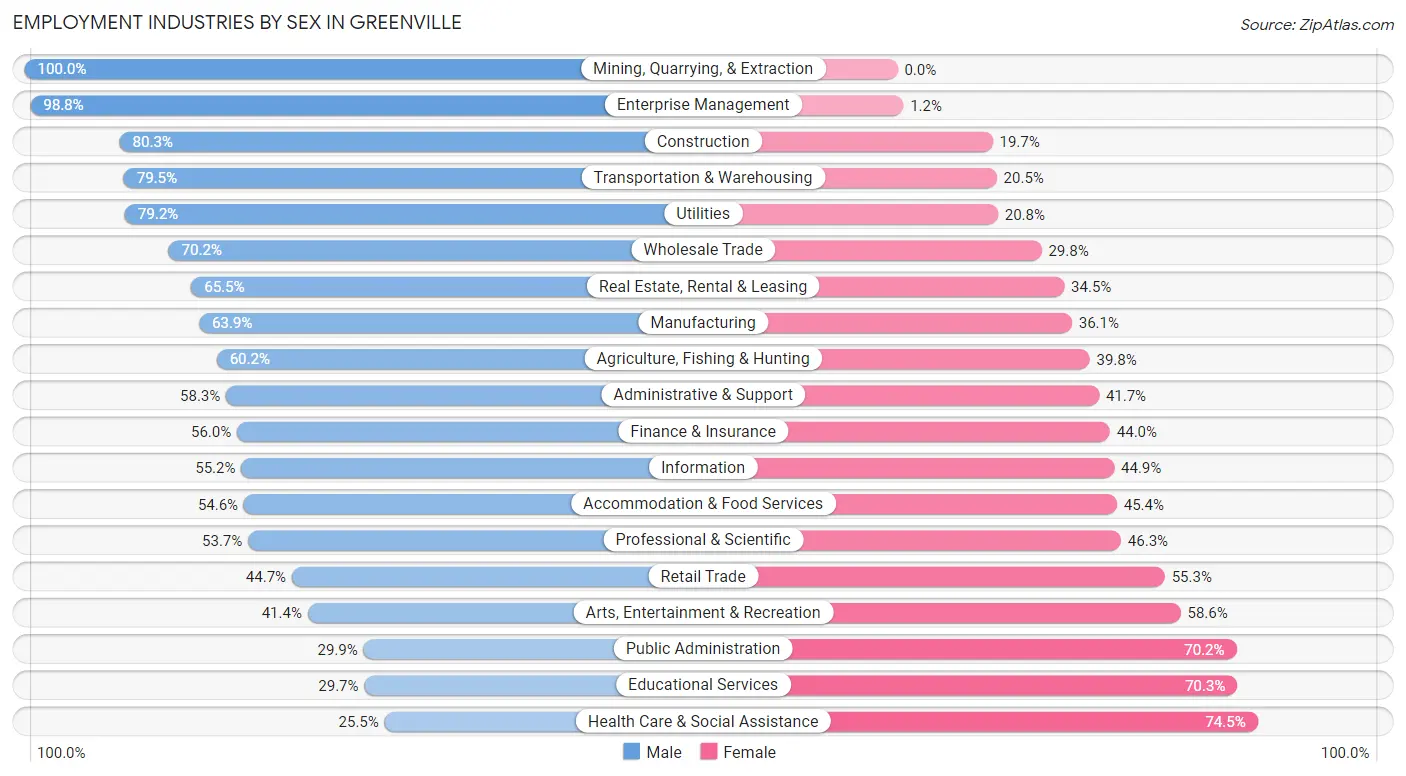
| Industry | Male | Female |
| Agriculture, Fishing & Hunting | 53 (60.2%) | 35 (39.8%) |
| Mining, Quarrying, & Extraction | 6 (100.0%) | 0 (0.0%) |
| Construction | 1,318 (80.3%) | 323 (19.7%) |
| Manufacturing | 3,641 (63.9%) | 2,057 (36.1%) |
| Wholesale Trade | 885 (70.2%) | 376 (29.8%) |
| Retail Trade | 1,386 (44.7%) | 1,717 (55.3%) |
| Transportation & Warehousing | 646 (79.5%) | 167 (20.5%) |
| Utilities | 145 (79.2%) | 38 (20.8%) |
| Information | 493 (55.1%) | 401 (44.9%) |
| Finance & Insurance | 1,221 (56.0%) | 958 (44.0%) |
| Real Estate, Rental & Leasing | 632 (65.5%) | 333 (34.5%) |
| Professional & Scientific | 2,524 (53.7%) | 2,173 (46.3%) |
| Enterprise Management | 82 (98.8%) | 1 (1.2%) |
| Administrative & Support | 1,002 (58.3%) | 717 (41.7%) |
| Educational Services | 1,127 (29.7%) | 2,671 (70.3%) |
| Health Care & Social Assistance | 1,441 (25.5%) | 4,215 (74.5%) |
| Arts, Entertainment & Recreation | 342 (41.4%) | 484 (58.6%) |
| Accommodation & Food Services | 1,679 (54.6%) | 1,396 (45.4%) |
| Public Administration | 246 (29.8%) | 578 (70.2%) |
| Total | 19,774 (50.4%) | 19,425 (49.5%) |
Education in Greenville
School Enrollment in Greenville
The most common levels of schooling among the 16,296 students in Greenville are college / undergraduate (5,052 | 31.0%), high school (2,686 | 16.5%), and middle school (2,663 | 16.3%).
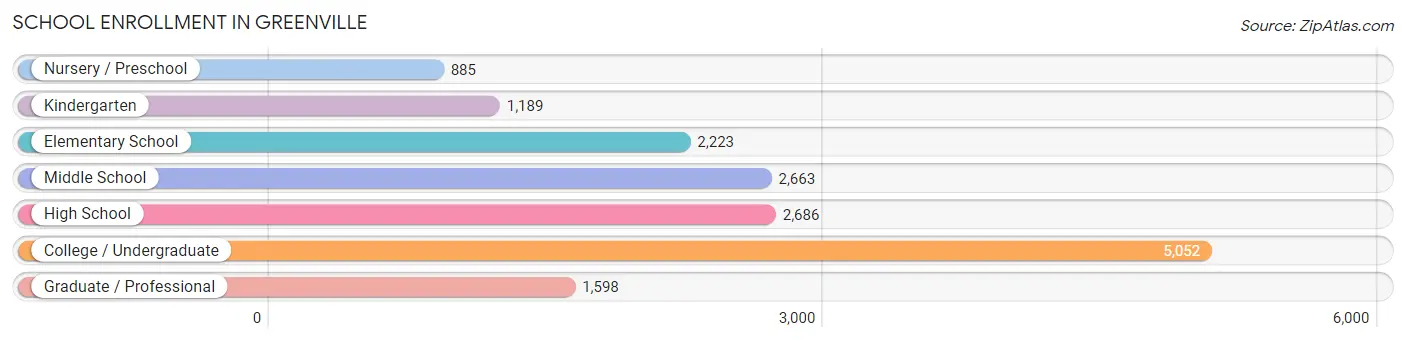
| School Level | # Students | % Students |
| Nursery / Preschool | 885 | 5.4% |
| Kindergarten | 1,189 | 7.3% |
| Elementary School | 2,223 | 13.6% |
| Middle School | 2,663 | 16.3% |
| High School | 2,686 | 16.5% |
| College / Undergraduate | 5,052 | 31.0% |
| Graduate / Professional | 1,598 | 9.8% |
| Total | 16,296 | 100.0% |
School Enrollment by Age by Funding Source in Greenville
Out of a total of 16,296 students who are enrolled in schools in Greenville, 5,215 (32.0%) attend a private institution, while the remaining 11,081 (68.0%) are enrolled in public schools. The age group of 3 to 4 year olds has the highest likelihood of being enrolled in private schools, with 484 (76.8% in the age bracket) enrolled. Conversely, the age group of 10 to 14 year olds has the lowest likelihood of being enrolled in a private school, with 2,791 (87.3% in the age bracket) attending a public institution.
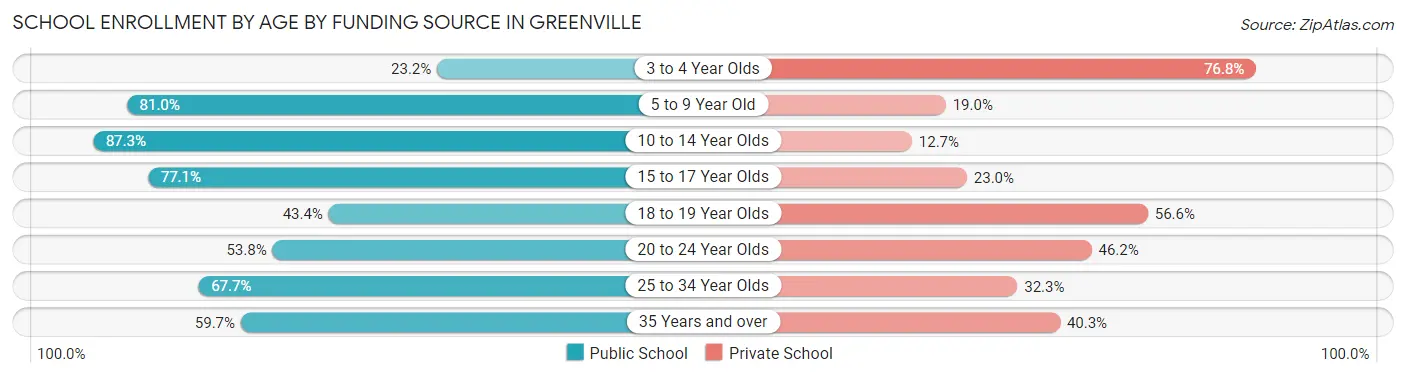
| Age Bracket | Public School | Private School |
| 3 to 4 Year Olds | 146 (23.2%) | 484 (76.8%) |
| 5 to 9 Year Old | 2,765 (81.0%) | 649 (19.0%) |
| 10 to 14 Year Olds | 2,791 (87.3%) | 406 (12.7%) |
| 15 to 17 Year Olds | 1,407 (77.0%) | 419 (23.0%) |
| 18 to 19 Year Olds | 816 (43.4%) | 1,066 (56.6%) |
| 20 to 24 Year Olds | 1,638 (53.8%) | 1,405 (46.2%) |
| 25 to 34 Year Olds | 1,176 (67.7%) | 562 (32.3%) |
| 35 Years and over | 338 (59.7%) | 228 (40.3%) |
| Total | 11,081 (68.0%) | 5,215 (32.0%) |
Educational Attainment by Field of Study in Greenville
Business (5,952 | 21.1%), education (2,740 | 9.7%), engineering (2,647 | 9.4%), social sciences (2,374 | 8.4%), and science & technology (2,312 | 8.2%) are the most common fields of study among 28,226 individuals in Greenville who have obtained a bachelor's degree or higher.
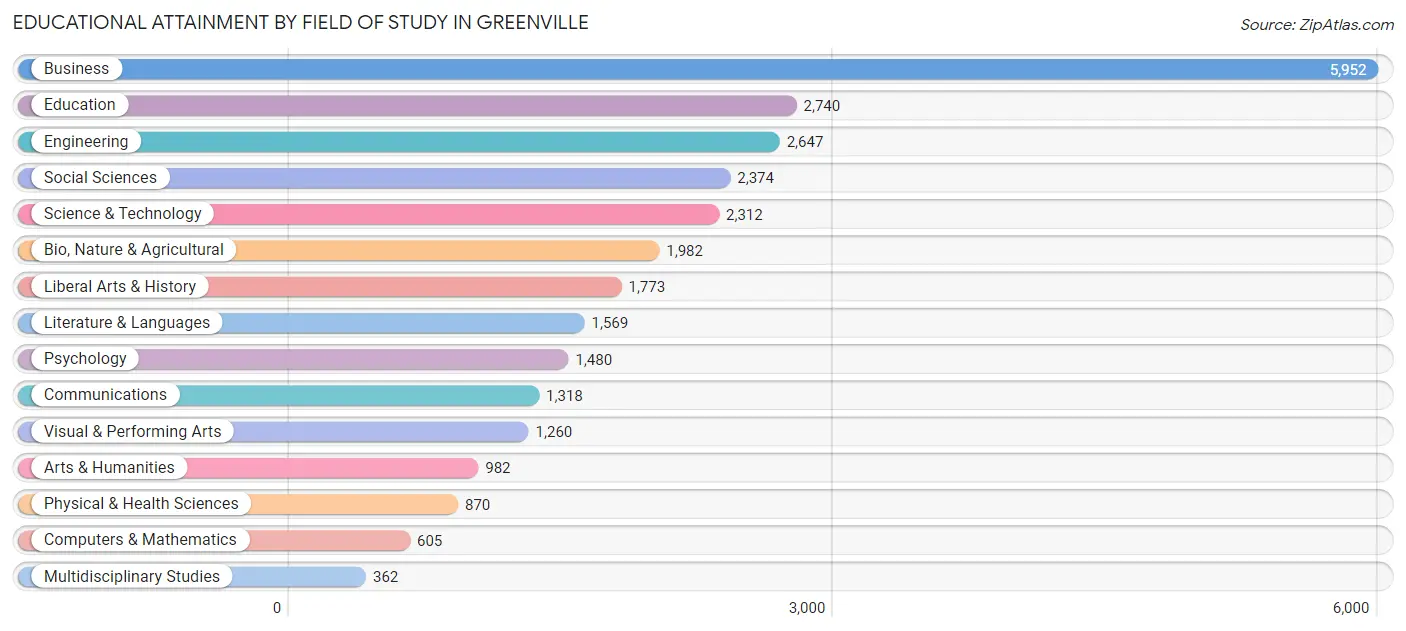
| Field of Study | # Graduates | % Graduates |
| Computers & Mathematics | 605 | 2.1% |
| Bio, Nature & Agricultural | 1,982 | 7.0% |
| Physical & Health Sciences | 870 | 3.1% |
| Psychology | 1,480 | 5.2% |
| Social Sciences | 2,374 | 8.4% |
| Engineering | 2,647 | 9.4% |
| Multidisciplinary Studies | 362 | 1.3% |
| Science & Technology | 2,312 | 8.2% |
| Business | 5,952 | 21.1% |
| Education | 2,740 | 9.7% |
| Literature & Languages | 1,569 | 5.6% |
| Liberal Arts & History | 1,773 | 6.3% |
| Visual & Performing Arts | 1,260 | 4.5% |
| Communications | 1,318 | 4.7% |
| Arts & Humanities | 982 | 3.5% |
| Total | 28,226 | 100.0% |
Transportation & Commute in Greenville
Vehicle Availability by Sex in Greenville
The most prevalent vehicle ownership categories in Greenville are males with 2 vehicles (9,015, accounting for 48.1%) and females with 2 vehicles (8,210, making up 50.5%).
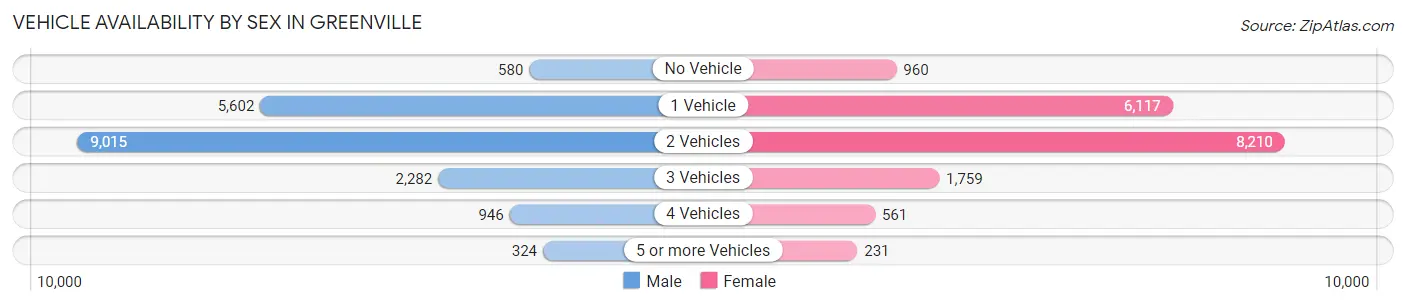
| Vehicles Available | Male | Female |
| No Vehicle | 580 (3.1%) | 960 (5.4%) |
| 1 Vehicle | 5,602 (29.9%) | 6,117 (34.3%) |
| 2 Vehicles | 9,015 (48.1%) | 8,210 (46.0%) |
| 3 Vehicles | 2,282 (12.2%) | 1,759 (9.9%) |
| 4 Vehicles | 946 (5.1%) | 561 (3.1%) |
| 5 or more Vehicles | 324 (1.7%) | 231 (1.3%) |
| Total | 18,749 (100.0%) | 17,838 (100.0%) |
Commute Time in Greenville
The most frequently occuring commute durations in Greenville are 15 to 19 minutes (7,337 commuters, 21.8%), 10 to 14 minutes (6,808 commuters, 20.2%), and 20 to 24 minutes (4,979 commuters, 14.8%).
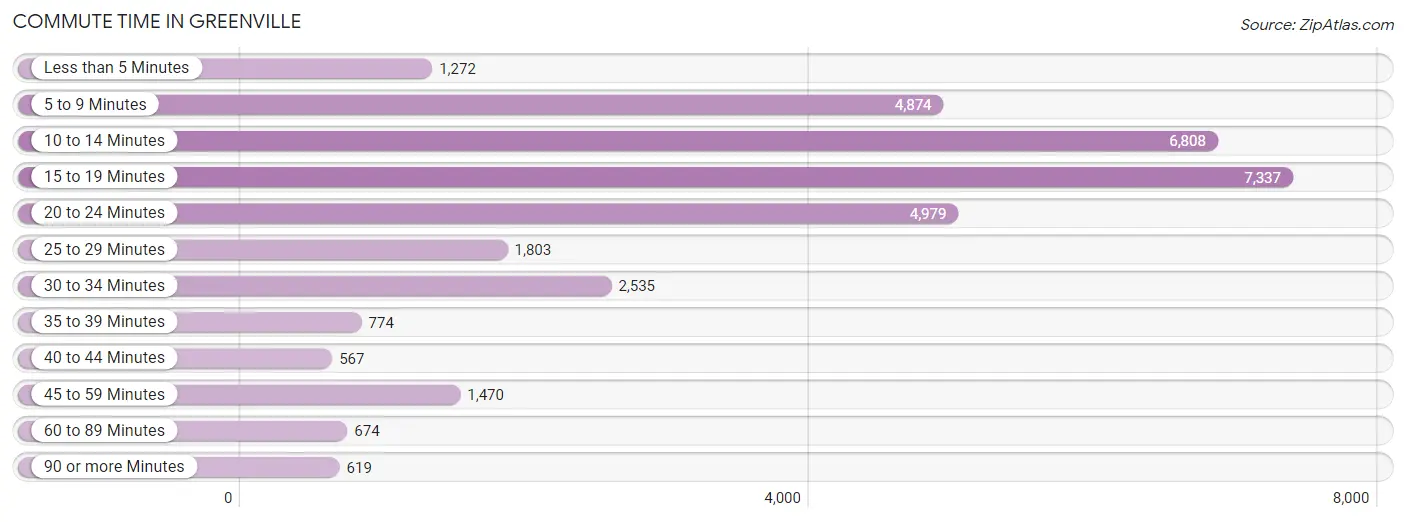
| Commute Time | # Commuters | % Commuters |
| Less than 5 Minutes | 1,272 | 3.8% |
| 5 to 9 Minutes | 4,874 | 14.5% |
| 10 to 14 Minutes | 6,808 | 20.2% |
| 15 to 19 Minutes | 7,337 | 21.8% |
| 20 to 24 Minutes | 4,979 | 14.8% |
| 25 to 29 Minutes | 1,803 | 5.3% |
| 30 to 34 Minutes | 2,535 | 7.5% |
| 35 to 39 Minutes | 774 | 2.3% |
| 40 to 44 Minutes | 567 | 1.7% |
| 45 to 59 Minutes | 1,470 | 4.4% |
| 60 to 89 Minutes | 674 | 2.0% |
| 90 or more Minutes | 619 | 1.8% |
Commute Time by Sex in Greenville
The most common commute times in Greenville are 15 to 19 minutes (3,682 commuters, 21.5%) for males and 15 to 19 minutes (3,655 commuters, 22.1%) for females.
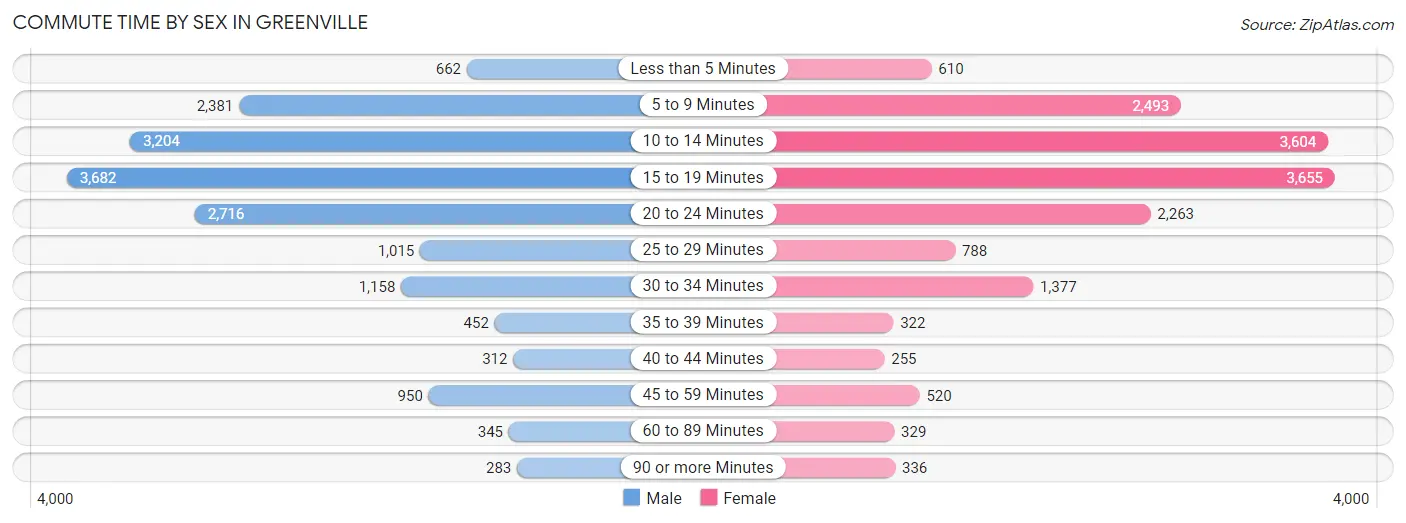
| Commute Time | Male | Female |
| Less than 5 Minutes | 662 (3.9%) | 610 (3.7%) |
| 5 to 9 Minutes | 2,381 (13.9%) | 2,493 (15.1%) |
| 10 to 14 Minutes | 3,204 (18.7%) | 3,604 (21.8%) |
| 15 to 19 Minutes | 3,682 (21.5%) | 3,655 (22.1%) |
| 20 to 24 Minutes | 2,716 (15.8%) | 2,263 (13.7%) |
| 25 to 29 Minutes | 1,015 (5.9%) | 788 (4.8%) |
| 30 to 34 Minutes | 1,158 (6.8%) | 1,377 (8.3%) |
| 35 to 39 Minutes | 452 (2.6%) | 322 (1.9%) |
| 40 to 44 Minutes | 312 (1.8%) | 255 (1.5%) |
| 45 to 59 Minutes | 950 (5.5%) | 520 (3.1%) |
| 60 to 89 Minutes | 345 (2.0%) | 329 (2.0%) |
| 90 or more Minutes | 283 (1.7%) | 336 (2.0%) |
Time of Departure to Work by Sex in Greenville
The most frequent times of departure to work in Greenville are 7:30 AM to 7:59 AM (2,857, 16.7%) for males and 8:00 AM to 8:29 AM (2,939, 17.8%) for females.
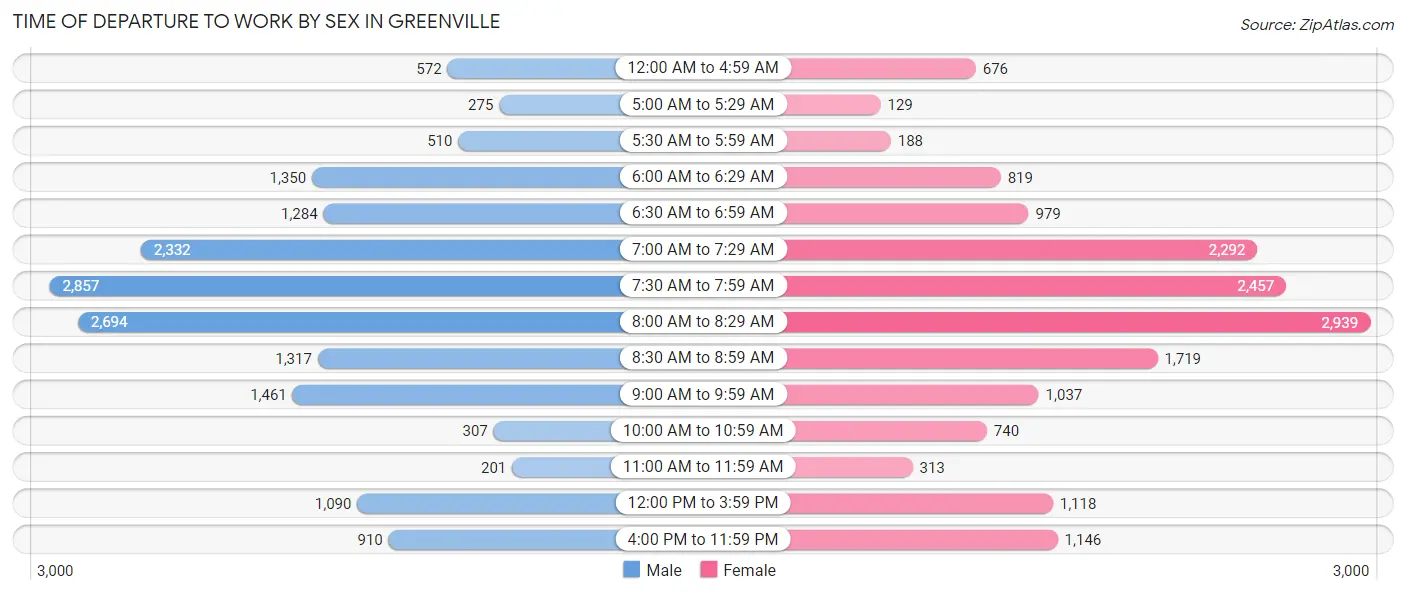
| Time of Departure | Male | Female |
| 12:00 AM to 4:59 AM | 572 (3.3%) | 676 (4.1%) |
| 5:00 AM to 5:29 AM | 275 (1.6%) | 129 (0.8%) |
| 5:30 AM to 5:59 AM | 510 (3.0%) | 188 (1.1%) |
| 6:00 AM to 6:29 AM | 1,350 (7.9%) | 819 (5.0%) |
| 6:30 AM to 6:59 AM | 1,284 (7.5%) | 979 (5.9%) |
| 7:00 AM to 7:29 AM | 2,332 (13.6%) | 2,292 (13.9%) |
| 7:30 AM to 7:59 AM | 2,857 (16.7%) | 2,457 (14.8%) |
| 8:00 AM to 8:29 AM | 2,694 (15.7%) | 2,939 (17.8%) |
| 8:30 AM to 8:59 AM | 1,317 (7.7%) | 1,719 (10.4%) |
| 9:00 AM to 9:59 AM | 1,461 (8.5%) | 1,037 (6.3%) |
| 10:00 AM to 10:59 AM | 307 (1.8%) | 740 (4.5%) |
| 11:00 AM to 11:59 AM | 201 (1.2%) | 313 (1.9%) |
| 12:00 PM to 3:59 PM | 1,090 (6.4%) | 1,118 (6.8%) |
| 4:00 PM to 11:59 PM | 910 (5.3%) | 1,146 (6.9%) |
| Total | 17,160 (100.0%) | 16,552 (100.0%) |
Housing Occupancy in Greenville
Occupancy by Ownership in Greenville
Of the total 33,550 dwellings in Greenville, owner-occupied units account for 13,970 (41.6%), while renter-occupied units make up 19,580 (58.4%).
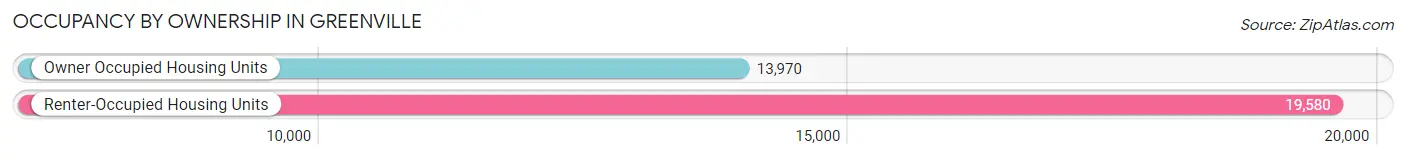
| Occupancy | # Housing Units | % Housing Units |
| Owner Occupied Housing Units | 13,970 | 41.6% |
| Renter-Occupied Housing Units | 19,580 | 58.4% |
| Total Occupied Housing Units | 33,550 | 100.0% |
Occupancy by Household Size in Greenville
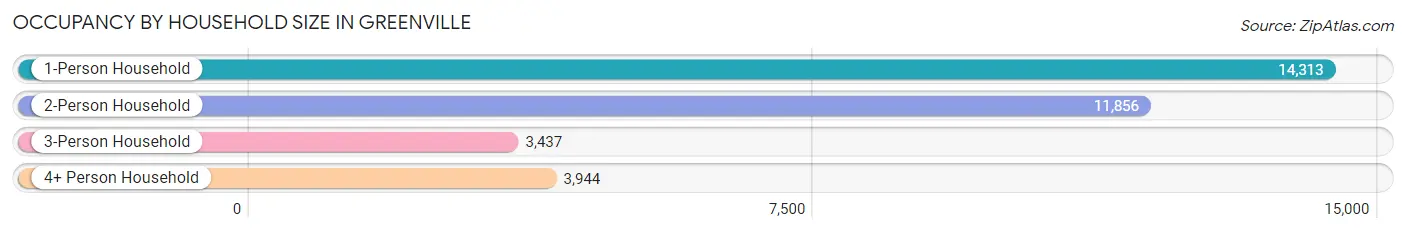
| Household Size | # Housing Units | % Housing Units |
| 1-Person Household | 14,313 | 42.7% |
| 2-Person Household | 11,856 | 35.3% |
| 3-Person Household | 3,437 | 10.2% |
| 4+ Person Household | 3,944 | 11.8% |
| Total Housing Units | 33,550 | 100.0% |
Occupancy by Ownership by Household Size in Greenville
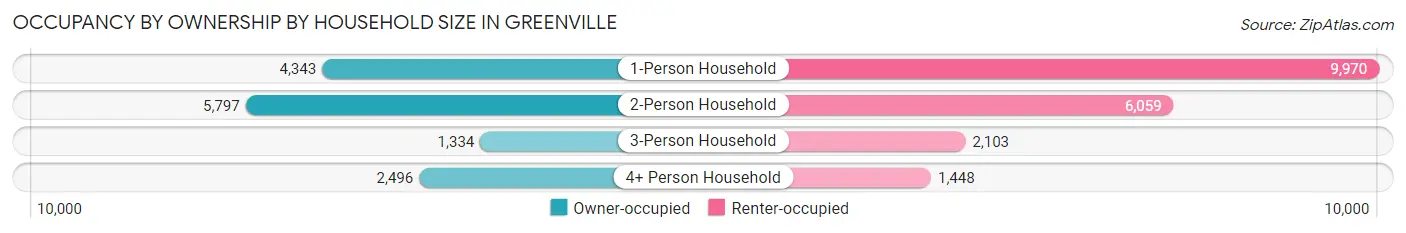
| Household Size | Owner-occupied | Renter-occupied |
| 1-Person Household | 4,343 (30.3%) | 9,970 (69.7%) |
| 2-Person Household | 5,797 (48.9%) | 6,059 (51.1%) |
| 3-Person Household | 1,334 (38.8%) | 2,103 (61.2%) |
| 4+ Person Household | 2,496 (63.3%) | 1,448 (36.7%) |
| Total Housing Units | 13,970 (41.6%) | 19,580 (58.4%) |
Occupancy by Educational Attainment in Greenville
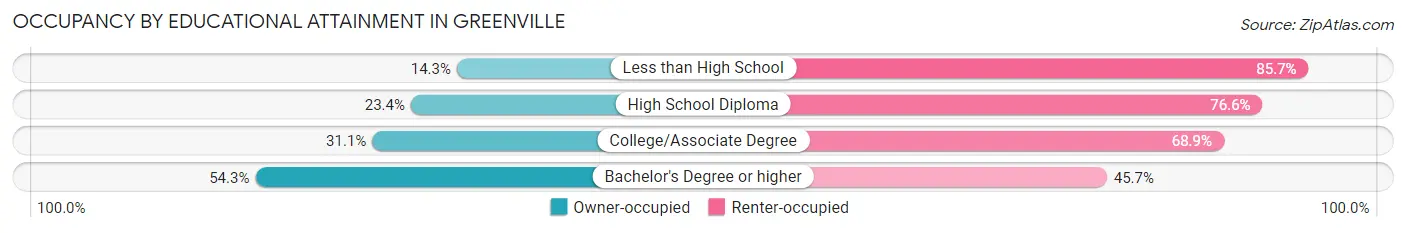
| Household Size | Owner-occupied | Renter-occupied |
| Less than High School | 294 (14.3%) | 1,760 (85.7%) |
| High School Diploma | 1,265 (23.4%) | 4,134 (76.6%) |
| College/Associate Degree | 2,350 (31.1%) | 5,208 (68.9%) |
| Bachelor's Degree or higher | 10,061 (54.3%) | 8,478 (45.7%) |
Occupancy by Age of Householder in Greenville
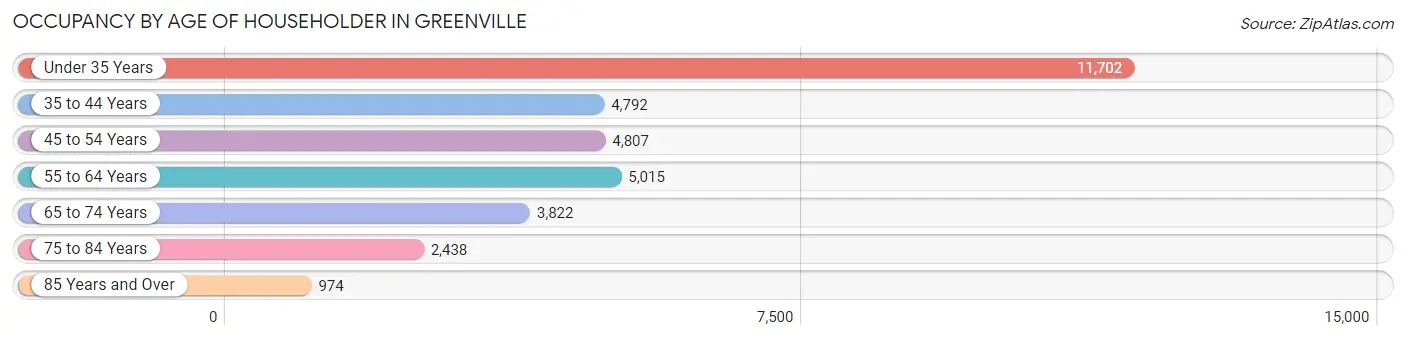
| Age Bracket | # Households | % Households |
| Under 35 Years | 11,702 | 34.9% |
| 35 to 44 Years | 4,792 | 14.3% |
| 45 to 54 Years | 4,807 | 14.3% |
| 55 to 64 Years | 5,015 | 14.9% |
| 65 to 74 Years | 3,822 | 11.4% |
| 75 to 84 Years | 2,438 | 7.3% |
| 85 Years and Over | 974 | 2.9% |
| Total | 33,550 | 100.0% |
Housing Finances in Greenville
Median Income by Occupancy in Greenville
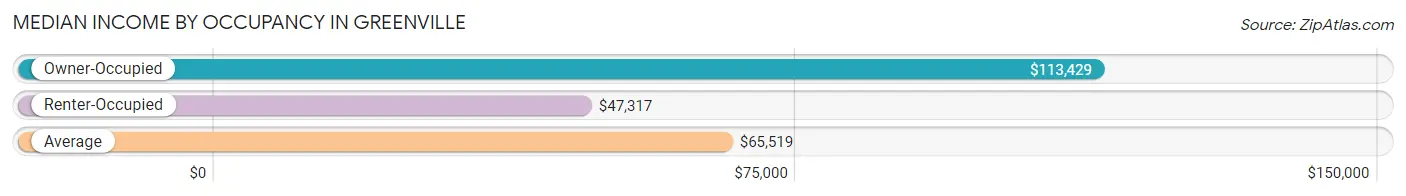
| Occupancy Type | # Households | Median Income |
| Owner-Occupied | 13,970 (41.6%) | $113,429 |
| Renter-Occupied | 19,580 (58.4%) | $47,317 |
| Average | 33,550 (100.0%) | $65,519 |
Occupancy by Householder Income Bracket in Greenville
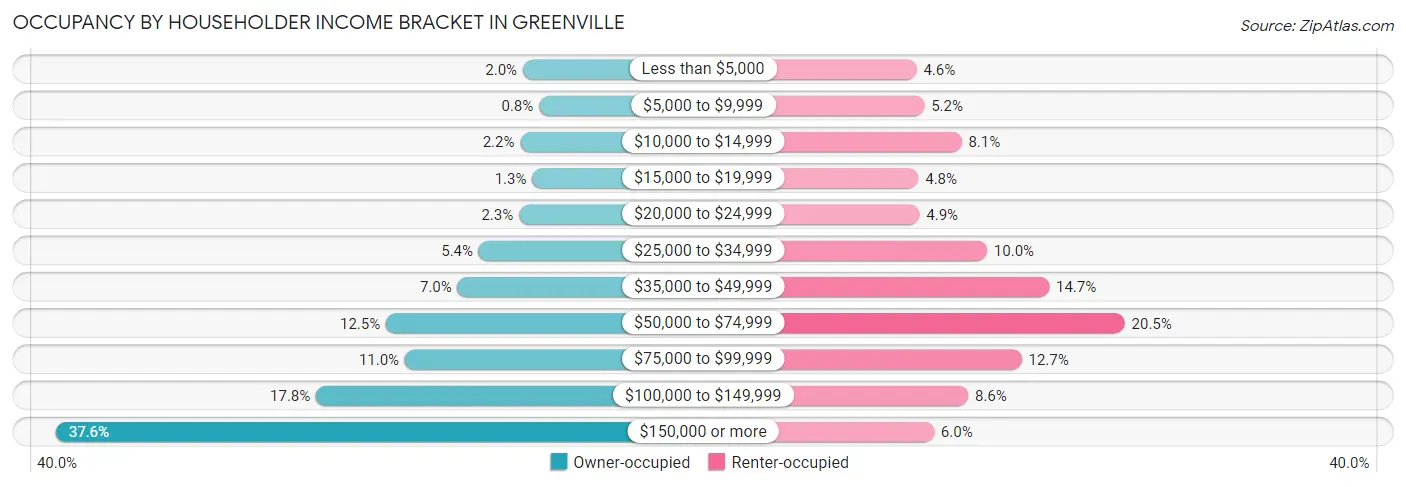
| Income Bracket | Owner-occupied | Renter-occupied |
| Less than $5,000 | 283 (2.0%) | 908 (4.6%) |
| $5,000 to $9,999 | 112 (0.8%) | 1,024 (5.2%) |
| $10,000 to $14,999 | 312 (2.2%) | 1,580 (8.1%) |
| $15,000 to $19,999 | 184 (1.3%) | 935 (4.8%) |
| $20,000 to $24,999 | 326 (2.3%) | 952 (4.9%) |
| $25,000 to $34,999 | 753 (5.4%) | 1,959 (10.0%) |
| $35,000 to $49,999 | 979 (7.0%) | 2,886 (14.7%) |
| $50,000 to $74,999 | 1,741 (12.5%) | 4,013 (20.5%) |
| $75,000 to $99,999 | 1,539 (11.0%) | 2,477 (12.7%) |
| $100,000 to $149,999 | 2,485 (17.8%) | 1,678 (8.6%) |
| $150,000 or more | 5,256 (37.6%) | 1,168 (6.0%) |
| Total | 13,970 (100.0%) | 19,580 (100.0%) |
Monthly Housing Cost Tiers in Greenville
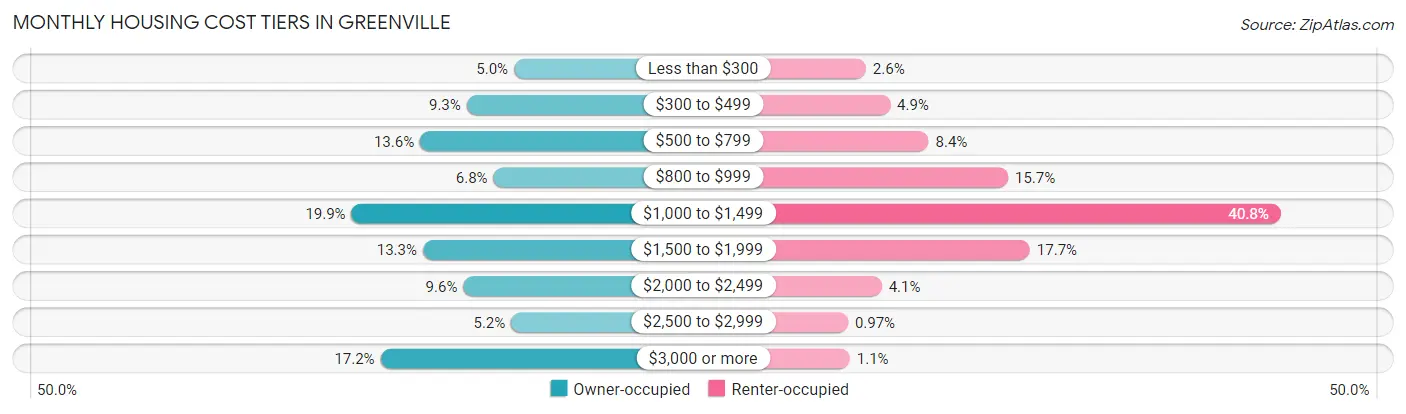
| Monthly Cost | Owner-occupied | Renter-occupied |
| Less than $300 | 691 (5.0%) | 513 (2.6%) |
| $300 to $499 | 1,300 (9.3%) | 950 (4.9%) |
| $500 to $799 | 1,900 (13.6%) | 1,642 (8.4%) |
| $800 to $999 | 955 (6.8%) | 3,076 (15.7%) |
| $1,000 to $1,499 | 2,781 (19.9%) | 7,989 (40.8%) |
| $1,500 to $1,999 | 1,863 (13.3%) | 3,469 (17.7%) |
| $2,000 to $2,499 | 1,344 (9.6%) | 798 (4.1%) |
| $2,500 to $2,999 | 728 (5.2%) | 189 (1.0%) |
| $3,000 or more | 2,408 (17.2%) | 224 (1.1%) |
| Total | 13,970 (100.0%) | 19,580 (100.0%) |
Physical Housing Characteristics in Greenville
Housing Structures in Greenville
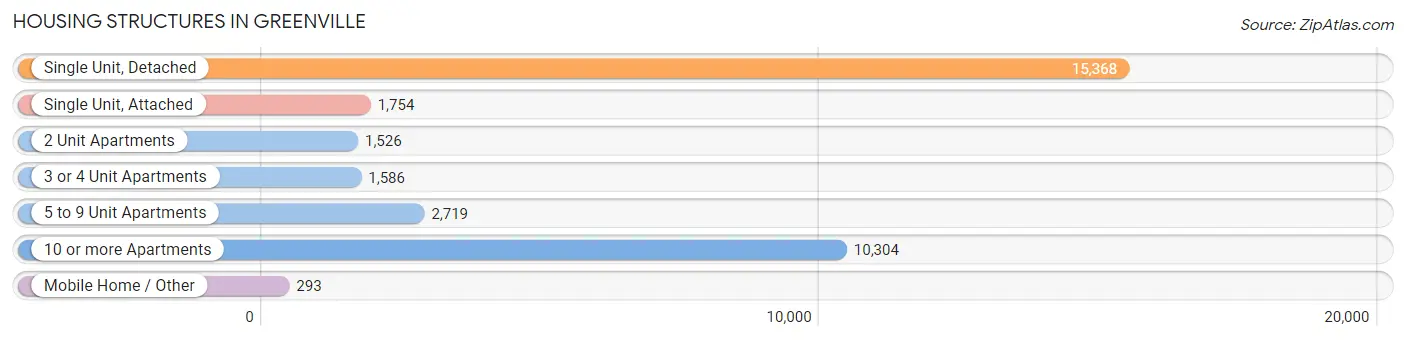
| Structure Type | # Housing Units | % Housing Units |
| Single Unit, Detached | 15,368 | 45.8% |
| Single Unit, Attached | 1,754 | 5.2% |
| 2 Unit Apartments | 1,526 | 4.5% |
| 3 or 4 Unit Apartments | 1,586 | 4.7% |
| 5 to 9 Unit Apartments | 2,719 | 8.1% |
| 10 or more Apartments | 10,304 | 30.7% |
| Mobile Home / Other | 293 | 0.9% |
| Total | 33,550 | 100.0% |
Housing Structures by Occupancy in Greenville
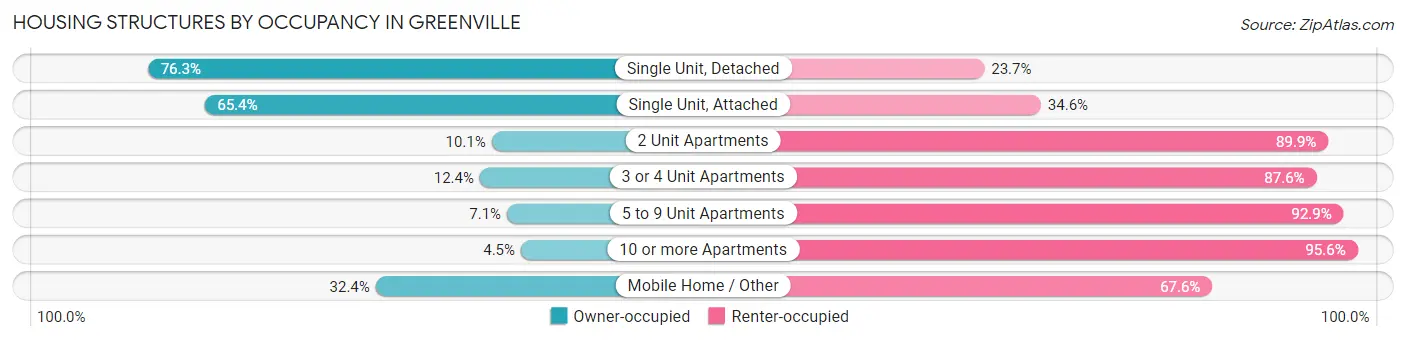
| Structure Type | Owner-occupied | Renter-occupied |
| Single Unit, Detached | 11,725 (76.3%) | 3,643 (23.7%) |
| Single Unit, Attached | 1,147 (65.4%) | 607 (34.6%) |
| 2 Unit Apartments | 154 (10.1%) | 1,372 (89.9%) |
| 3 or 4 Unit Apartments | 196 (12.4%) | 1,390 (87.6%) |
| 5 to 9 Unit Apartments | 194 (7.1%) | 2,525 (92.9%) |
| 10 or more Apartments | 459 (4.4%) | 9,845 (95.6%) |
| Mobile Home / Other | 95 (32.4%) | 198 (67.6%) |
| Total | 13,970 (41.6%) | 19,580 (58.4%) |
Housing Structures by Number of Rooms in Greenville
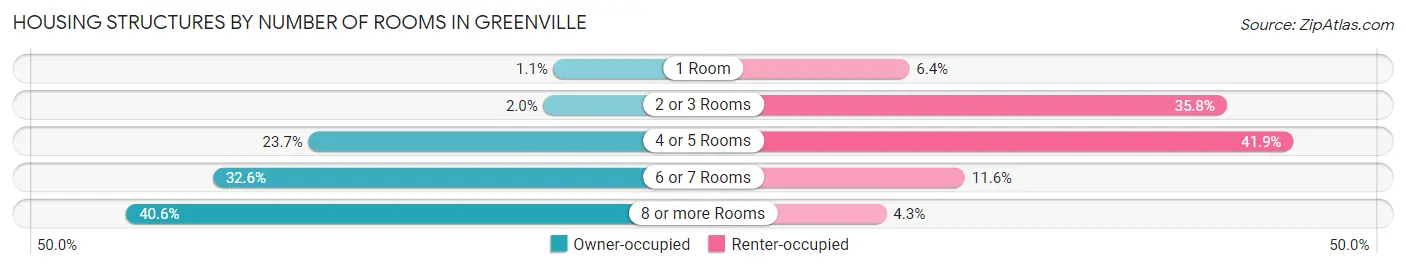
| Number of Rooms | Owner-occupied | Renter-occupied |
| 1 Room | 149 (1.1%) | 1,258 (6.4%) |
| 2 or 3 Rooms | 280 (2.0%) | 7,006 (35.8%) |
| 4 or 5 Rooms | 3,315 (23.7%) | 8,211 (41.9%) |
| 6 or 7 Rooms | 4,554 (32.6%) | 2,264 (11.6%) |
| 8 or more Rooms | 5,672 (40.6%) | 841 (4.3%) |
| Total | 13,970 (100.0%) | 19,580 (100.0%) |
Housing Structure by Heating Type in Greenville
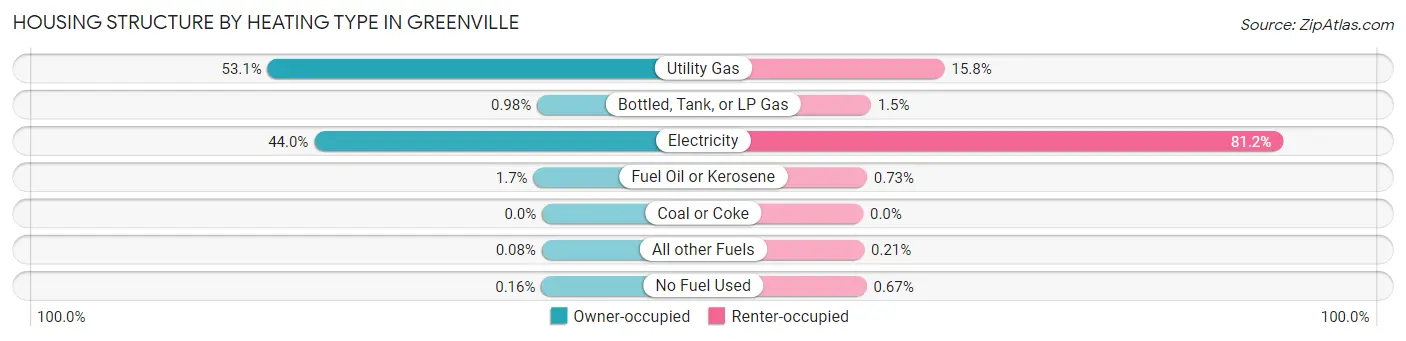
| Heating Type | Owner-occupied | Renter-occupied |
| Utility Gas | 7,413 (53.1%) | 3,083 (15.8%) |
| Bottled, Tank, or LP Gas | 137 (1.0%) | 290 (1.5%) |
| Electricity | 6,152 (44.0%) | 15,892 (81.2%) |
| Fuel Oil or Kerosene | 235 (1.7%) | 143 (0.7%) |
| Coal or Coke | 0 (0.0%) | 0 (0.0%) |
| All other Fuels | 11 (0.1%) | 41 (0.2%) |
| No Fuel Used | 22 (0.2%) | 131 (0.7%) |
| Total | 13,970 (100.0%) | 19,580 (100.0%) |
Household Vehicle Usage in Greenville
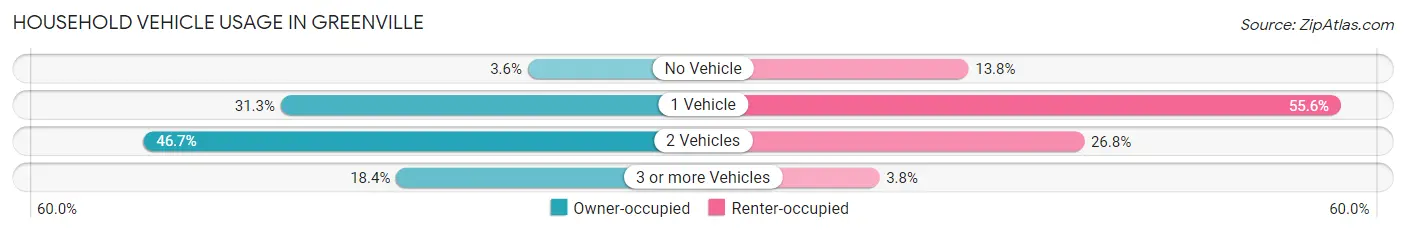
| Vehicles per Household | Owner-occupied | Renter-occupied |
| No Vehicle | 507 (3.6%) | 2,705 (13.8%) |
| 1 Vehicle | 4,373 (31.3%) | 10,879 (55.6%) |
| 2 Vehicles | 6,524 (46.7%) | 5,244 (26.8%) |
| 3 or more Vehicles | 2,566 (18.4%) | 752 (3.8%) |
| Total | 13,970 (100.0%) | 19,580 (100.0%) |
Real Estate & Mortgages in Greenville
Real Estate and Mortgage Overview in Greenville
| Characteristic | Without Mortgage | With Mortgage |
| Housing Units | 4,659 | 9,311 |
| Median Property Value | $374,000 | $421,200 |
| Median Household Income | $71,354 | $4,152 |
| Monthly Housing Costs | $556 | $2,346 |
| Real Estate Taxes | $1,811 | $130 |
Property Value by Mortgage Status in Greenville
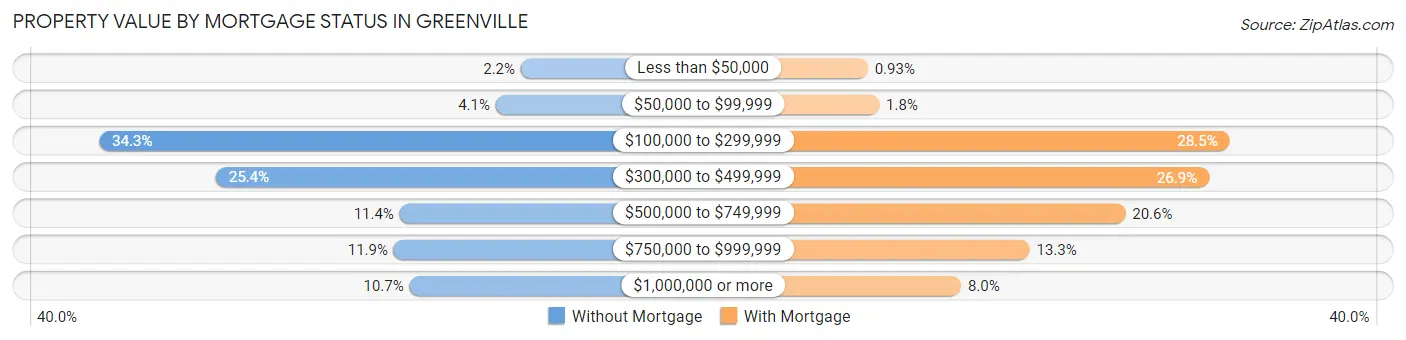
| Property Value | Without Mortgage | With Mortgage |
| Less than $50,000 | 102 (2.2%) | 87 (0.9%) |
| $50,000 to $99,999 | 191 (4.1%) | 168 (1.8%) |
| $100,000 to $299,999 | 1,599 (34.3%) | 2,653 (28.5%) |
| $300,000 to $499,999 | 1,185 (25.4%) | 2,507 (26.9%) |
| $500,000 to $749,999 | 532 (11.4%) | 1,913 (20.5%) |
| $750,000 to $999,999 | 553 (11.9%) | 1,235 (13.3%) |
| $1,000,000 or more | 497 (10.7%) | 748 (8.0%) |
| Total | 4,659 (100.0%) | 9,311 (100.0%) |
Household Income by Mortgage Status in Greenville
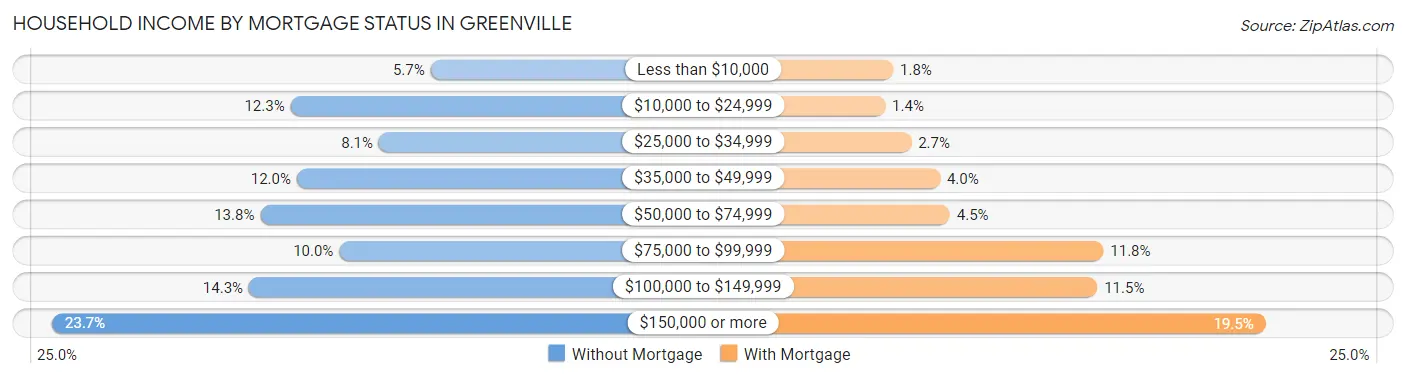
| Household Income | Without Mortgage | With Mortgage |
| Less than $10,000 | 264 (5.7%) | 167 (1.8%) |
| $10,000 to $24,999 | 575 (12.3%) | 131 (1.4%) |
| $25,000 to $34,999 | 379 (8.1%) | 247 (2.6%) |
| $35,000 to $49,999 | 561 (12.0%) | 374 (4.0%) |
| $50,000 to $74,999 | 642 (13.8%) | 418 (4.5%) |
| $75,000 to $99,999 | 467 (10.0%) | 1,099 (11.8%) |
| $100,000 to $149,999 | 667 (14.3%) | 1,072 (11.5%) |
| $150,000 or more | 1,104 (23.7%) | 1,818 (19.5%) |
| Total | 4,659 (100.0%) | 9,311 (100.0%) |
Property Value to Household Income Ratio in Greenville
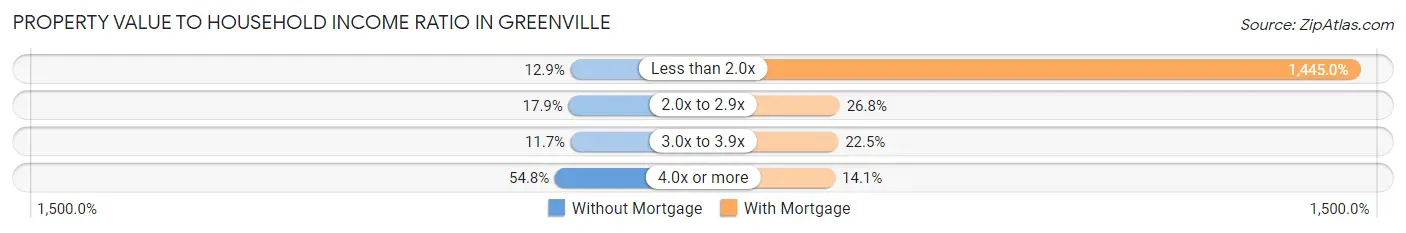
| Value-to-Income Ratio | Without Mortgage | With Mortgage |
| Less than 2.0x | 599 (12.9%) | 134,542 (1,445.0%) |
| 2.0x to 2.9x | 836 (17.9%) | 2,491 (26.8%) |
| 3.0x to 3.9x | 545 (11.7%) | 2,097 (22.5%) |
| 4.0x or more | 2,555 (54.8%) | 1,309 (14.1%) |
| Total | 4,659 (100.0%) | 9,311 (100.0%) |
Real Estate Taxes by Mortgage Status in Greenville
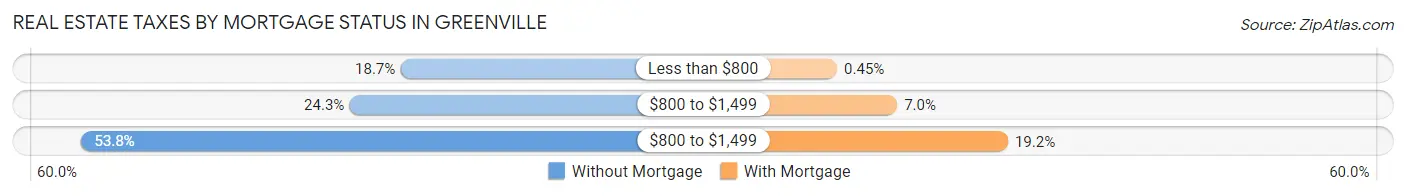
| Property Taxes | Without Mortgage | With Mortgage |
| Less than $800 | 873 (18.7%) | 42 (0.4%) |
| $800 to $1,499 | 1,133 (24.3%) | 655 (7.0%) |
| $800 to $1,499 | 2,505 (53.8%) | 1,785 (19.2%) |
| Total | 4,659 (100.0%) | 9,311 (100.0%) |
Health & Disability in Greenville
Health Insurance Coverage by Age in Greenville
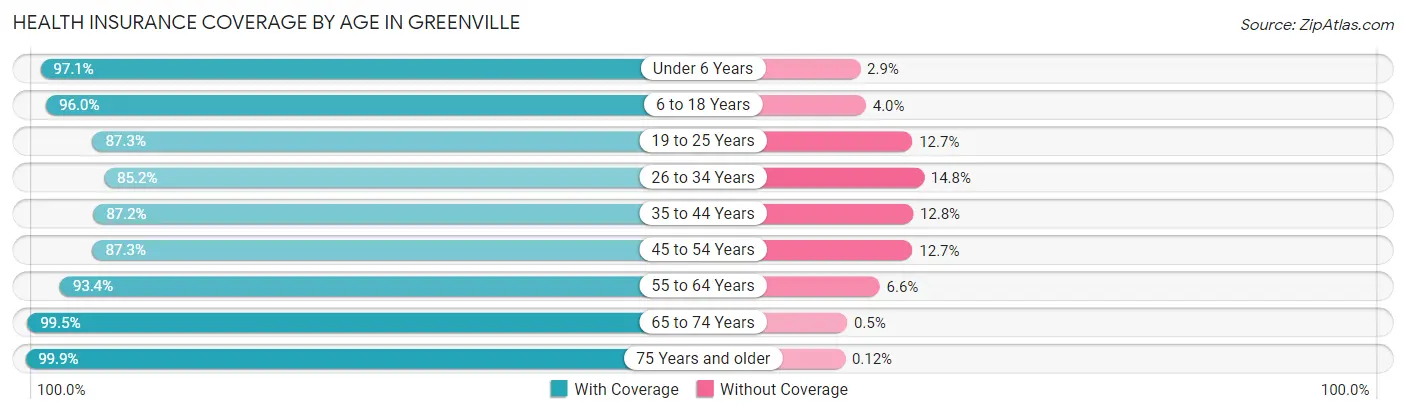
| Age Bracket | With Coverage | Without Coverage |
| Under 6 Years | 4,525 (97.1%) | 137 (2.9%) |
| 6 to 18 Years | 8,258 (96.0%) | 345 (4.0%) |
| 19 to 25 Years | 8,733 (87.3%) | 1,267 (12.7%) |
| 26 to 34 Years | 10,777 (85.2%) | 1,875 (14.8%) |
| 35 to 44 Years | 7,216 (87.2%) | 1,059 (12.8%) |
| 45 to 54 Years | 6,554 (87.3%) | 953 (12.7%) |
| 55 to 64 Years | 7,152 (93.4%) | 504 (6.6%) |
| 65 to 74 Years | 5,725 (99.5%) | 29 (0.5%) |
| 75 Years and older | 4,327 (99.9%) | 5 (0.1%) |
| Total | 63,267 (91.1%) | 6,174 (8.9%) |
Health Insurance Coverage by Citizenship Status in Greenville
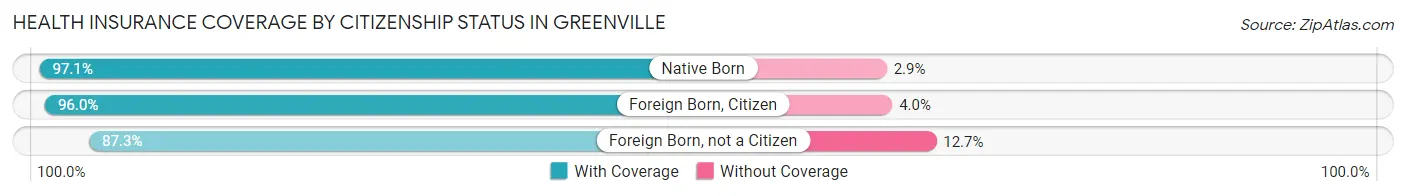
| Citizenship Status | With Coverage | Without Coverage |
| Native Born | 4,525 (97.1%) | 137 (2.9%) |
| Foreign Born, Citizen | 8,258 (96.0%) | 345 (4.0%) |
| Foreign Born, not a Citizen | 8,733 (87.3%) | 1,267 (12.7%) |
Health Insurance Coverage by Household Income in Greenville
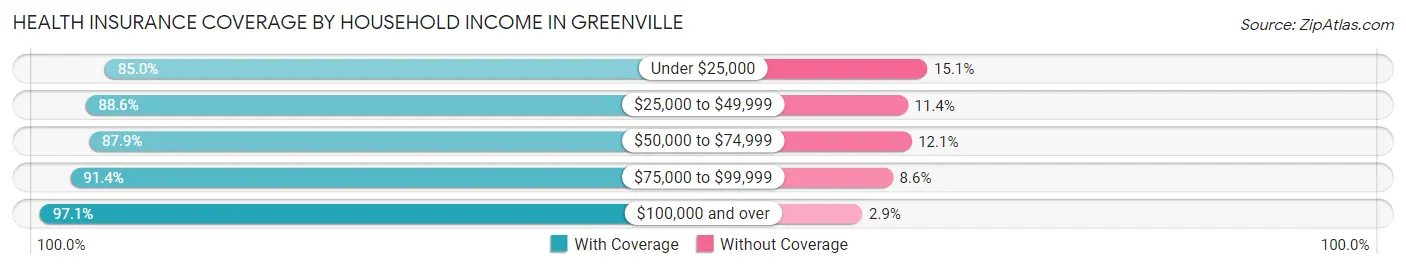
| Household Income | With Coverage | Without Coverage |
| Under $25,000 | 8,623 (85.0%) | 1,528 (15.0%) |
| $25,000 to $49,999 | 9,618 (88.6%) | 1,236 (11.4%) |
| $50,000 to $74,999 | 9,569 (87.9%) | 1,313 (12.1%) |
| $75,000 to $99,999 | 7,141 (91.4%) | 671 (8.6%) |
| $100,000 and over | 26,005 (97.1%) | 768 (2.9%) |
Public vs Private Health Insurance Coverage by Age in Greenville
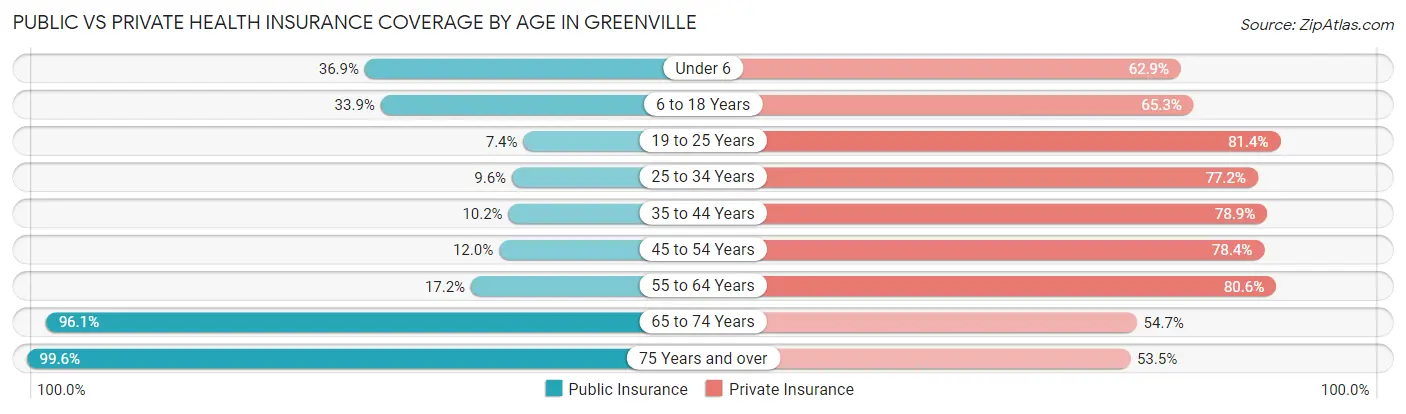
| Age Bracket | Public Insurance | Private Insurance |
| Under 6 | 1,718 (36.8%) | 2,934 (62.9%) |
| 6 to 18 Years | 2,917 (33.9%) | 5,618 (65.3%) |
| 19 to 25 Years | 742 (7.4%) | 8,137 (81.4%) |
| 25 to 34 Years | 1,208 (9.6%) | 9,766 (77.2%) |
| 35 to 44 Years | 843 (10.2%) | 6,532 (78.9%) |
| 45 to 54 Years | 897 (11.9%) | 5,885 (78.4%) |
| 55 to 64 Years | 1,313 (17.2%) | 6,170 (80.6%) |
| 65 to 74 Years | 5,528 (96.1%) | 3,149 (54.7%) |
| 75 Years and over | 4,315 (99.6%) | 2,317 (53.5%) |
| Total | 19,481 (28.1%) | 50,508 (72.7%) |
Disability Status by Sex by Age in Greenville
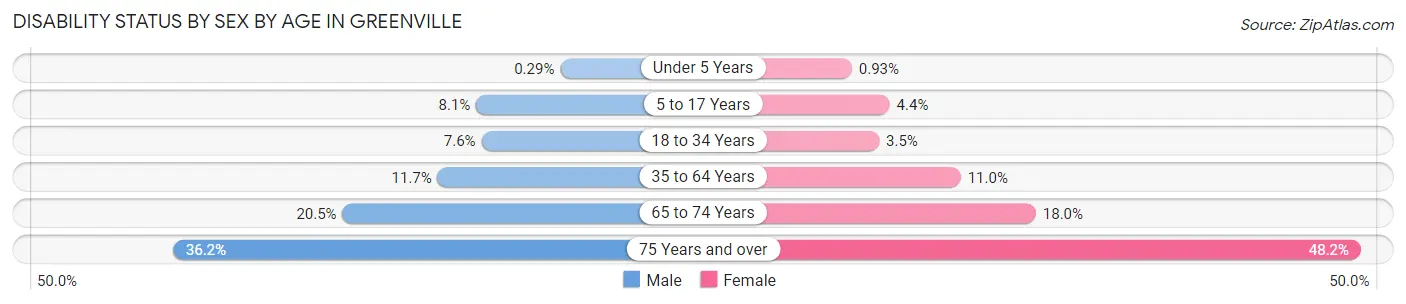
| Age Bracket | Male | Female |
| Under 5 Years | 5 (0.3%) | 19 (0.9%) |
| 5 to 17 Years | 373 (8.1%) | 179 (4.4%) |
| 18 to 34 Years | 826 (7.6%) | 438 (3.5%) |
| 35 to 64 Years | 1,326 (11.7%) | 1,333 (11.0%) |
| 65 to 74 Years | 517 (20.5%) | 582 (18.0%) |
| 75 Years and over | 640 (36.2%) | 1,236 (48.2%) |
Disability Class by Sex by Age in Greenville
Disability Class: Hearing Difficulty
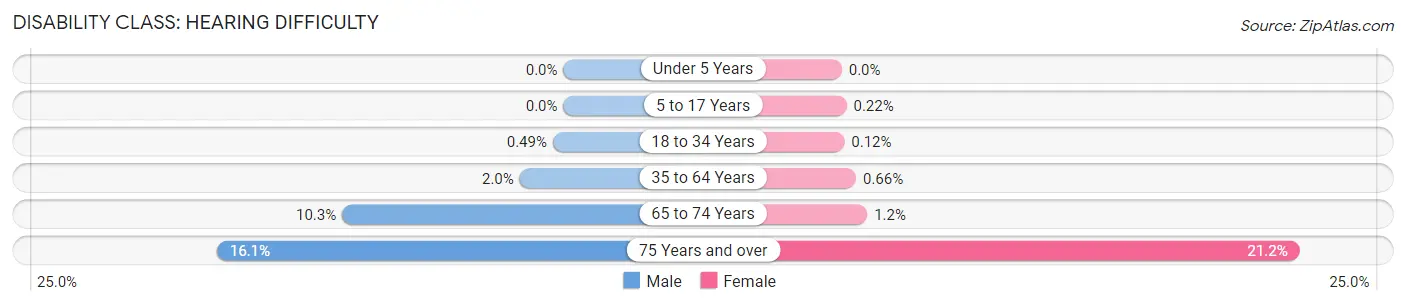
| Age Bracket | Male | Female |
| Under 5 Years | 0 (0.0%) | 0 (0.0%) |
| 5 to 17 Years | 0 (0.0%) | 9 (0.2%) |
| 18 to 34 Years | 53 (0.5%) | 15 (0.1%) |
| 35 to 64 Years | 231 (2.0%) | 80 (0.7%) |
| 65 to 74 Years | 259 (10.3%) | 38 (1.2%) |
| 75 Years and over | 284 (16.1%) | 545 (21.2%) |
Disability Class: Vision Difficulty
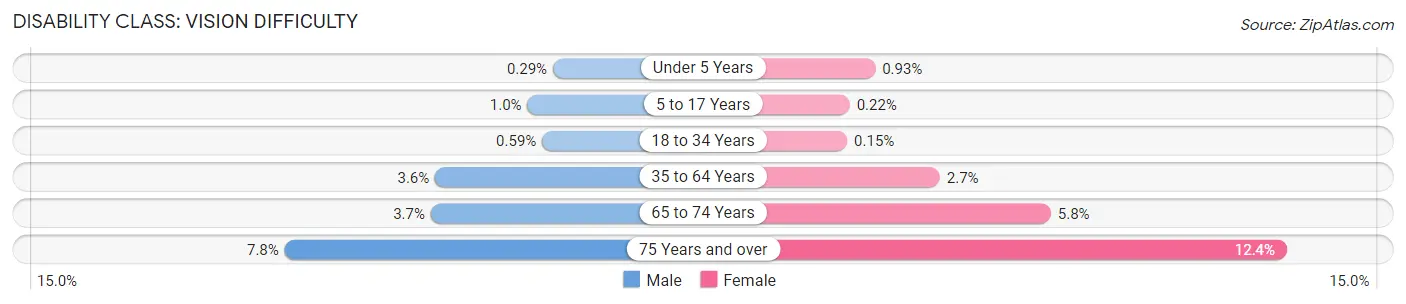
| Age Bracket | Male | Female |
| Under 5 Years | 5 (0.3%) | 19 (0.9%) |
| 5 to 17 Years | 46 (1.0%) | 9 (0.2%) |
| 18 to 34 Years | 64 (0.6%) | 19 (0.2%) |
| 35 to 64 Years | 406 (3.6%) | 329 (2.7%) |
| 65 to 74 Years | 93 (3.7%) | 188 (5.8%) |
| 75 Years and over | 137 (7.8%) | 318 (12.4%) |
Disability Class: Cognitive Difficulty
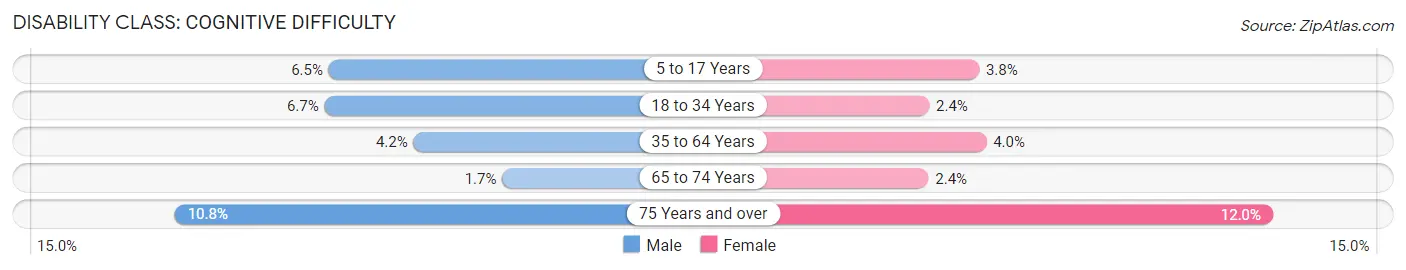
| Age Bracket | Male | Female |
| 5 to 17 Years | 301 (6.5%) | 154 (3.8%) |
| 18 to 34 Years | 723 (6.7%) | 307 (2.4%) |
| 35 to 64 Years | 474 (4.2%) | 485 (4.0%) |
| 65 to 74 Years | 43 (1.7%) | 78 (2.4%) |
| 75 Years and over | 191 (10.8%) | 308 (12.0%) |
Disability Class: Ambulatory Difficulty
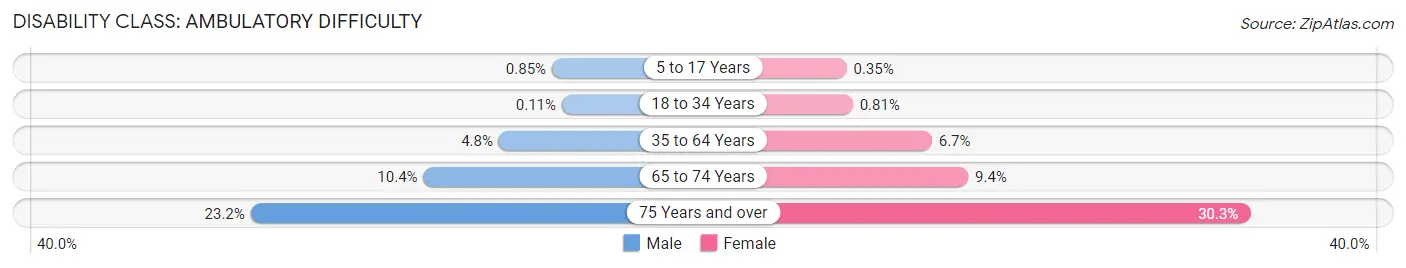
| Age Bracket | Male | Female |
| 5 to 17 Years | 39 (0.9%) | 14 (0.4%) |
| 18 to 34 Years | 12 (0.1%) | 103 (0.8%) |
| 35 to 64 Years | 544 (4.8%) | 806 (6.7%) |
| 65 to 74 Years | 262 (10.4%) | 303 (9.4%) |
| 75 Years and over | 410 (23.2%) | 778 (30.3%) |
Disability Class: Self-Care Difficulty
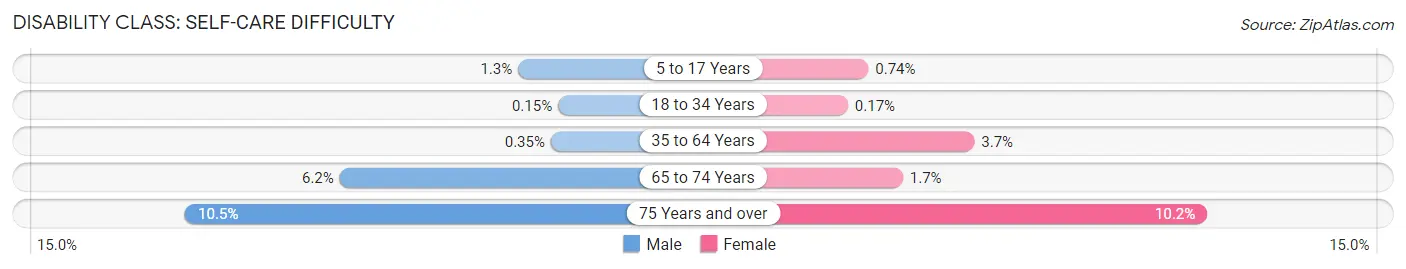
| Age Bracket | Male | Female |
| 5 to 17 Years | 58 (1.3%) | 30 (0.7%) |
| 18 to 34 Years | 16 (0.2%) | 22 (0.2%) |
| 35 to 64 Years | 40 (0.4%) | 445 (3.7%) |
| 65 to 74 Years | 157 (6.2%) | 55 (1.7%) |
| 75 Years and over | 186 (10.5%) | 261 (10.2%) |
Technology Access in Greenville
Computing Device Access in Greenville
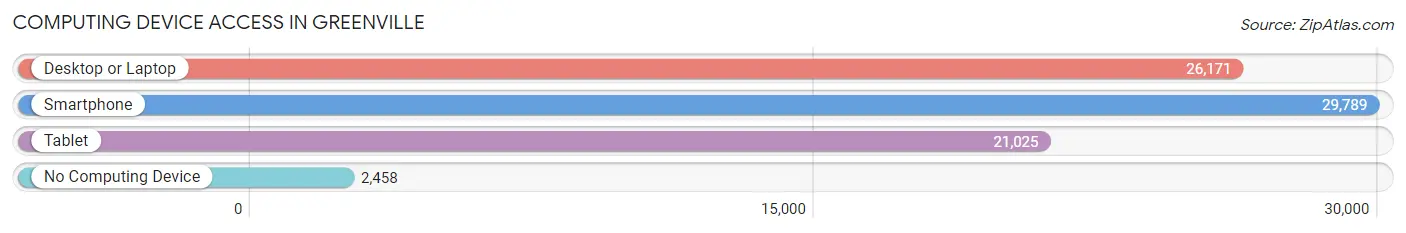
| Device Type | # Households | % Households |
| Desktop or Laptop | 26,171 | 78.0% |
| Smartphone | 29,789 | 88.8% |
| Tablet | 21,025 | 62.7% |
| No Computing Device | 2,458 | 7.3% |
| Total | 33,550 | 100.0% |
Internet Access in Greenville
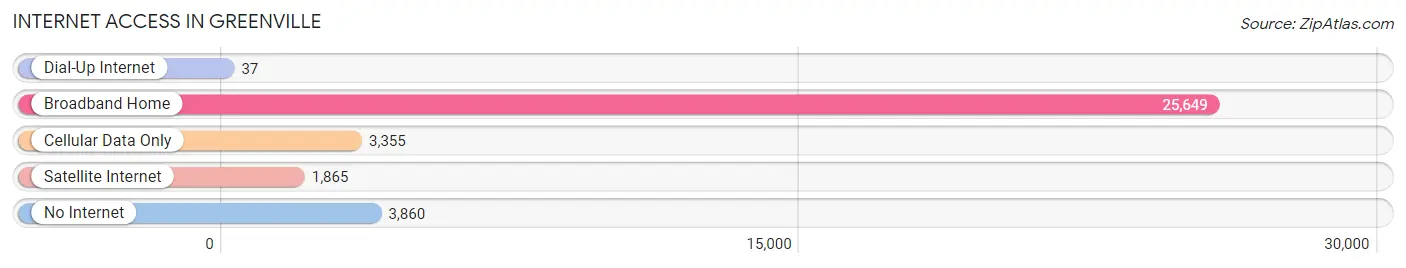
| Internet Type | # Households | % Households |
| Dial-Up Internet | 37 | 0.1% |
| Broadband Home | 25,649 | 76.4% |
| Cellular Data Only | 3,355 | 10.0% |
| Satellite Internet | 1,865 | 5.6% |
| No Internet | 3,860 | 11.5% |
| Total | 33,550 | 100.0% |
Greenville Summary
Greenville, South Carolina is a city located in the Upstate region of the state. It is the sixth-largest city in South Carolina and the largest city in the Greenville-Spartanburg-Anderson Combined Statistical Area. The city is situated in the foothills of the Blue Ridge Mountains and is located approximately halfway between Atlanta, Georgia and Charlotte, North Carolina. Greenville is known for its vibrant downtown area, which is home to numerous restaurants, shops, and entertainment venues.
Geography
Greenville is located in the foothills of the Blue Ridge Mountains in the Upstate region of South Carolina. The city is situated along the Reedy River, which flows through the downtown area. The city is located approximately halfway between Atlanta, Georgia and Charlotte, North Carolina. The city is also located near the border of North Carolina and Georgia.
The city has a total area of 24.3 square miles, of which 24.2 square miles is land and 0.1 square miles is water. The city is located at an elevation of 830 feet above sea level.
History
Greenville was founded in 1786 and was originally known as Pleasantburg. The city was named after General Nathanael Greene, who served in the American Revolutionary War. The city was incorporated in 1831 and was named the seat of Greenville County in 1868.
Greenville experienced rapid growth in the late 19th and early 20th centuries, due to the development of the textile industry. The city was also home to several major manufacturing companies, such as General Electric and Westinghouse.
In the late 20th century, the city experienced a decline in the textile industry, which led to an economic downturn. However, the city has since experienced a resurgence, due to the development of the technology and healthcare industries.
Economy
Greenville’s economy is largely based on the service industry, with the largest employers being healthcare, retail, and hospitality. The city is also home to several major corporations, such as Michelin North America, Fluor Corporation, and ScanSource.
The city is also home to several educational institutions, such as Furman University, Bob Jones University, and Greenville Technical College.
Demographics
As of the 2010 census, the population of Greenville was 58,409. The racial makeup of the city was 68.2% White, 24.7% African American, 0.3% Native American, 2.2% Asian, 0.1% Pacific Islander, 2.2% from other races, and 2.3% from two or more races. Hispanic or Latino of any race were 5.7% of the population.
The median income for a household in the city was $41,945, and the median income for a family was $51,856. The per capita income for the city was $25,945.
Conclusion
Greenville, South Carolina is a city located in the Upstate region of the state. It is the sixth-largest city in South Carolina and the largest city in the Greenville-Spartanburg-Anderson Combined Statistical Area. The city is situated in the foothills of the Blue Ridge Mountains and is located approximately halfway between Atlanta, Georgia and Charlotte, North Carolina. Greenville is known for its vibrant downtown area, which is home to numerous restaurants, shops, and entertainment venues. The city’s economy is largely based on the service industry, with the largest employers being healthcare, retail, and hospitality. As of the 2010 census, the population of Greenville was 58,409. The racial makeup of the city was 68.2% White, 24.7% African American, 0.3% Native American, 2.2% Asian, 0.1% Pacific Islander, 2.2% from other races, and 2.3% from two or more races. The median income for a household in the city was $41,945, and the median income for a family was $51,856. The per capita income for the city was $25,945.
Common Questions
What is Per Capita Income in Greenville?
Per Capita income in Greenville is $52,404.
What is the Median Family Income in Greenville?
Median Family Income in Greenville is $98,535.
What is the Median Household income in Greenville?
Median Household Income in Greenville is $65,519.
What is Income or Wage Gap in Greenville?
Income or Wage Gap in Greenville is 33.6%.
Women in Greenville earn 66.4 cents for every dollar earned by a man.
What is Family Income Deficit in Greenville?
Family Income Deficit in Greenville is $12,029.
Families that are below poverty line in Greenville earn $12,029 less on average than the poverty threshold level.
What is Inequality or Gini Index in Greenville?
Inequality or Gini Index in Greenville is 0.55.
What is the Total Population of Greenville?
Total Population of Greenville is 70,838.
What is the Total Male Population of Greenville?
Total Male Population of Greenville is 33,978.
What is the Total Female Population of Greenville?
Total Female Population of Greenville is 36,860.
What is the Ratio of Males per 100 Females in Greenville?
There are 92.18 Males per 100 Females in Greenville.
What is the Ratio of Females per 100 Males in Greenville?
There are 108.48 Females per 100 Males in Greenville.
What is the Median Population Age in Greenville?
Median Population Age in Greenville is 33.8 Years.
What is the Average Family Size in Greenville
Average Family Size in Greenville is 2.8 People.
What is the Average Household Size in Greenville
Average Household Size in Greenville is 2.0 People.
How Large is the Labor Force in Greenville?
There are 40,836 People in the Labor Forcein in Greenville.
What is the Percentage of People in the Labor Force in Greenville?
68.5% of People are in the Labor Force in Greenville.
What is the Unemployment Rate in Greenville?
Unemployment Rate in Greenville is 3.8%.