Conway, SC Map & Demographics
Conway Map
Conway Overview
$23,818
PER CAPITA INCOME
$62,963
AVG FAMILY INCOME
$48,161
AVG HOUSEHOLD INCOME
15.5%
WAGE / INCOME GAP [ % ]
84.5¢/ $1
WAGE / INCOME GAP [ $ ]
$12,285
FAMILY INCOME DEFICIT
0.47
INEQUALITY / GINI INDEX
25,121
TOTAL POPULATION
11,851
MALE POPULATION
13,270
FEMALE POPULATION
89.31
MALES / 100 FEMALES
111.97
FEMALES / 100 MALES
34.4
MEDIAN AGE
3.3
AVG FAMILY SIZE
2.6
AVG HOUSEHOLD SIZE
10,445
LABOR FORCE [ PEOPLE ]
49.1%
PERCENT IN LABOR FORCE
8.8%
UNEMPLOYMENT RATE
Conway Area Codes
Income in Conway
Income Overview in Conway
Per Capita Income in Conway is $23,818, while median incomes of families and households are $62,963 and $48,161 respectively.
| Characteristic | Number | Measure |
| Per Capita Income | 25,121 | $23,818 |
| Median Family Income | 4,916 | $62,963 |
| Mean Family Income | 4,916 | $77,424 |
| Median Household Income | 8,065 | $48,161 |
| Mean Household Income | 8,065 | $64,454 |
| Income Deficit | 4,916 | $12,285 |
| Wage / Income Gap (%) | 25,121 | 15.51% |
| Wage / Income Gap ($) | 25,121 | 84.49¢ per $1 |
| Gini / Inequality Index | 25,121 | 0.47 |
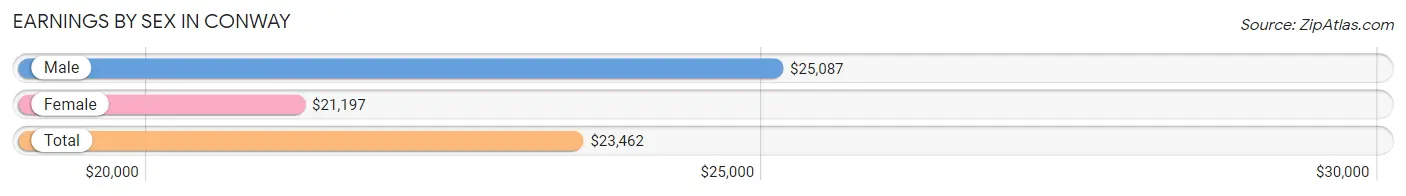
Earnings by Sex in Conway
Average Earnings in Conway are $23,462, $25,087 for men and $21,197 for women, a difference of 15.5%.
| Sex | Number | Average Earnings |
| Male | 6,135 (50.3%) | $25,087 |
| Female | 6,071 (49.7%) | $21,197 |
| Total | 12,206 (100.0%) | $23,462 |
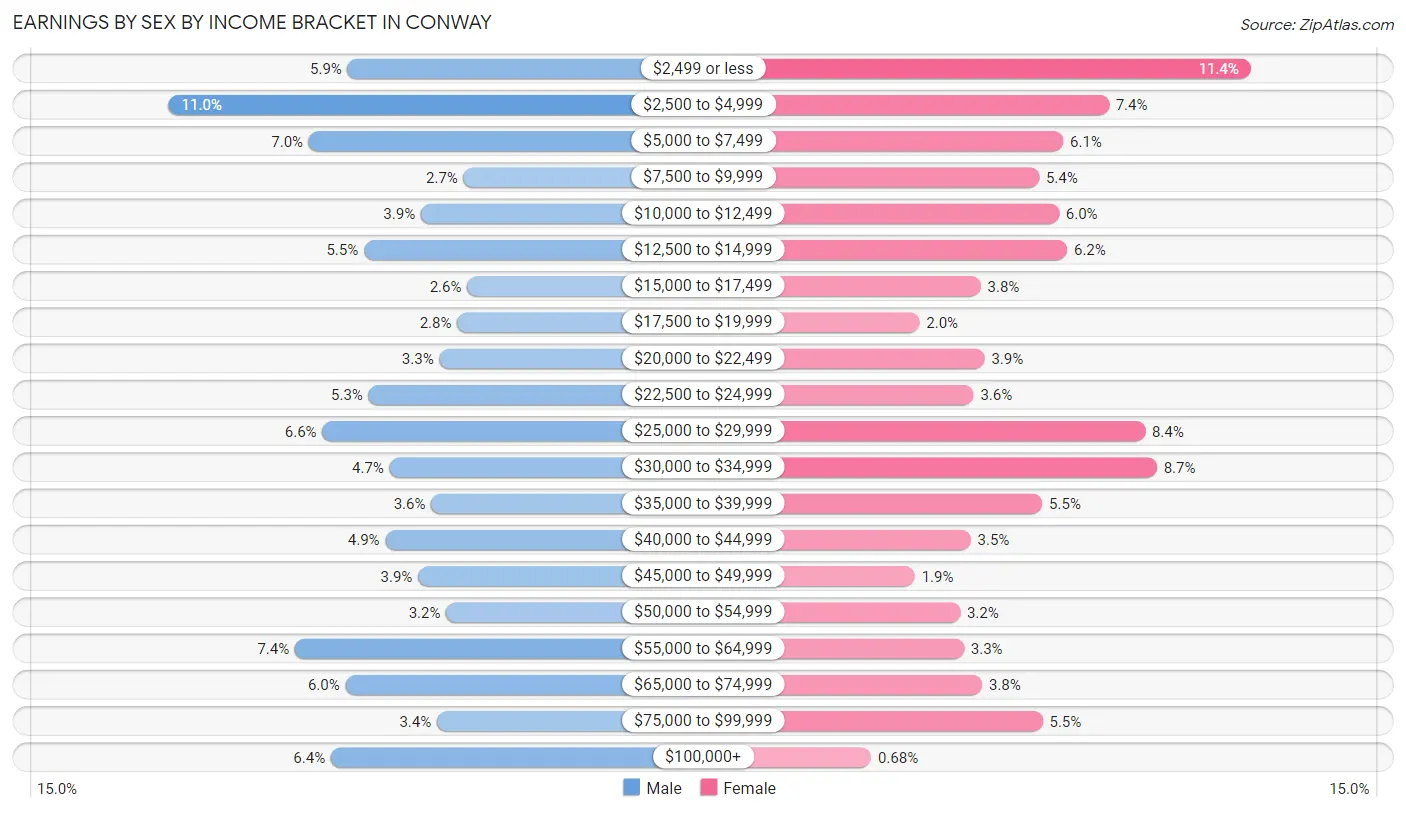
Earnings by Sex by Income Bracket in Conway
The most common earnings brackets in Conway are $2,500 to $4,999 for men (672 | 11.0%) and $2,499 or less for women (689 | 11.4%).
| Income | Male | Female |
| $2,499 or less | 363 (5.9%) | 689 (11.4%) |
| $2,500 to $4,999 | 672 (11.0%) | 447 (7.4%) |
| $5,000 to $7,499 | 430 (7.0%) | 369 (6.1%) |
| $7,500 to $9,999 | 163 (2.7%) | 328 (5.4%) |
| $10,000 to $12,499 | 237 (3.9%) | 362 (6.0%) |
| $12,500 to $14,999 | 335 (5.5%) | 376 (6.2%) |
| $15,000 to $17,499 | 157 (2.6%) | 228 (3.8%) |
| $17,500 to $19,999 | 174 (2.8%) | 124 (2.0%) |
| $20,000 to $22,499 | 205 (3.3%) | 235 (3.9%) |
| $22,500 to $24,999 | 327 (5.3%) | 216 (3.6%) |
| $25,000 to $29,999 | 407 (6.6%) | 509 (8.4%) |
| $30,000 to $34,999 | 291 (4.7%) | 529 (8.7%) |
| $35,000 to $39,999 | 219 (3.6%) | 333 (5.5%) |
| $40,000 to $44,999 | 298 (4.9%) | 211 (3.5%) |
| $45,000 to $49,999 | 242 (3.9%) | 116 (1.9%) |
| $50,000 to $54,999 | 193 (3.2%) | 193 (3.2%) |
| $55,000 to $64,999 | 454 (7.4%) | 200 (3.3%) |
| $65,000 to $74,999 | 367 (6.0%) | 231 (3.8%) |
| $75,000 to $99,999 | 209 (3.4%) | 334 (5.5%) |
| $100,000+ | 392 (6.4%) | 41 (0.7%) |
| Total | 6,135 (100.0%) | 6,071 (100.0%) |
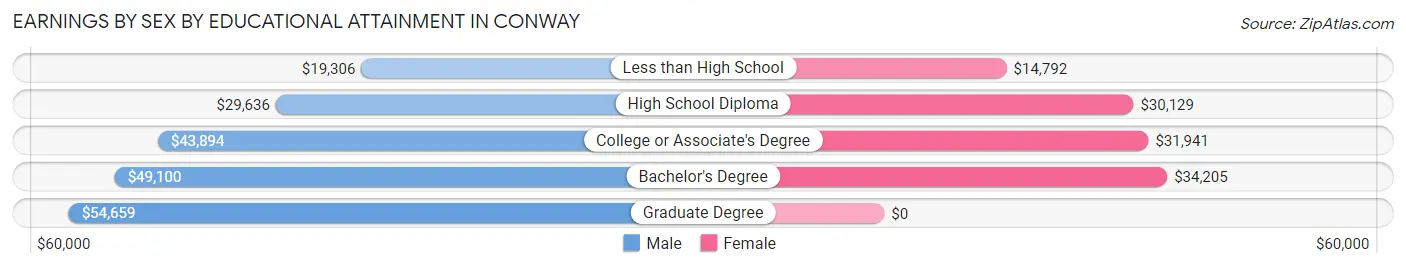
Earnings by Sex by Educational Attainment in Conway
Average earnings in Conway are $38,829 for men and $30,507 for women, a difference of 21.4%. Men with an educational attainment of graduate degree enjoy the highest average annual earnings of $54,659, while those with less than high school education earn the least with $19,306. Women with an educational attainment of bachelor's degree earn the most with the average annual earnings of $34,205, while those with less than high school education have the smallest earnings of $14,792.
| Educational Attainment | Male Income | Female Income |
| Less than High School | $19,306 | $14,792 |
| High School Diploma | $29,636 | $30,129 |
| College or Associate's Degree | $43,894 | $31,941 |
| Bachelor's Degree | $49,100 | $34,205 |
| Graduate Degree | $54,659 | $0 |
| Total | $38,829 | $30,507 |
Family Income in Conway
Family Income Brackets in Conway
According to the Conway family income data, there are 1,047 families falling into the $50,000 to $74,999 income range, which is the most common income bracket and makes up 21.3% of all families. Conversely, the $10,000 to $14,999 income bracket is the least frequent group with only 167 families (3.4%) belonging to this category.
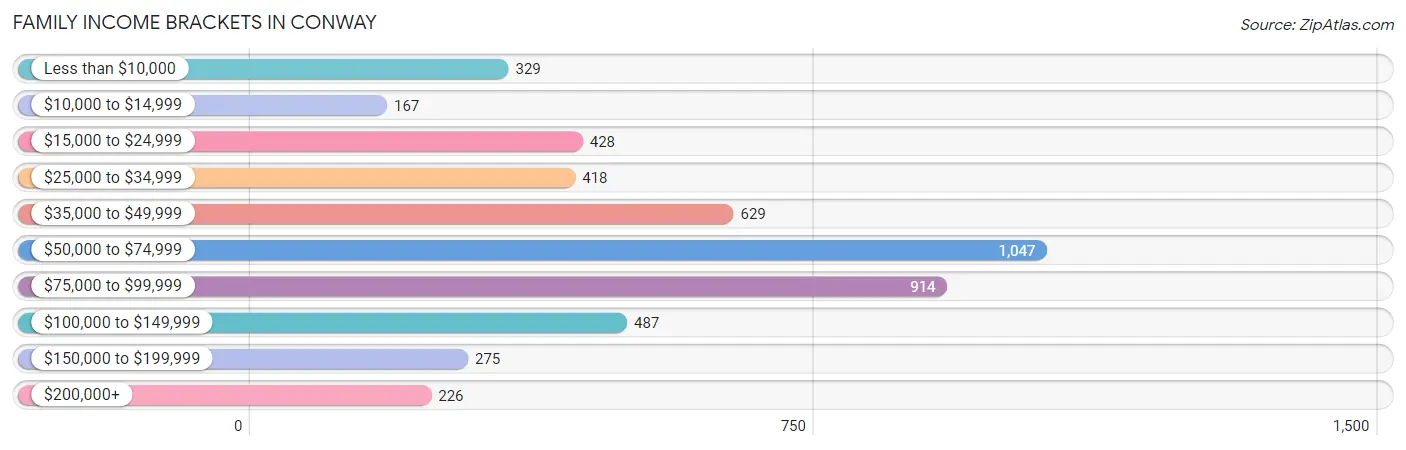
| Income Bracket | # Families | % Families |
| Less than $10,000 | 329 | 6.7% |
| $10,000 to $14,999 | 167 | 3.4% |
| $15,000 to $24,999 | 428 | 8.7% |
| $25,000 to $34,999 | 418 | 8.5% |
| $35,000 to $49,999 | 629 | 12.8% |
| $50,000 to $74,999 | 1,047 | 21.3% |
| $75,000 to $99,999 | 914 | 18.6% |
| $100,000 to $149,999 | 487 | 9.9% |
| $150,000 to $199,999 | 275 | 5.6% |
| $200,000+ | 226 | 4.6% |
Family Income by Famaliy Size in Conway
3-person families (869 | 17.7%) account for the highest median family income in Conway with $75,491 per family, while 2-person families (2,720 | 55.3%) have the highest median income of $29,327 per family member.
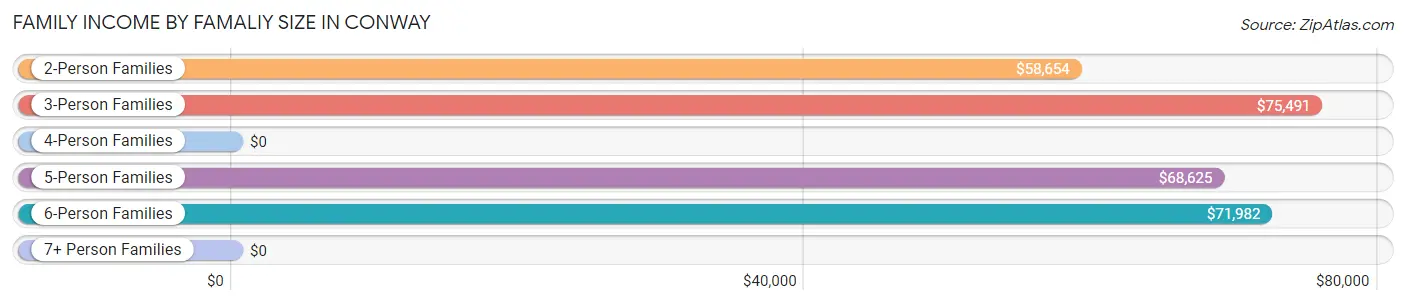
| Income Bracket | # Families | Median Income |
| 2-Person Families | 2,720 (55.3%) | $58,654 |
| 3-Person Families | 869 (17.7%) | $75,491 |
| 4-Person Families | 833 (16.9%) | $0 |
| 5-Person Families | 336 (6.8%) | $68,625 |
| 6-Person Families | 145 (2.9%) | $71,982 |
| 7+ Person Families | 13 (0.3%) | $0 |
| Total | 4,916 (100.0%) | $62,963 |
Family Income by Number of Earners in Conway
The median family income in Conway is $62,963, with families comprising 3+ earners (295) having the highest median family income of $93,220, while families with 1 earner (1,731) have the lowest median family income of $40,201, accounting for 6.0% and 35.2% of families, respectively.
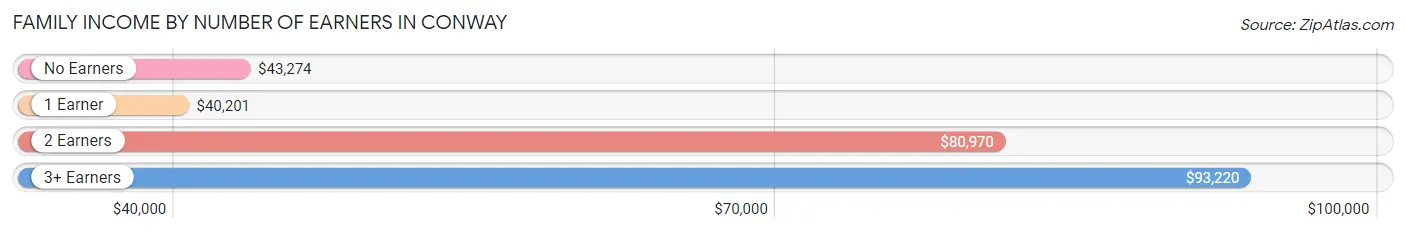
| Number of Earners | # Families | Median Income |
| No Earners | 1,121 (22.8%) | $43,274 |
| 1 Earner | 1,731 (35.2%) | $40,201 |
| 2 Earners | 1,769 (36.0%) | $80,970 |
| 3+ Earners | 295 (6.0%) | $93,220 |
| Total | 4,916 (100.0%) | $62,963 |
Household Income in Conway
Household Income Brackets in Conway
With 1,605 households falling in the category, the $50,000 to $74,999 income range is the most frequent in Conway, accounting for 19.9% of all households. In contrast, only 282 households (3.5%) fall into the $200,000+ income bracket, making it the least populous group.
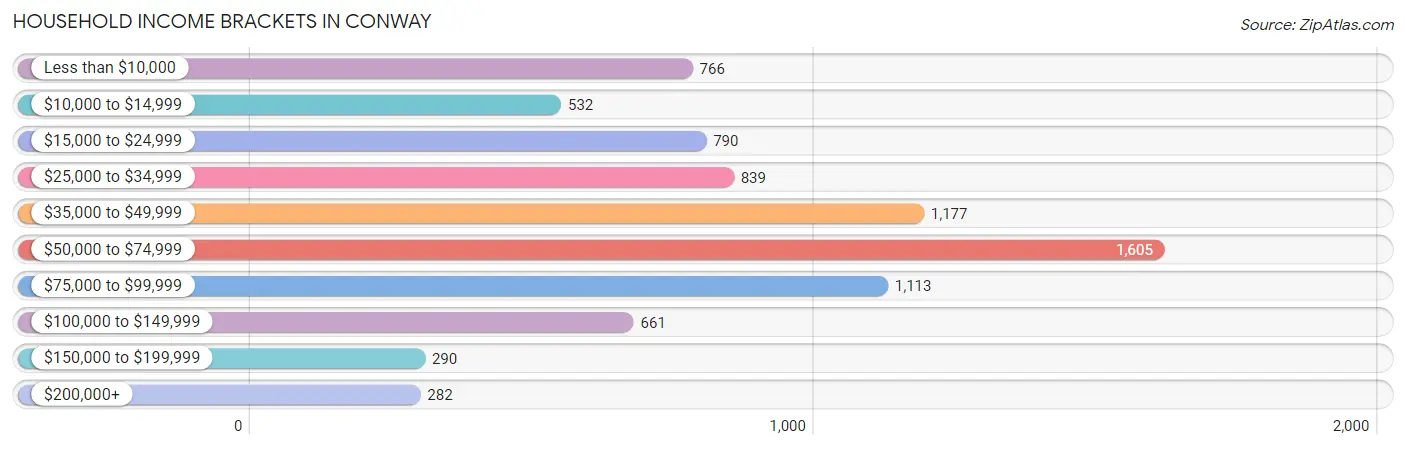
| Income Bracket | # Households | % Households |
| Less than $10,000 | 766 | 9.5% |
| $10,000 to $14,999 | 532 | 6.6% |
| $15,000 to $24,999 | 790 | 9.8% |
| $25,000 to $34,999 | 839 | 10.4% |
| $35,000 to $49,999 | 1,177 | 14.6% |
| $50,000 to $74,999 | 1,605 | 19.9% |
| $75,000 to $99,999 | 1,113 | 13.8% |
| $100,000 to $149,999 | 661 | 8.2% |
| $150,000 to $199,999 | 290 | 3.6% |
| $200,000+ | 282 | 3.5% |
Household Income by Householder Age in Conway
The median household income in Conway is $48,161, with the highest median household income of $55,574 found in the 45 to 64 years age bracket for the primary householder. A total of 3,312 households (41.1%) fall into this category. Meanwhile, the 65+ years age bracket for the primary householder has the lowest median household income of $41,632, with 2,334 households (28.9%) in this group.
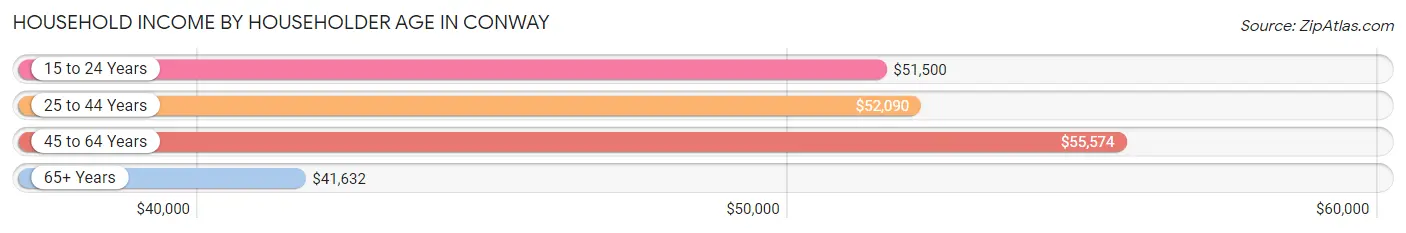
| Income Bracket | # Households | Median Income |
| 15 to 24 Years | 302 (3.7%) | $51,500 |
| 25 to 44 Years | 2,117 (26.3%) | $52,090 |
| 45 to 64 Years | 3,312 (41.1%) | $55,574 |
| 65+ Years | 2,334 (28.9%) | $41,632 |
| Total | 8,065 (100.0%) | $48,161 |
Poverty in Conway
Income Below Poverty by Sex and Age in Conway
With 19.0% poverty level for males and 21.4% for females among the residents of Conway, 6 to 11 year old males and 16 and 17 year old females are the most vulnerable to poverty, with 294 males (50.6%) and 79 females (46.8%) in their respective age groups living below the poverty level.
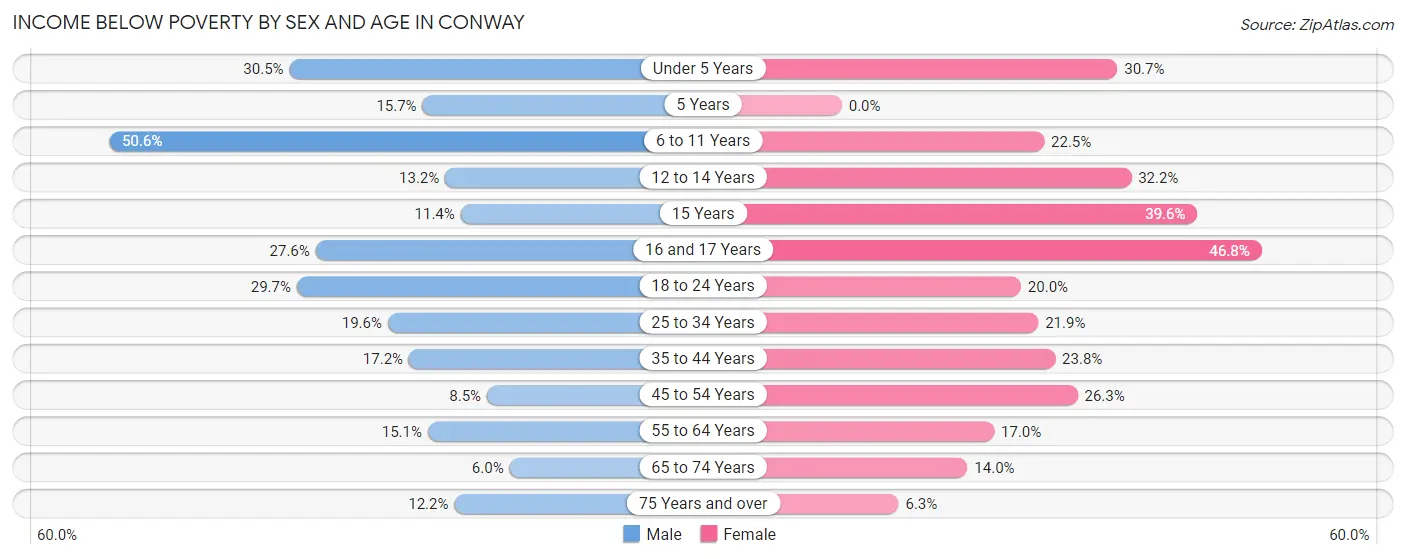
| Age Bracket | Male | Female |
| Under 5 Years | 137 (30.5%) | 154 (30.7%) |
| 5 Years | 16 (15.7%) | 0 (0.0%) |
| 6 to 11 Years | 294 (50.6%) | 185 (22.5%) |
| 12 to 14 Years | 37 (13.2%) | 126 (32.2%) |
| 15 Years | 31 (11.4%) | 78 (39.6%) |
| 16 and 17 Years | 133 (27.6%) | 79 (46.8%) |
| 18 to 24 Years | 337 (29.7%) | 152 (20.0%) |
| 25 to 34 Years | 241 (19.6%) | 323 (21.9%) |
| 35 to 44 Years | 199 (17.2%) | 272 (23.8%) |
| 45 to 54 Years | 68 (8.5%) | 463 (26.3%) |
| 55 to 64 Years | 215 (15.1%) | 264 (17.0%) |
| 65 to 74 Years | 79 (6.0%) | 213 (14.0%) |
| 75 Years and over | 65 (12.1%) | 40 (6.3%) |
| Total | 1,852 (19.0%) | 2,349 (21.4%) |
Income Above Poverty by Sex and Age in Conway
According to the poverty statistics in Conway, males aged 65 to 74 years and females aged 5 years are the age groups that are most secure financially, with 94.0% of males and 100.0% of females in these age groups living above the poverty line.
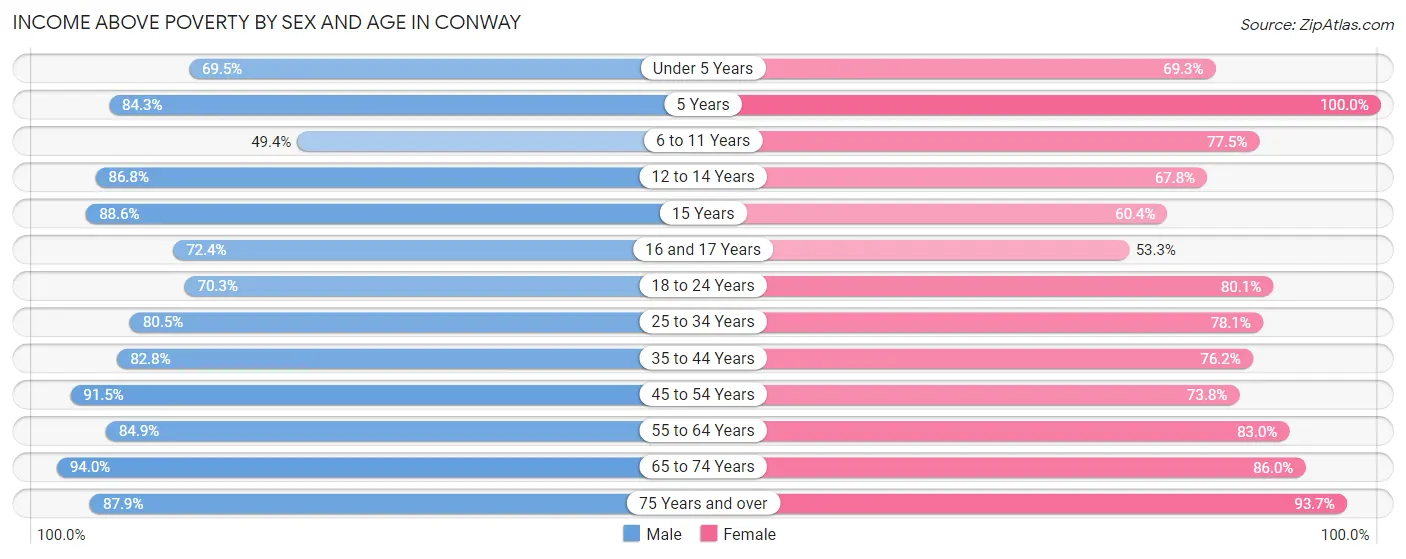
| Age Bracket | Male | Female |
| Under 5 Years | 312 (69.5%) | 348 (69.3%) |
| 5 Years | 86 (84.3%) | 51 (100.0%) |
| 6 to 11 Years | 287 (49.4%) | 636 (77.5%) |
| 12 to 14 Years | 244 (86.8%) | 265 (67.8%) |
| 15 Years | 240 (88.6%) | 119 (60.4%) |
| 16 and 17 Years | 349 (72.4%) | 90 (53.2%) |
| 18 to 24 Years | 798 (70.3%) | 610 (80.0%) |
| 25 to 34 Years | 992 (80.4%) | 1,153 (78.1%) |
| 35 to 44 Years | 958 (82.8%) | 873 (76.2%) |
| 45 to 54 Years | 731 (91.5%) | 1,301 (73.8%) |
| 55 to 64 Years | 1,209 (84.9%) | 1,293 (83.0%) |
| 65 to 74 Years | 1,237 (94.0%) | 1,309 (86.0%) |
| 75 Years and over | 470 (87.8%) | 593 (93.7%) |
| Total | 7,913 (81.0%) | 8,641 (78.6%) |
Income Below Poverty Among Married-Couple Families in Conway
The poverty statistics for married-couple families in Conway show that 11.3% or 360 of the total 3,174 families live below the poverty line. Families with 1 or 2 children have the highest poverty rate of 31.3%, comprising of 233 families. On the other hand, families with 3 or 4 children have the lowest poverty rate of 0.0%, which includes 0 families.
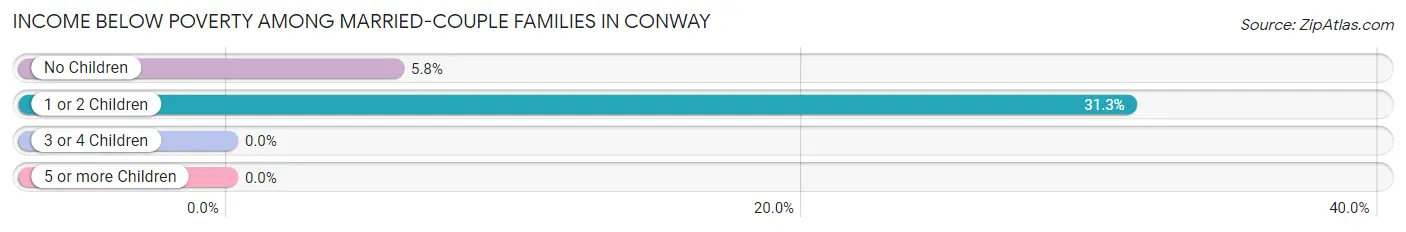
| Children | Above Poverty | Below Poverty |
| No Children | 2,069 (94.2%) | 127 (5.8%) |
| 1 or 2 Children | 512 (68.7%) | 233 (31.3%) |
| 3 or 4 Children | 233 (100.0%) | 0 (0.0%) |
| 5 or more Children | 0 (0.0%) | 0 (0.0%) |
| Total | 2,814 (88.7%) | 360 (11.3%) |
Income Below Poverty Among Single-Parent Households in Conway
According to the poverty data in Conway, 11.1% or 35 single-father households and 28.8% or 411 single-mother households are living below the poverty line. Among single-father households, those with 3 or 4 children have the highest poverty rate, with 17 households (100.0%) experiencing poverty. Likewise, among single-mother households, those with 3 or 4 children have the highest poverty rate, with 92 households (43.4%) falling below the poverty line.
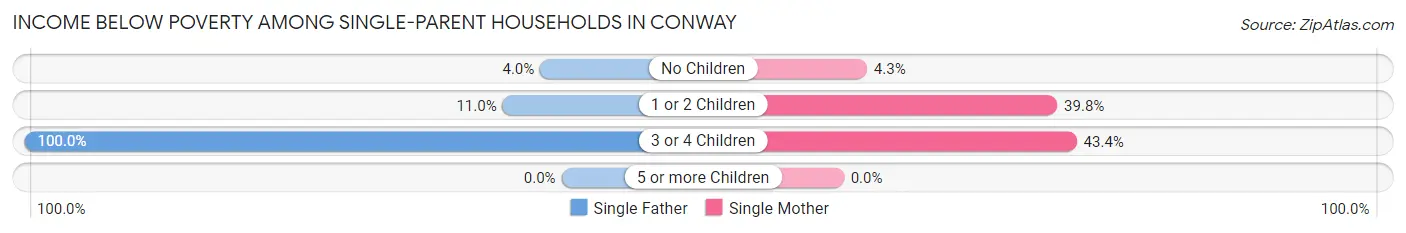
| Children | Single Father | Single Mother |
| No Children | 8 (4.0%) | 20 (4.3%) |
| 1 or 2 Children | 10 (11.0%) | 299 (39.8%) |
| 3 or 4 Children | 17 (100.0%) | 92 (43.4%) |
| 5 or more Children | 0 (0.0%) | 0 (0.0%) |
| Total | 35 (11.1%) | 411 (28.8%) |
Income Below Poverty Among Married-Couple vs Single-Parent Households in Conway
The poverty data for Conway shows that 360 of the married-couple family households (11.3%) and 446 of the single-parent households (25.6%) are living below the poverty level. Within the married-couple family households, those with 1 or 2 children have the highest poverty rate, with 233 households (31.3%) falling below the poverty line. Among the single-parent households, those with 3 or 4 children have the highest poverty rate, with 109 household (47.6%) living below poverty.
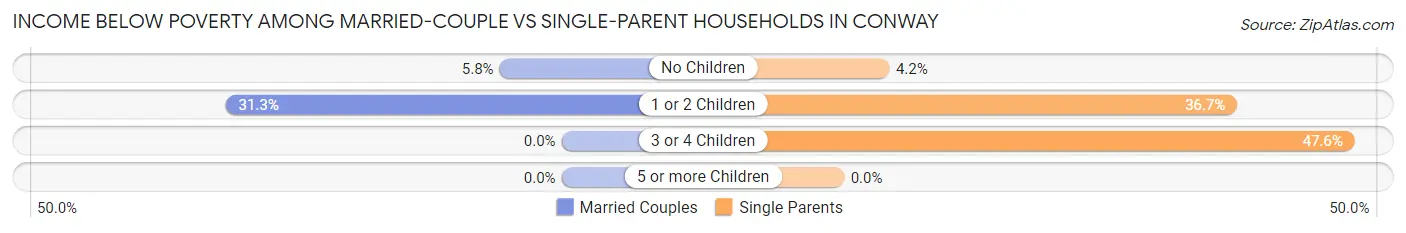
| Children | Married-Couple Families | Single-Parent Households |
| No Children | 127 (5.8%) | 28 (4.2%) |
| 1 or 2 Children | 233 (31.3%) | 309 (36.6%) |
| 3 or 4 Children | 0 (0.0%) | 109 (47.6%) |
| 5 or more Children | 0 (0.0%) | 0 (0.0%) |
| Total | 360 (11.3%) | 446 (25.6%) |
Race in Conway
The most populous races in Conway are White / Caucasian (15,060 | 60.0%), Black / African American (8,378 | 33.4%), and Two or more Races (766 | 3.0%).
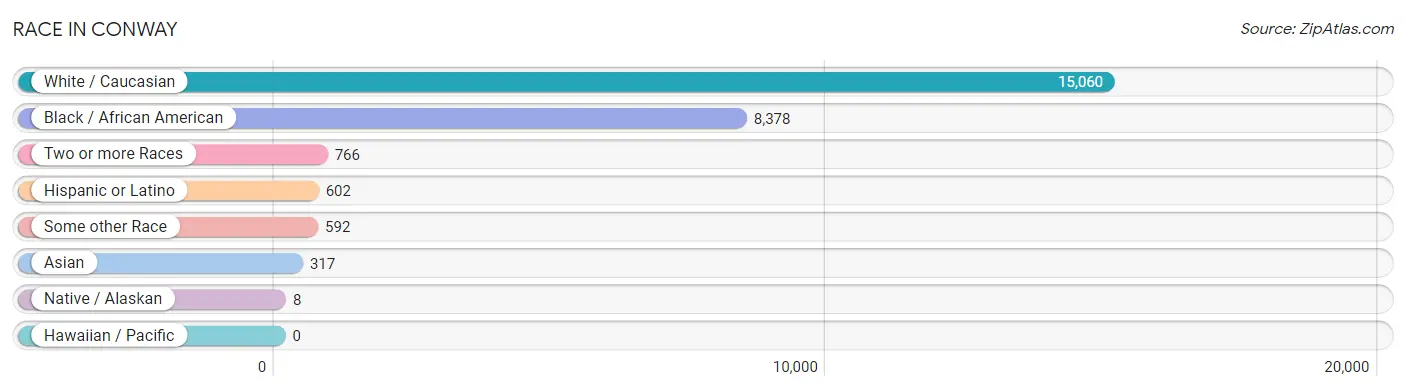
| Race | # Population | % Population |
| Asian | 317 | 1.3% |
| Black / African American | 8,378 | 33.4% |
| Hawaiian / Pacific | 0 | 0.0% |
| Hispanic or Latino | 602 | 2.4% |
| Native / Alaskan | 8 | 0.0% |
| White / Caucasian | 15,060 | 60.0% |
| Two or more Races | 766 | 3.0% |
| Some other Race | 592 | 2.4% |
| Total | 25,121 | 100.0% |
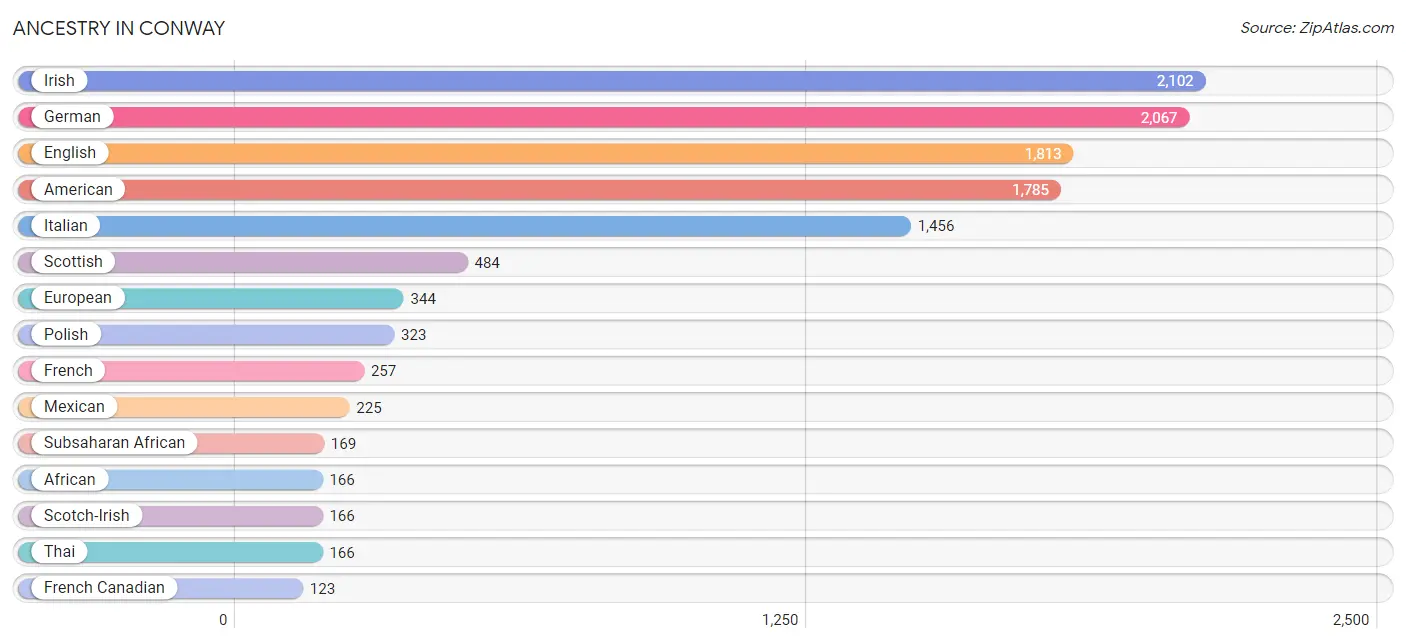
Ancestry in Conway
The most populous ancestries reported in Conway are Irish (2,102 | 8.4%), German (2,067 | 8.2%), English (1,813 | 7.2%), American (1,785 | 7.1%), and Italian (1,456 | 5.8%), together accounting for 36.7% of all Conway residents.
| Ancestry | # Population | % Population |
| African | 166 | 0.7% |
| Alaska Native | 9 | 0.0% |
| Albanian | 15 | 0.1% |
| American | 1,785 | 7.1% |
| Arab | 1 | 0.0% |
| Bhutanese | 72 | 0.3% |
| Brazilian | 39 | 0.2% |
| British | 75 | 0.3% |
| British West Indian | 11 | 0.0% |
| Burmese | 15 | 0.1% |
| Canadian | 33 | 0.1% |
| Central American | 80 | 0.3% |
| Cherokee | 57 | 0.2% |
| Colombian | 9 | 0.0% |
| Costa Rican | 12 | 0.1% |
| Croatian | 10 | 0.0% |
| Cuban | 13 | 0.1% |
| Czech | 14 | 0.1% |
| Czechoslovakian | 22 | 0.1% |
| Danish | 14 | 0.1% |
| Dominican | 36 | 0.1% |
| Dutch | 78 | 0.3% |
| Eastern European | 31 | 0.1% |
| English | 1,813 | 7.2% |
| European | 344 | 1.4% |
| Finnish | 65 | 0.3% |
| French | 257 | 1.0% |
| French Canadian | 123 | 0.5% |
| German | 2,067 | 8.2% |
| Greek | 60 | 0.2% |
| Guatemalan | 6 | 0.0% |
| Haitian | 30 | 0.1% |
| Hungarian | 61 | 0.2% |
| Indian (Asian) | 20 | 0.1% |
| Irish | 2,102 | 8.4% |
| Iroquois | 12 | 0.1% |
| Italian | 1,456 | 5.8% |
| Korean | 15 | 0.1% |
| Lebanese | 1 | 0.0% |
| Lithuanian | 49 | 0.2% |
| Lumbee | 12 | 0.1% |
| Malaysian | 21 | 0.1% |
| Mexican | 225 | 0.9% |
| New Zealander | 9 | 0.0% |
| Nigerian | 3 | 0.0% |
| Northern European | 35 | 0.1% |
| Norwegian | 56 | 0.2% |
| Pakistani | 24 | 0.1% |
| Panamanian | 62 | 0.3% |
| Pennsylvania German | 6 | 0.0% |
| Peruvian | 10 | 0.0% |
| Polish | 323 | 1.3% |
| Portuguese | 58 | 0.2% |
| Puerto Rican | 87 | 0.4% |
| Russian | 55 | 0.2% |
| Scotch-Irish | 166 | 0.7% |
| Scottish | 484 | 1.9% |
| South American | 19 | 0.1% |
| Spaniard | 117 | 0.5% |
| Spanish | 2 | 0.0% |
| Sri Lankan | 44 | 0.2% |
| Subsaharan African | 169 | 0.7% |
| Swedish | 87 | 0.4% |
| Swiss | 14 | 0.1% |
| Thai | 166 | 0.7% |
| Turkish | 31 | 0.1% |
| Ukrainian | 10 | 0.0% |
| Welsh | 68 | 0.3% |
| West Indian | 7 | 0.0% |
| Yugoslavian | 17 | 0.1% | View All 70 Rows |
Immigrants in Conway
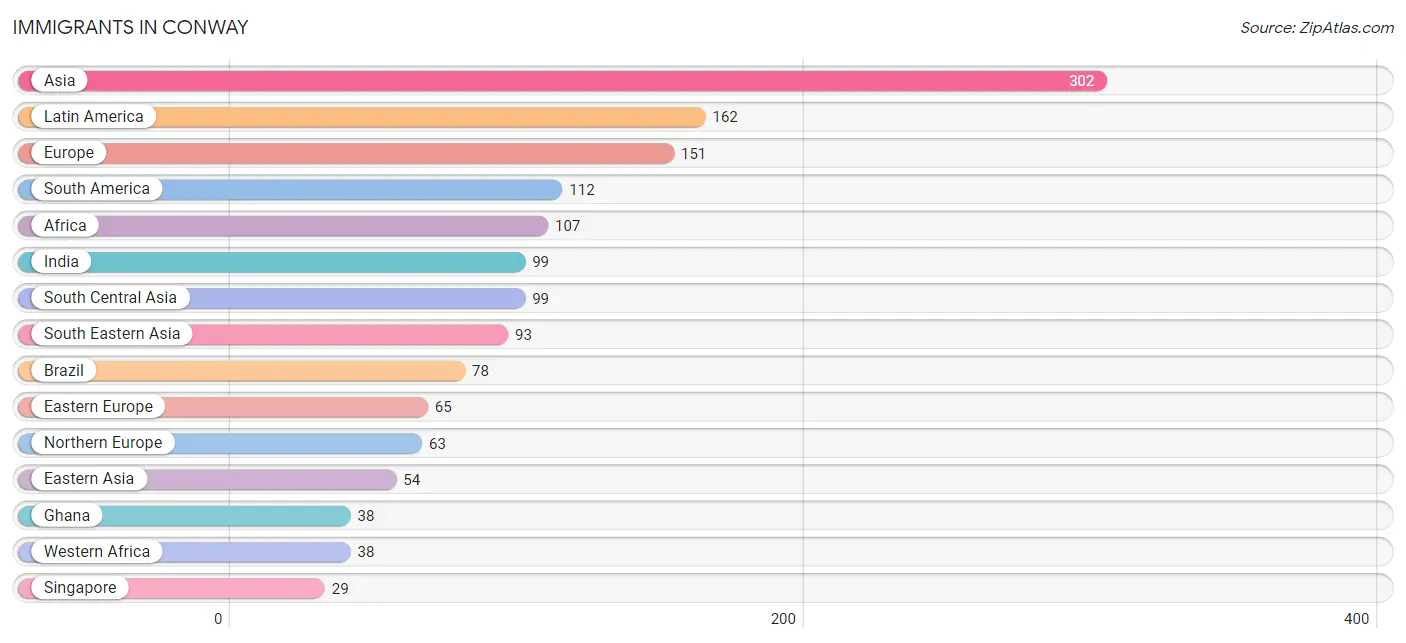
The most numerous immigrant groups reported in Conway came from Asia (302 | 1.2%), Latin America (162 | 0.6%), Europe (151 | 0.6%), South America (112 | 0.4%), and Africa (107 | 0.4%), together accounting for 3.3% of all Conway residents.
| Immigration Origin | # Population | % Population |
| Africa | 107 | 0.4% |
| Albania | 6 | 0.0% |
| Asia | 302 | 1.2% |
| Brazil | 78 | 0.3% |
| Caribbean | 27 | 0.1% |
| Central America | 23 | 0.1% |
| China | 19 | 0.1% |
| Colombia | 16 | 0.1% |
| Eastern Africa | 6 | 0.0% |
| Eastern Asia | 54 | 0.2% |
| Eastern Europe | 65 | 0.3% |
| England | 6 | 0.0% |
| Europe | 151 | 0.6% |
| Germany | 23 | 0.1% |
| Ghana | 38 | 0.2% |
| Grenada | 20 | 0.1% |
| Guatemala | 6 | 0.0% |
| Haiti | 7 | 0.0% |
| Hungary | 16 | 0.1% |
| India | 99 | 0.4% |
| Japan | 21 | 0.1% |
| Korea | 14 | 0.1% |
| Laos | 21 | 0.1% |
| Latin America | 162 | 0.6% |
| Mexico | 17 | 0.1% |
| Northern Europe | 63 | 0.3% |
| Oceania | 9 | 0.0% |
| Peru | 10 | 0.0% |
| Philippines | 15 | 0.1% |
| Poland | 21 | 0.1% |
| Russia | 22 | 0.1% |
| Singapore | 29 | 0.1% |
| South America | 112 | 0.4% |
| South Central Asia | 99 | 0.4% |
| South Eastern Asia | 93 | 0.4% |
| Thailand | 17 | 0.1% |
| Turkey | 23 | 0.1% |
| Venezuela | 8 | 0.0% |
| Vietnam | 11 | 0.0% |
| Western Africa | 38 | 0.2% |
| Western Asia | 23 | 0.1% |
| Western Europe | 23 | 0.1% | View All 42 Rows |
Sex and Age in Conway
Sex and Age in Conway
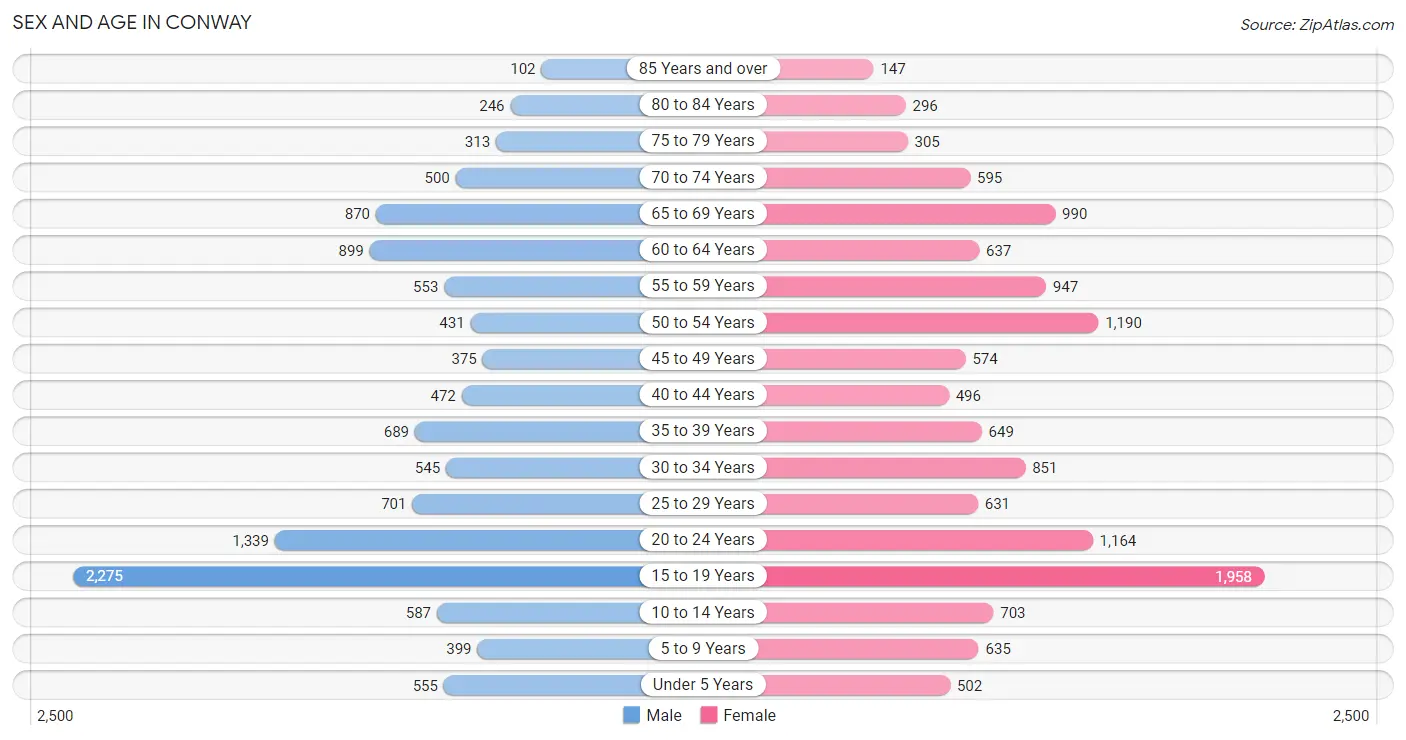
The most populous age groups in Conway are 15 to 19 Years (2,275 | 19.2%) for men and 15 to 19 Years (1,958 | 14.8%) for women.
| Age Bracket | Male | Female |
| Under 5 Years | 555 (4.7%) | 502 (3.8%) |
| 5 to 9 Years | 399 (3.4%) | 635 (4.8%) |
| 10 to 14 Years | 587 (5.0%) | 703 (5.3%) |
| 15 to 19 Years | 2,275 (19.2%) | 1,958 (14.8%) |
| 20 to 24 Years | 1,339 (11.3%) | 1,164 (8.8%) |
| 25 to 29 Years | 701 (5.9%) | 631 (4.8%) |
| 30 to 34 Years | 545 (4.6%) | 851 (6.4%) |
| 35 to 39 Years | 689 (5.8%) | 649 (4.9%) |
| 40 to 44 Years | 472 (4.0%) | 496 (3.7%) |
| 45 to 49 Years | 375 (3.2%) | 574 (4.3%) |
| 50 to 54 Years | 431 (3.6%) | 1,190 (9.0%) |
| 55 to 59 Years | 553 (4.7%) | 947 (7.1%) |
| 60 to 64 Years | 899 (7.6%) | 637 (4.8%) |
| 65 to 69 Years | 870 (7.3%) | 990 (7.5%) |
| 70 to 74 Years | 500 (4.2%) | 595 (4.5%) |
| 75 to 79 Years | 313 (2.6%) | 305 (2.3%) |
| 80 to 84 Years | 246 (2.1%) | 296 (2.2%) |
| 85 Years and over | 102 (0.9%) | 147 (1.1%) |
| Total | 11,851 (100.0%) | 13,270 (100.0%) |
Families and Households in Conway
Median Family Size in Conway
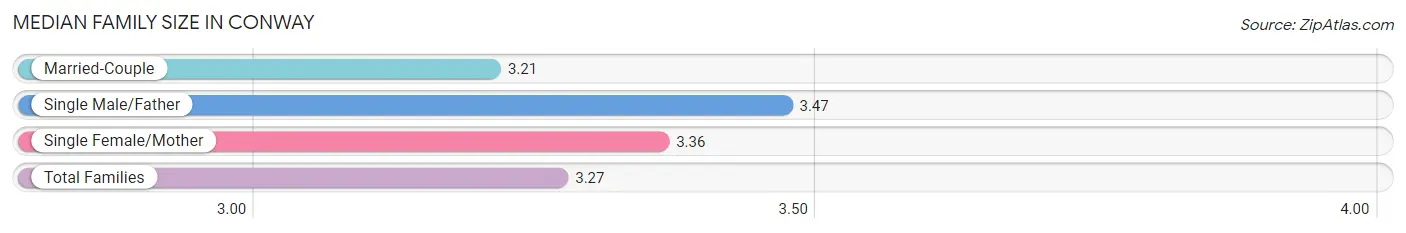
The median family size in Conway is 3.27 persons per family, with single male/father families (316 | 6.4%) accounting for the largest median family size of 3.47 persons per family. On the other hand, married-couple families (3,174 | 64.6%) represent the smallest median family size with 3.21 persons per family.
| Family Type | # Families | Family Size |
| Married-Couple | 3,174 (64.6%) | 3.21 |
| Single Male/Father | 316 (6.4%) | 3.47 |
| Single Female/Mother | 1,426 (29.0%) | 3.36 |
| Total Families | 4,916 (100.0%) | 3.27 |
Median Household Size in Conway
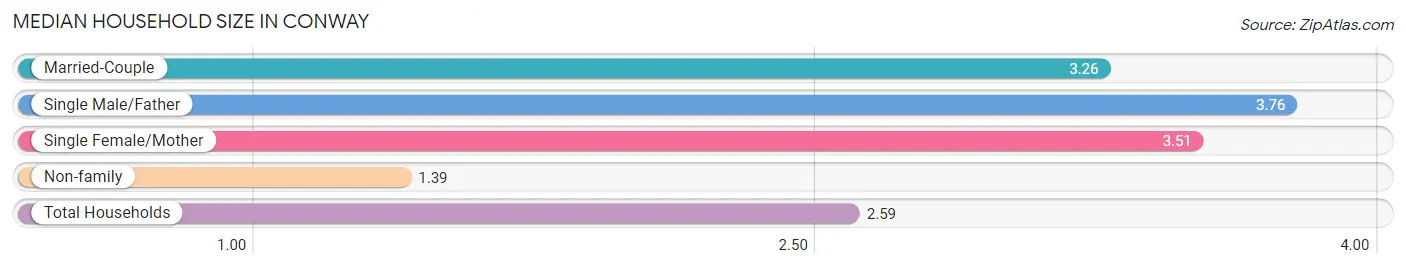
The median household size in Conway is 2.59 persons per household, with single male/father households (316 | 3.9%) accounting for the largest median household size of 3.76 persons per household. non-family households (3,149 | 39.1%) represent the smallest median household size with 1.39 persons per household.
| Household Type | # Households | Household Size |
| Married-Couple | 3,174 (39.4%) | 3.26 |
| Single Male/Father | 316 (3.9%) | 3.76 |
| Single Female/Mother | 1,426 (17.7%) | 3.51 |
| Non-family | 3,149 (39.1%) | 1.39 |
| Total Households | 8,065 (100.0%) | 2.59 |
Household Size by Marriage Status in Conway
Out of a total of 8,065 households in Conway, 4,916 (61.0%) are family households, while 3,149 (39.1%) are nonfamily households. The most numerous type of family households are 2-person households, comprising 2,576, and the most common type of nonfamily households are 1-person households, comprising 2,660.
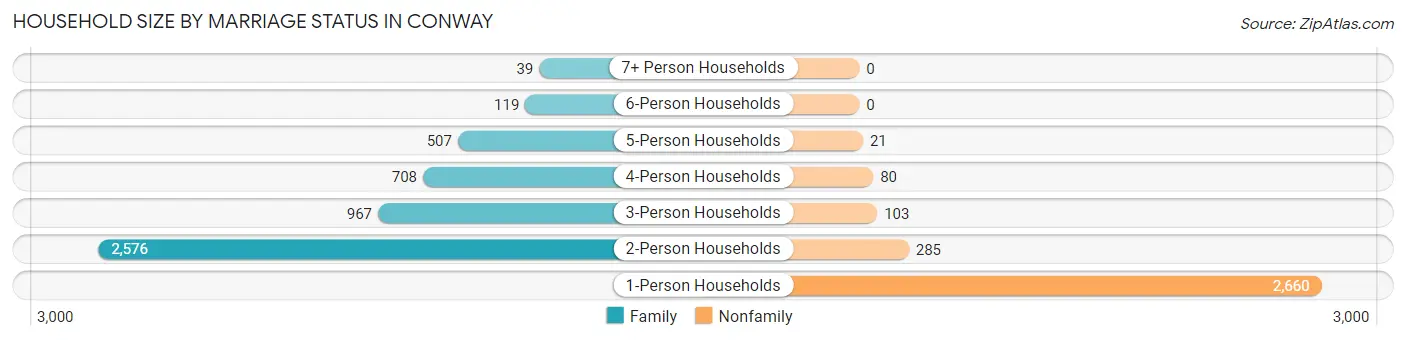
| Household Size | Family Households | Nonfamily Households |
| 1-Person Households | - | 2,660 (33.0%) |
| 2-Person Households | 2,576 (31.9%) | 285 (3.5%) |
| 3-Person Households | 967 (12.0%) | 103 (1.3%) |
| 4-Person Households | 708 (8.8%) | 80 (1.0%) |
| 5-Person Households | 507 (6.3%) | 21 (0.3%) |
| 6-Person Households | 119 (1.5%) | 0 (0.0%) |
| 7+ Person Households | 39 (0.5%) | 0 (0.0%) |
| Total | 4,916 (61.0%) | 3,149 (39.1%) |
Female Fertility in Conway
Fertility by Age in Conway
Average fertility rate in Conway is 36.0 births per 1,000 women. Women in the age bracket of 20 to 34 years have the highest fertility rate with 84.0 births per 1,000 women. Women in the age bracket of 20 to 34 years acount for 88.4% of all women with births.
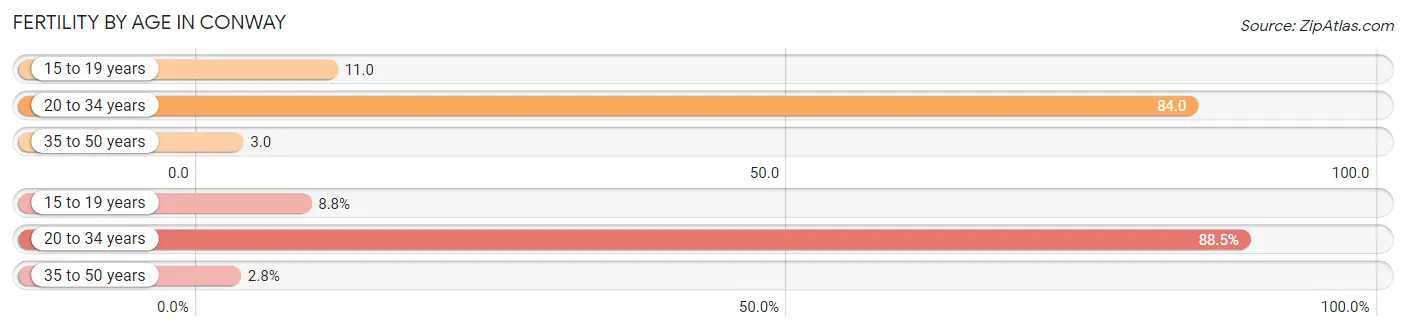
| Age Bracket | Women with Births | Births / 1,000 Women |
| 15 to 19 years | 22 (8.8%) | 11.0 |
| 20 to 34 years | 222 (88.4%) | 84.0 |
| 35 to 50 years | 7 (2.8%) | 3.0 |
| Total | 251 (100.0%) | 36.0 |
Fertility by Age by Marriage Status in Conway
41.8% of women with births (251) in Conway are married. The highest percentage of unmarried women with births falls into 15 to 19 years age bracket with 100.0% of them unmarried at the time of birth, while the lowest percentage of unmarried women with births belong to 35 to 50 years age bracket with 0.0% of them unmarried.
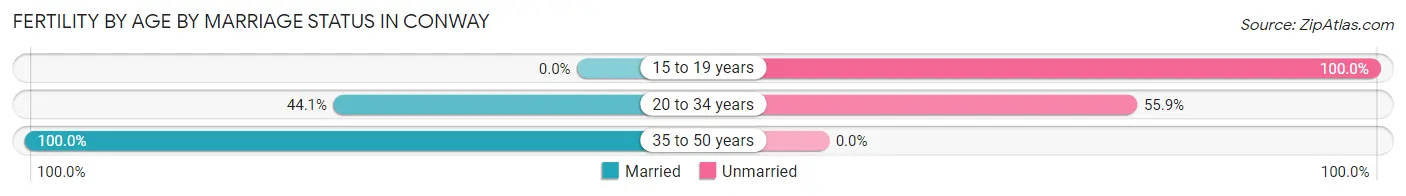
| Age Bracket | Married | Unmarried |
| 15 to 19 years | 0 (0.0%) | 22 (100.0%) |
| 20 to 34 years | 98 (44.1%) | 124 (55.9%) |
| 35 to 50 years | 7 (100.0%) | 0 (0.0%) |
| Total | 105 (41.8%) | 146 (58.2%) |
Fertility by Education in Conway
Average fertility rate in Conway is 36.0 births per 1,000 women. Women with the education attainment of bachelor's degree have the highest fertility rate of 195.0 births per 1,000 women, while women with the education attainment of college or associate's degree have the lowest fertility at 16.0 births per 1,000 women. Women with the education attainment of high school diploma represent 33.5% of all women with births.
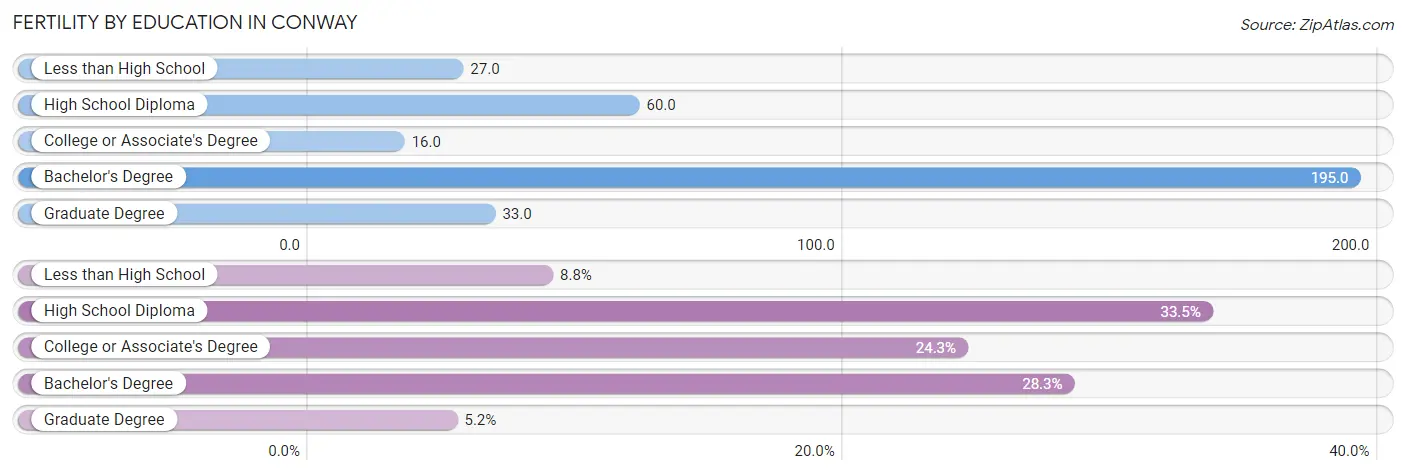
| Educational Attainment | Women with Births | Births / 1,000 Women |
| Less than High School | 22 (8.8%) | 27.0 |
| High School Diploma | 84 (33.5%) | 60.0 |
| College or Associate's Degree | 61 (24.3%) | 16.0 |
| Bachelor's Degree | 71 (28.3%) | 195.0 |
| Graduate Degree | 13 (5.2%) | 33.0 |
| Total | 251 (100.0%) | 36.0 |
Fertility by Education by Marriage Status in Conway
58.2% of women with births in Conway are unmarried. Women with the educational attainment of bachelor's degree are most likely to be married with 100.0% of them married at childbirth, while women with the educational attainment of less than high school are least likely to be married with 100.0% of them unmarried at childbirth.
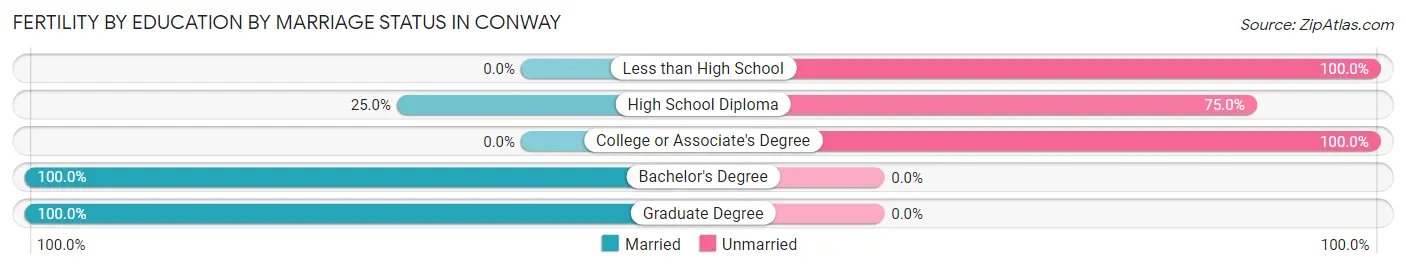
| Educational Attainment | Married | Unmarried |
| Less than High School | 0 (0.0%) | 22 (100.0%) |
| High School Diploma | 21 (25.0%) | 63 (75.0%) |
| College or Associate's Degree | 0 (0.0%) | 61 (100.0%) |
| Bachelor's Degree | 71 (100.0%) | 0 (0.0%) |
| Graduate Degree | 13 (100.0%) | 0 (0.0%) |
| Total | 105 (41.8%) | 146 (58.2%) |
Employment Characteristics in Conway
Employment by Class of Employer in Conway
Among the 9,367 employed individuals in Conway, private company employees (6,632 | 70.8%), not-for-profit organizations (682 | 7.3%), and state government employees (680 | 7.3%) make up the most common classes of employment.
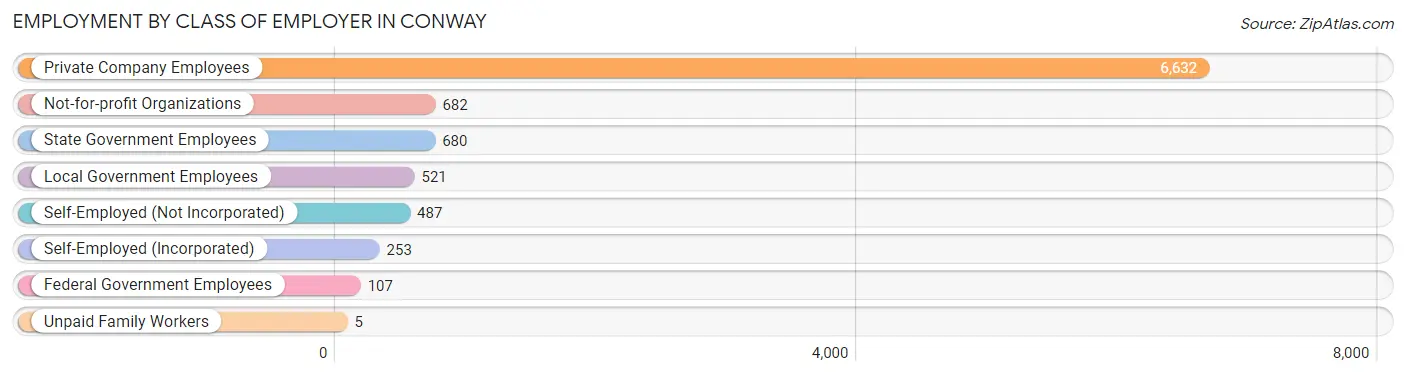
| Employer Class | # Employees | % Employees |
| Private Company Employees | 6,632 | 70.8% |
| Self-Employed (Incorporated) | 253 | 2.7% |
| Self-Employed (Not Incorporated) | 487 | 5.2% |
| Not-for-profit Organizations | 682 | 7.3% |
| Local Government Employees | 521 | 5.6% |
| State Government Employees | 680 | 7.3% |
| Federal Government Employees | 107 | 1.1% |
| Unpaid Family Workers | 5 | 0.1% |
| Total | 9,367 | 100.0% |
Employment Status by Age in Conway
According to the labor force statistics for Conway, out of the total population over 16 years of age (21,272), 49.1% or 10,445 individuals are in the labor force, with 8.8% or 919 of them unemployed. The age group with the highest labor force participation rate is 25 to 29 years, with 85.3% or 1,136 individuals in the labor force. Within the labor force, the 16 to 19 years age range has the highest percentage of unemployed individuals, with 19.1% or 201 of them being unemployed.
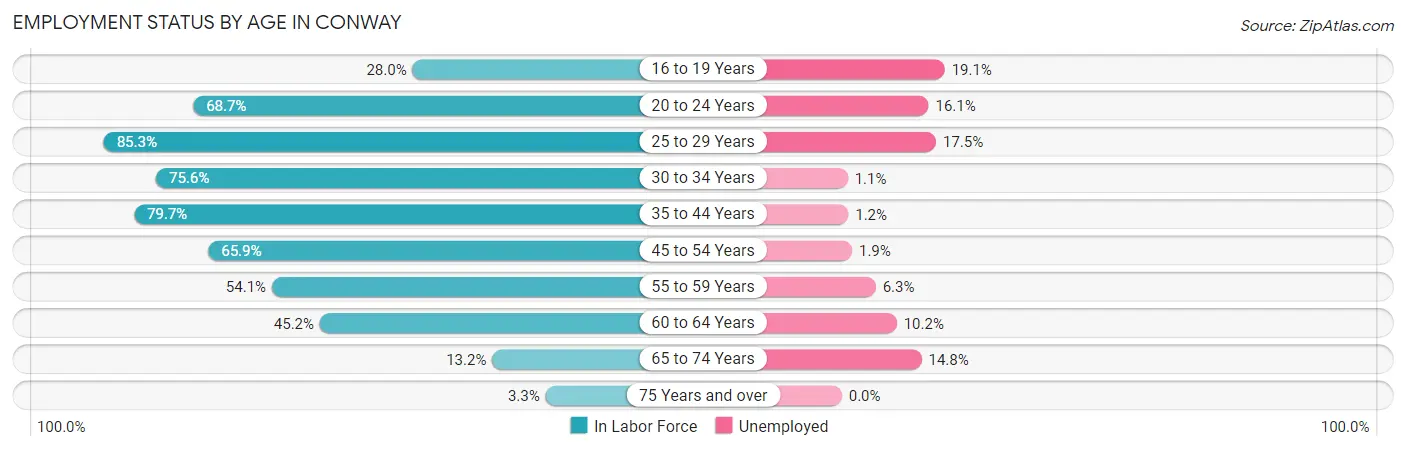
| Age Bracket | In Labor Force | Unemployed |
| 16 to 19 Years | 1,054 (28.0%) | 201 (19.1%) |
| 20 to 24 Years | 1,720 (68.7%) | 277 (16.1%) |
| 25 to 29 Years | 1,136 (85.3%) | 199 (17.5%) |
| 30 to 34 Years | 1,055 (75.6%) | 12 (1.1%) |
| 35 to 44 Years | 1,838 (79.7%) | 22 (1.2%) |
| 45 to 54 Years | 1,694 (65.9%) | 32 (1.9%) |
| 55 to 59 Years | 812 (54.1%) | 51 (6.3%) |
| 60 to 64 Years | 694 (45.2%) | 71 (10.2%) |
| 65 to 74 Years | 390 (13.2%) | 58 (14.8%) |
| 75 Years and over | 46 (3.3%) | 0 (0.0%) |
| Total | 10,445 (49.1%) | 919 (8.8%) |
Employment Status by Educational Attainment in Conway
According to labor force statistics for Conway, 67.9% of individuals (7,225) out of the total population between 25 and 64 years of age (10,640) are in the labor force, with 5.4% or 390 of them being unemployed. The group with the highest labor force participation rate are those with the educational attainment of bachelor's degree or higher, with 77.4% or 1,337 individuals in the labor force. Within the labor force, individuals with less than high school education have the highest percentage of unemployment, with 12.5% or 81 of them being unemployed.
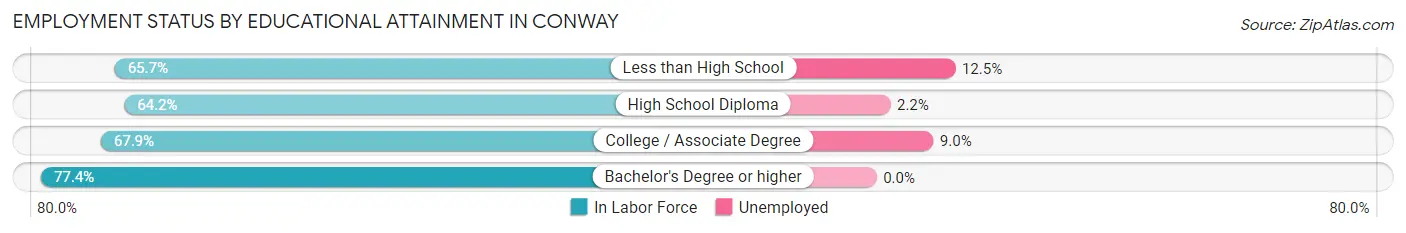
| Educational Attainment | In Labor Force | Unemployed |
| Less than High School | 647 (65.7%) | 123 (12.5%) |
| High School Diploma | 2,445 (64.2%) | 84 (2.2%) |
| College / Associate Degree | 2,797 (67.9%) | 371 (9.0%) |
| Bachelor's Degree or higher | 1,337 (77.4%) | 0 (0.0%) |
| Total | 7,225 (67.9%) | 575 (5.4%) |
Employment Occupations by Sex in Conway
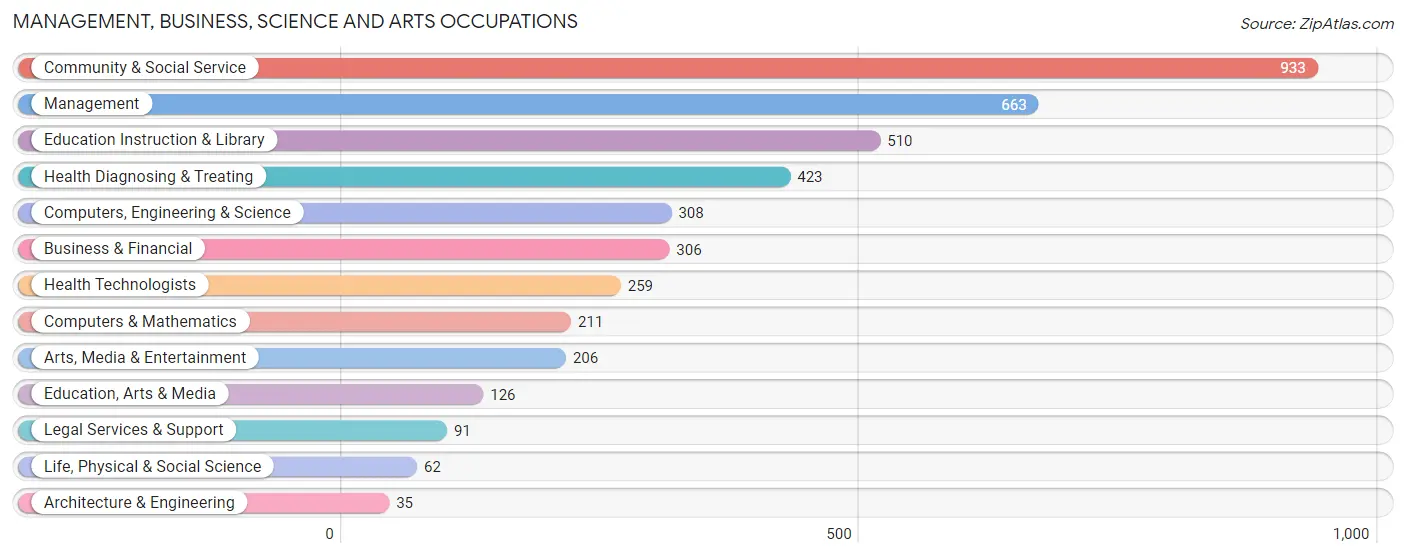
Management, Business, Science and Arts Occupations
The most common Management, Business, Science and Arts occupations in Conway are Community & Social Service (933 | 9.8%), Management (663 | 7.0%), Education Instruction & Library (510 | 5.4%), Health Diagnosing & Treating (423 | 4.4%), and Computers, Engineering & Science (308 | 3.2%).
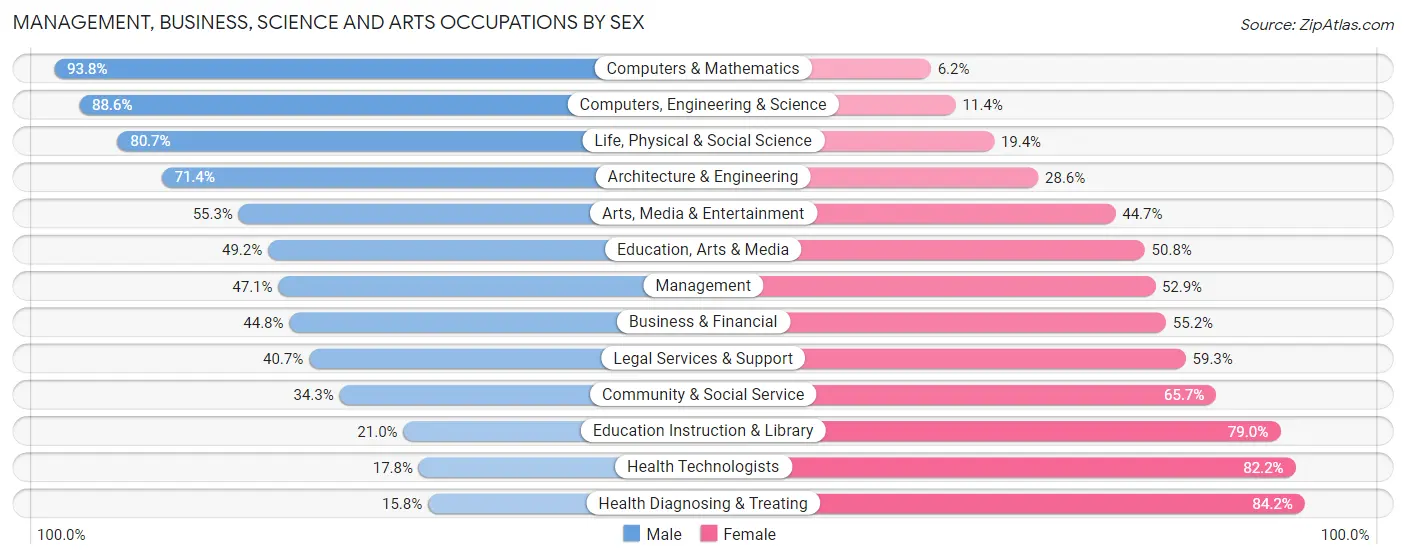
Management, Business, Science and Arts Occupations by Sex
Within the Management, Business, Science and Arts occupations in Conway, the most male-oriented occupations are Computers & Mathematics (93.8%), Computers, Engineering & Science (88.6%), and Life, Physical & Social Science (80.6%), while the most female-oriented occupations are Health Diagnosing & Treating (84.2%), Health Technologists (82.2%), and Education Instruction & Library (79.0%).
| Occupation | Male | Female |
| Management | 312 (47.1%) | 351 (52.9%) |
| Business & Financial | 137 (44.8%) | 169 (55.2%) |
| Computers, Engineering & Science | 273 (88.6%) | 35 (11.4%) |
| Computers & Mathematics | 198 (93.8%) | 13 (6.2%) |
| Architecture & Engineering | 25 (71.4%) | 10 (28.6%) |
| Life, Physical & Social Science | 50 (80.6%) | 12 (19.4%) |
| Community & Social Service | 320 (34.3%) | 613 (65.7%) |
| Education, Arts & Media | 62 (49.2%) | 64 (50.8%) |
| Legal Services & Support | 37 (40.7%) | 54 (59.3%) |
| Education Instruction & Library | 107 (21.0%) | 403 (79.0%) |
| Arts, Media & Entertainment | 114 (55.3%) | 92 (44.7%) |
| Health Diagnosing & Treating | 67 (15.8%) | 356 (84.2%) |
| Health Technologists | 46 (17.8%) | 213 (82.2%) |
| Total (Category) | 1,109 (42.1%) | 1,524 (57.9%) |
| Total (Overall) | 4,556 (47.9%) | 4,950 (52.1%) |
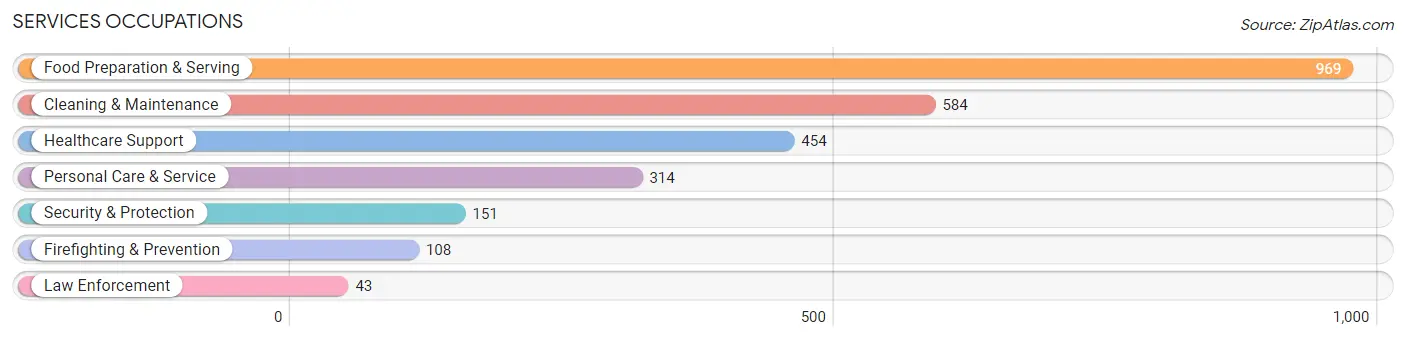
Services Occupations
The most common Services occupations in Conway are Food Preparation & Serving (969 | 10.2%), Cleaning & Maintenance (584 | 6.1%), Healthcare Support (454 | 4.8%), Personal Care & Service (314 | 3.3%), and Security & Protection (151 | 1.6%).
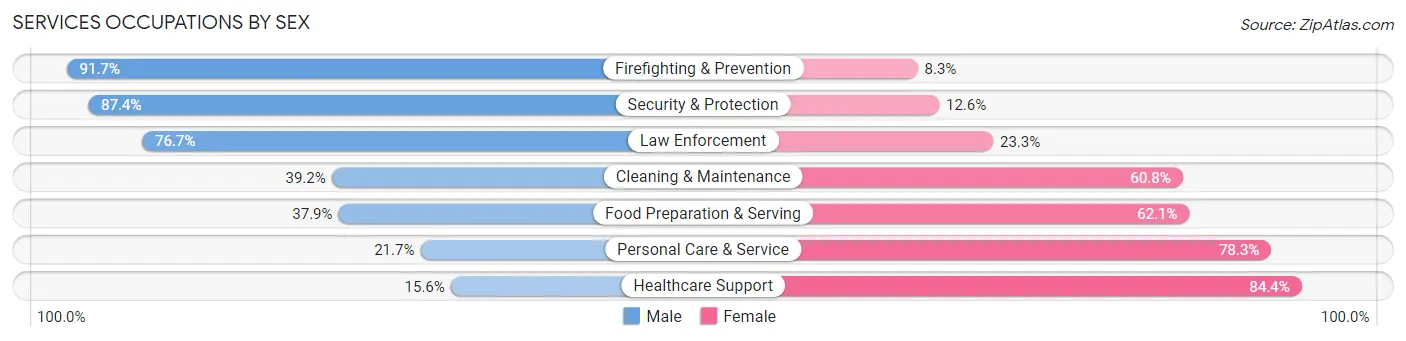
Services Occupations by Sex
Within the Services occupations in Conway, the most male-oriented occupations are Firefighting & Prevention (91.7%), Security & Protection (87.4%), and Law Enforcement (76.7%), while the most female-oriented occupations are Healthcare Support (84.4%), Personal Care & Service (78.3%), and Food Preparation & Serving (62.1%).
| Occupation | Male | Female |
| Healthcare Support | 71 (15.6%) | 383 (84.4%) |
| Security & Protection | 132 (87.4%) | 19 (12.6%) |
| Firefighting & Prevention | 99 (91.7%) | 9 (8.3%) |
| Law Enforcement | 33 (76.7%) | 10 (23.3%) |
| Food Preparation & Serving | 367 (37.9%) | 602 (62.1%) |
| Cleaning & Maintenance | 229 (39.2%) | 355 (60.8%) |
| Personal Care & Service | 68 (21.7%) | 246 (78.3%) |
| Total (Category) | 867 (35.1%) | 1,605 (64.9%) |
| Total (Overall) | 4,556 (47.9%) | 4,950 (52.1%) |
Sales and Office Occupations
The most common Sales and Office occupations in Conway are Sales & Related (1,381 | 14.5%), and Office & Administration (1,017 | 10.7%).

Sales and Office Occupations by Sex
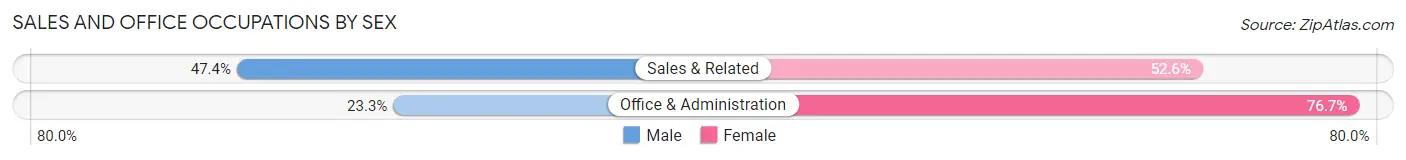
| Occupation | Male | Female |
| Sales & Related | 654 (47.4%) | 727 (52.6%) |
| Office & Administration | 237 (23.3%) | 780 (76.7%) |
| Total (Category) | 891 (37.2%) | 1,507 (62.8%) |
| Total (Overall) | 4,556 (47.9%) | 4,950 (52.1%) |
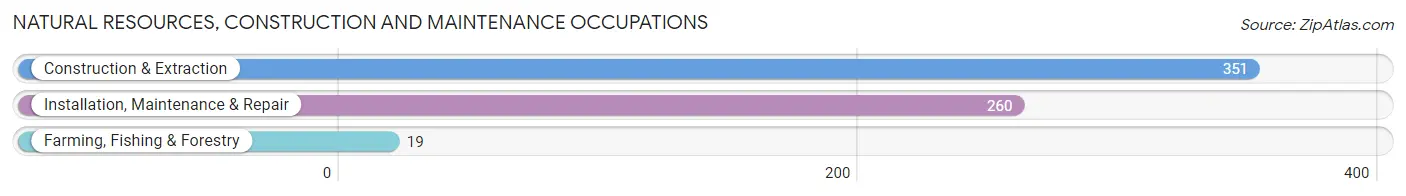
Natural Resources, Construction and Maintenance Occupations
The most common Natural Resources, Construction and Maintenance occupations in Conway are Construction & Extraction (351 | 3.7%), Installation, Maintenance & Repair (260 | 2.7%), and Farming, Fishing & Forestry (19 | 0.2%).
Natural Resources, Construction and Maintenance Occupations by Sex
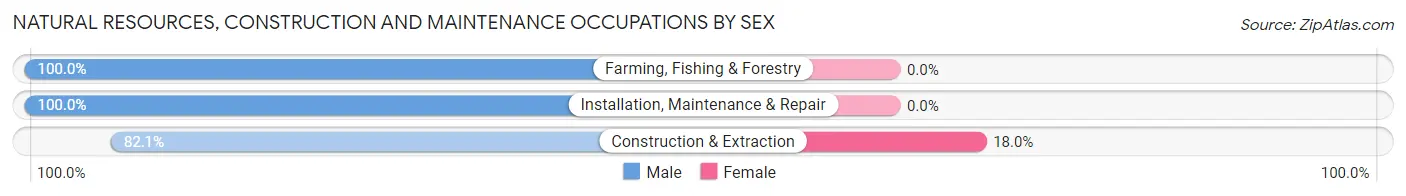
| Occupation | Male | Female |
| Farming, Fishing & Forestry | 19 (100.0%) | 0 (0.0%) |
| Construction & Extraction | 288 (82.1%) | 63 (17.9%) |
| Installation, Maintenance & Repair | 260 (100.0%) | 0 (0.0%) |
| Total (Category) | 567 (90.0%) | 63 (10.0%) |
| Total (Overall) | 4,556 (47.9%) | 4,950 (52.1%) |
Production, Transportation and Moving Occupations
The most common Production, Transportation and Moving occupations in Conway are Production (556 | 5.9%), Material Moving (479 | 5.0%), and Transportation (338 | 3.6%).
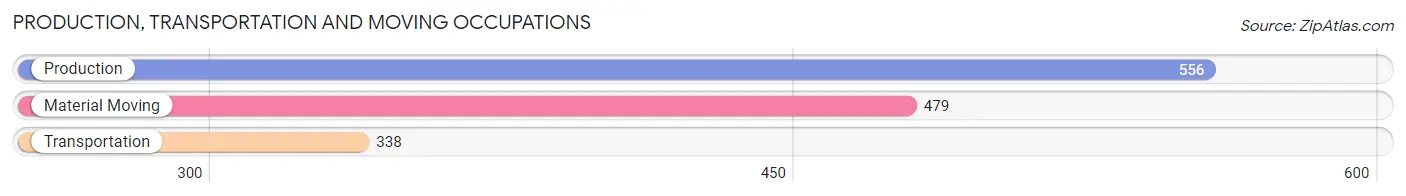
Production, Transportation and Moving Occupations by Sex
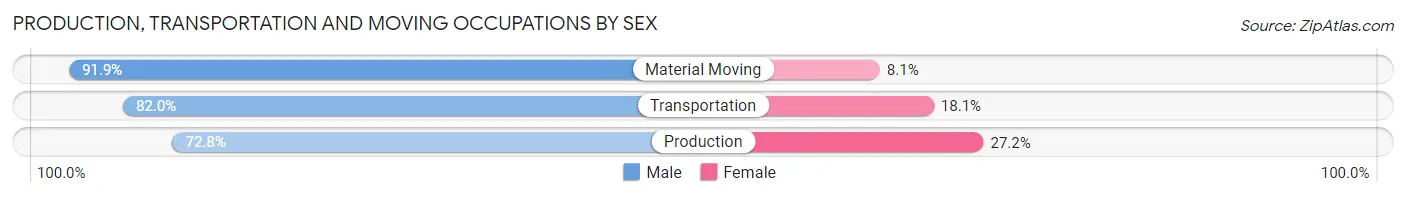
| Occupation | Male | Female |
| Production | 405 (72.8%) | 151 (27.2%) |
| Transportation | 277 (82.0%) | 61 (18.0%) |
| Material Moving | 440 (91.9%) | 39 (8.1%) |
| Total (Category) | 1,122 (81.7%) | 251 (18.3%) |
| Total (Overall) | 4,556 (47.9%) | 4,950 (52.1%) |
Employment Industries by Sex in Conway
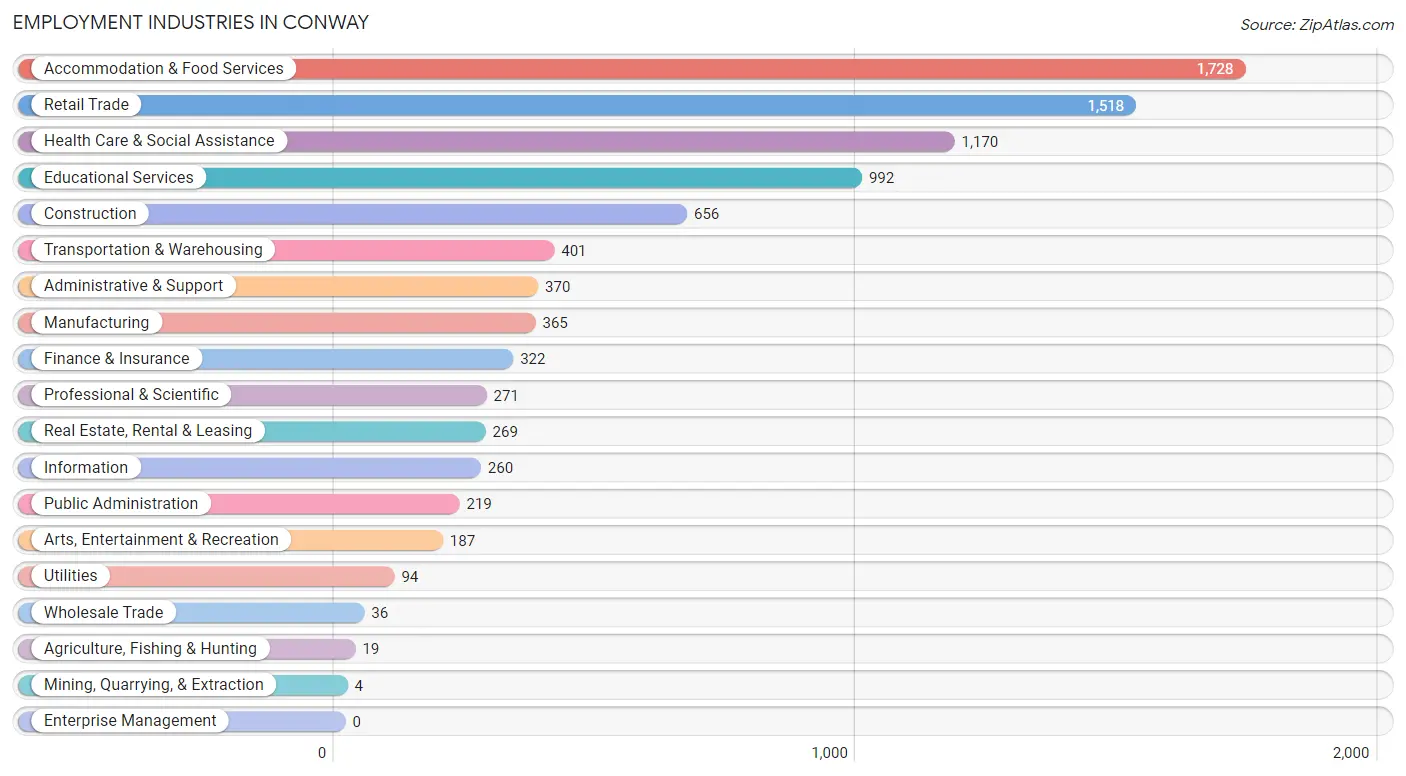
Employment Industries in Conway
The major employment industries in Conway include Accommodation & Food Services (1,728 | 18.2%), Retail Trade (1,518 | 16.0%), Health Care & Social Assistance (1,170 | 12.3%), Educational Services (992 | 10.4%), and Construction (656 | 6.9%).
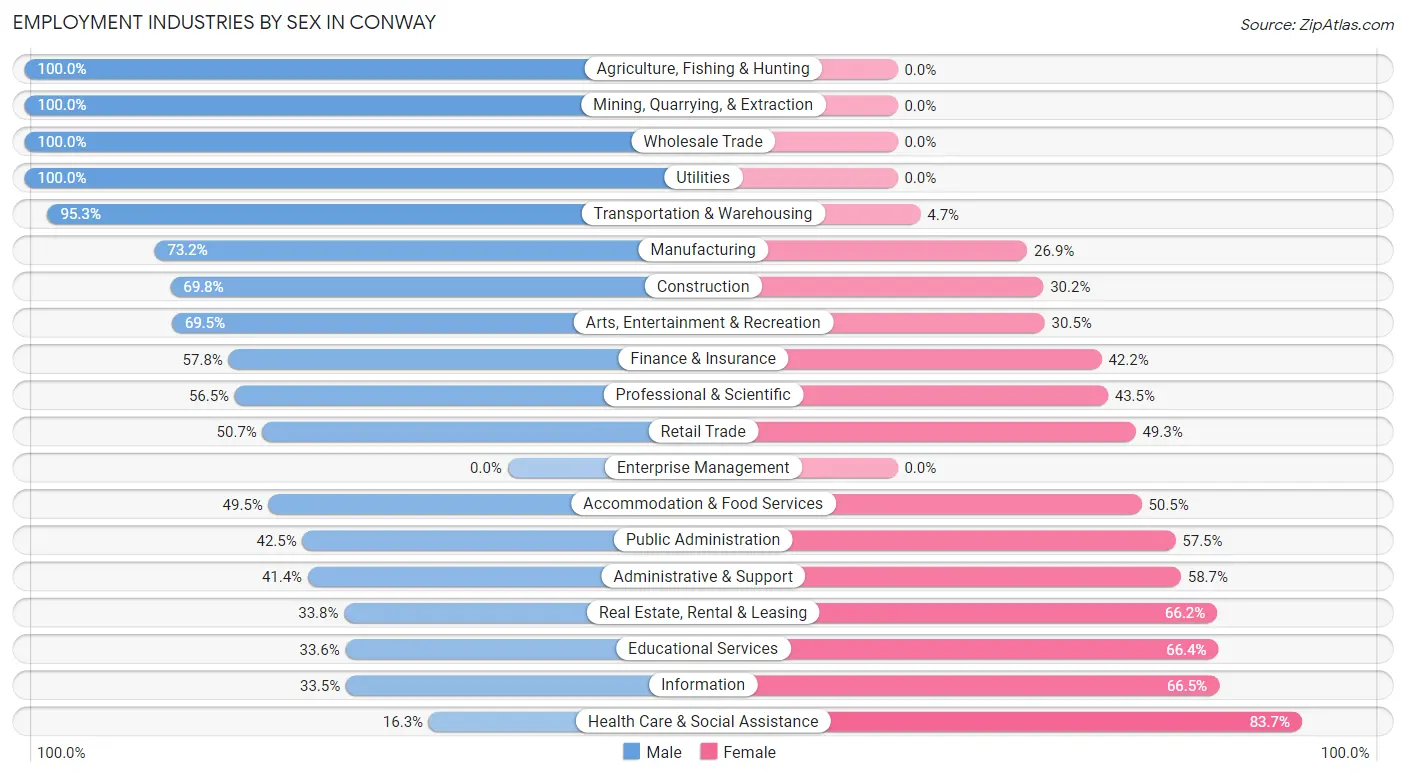
Employment Industries by Sex in Conway
The Conway industries that see more men than women are Agriculture, Fishing & Hunting (100.0%), Mining, Quarrying, & Extraction (100.0%), and Wholesale Trade (100.0%), whereas the industries that tend to have a higher number of women are Health Care & Social Assistance (83.7%), Information (66.5%), and Educational Services (66.4%).
| Industry | Male | Female |
| Agriculture, Fishing & Hunting | 19 (100.0%) | 0 (0.0%) |
| Mining, Quarrying, & Extraction | 4 (100.0%) | 0 (0.0%) |
| Construction | 458 (69.8%) | 198 (30.2%) |
| Manufacturing | 267 (73.2%) | 98 (26.9%) |
| Wholesale Trade | 36 (100.0%) | 0 (0.0%) |
| Retail Trade | 770 (50.7%) | 748 (49.3%) |
| Transportation & Warehousing | 382 (95.3%) | 19 (4.7%) |
| Utilities | 94 (100.0%) | 0 (0.0%) |
| Information | 87 (33.5%) | 173 (66.5%) |
| Finance & Insurance | 186 (57.8%) | 136 (42.2%) |
| Real Estate, Rental & Leasing | 91 (33.8%) | 178 (66.2%) |
| Professional & Scientific | 153 (56.5%) | 118 (43.5%) |
| Enterprise Management | 0 (0.0%) | 0 (0.0%) |
| Administrative & Support | 153 (41.3%) | 217 (58.7%) |
| Educational Services | 333 (33.6%) | 659 (66.4%) |
| Health Care & Social Assistance | 191 (16.3%) | 979 (83.7%) |
| Arts, Entertainment & Recreation | 130 (69.5%) | 57 (30.5%) |
| Accommodation & Food Services | 855 (49.5%) | 873 (50.5%) |
| Public Administration | 93 (42.5%) | 126 (57.5%) |
| Total | 4,556 (47.9%) | 4,950 (52.1%) |
Education in Conway
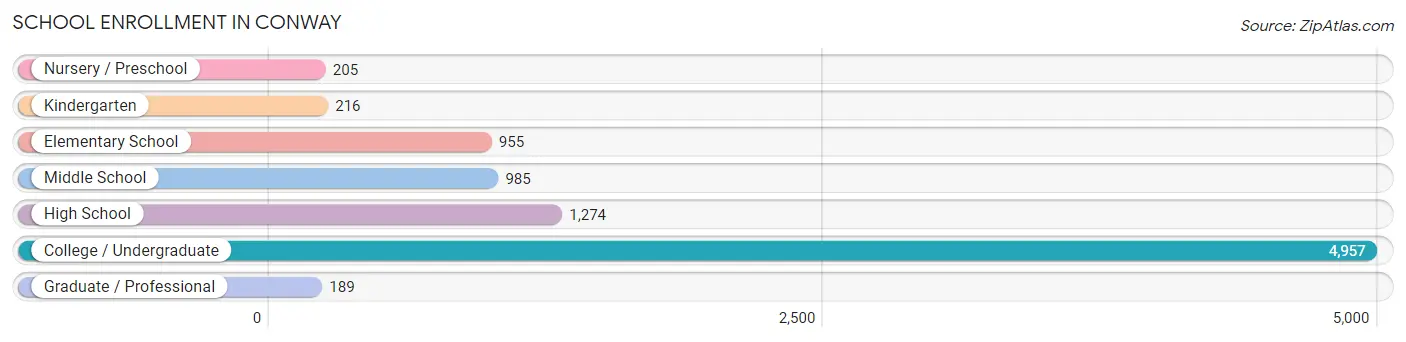
School Enrollment in Conway
The most common levels of schooling among the 8,781 students in Conway are college / undergraduate (4,957 | 56.5%), high school (1,274 | 14.5%), and middle school (985 | 11.2%).
| School Level | # Students | % Students |
| Nursery / Preschool | 205 | 2.3% |
| Kindergarten | 216 | 2.5% |
| Elementary School | 955 | 10.9% |
| Middle School | 985 | 11.2% |
| High School | 1,274 | 14.5% |
| College / Undergraduate | 4,957 | 56.5% |
| Graduate / Professional | 189 | 2.1% |
| Total | 8,781 | 100.0% |
School Enrollment by Age by Funding Source in Conway
Out of a total of 8,781 students who are enrolled in schools in Conway, 588 (6.7%) attend a private institution, while the remaining 8,193 (93.3%) are enrolled in public schools. The age group of 25 to 34 year olds has the highest likelihood of being enrolled in private schools, with 156 (52.3% in the age bracket) enrolled. Conversely, the age group of 10 to 14 year olds has the lowest likelihood of being enrolled in a private school, with 1,206 (100.0% in the age bracket) attending a public institution.
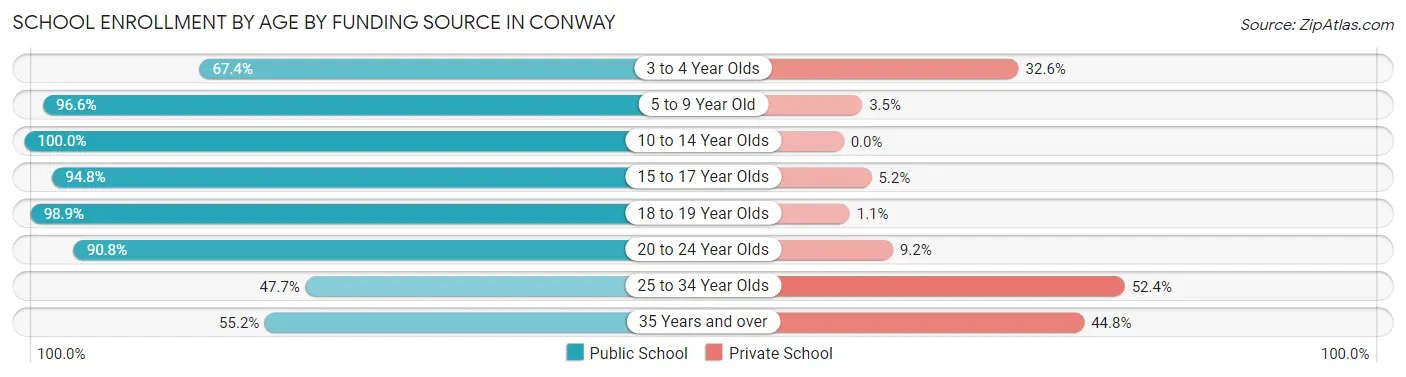
| Age Bracket | Public School | Private School |
| 3 to 4 Year Olds | 151 (67.4%) | 73 (32.6%) |
| 5 to 9 Year Old | 951 (96.6%) | 34 (3.5%) |
| 10 to 14 Year Olds | 1,206 (100.0%) | 0 (0.0%) |
| 15 to 17 Year Olds | 989 (94.8%) | 54 (5.2%) |
| 18 to 19 Year Olds | 3,047 (98.9%) | 35 (1.1%) |
| 20 to 24 Year Olds | 1,625 (90.8%) | 164 (9.2%) |
| 25 to 34 Year Olds | 142 (47.6%) | 156 (52.3%) |
| 35 Years and over | 85 (55.2%) | 69 (44.8%) |
| Total | 8,193 (93.3%) | 588 (6.7%) |
Educational Attainment by Field of Study in Conway
Education (520 | 18.7%), business (441 | 15.9%), psychology (280 | 10.1%), science & technology (241 | 8.7%), and social sciences (213 | 7.6%) are the most common fields of study among 2,783 individuals in Conway who have obtained a bachelor's degree or higher.
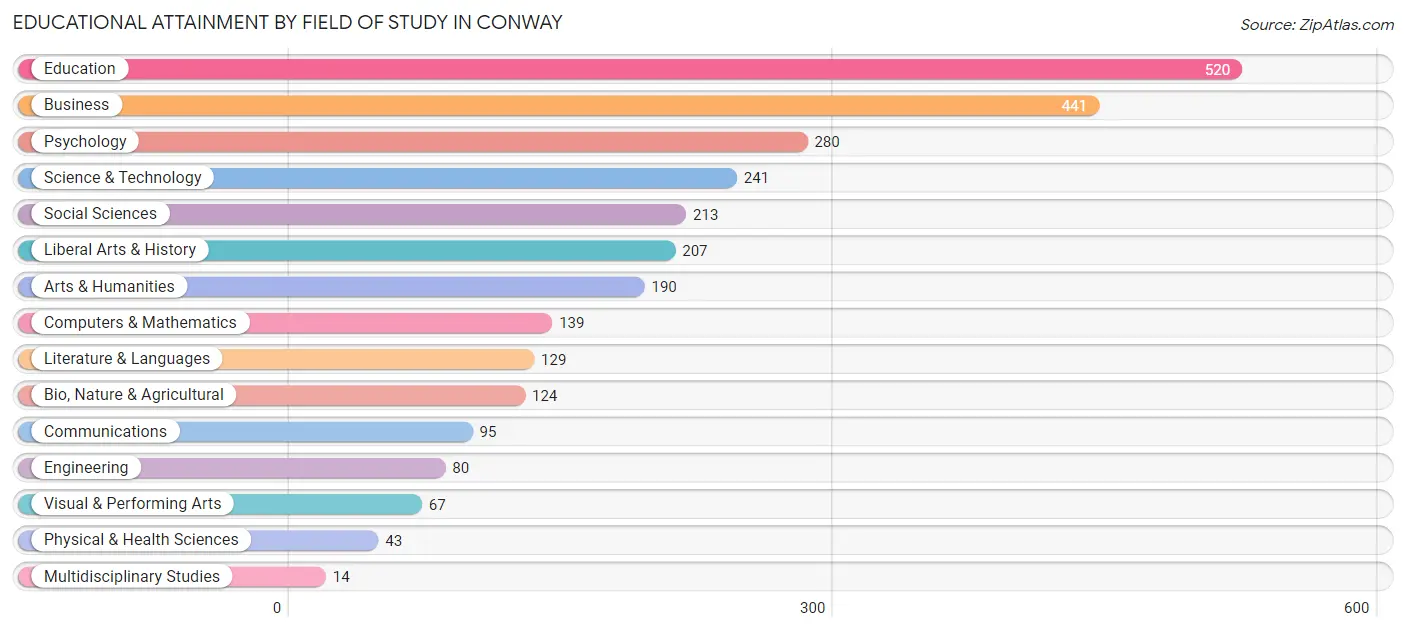
| Field of Study | # Graduates | % Graduates |
| Computers & Mathematics | 139 | 5.0% |
| Bio, Nature & Agricultural | 124 | 4.5% |
| Physical & Health Sciences | 43 | 1.5% |
| Psychology | 280 | 10.1% |
| Social Sciences | 213 | 7.6% |
| Engineering | 80 | 2.9% |
| Multidisciplinary Studies | 14 | 0.5% |
| Science & Technology | 241 | 8.7% |
| Business | 441 | 15.9% |
| Education | 520 | 18.7% |
| Literature & Languages | 129 | 4.6% |
| Liberal Arts & History | 207 | 7.4% |
| Visual & Performing Arts | 67 | 2.4% |
| Communications | 95 | 3.4% |
| Arts & Humanities | 190 | 6.8% |
| Total | 2,783 | 100.0% |
Transportation & Commute in Conway
Vehicle Availability by Sex in Conway
The most prevalent vehicle ownership categories in Conway are males with 2 vehicles (1,585, accounting for 37.5%) and females with 2 vehicles (1,535, making up 36.6%).
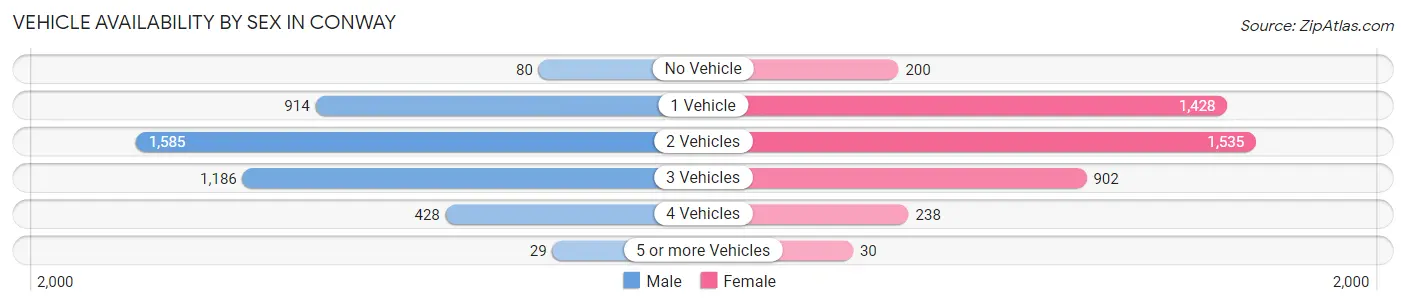
| Vehicles Available | Male | Female |
| No Vehicle | 80 (1.9%) | 200 (4.6%) |
| 1 Vehicle | 914 (21.6%) | 1,428 (33.0%) |
| 2 Vehicles | 1,585 (37.5%) | 1,535 (35.4%) |
| 3 Vehicles | 1,186 (28.1%) | 902 (20.8%) |
| 4 Vehicles | 428 (10.1%) | 238 (5.5%) |
| 5 or more Vehicles | 29 (0.7%) | 30 (0.7%) |
| Total | 4,222 (100.0%) | 4,333 (100.0%) |
Commute Time in Conway
The most frequently occuring commute durations in Conway are 10 to 14 minutes (1,496 commuters, 16.8%), 30 to 34 minutes (1,422 commuters, 15.9%), and 15 to 19 minutes (1,256 commuters, 14.1%).
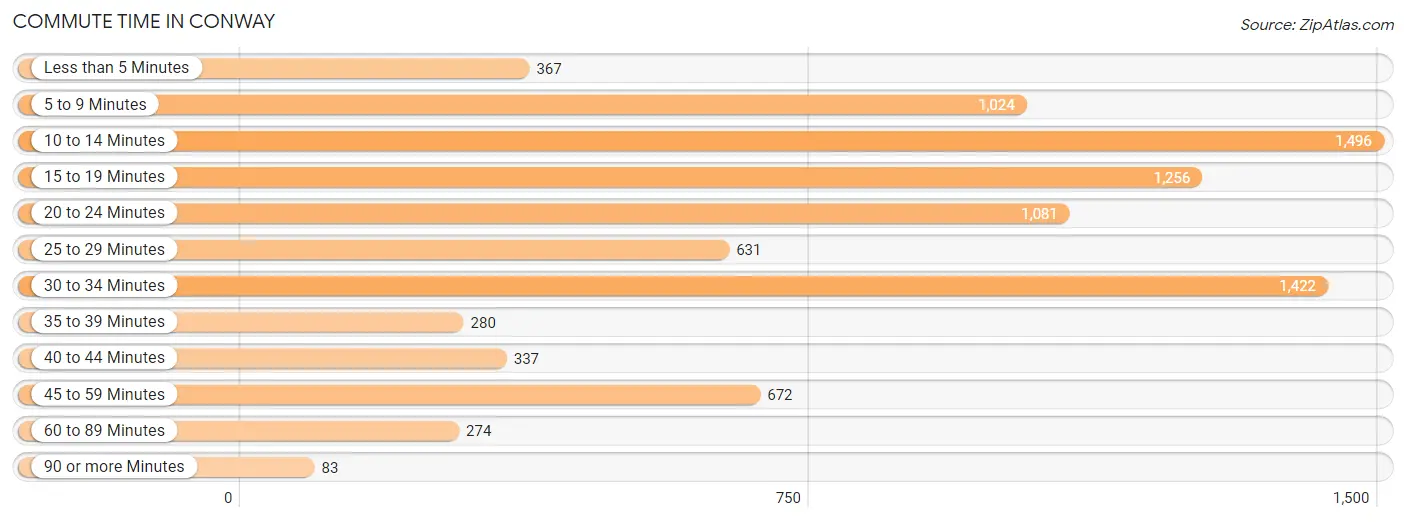
| Commute Time | # Commuters | % Commuters |
| Less than 5 Minutes | 367 | 4.1% |
| 5 to 9 Minutes | 1,024 | 11.5% |
| 10 to 14 Minutes | 1,496 | 16.8% |
| 15 to 19 Minutes | 1,256 | 14.1% |
| 20 to 24 Minutes | 1,081 | 12.1% |
| 25 to 29 Minutes | 631 | 7.1% |
| 30 to 34 Minutes | 1,422 | 15.9% |
| 35 to 39 Minutes | 280 | 3.1% |
| 40 to 44 Minutes | 337 | 3.8% |
| 45 to 59 Minutes | 672 | 7.5% |
| 60 to 89 Minutes | 274 | 3.1% |
| 90 or more Minutes | 83 | 0.9% |
Commute Time by Sex in Conway
The most common commute times in Conway are 10 to 14 minutes (770 commuters, 17.9%) for males and 10 to 14 minutes (726 commuters, 15.7%) for females.
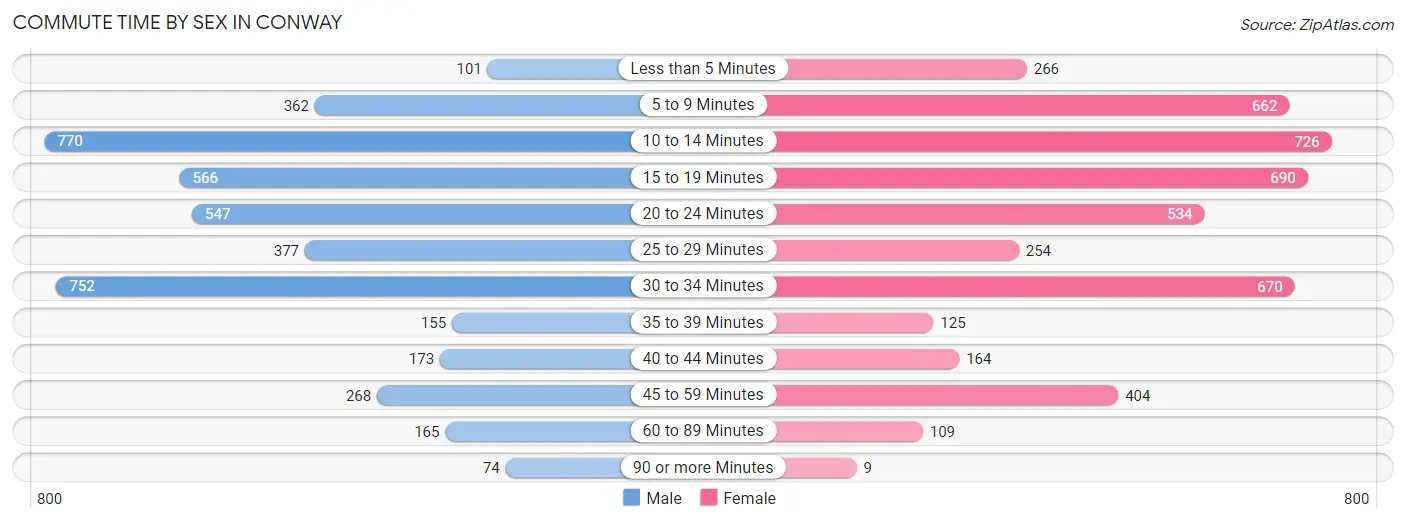
| Commute Time | Male | Female |
| Less than 5 Minutes | 101 (2.3%) | 266 (5.8%) |
| 5 to 9 Minutes | 362 (8.4%) | 662 (14.3%) |
| 10 to 14 Minutes | 770 (17.9%) | 726 (15.7%) |
| 15 to 19 Minutes | 566 (13.1%) | 690 (15.0%) |
| 20 to 24 Minutes | 547 (12.7%) | 534 (11.6%) |
| 25 to 29 Minutes | 377 (8.7%) | 254 (5.5%) |
| 30 to 34 Minutes | 752 (17.4%) | 670 (14.5%) |
| 35 to 39 Minutes | 155 (3.6%) | 125 (2.7%) |
| 40 to 44 Minutes | 173 (4.0%) | 164 (3.6%) |
| 45 to 59 Minutes | 268 (6.2%) | 404 (8.8%) |
| 60 to 89 Minutes | 165 (3.8%) | 109 (2.4%) |
| 90 or more Minutes | 74 (1.7%) | 9 (0.2%) |
Time of Departure to Work by Sex in Conway
The most frequent times of departure to work in Conway are 7:00 AM to 7:29 AM (558, 13.0%) for males and 7:00 AM to 7:29 AM (816, 17.7%) for females.
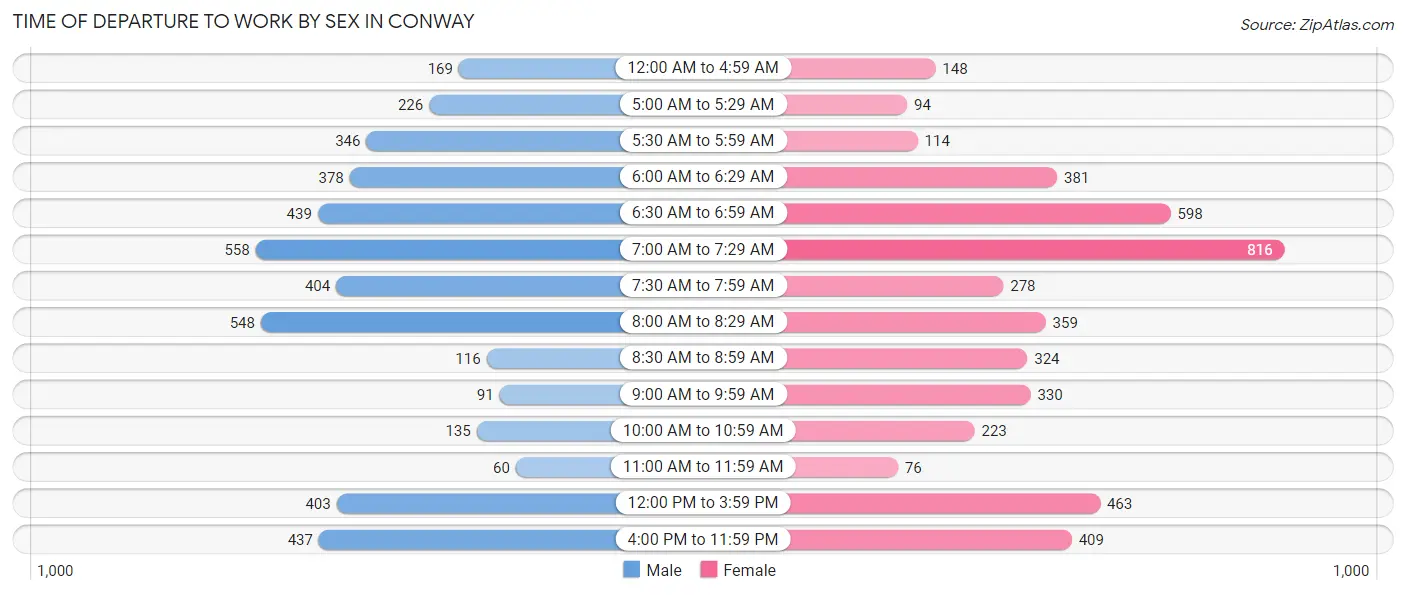
| Time of Departure | Male | Female |
| 12:00 AM to 4:59 AM | 169 (3.9%) | 148 (3.2%) |
| 5:00 AM to 5:29 AM | 226 (5.2%) | 94 (2.0%) |
| 5:30 AM to 5:59 AM | 346 (8.0%) | 114 (2.5%) |
| 6:00 AM to 6:29 AM | 378 (8.8%) | 381 (8.3%) |
| 6:30 AM to 6:59 AM | 439 (10.2%) | 598 (13.0%) |
| 7:00 AM to 7:29 AM | 558 (13.0%) | 816 (17.7%) |
| 7:30 AM to 7:59 AM | 404 (9.4%) | 278 (6.0%) |
| 8:00 AM to 8:29 AM | 548 (12.7%) | 359 (7.8%) |
| 8:30 AM to 8:59 AM | 116 (2.7%) | 324 (7.0%) |
| 9:00 AM to 9:59 AM | 91 (2.1%) | 330 (7.1%) |
| 10:00 AM to 10:59 AM | 135 (3.1%) | 223 (4.8%) |
| 11:00 AM to 11:59 AM | 60 (1.4%) | 76 (1.7%) |
| 12:00 PM to 3:59 PM | 403 (9.3%) | 463 (10.0%) |
| 4:00 PM to 11:59 PM | 437 (10.1%) | 409 (8.9%) |
| Total | 4,310 (100.0%) | 4,613 (100.0%) |
Housing Occupancy in Conway
Occupancy by Ownership in Conway
Of the total 8,065 dwellings in Conway, owner-occupied units account for 4,914 (60.9%), while renter-occupied units make up 3,151 (39.1%).
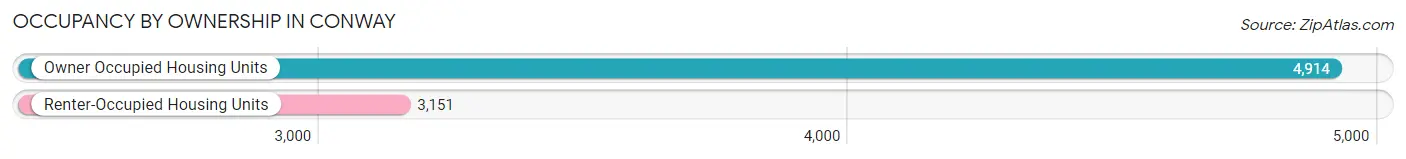
| Occupancy | # Housing Units | % Housing Units |
| Owner Occupied Housing Units | 4,914 | 60.9% |
| Renter-Occupied Housing Units | 3,151 | 39.1% |
| Total Occupied Housing Units | 8,065 | 100.0% |
Occupancy by Household Size in Conway
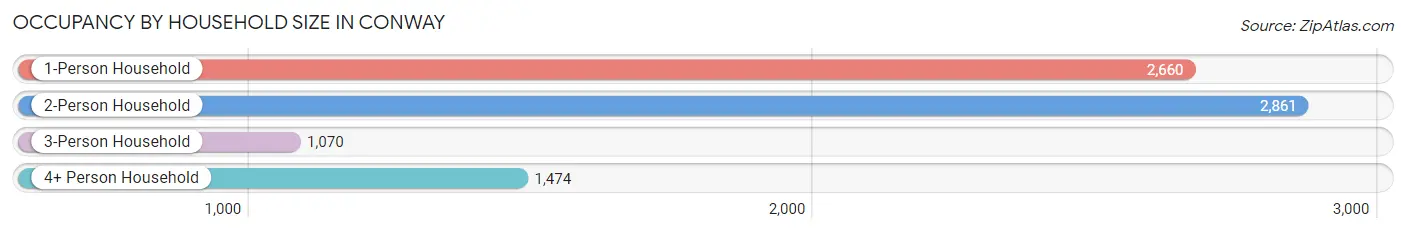
| Household Size | # Housing Units | % Housing Units |
| 1-Person Household | 2,660 | 33.0% |
| 2-Person Household | 2,861 | 35.5% |
| 3-Person Household | 1,070 | 13.3% |
| 4+ Person Household | 1,474 | 18.3% |
| Total Housing Units | 8,065 | 100.0% |
Occupancy by Ownership by Household Size in Conway
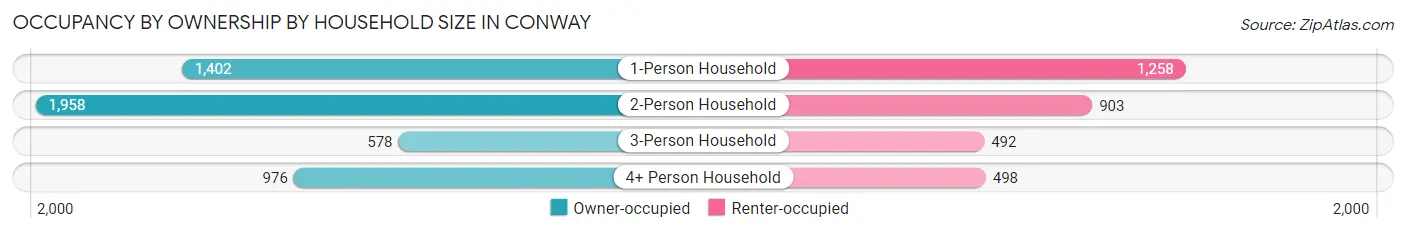
| Household Size | Owner-occupied | Renter-occupied |
| 1-Person Household | 1,402 (52.7%) | 1,258 (47.3%) |
| 2-Person Household | 1,958 (68.4%) | 903 (31.6%) |
| 3-Person Household | 578 (54.0%) | 492 (46.0%) |
| 4+ Person Household | 976 (66.2%) | 498 (33.8%) |
| Total Housing Units | 4,914 (60.9%) | 3,151 (39.1%) |
Occupancy by Educational Attainment in Conway
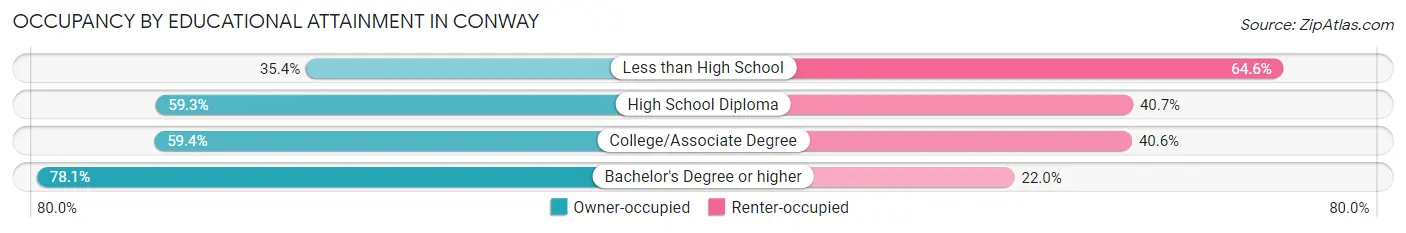
| Household Size | Owner-occupied | Renter-occupied |
| Less than High School | 237 (35.4%) | 433 (64.6%) |
| High School Diploma | 1,352 (59.3%) | 929 (40.7%) |
| College/Associate Degree | 2,127 (59.4%) | 1,452 (40.6%) |
| Bachelor's Degree or higher | 1,198 (78.0%) | 337 (22.0%) |
Occupancy by Age of Householder in Conway
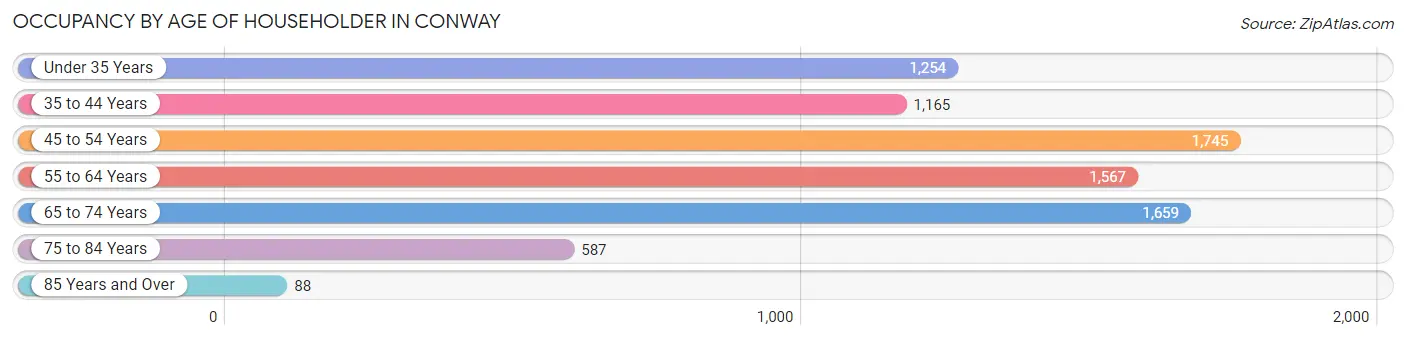
| Age Bracket | # Households | % Households |
| Under 35 Years | 1,254 | 15.5% |
| 35 to 44 Years | 1,165 | 14.4% |
| 45 to 54 Years | 1,745 | 21.6% |
| 55 to 64 Years | 1,567 | 19.4% |
| 65 to 74 Years | 1,659 | 20.6% |
| 75 to 84 Years | 587 | 7.3% |
| 85 Years and Over | 88 | 1.1% |
| Total | 8,065 | 100.0% |
Housing Finances in Conway
Median Income by Occupancy in Conway
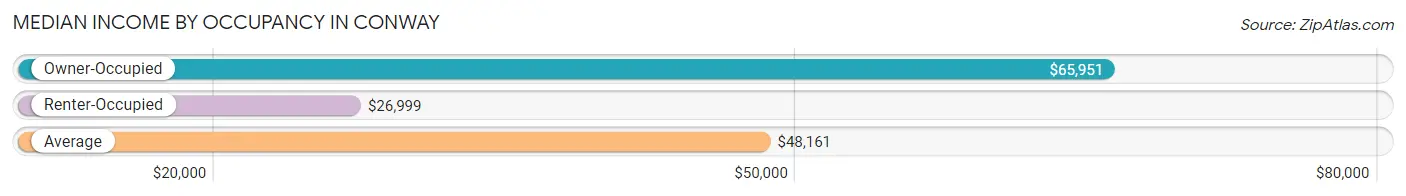
| Occupancy Type | # Households | Median Income |
| Owner-Occupied | 4,914 (60.9%) | $65,951 |
| Renter-Occupied | 3,151 (39.1%) | $26,999 |
| Average | 8,065 (100.0%) | $48,161 |
Occupancy by Householder Income Bracket in Conway
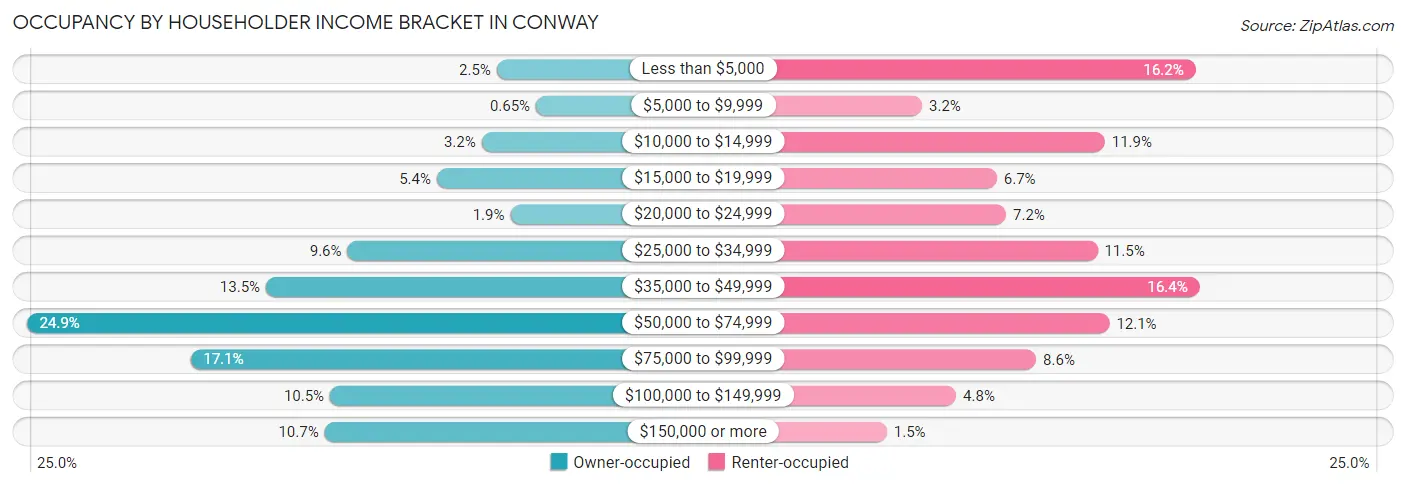
| Income Bracket | Owner-occupied | Renter-occupied |
| Less than $5,000 | 124 (2.5%) | 510 (16.2%) |
| $5,000 to $9,999 | 32 (0.6%) | 100 (3.2%) |
| $10,000 to $14,999 | 159 (3.2%) | 374 (11.9%) |
| $15,000 to $19,999 | 264 (5.4%) | 212 (6.7%) |
| $20,000 to $24,999 | 92 (1.9%) | 226 (7.2%) |
| $25,000 to $34,999 | 473 (9.6%) | 363 (11.5%) |
| $35,000 to $49,999 | 664 (13.5%) | 516 (16.4%) |
| $50,000 to $74,999 | 1,224 (24.9%) | 381 (12.1%) |
| $75,000 to $99,999 | 841 (17.1%) | 271 (8.6%) |
| $100,000 to $149,999 | 514 (10.5%) | 151 (4.8%) |
| $150,000 or more | 527 (10.7%) | 47 (1.5%) |
| Total | 4,914 (100.0%) | 3,151 (100.0%) |
Monthly Housing Cost Tiers in Conway
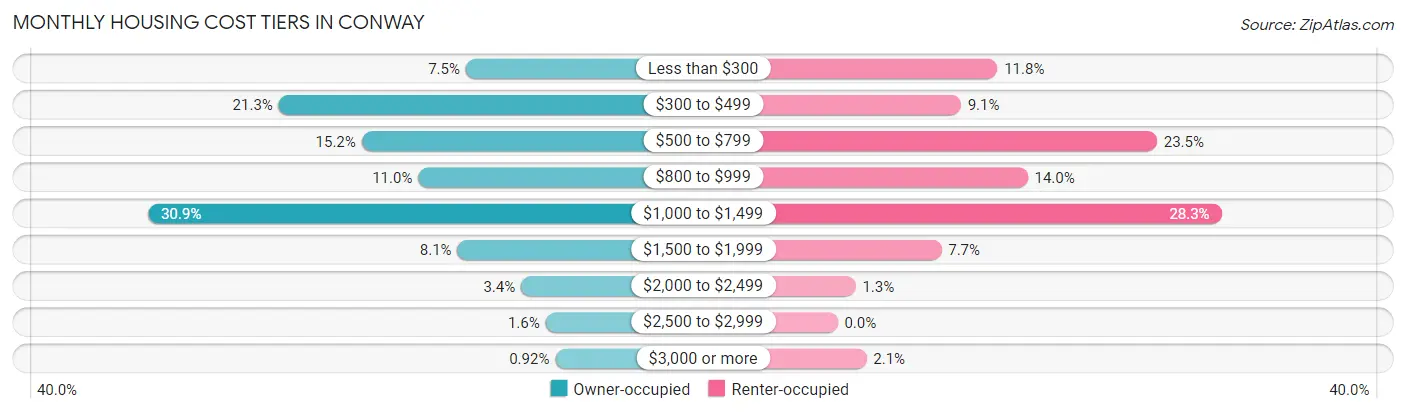
| Monthly Cost | Owner-occupied | Renter-occupied |
| Less than $300 | 369 (7.5%) | 371 (11.8%) |
| $300 to $499 | 1,046 (21.3%) | 286 (9.1%) |
| $500 to $799 | 746 (15.2%) | 741 (23.5%) |
| $800 to $999 | 541 (11.0%) | 441 (14.0%) |
| $1,000 to $1,499 | 1,519 (30.9%) | 891 (28.3%) |
| $1,500 to $1,999 | 399 (8.1%) | 241 (7.6%) |
| $2,000 to $2,499 | 169 (3.4%) | 42 (1.3%) |
| $2,500 to $2,999 | 80 (1.6%) | 0 (0.0%) |
| $3,000 or more | 45 (0.9%) | 67 (2.1%) |
| Total | 4,914 (100.0%) | 3,151 (100.0%) |
Physical Housing Characteristics in Conway
Housing Structures in Conway
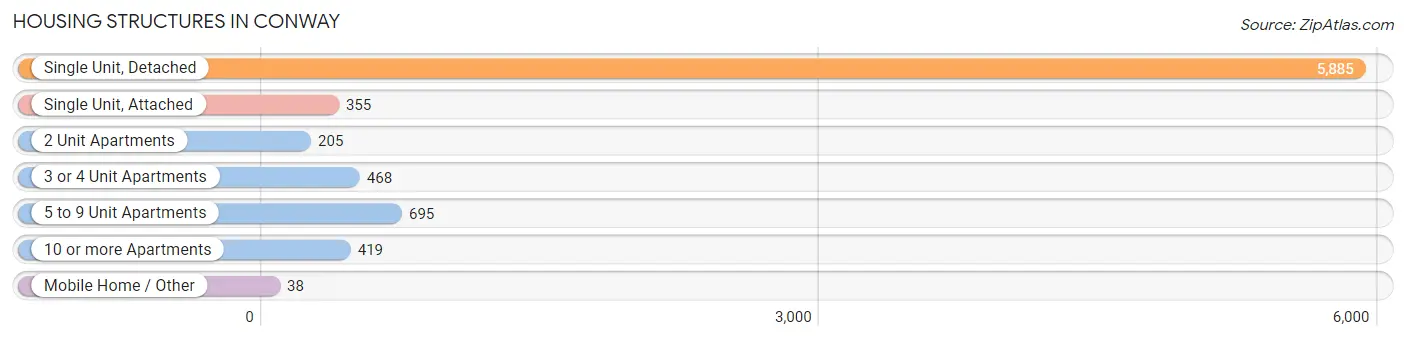
| Structure Type | # Housing Units | % Housing Units |
| Single Unit, Detached | 5,885 | 73.0% |
| Single Unit, Attached | 355 | 4.4% |
| 2 Unit Apartments | 205 | 2.5% |
| 3 or 4 Unit Apartments | 468 | 5.8% |
| 5 to 9 Unit Apartments | 695 | 8.6% |
| 10 or more Apartments | 419 | 5.2% |
| Mobile Home / Other | 38 | 0.5% |
| Total | 8,065 | 100.0% |
Housing Structures by Occupancy in Conway
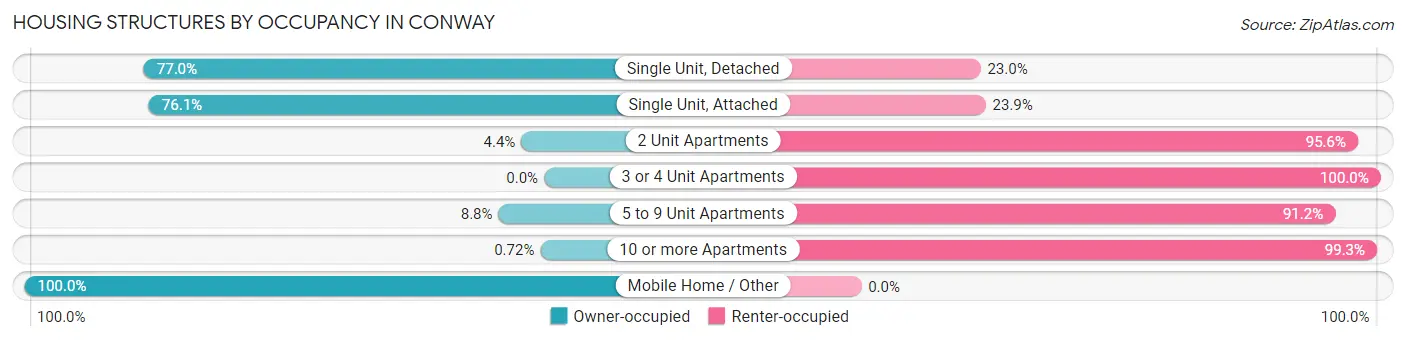
| Structure Type | Owner-occupied | Renter-occupied |
| Single Unit, Detached | 4,533 (77.0%) | 1,352 (23.0%) |
| Single Unit, Attached | 270 (76.1%) | 85 (23.9%) |
| 2 Unit Apartments | 9 (4.4%) | 196 (95.6%) |
| 3 or 4 Unit Apartments | 0 (0.0%) | 468 (100.0%) |
| 5 to 9 Unit Apartments | 61 (8.8%) | 634 (91.2%) |
| 10 or more Apartments | 3 (0.7%) | 416 (99.3%) |
| Mobile Home / Other | 38 (100.0%) | 0 (0.0%) |
| Total | 4,914 (60.9%) | 3,151 (39.1%) |
Housing Structures by Number of Rooms in Conway
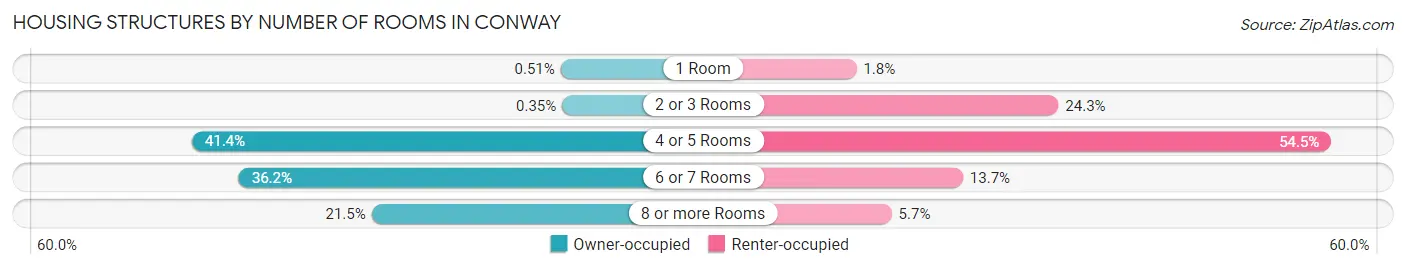
| Number of Rooms | Owner-occupied | Renter-occupied |
| 1 Room | 25 (0.5%) | 58 (1.8%) |
| 2 or 3 Rooms | 17 (0.4%) | 764 (24.2%) |
| 4 or 5 Rooms | 2,036 (41.4%) | 1,718 (54.5%) |
| 6 or 7 Rooms | 1,780 (36.2%) | 430 (13.7%) |
| 8 or more Rooms | 1,056 (21.5%) | 181 (5.7%) |
| Total | 4,914 (100.0%) | 3,151 (100.0%) |
Housing Structure by Heating Type in Conway
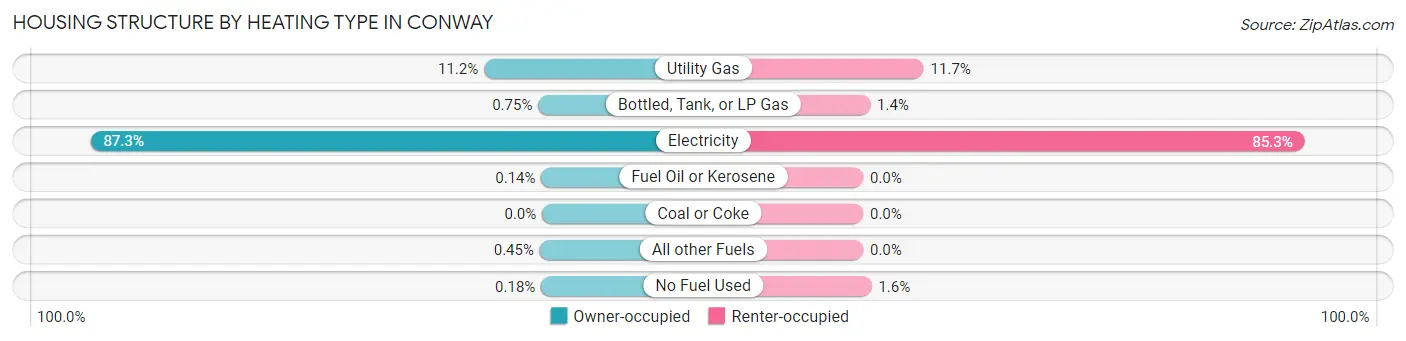
| Heating Type | Owner-occupied | Renter-occupied |
| Utility Gas | 551 (11.2%) | 369 (11.7%) |
| Bottled, Tank, or LP Gas | 37 (0.7%) | 43 (1.4%) |
| Electricity | 4,288 (87.3%) | 2,688 (85.3%) |
| Fuel Oil or Kerosene | 7 (0.1%) | 0 (0.0%) |
| Coal or Coke | 0 (0.0%) | 0 (0.0%) |
| All other Fuels | 22 (0.4%) | 0 (0.0%) |
| No Fuel Used | 9 (0.2%) | 51 (1.6%) |
| Total | 4,914 (100.0%) | 3,151 (100.0%) |
Household Vehicle Usage in Conway
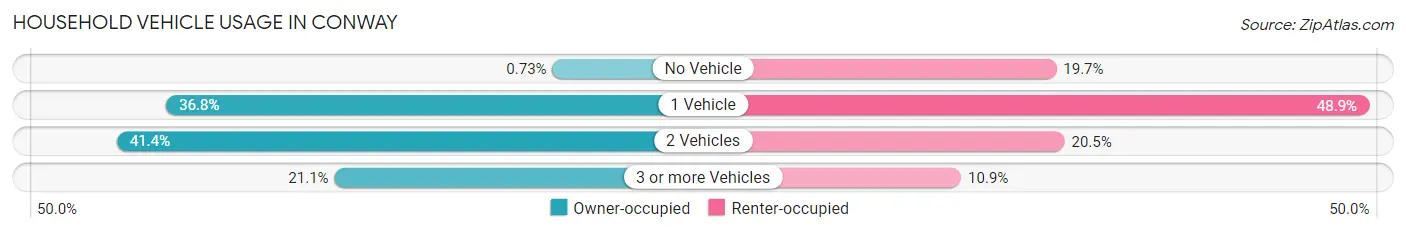
| Vehicles per Household | Owner-occupied | Renter-occupied |
| No Vehicle | 36 (0.7%) | 622 (19.7%) |
| 1 Vehicle | 1,808 (36.8%) | 1,541 (48.9%) |
| 2 Vehicles | 2,034 (41.4%) | 646 (20.5%) |
| 3 or more Vehicles | 1,036 (21.1%) | 342 (10.8%) |
| Total | 4,914 (100.0%) | 3,151 (100.0%) |
Real Estate & Mortgages in Conway
Real Estate and Mortgage Overview in Conway
| Characteristic | Without Mortgage | With Mortgage |
| Housing Units | 1,808 | 3,106 |
| Median Property Value | $207,000 | $198,500 |
| Median Household Income | $50,056 | $406 |
| Monthly Housing Costs | $422 | $45 |
| Real Estate Taxes | $761 | $160 |
Property Value by Mortgage Status in Conway
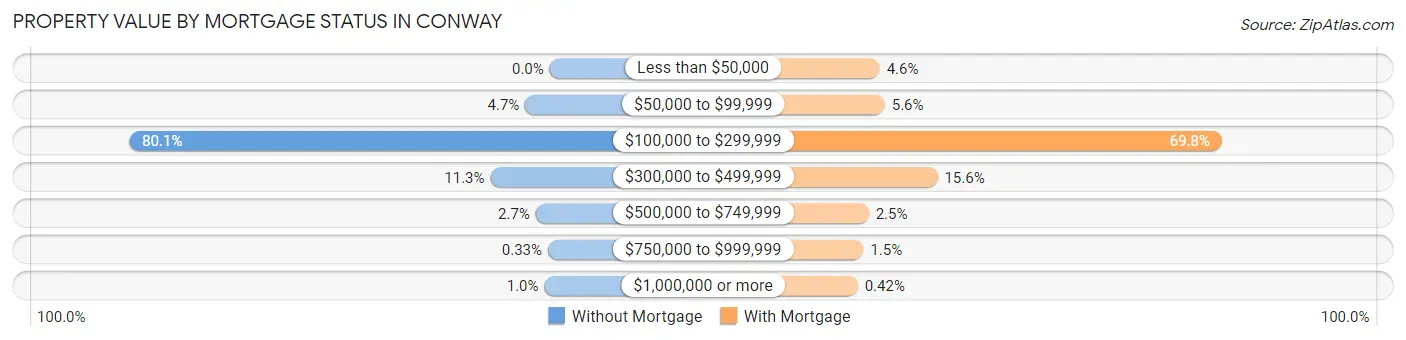
| Property Value | Without Mortgage | With Mortgage |
| Less than $50,000 | 0 (0.0%) | 143 (4.6%) |
| $50,000 to $99,999 | 84 (4.6%) | 173 (5.6%) |
| $100,000 to $299,999 | 1,448 (80.1%) | 2,167 (69.8%) |
| $300,000 to $499,999 | 204 (11.3%) | 485 (15.6%) |
| $500,000 to $749,999 | 48 (2.6%) | 78 (2.5%) |
| $750,000 to $999,999 | 6 (0.3%) | 47 (1.5%) |
| $1,000,000 or more | 18 (1.0%) | 13 (0.4%) |
| Total | 1,808 (100.0%) | 3,106 (100.0%) |
Household Income by Mortgage Status in Conway
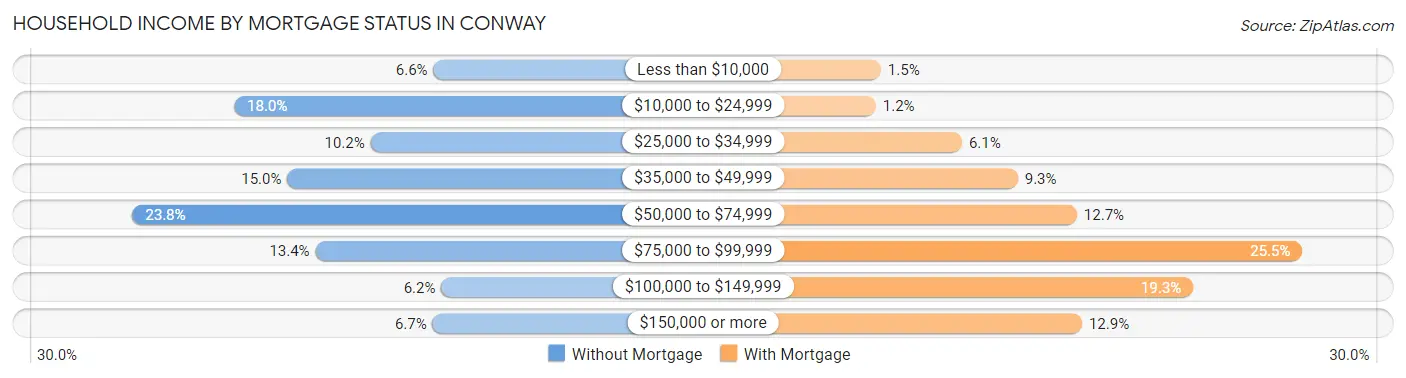
| Household Income | Without Mortgage | With Mortgage |
| Less than $10,000 | 120 (6.6%) | 45 (1.5%) |
| $10,000 to $24,999 | 326 (18.0%) | 36 (1.2%) |
| $25,000 to $34,999 | 185 (10.2%) | 189 (6.1%) |
| $35,000 to $49,999 | 271 (15.0%) | 288 (9.3%) |
| $50,000 to $74,999 | 431 (23.8%) | 393 (12.7%) |
| $75,000 to $99,999 | 242 (13.4%) | 793 (25.5%) |
| $100,000 to $149,999 | 112 (6.2%) | 599 (19.3%) |
| $150,000 or more | 121 (6.7%) | 402 (12.9%) |
| Total | 1,808 (100.0%) | 3,106 (100.0%) |
Property Value to Household Income Ratio in Conway
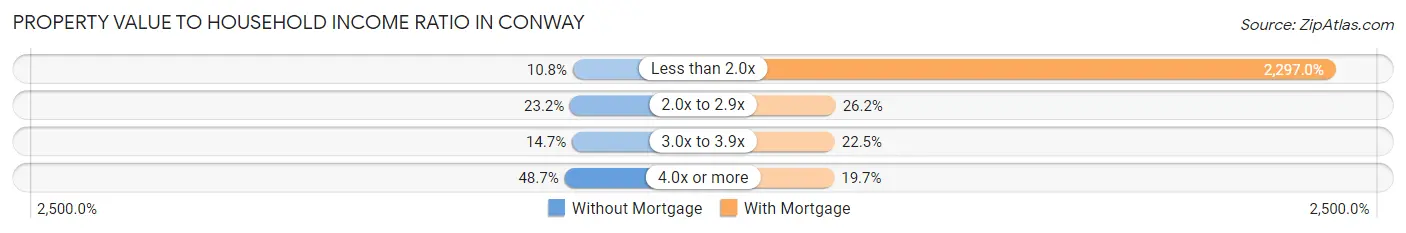
| Value-to-Income Ratio | Without Mortgage | With Mortgage |
| Less than 2.0x | 195 (10.8%) | 71,344 (2,297.0%) |
| 2.0x to 2.9x | 420 (23.2%) | 815 (26.2%) |
| 3.0x to 3.9x | 266 (14.7%) | 699 (22.5%) |
| 4.0x or more | 881 (48.7%) | 613 (19.7%) |
| Total | 1,808 (100.0%) | 3,106 (100.0%) |
Real Estate Taxes by Mortgage Status in Conway
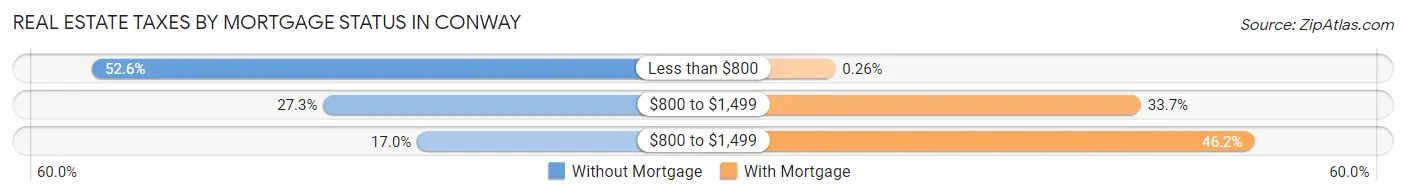
| Property Taxes | Without Mortgage | With Mortgage |
| Less than $800 | 951 (52.6%) | 8 (0.3%) |
| $800 to $1,499 | 493 (27.3%) | 1,048 (33.7%) |
| $800 to $1,499 | 307 (17.0%) | 1,434 (46.2%) |
| Total | 1,808 (100.0%) | 3,106 (100.0%) |
Health & Disability in Conway
Health Insurance Coverage by Age in Conway
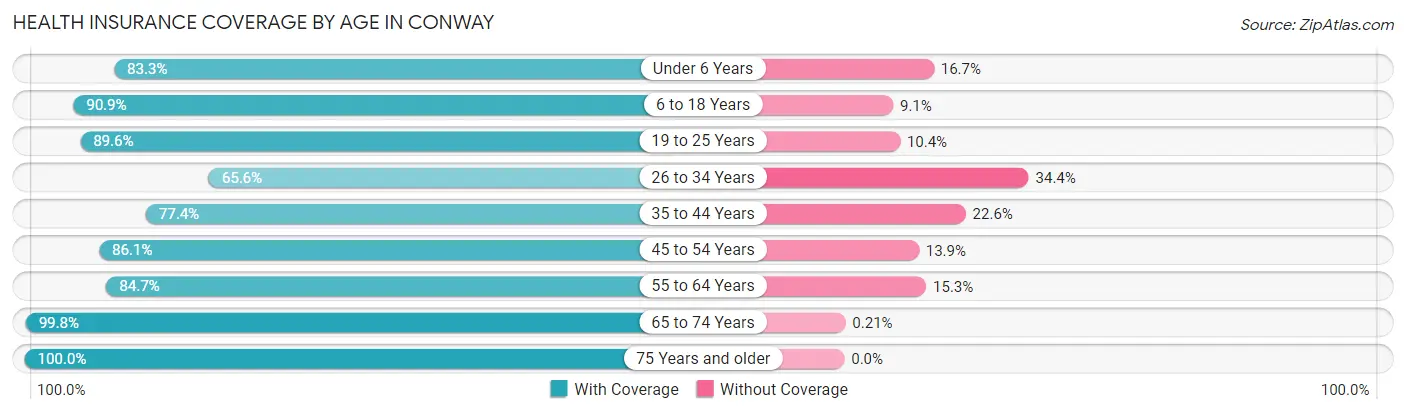
| Age Bracket | With Coverage | Without Coverage |
| Under 6 Years | 1,008 (83.3%) | 202 (16.7%) |
| 6 to 18 Years | 4,168 (90.9%) | 417 (9.1%) |
| 19 to 25 Years | 4,066 (89.6%) | 471 (10.4%) |
| 26 to 34 Years | 1,642 (65.6%) | 860 (34.4%) |
| 35 to 44 Years | 1,781 (77.4%) | 521 (22.6%) |
| 45 to 54 Years | 2,207 (86.1%) | 356 (13.9%) |
| 55 to 64 Years | 2,526 (84.7%) | 455 (15.3%) |
| 65 to 74 Years | 2,832 (99.8%) | 6 (0.2%) |
| 75 Years and older | 1,168 (100.0%) | 0 (0.0%) |
| Total | 21,398 (86.7%) | 3,288 (13.3%) |
Health Insurance Coverage by Citizenship Status in Conway
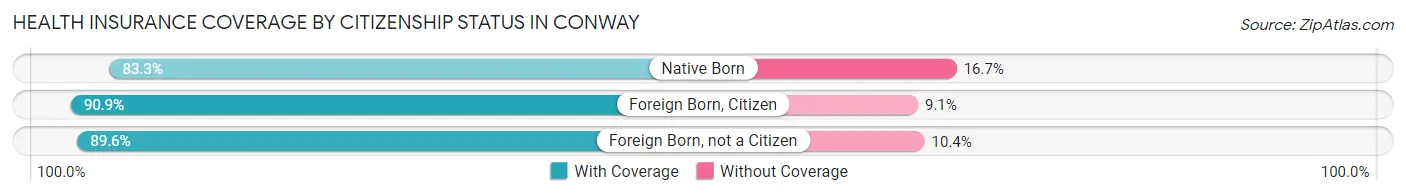
| Citizenship Status | With Coverage | Without Coverage |
| Native Born | 1,008 (83.3%) | 202 (16.7%) |
| Foreign Born, Citizen | 4,168 (90.9%) | 417 (9.1%) |
| Foreign Born, not a Citizen | 4,066 (89.6%) | 471 (10.4%) |
Health Insurance Coverage by Household Income in Conway
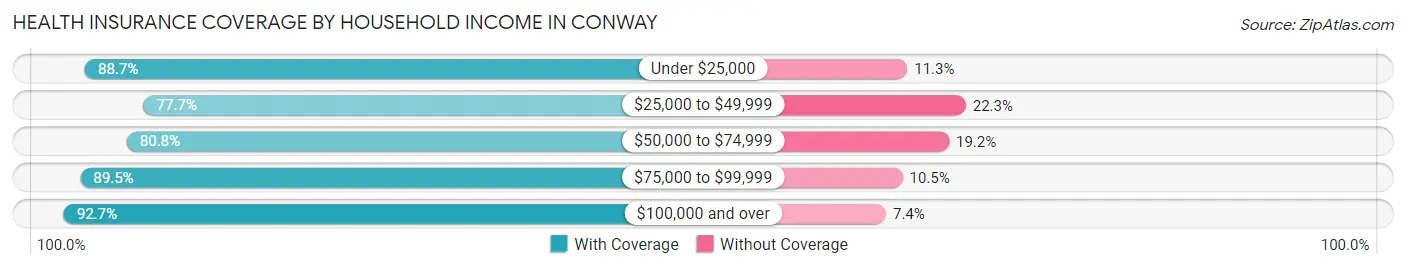
| Household Income | With Coverage | Without Coverage |
| Under $25,000 | 3,454 (88.7%) | 442 (11.3%) |
| $25,000 to $49,999 | 3,890 (77.7%) | 1,116 (22.3%) |
| $50,000 to $74,999 | 3,604 (80.8%) | 854 (19.2%) |
| $75,000 to $99,999 | 3,468 (89.5%) | 405 (10.5%) |
| $100,000 and over | 3,390 (92.6%) | 269 (7.3%) |
Public vs Private Health Insurance Coverage by Age in Conway
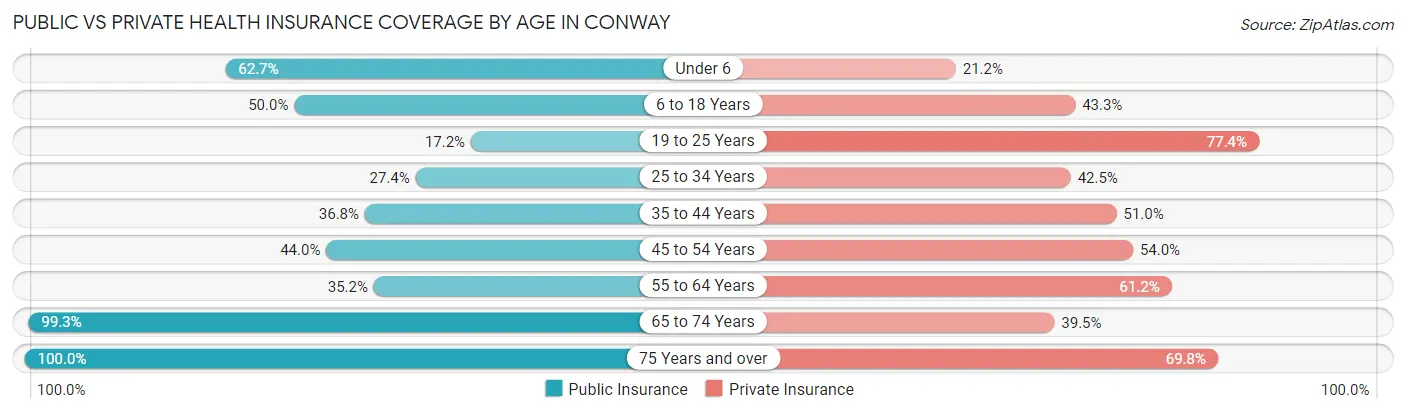
| Age Bracket | Public Insurance | Private Insurance |
| Under 6 | 759 (62.7%) | 256 (21.2%) |
| 6 to 18 Years | 2,290 (49.9%) | 1,986 (43.3%) |
| 19 to 25 Years | 778 (17.2%) | 3,512 (77.4%) |
| 25 to 34 Years | 686 (27.4%) | 1,063 (42.5%) |
| 35 to 44 Years | 848 (36.8%) | 1,174 (51.0%) |
| 45 to 54 Years | 1,128 (44.0%) | 1,385 (54.0%) |
| 55 to 64 Years | 1,049 (35.2%) | 1,825 (61.2%) |
| 65 to 74 Years | 2,818 (99.3%) | 1,120 (39.5%) |
| 75 Years and over | 1,168 (100.0%) | 815 (69.8%) |
| Total | 11,524 (46.7%) | 13,136 (53.2%) |
Disability Status by Sex by Age in Conway
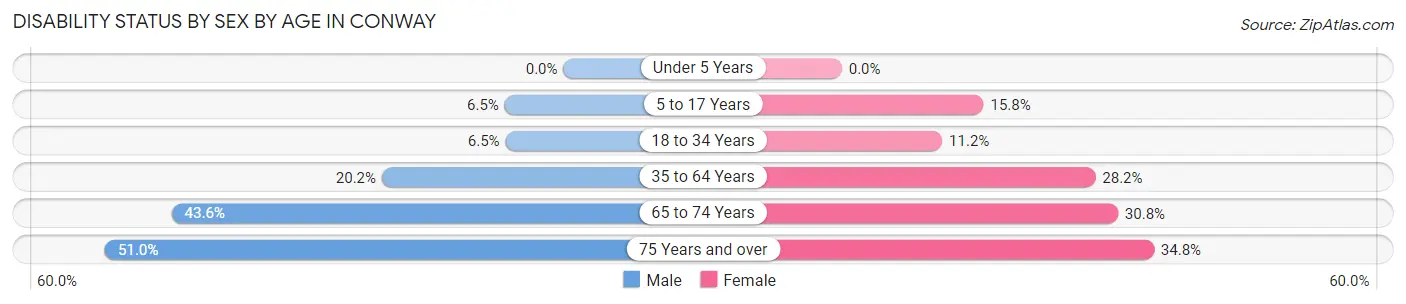
| Age Bracket | Male | Female |
| Under 5 Years | 0 (0.0%) | 0 (0.0%) |
| 5 to 17 Years | 114 (6.5%) | 269 (15.8%) |
| 18 to 34 Years | 264 (6.5%) | 474 (11.2%) |
| 35 to 64 Years | 683 (20.2%) | 1,261 (28.2%) |
| 65 to 74 Years | 574 (43.6%) | 468 (30.7%) |
| 75 Years and over | 273 (51.0%) | 220 (34.8%) |
Disability Class by Sex by Age in Conway
Disability Class: Hearing Difficulty
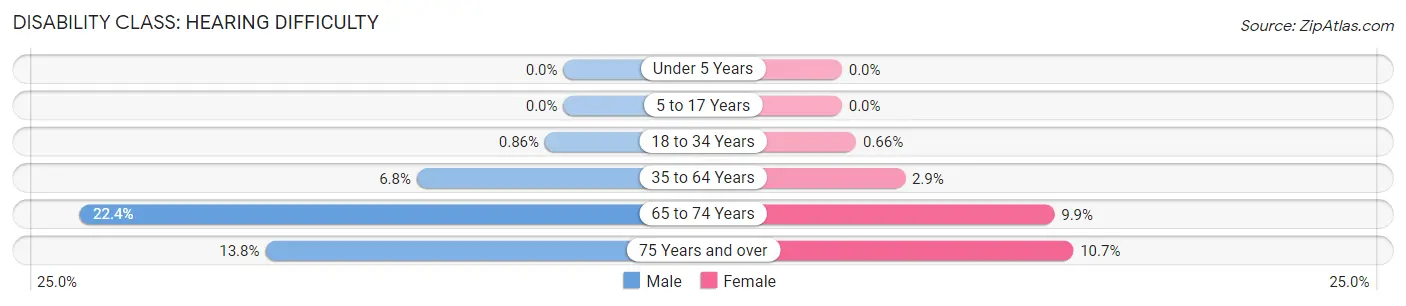
| Age Bracket | Male | Female |
| Under 5 Years | 0 (0.0%) | 0 (0.0%) |
| 5 to 17 Years | 0 (0.0%) | 0 (0.0%) |
| 18 to 34 Years | 35 (0.9%) | 28 (0.7%) |
| 35 to 64 Years | 230 (6.8%) | 131 (2.9%) |
| 65 to 74 Years | 295 (22.4%) | 150 (9.9%) |
| 75 Years and over | 74 (13.8%) | 68 (10.7%) |
Disability Class: Vision Difficulty
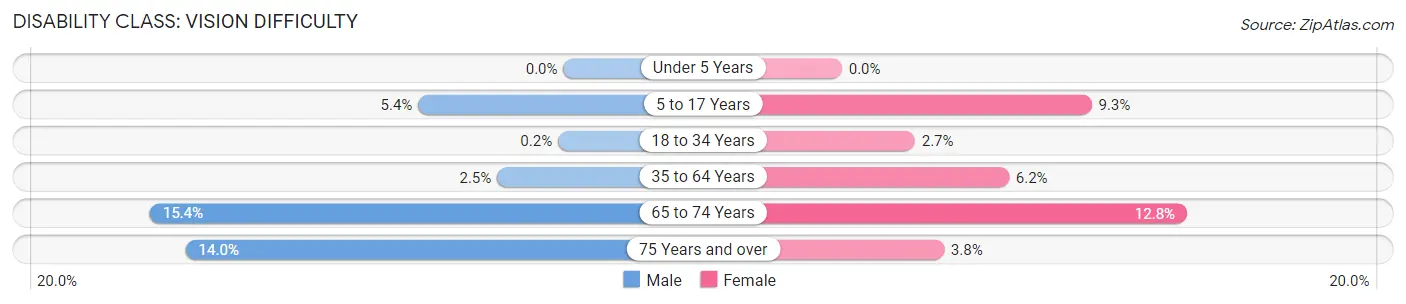
| Age Bracket | Male | Female |
| Under 5 Years | 0 (0.0%) | 0 (0.0%) |
| 5 to 17 Years | 94 (5.4%) | 158 (9.3%) |
| 18 to 34 Years | 8 (0.2%) | 115 (2.7%) |
| 35 to 64 Years | 83 (2.5%) | 277 (6.2%) |
| 65 to 74 Years | 202 (15.3%) | 195 (12.8%) |
| 75 Years and over | 75 (14.0%) | 24 (3.8%) |
Disability Class: Cognitive Difficulty
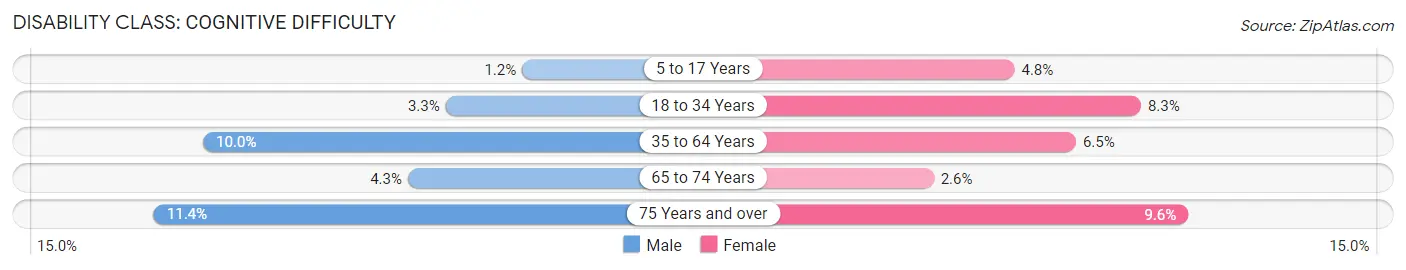
| Age Bracket | Male | Female |
| 5 to 17 Years | 20 (1.1%) | 82 (4.8%) |
| 18 to 34 Years | 134 (3.3%) | 353 (8.3%) |
| 35 to 64 Years | 339 (10.0%) | 291 (6.5%) |
| 65 to 74 Years | 57 (4.3%) | 39 (2.6%) |
| 75 Years and over | 61 (11.4%) | 61 (9.6%) |
Disability Class: Ambulatory Difficulty
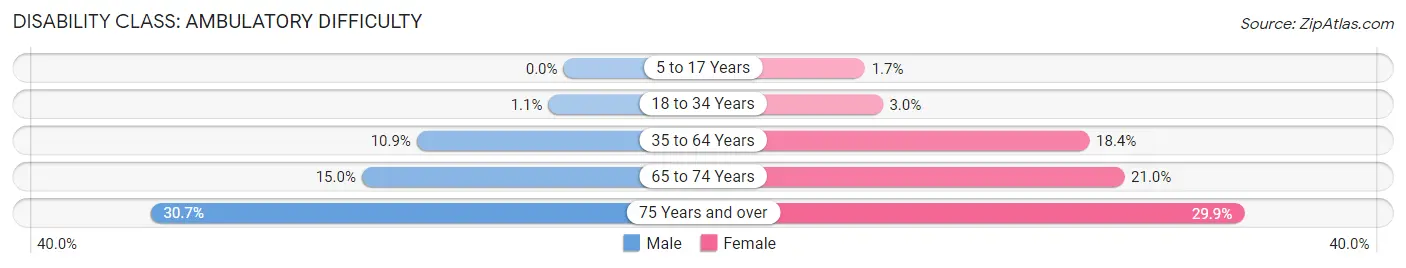
| Age Bracket | Male | Female |
| 5 to 17 Years | 0 (0.0%) | 29 (1.7%) |
| 18 to 34 Years | 46 (1.1%) | 128 (3.0%) |
| 35 to 64 Years | 368 (10.9%) | 820 (18.4%) |
| 65 to 74 Years | 197 (15.0%) | 319 (21.0%) |
| 75 Years and over | 164 (30.6%) | 189 (29.9%) |
Disability Class: Self-Care Difficulty
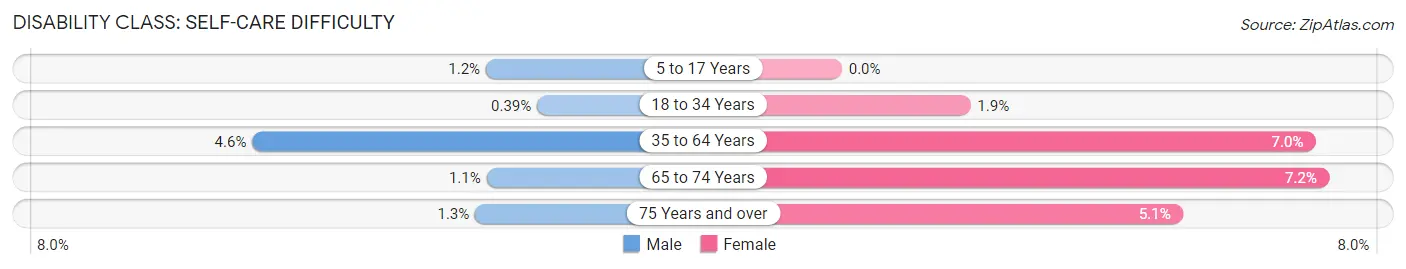
| Age Bracket | Male | Female |
| 5 to 17 Years | 20 (1.1%) | 0 (0.0%) |
| 18 to 34 Years | 16 (0.4%) | 81 (1.9%) |
| 35 to 64 Years | 156 (4.6%) | 314 (7.0%) |
| 65 to 74 Years | 15 (1.1%) | 110 (7.2%) |
| 75 Years and over | 7 (1.3%) | 32 (5.1%) |
Technology Access in Conway
Computing Device Access in Conway
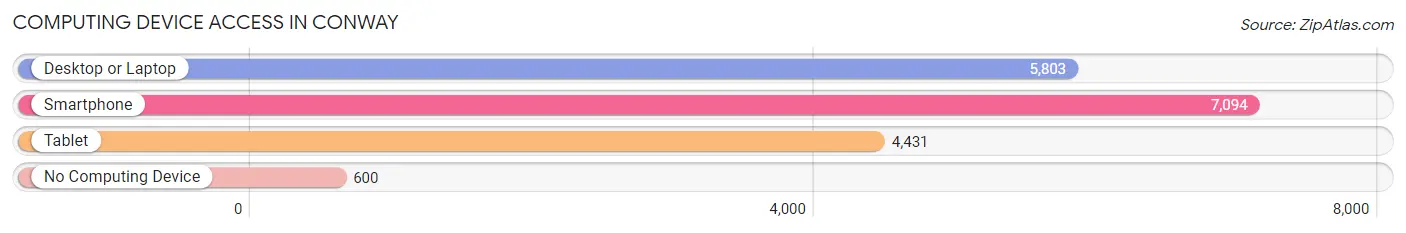
| Device Type | # Households | % Households |
| Desktop or Laptop | 5,803 | 72.0% |
| Smartphone | 7,094 | 88.0% |
| Tablet | 4,431 | 54.9% |
| No Computing Device | 600 | 7.4% |
| Total | 8,065 | 100.0% |
Internet Access in Conway
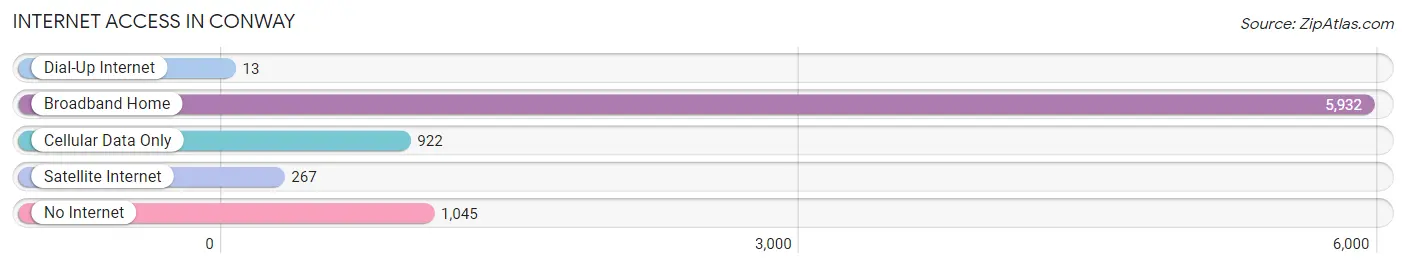
| Internet Type | # Households | % Households |
| Dial-Up Internet | 13 | 0.2% |
| Broadband Home | 5,932 | 73.6% |
| Cellular Data Only | 922 | 11.4% |
| Satellite Internet | 267 | 3.3% |
| No Internet | 1,045 | 13.0% |
| Total | 8,065 | 100.0% |
Conway Summary
Conway, South Carolina is a city located in Horry County, South Carolina. It is the county seat of Horry County and is situated along the Waccamaw River. The city is located approximately 20 miles northwest of Myrtle Beach and is part of the Myrtle Beach metropolitan area. As of the 2010 census, the population of Conway was 16,317.
Geography
Conway is located at 33°51'N 79°04'W (33.851, -79.067). According to the United States Census Bureau, the city has a total area of 11.2 square miles (29.0 km2), of which 11.1 square miles (28.7 km2) is land and 0.1 square miles (0.3 km2) is water.
The city is located in the coastal plain region of South Carolina. The terrain is generally flat, with some rolling hills. The Waccamaw River runs through the city, and there are several small creeks and streams in the area.
Climate
Conway has a humid subtropical climate, with hot, humid summers and mild winters. The average annual temperature is around 70°F (21°C). The average annual precipitation is around 50 inches (127 cm).
Demographics
As of the 2010 census, there were 16,317 people, 6,845 households, and 4,072 families residing in the city. The population density was 1,467.2 people per square mile (567.2/km2). There were 7,717 housing units at an average density of 694.3 per square mile (268.3/km2). The racial makeup of the city was 68.2% White, 25.2% African American, 0.3% Native American, 1.7% Asian, 0.1% Pacific Islander, 2.7% from other races, and 1.9% from two or more races. Hispanic or Latino of any race were 6.2% of the population.
Economy
Conway is home to several large employers, including Horry County Schools, Conway Medical Center, and Coastal Carolina University. The city is also home to several small businesses, including restaurants, retail stores, and professional services.
The city's economy is largely based on tourism, with Myrtle Beach being a major draw for visitors. The city is also home to several manufacturing companies, including International Paper, which produces paper products, and Sonoco, which produces plastic products.
Education
Conway is served by the Horry County School District. The district operates several elementary, middle, and high schools in the city. The city is also home to Coastal Carolina University, a public university that offers undergraduate and graduate degrees.
Conclusion
Conway, South Carolina is a city located in Horry County, South Carolina. It is the county seat of Horry County and is situated along the Waccamaw River. The city is located approximately 20 miles northwest of Myrtle Beach and is part of the Myrtle Beach metropolitan area. As of the 2010 census, the population of Conway was 16,317. The city has a humid subtropical climate, with hot, humid summers and mild winters. The population is largely white, with African Americans making up the largest minority group. The city's economy is largely based on tourism, with Myrtle Beach being a major draw for visitors. The city is also home to several large employers, including Horry County Schools, Conway Medical Center, and Coastal Carolina University. The city is served by the Horry County School District, and is home to Coastal Carolina University.
Common Questions
What is Per Capita Income in Conway?
Per Capita income in Conway is $23,818.
What is the Median Family Income in Conway?
Median Family Income in Conway is $62,963.
What is the Median Household income in Conway?
Median Household Income in Conway is $48,161.
What is Income or Wage Gap in Conway?
Income or Wage Gap in Conway is 15.5%.
Women in Conway earn 84.5 cents for every dollar earned by a man.
What is Family Income Deficit in Conway?
Family Income Deficit in Conway is $12,285.
Families that are below poverty line in Conway earn $12,285 less on average than the poverty threshold level.
What is Inequality or Gini Index in Conway?
Inequality or Gini Index in Conway is 0.47.
What is the Total Population of Conway?
Total Population of Conway is 25,121.
What is the Total Male Population of Conway?
Total Male Population of Conway is 11,851.
What is the Total Female Population of Conway?
Total Female Population of Conway is 13,270.
What is the Ratio of Males per 100 Females in Conway?
There are 89.31 Males per 100 Females in Conway.
What is the Ratio of Females per 100 Males in Conway?
There are 111.97 Females per 100 Males in Conway.
What is the Median Population Age in Conway?
Median Population Age in Conway is 34.4 Years.
What is the Average Family Size in Conway
Average Family Size in Conway is 3.3 People.
What is the Average Household Size in Conway
Average Household Size in Conway is 2.6 People.
How Large is the Labor Force in Conway?
There are 10,445 People in the Labor Forcein in Conway.
What is the Percentage of People in the Labor Force in Conway?
49.1% of People are in the Labor Force in Conway.
What is the Unemployment Rate in Conway?
Unemployment Rate in Conway is 8.8%.