Cities with the Highest Percentage of South African Population in the United States
RELATED REPORTS & OPTIONS
South African
United States
Compare Cities
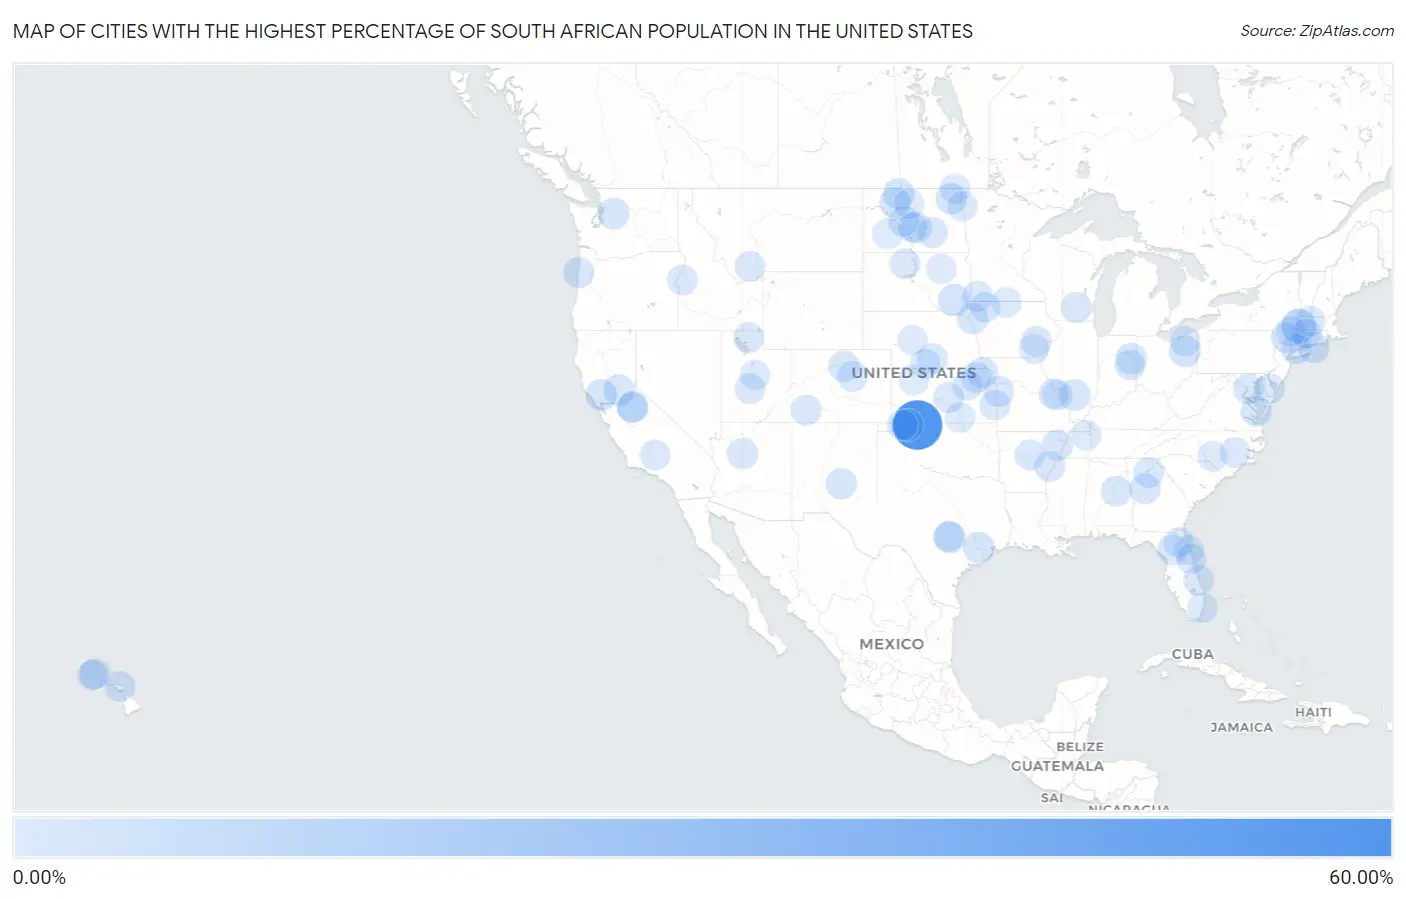
Map of Cities with the Highest Percentage of South African Population in the United States
0.00%
60.00%
Cities with the Highest Percentage of South African Population in the United States
| City | South African | vs State | vs National | |
| 1. | Knowles | 54.55% | 0.016%(+54.5)#1 | 0.024%(+54.5)#1 |
| 2. | Housatonic | 12.18% | 0.029%(+12.2)#1 | 0.024%(+12.2)#2 |
| 3. | Bass Lake | 9.40% | 0.011%(+9.39)#1 | 0.024%(+9.38)#3 |
| 4. | Bakersfield Country Club | 7.33% | 0.032%(+7.29)#1 | 0.024%(+7.30)#4 |
| 5. | Turpin | 5.84% | 0.016%(+5.82)#2 | 0.024%(+5.81)#5 |
| 6. | Greentown | 4.46% | 0.011%(+4.45)#2 | 0.024%(+4.44)#6 |
| 7. | Emery | 4.27% | 0.027%(+4.24)#1 | 0.024%(+4.24)#7 |
| 8. | Wing | 4.07% | 0.060%(+4.01)#1 | 0.024%(+4.05)#8 |
| 9. | Barton Creek | 3.87% | 0.026%(+3.84)#1 | 0.024%(+3.84)#9 |
| 10. | Fulshear | 3.83% | 0.026%(+3.81)#2 | 0.024%(+3.81)#10 |
| 11. | St Helena | 3.80% | 0.032%(+3.76)#2 | 0.024%(+3.77)#11 |
| 12. | Index | 3.79% | 0.029%(+3.76)#1 | 0.024%(+3.76)#12 |
| 13. | Greenport West | 3.68% | 0.025%(+3.65)#1 | 0.024%(+3.65)#13 |
| 14. | Mohall | 3.61% | 0.060%(+3.55)#2 | 0.024%(+3.59)#14 |
| 15. | Edinburg | 3.59% | 0.060%(+3.53)#3 | 0.024%(+3.57)#15 |
| 16. | Junction City | 3.58% | 0.016%(+3.57)#1 | 0.024%(+3.56)#16 |
| 17. | Pennville | 3.51% | 0.019%(+3.50)#1 | 0.024%(+3.49)#17 |
| 18. | Capitan | 3.33% | 0.0081%(+3.32)#1 | 0.024%(+3.31)#18 |
| 19. | Penryn | 3.24% | 0.032%(+3.21)#3 | 0.024%(+3.21)#19 |
| 20. | Ambler Borough | 3.14% | 0.017%(+3.13)#1 | 0.024%(+3.12)#20 |
| 21. | Hinton | 2.99% | 0.013%(+2.98)#1 | 0.024%(+2.97)#21 |
| 22. | Lincoln City | 2.96% | 0.027%(+2.94)#1 | 0.024%(+2.94)#22 |
| 23. | Irvington | 2.89% | 0.028%(+2.86)#1 | 0.024%(+2.87)#23 |
| 24. | Ash Fork | 2.79% | 0.023%(+2.77)#1 | 0.024%(+2.77)#24 |
| 25. | Jamestown | 2.79% | 0.029%(+2.76)#1 | 0.024%(+2.76)#25 |
| 26. | Tuolumne City | 2.78% | 0.032%(+2.74)#4 | 0.024%(+2.75)#26 |
| 27. | Woodlawn Cdp Prince George S County | 2.74% | 0.037%(+2.70)#1 | 0.024%(+2.72)#27 |
| 28. | Groveland | 2.71% | 0.032%(+2.68)#5 | 0.024%(+2.68)#28 |
| 29. | Marshall | 2.65% | 0.012%(+2.63)#1 | 0.024%(+2.62)#29 |
| 30. | Caraway | 2.64% | 0.021%(+2.62)#1 | 0.024%(+2.62)#30 |
| 31. | Berthold | 2.64% | 0.060%(+2.58)#4 | 0.024%(+2.61)#31 |
| 32. | Orchard Hill | 2.60% | 0.036%(+2.57)#1 | 0.024%(+2.58)#32 |
| 33. | Pupukea | 2.50% | 0.028%(+2.47)#1 | 0.024%(+2.47)#33 |
| 34. | Powhattan | 2.47% | 0.012%(+2.46)#1 | 0.024%(+2.45)#34 |
| 35. | Watchtower | 2.39% | 0.025%(+2.36)#2 | 0.024%(+2.36)#35 |
| 36. | Riverview Estates | 2.25% | 0.0089%(+2.24)#1 | 0.024%(+2.22)#36 |
| 37. | Foxfield | 2.23% | 0.029%(+2.20)#2 | 0.024%(+2.20)#37 |
| 38. | Summerfield | 2.19% | 0.037%(+2.15)#2 | 0.024%(+2.17)#38 |
| 39. | Indian River Shores | 2.11% | 0.038%(+2.07)#1 | 0.024%(+2.09)#39 |
| 40. | Micanopy | 2.11% | 0.038%(+2.07)#2 | 0.024%(+2.08)#40 |
| 41. | Havensville | 2.11% | 0.012%(+2.09)#2 | 0.024%(+2.08)#41 |
| 42. | Fulton | 2.11% | 0.012%(+2.09)#3 | 0.024%(+2.08)#42 |
| 43. | Rico | 2.09% | 0.029%(+2.07)#3 | 0.024%(+2.07)#43 |
| 44. | Lismore | 2.05% | 0.014%(+2.04)#1 | 0.024%(+2.03)#44 |
| 45. | Rosemont | 1.99% | 0.017%(+1.98)#2 | 0.024%(+1.97)#45 |
| 46. | Selma | 1.98% | 0.019%(+1.96)#2 | 0.024%(+1.96)#46 |
| 47. | Point Venture | 1.97% | 0.026%(+1.95)#3 | 0.024%(+1.95)#47 |
| 48. | Stewartville | 1.92% | 0.014%(+1.90)#1 | 0.024%(+1.89)#48 |
| 49. | Timber Lake | 1.91% | 0.027%(+1.89)#2 | 0.024%(+1.89)#49 |
| 50. | Marvell | 1.91% | 0.021%(+1.89)#2 | 0.024%(+1.89)#50 |
| 51. | Wellman | 1.90% | 0.013%(+1.89)#2 | 0.024%(+1.88)#51 |
| 52. | Hartley | 1.89% | 0.013%(+1.88)#3 | 0.024%(+1.86)#52 |
| 53. | Hooker | 1.86% | 0.016%(+1.84)#3 | 0.024%(+1.83)#53 |
| 54. | Ogden | 1.83% | 0.012%(+1.82)#4 | 0.024%(+1.81)#54 |
| 55. | Haiku Pauwela | 1.83% | 0.028%(+1.80)#2 | 0.024%(+1.80)#55 |
| 56. | Aurora | 1.78% | 0.028%(+1.75)#1 | 0.024%(+1.76)#56 |
| 57. | Old Greenwich | 1.77% | 0.034%(+1.74)#1 | 0.024%(+1.75)#57 |
| 58. | Demarest Borough | 1.76% | 0.028%(+1.74)#1 | 0.024%(+1.74)#58 |
| 59. | Little River | 1.75% | 0.012%(+1.74)#5 | 0.024%(+1.73)#59 |
| 60. | Honeyville | 1.75% | 0.028%(+1.72)#2 | 0.024%(+1.72)#60 |
| 61. | Mokuleia | 1.74% | 0.028%(+1.71)#3 | 0.024%(+1.72)#61 |
| 62. | Walnut Creek | 1.72% | 0.030%(+1.69)#1 | 0.024%(+1.70)#62 |
| 63. | Cleveland | 1.68% | 0.060%(+1.62)#5 | 0.024%(+1.66)#63 |
| 64. | Axtell | 1.66% | 0.013%(+1.65)#1 | 0.024%(+1.64)#64 |
| 65. | Underwood | 1.64% | 0.060%(+1.58)#6 | 0.024%(+1.62)#65 |
| 66. | Virginia City | 1.57% | 0.018%(+1.56)#1 | 0.024%(+1.55)#66 |
| 67. | Holland | 1.54% | 0.021%(+1.52)#3 | 0.024%(+1.52)#67 |
| 68. | Bear Valley Springs | 1.54% | 0.032%(+1.50)#6 | 0.024%(+1.51)#68 |
| 69. | Cambridge | 1.53% | 0.012%(+1.52)#1 | 0.024%(+1.51)#69 |
| 70. | Flowery Branch | 1.53% | 0.036%(+1.49)#2 | 0.024%(+1.50)#70 |
| 71. | Maharishi Vedic City | 1.45% | 0.013%(+1.44)#4 | 0.024%(+1.43)#71 |
| 72. | Granville | 1.43% | 0.060%(+1.37)#7 | 0.024%(+1.41)#72 |
| 73. | Richardton | 1.43% | 0.060%(+1.37)#8 | 0.024%(+1.41)#73 |
| 74. | Beverly Beach | 1.41% | 0.038%(+1.38)#3 | 0.024%(+1.39)#74 |
| 75. | Hoxie | 1.40% | 0.012%(+1.39)#6 | 0.024%(+1.37)#75 |
| 76. | Oxford | 1.37% | 0.012%(+1.36)#7 | 0.024%(+1.35)#76 |
| 77. | Fountain Green | 1.35% | 0.028%(+1.32)#3 | 0.024%(+1.33)#77 |
| 78. | Lakeshire | 1.34% | 0.0089%(+1.33)#2 | 0.024%(+1.31)#78 |
| 79. | Red Hook | 1.32% | 0.025%(+1.30)#3 | 0.024%(+1.30)#79 |
| 80. | Neche | 1.28% | 0.060%(+1.22)#9 | 0.024%(+1.26)#80 |
| 81. | Cranford | 1.27% | 0.028%(+1.25)#2 | 0.024%(+1.25)#81 |
| 82. | Stapleton | 1.27% | 0.013%(+1.26)#2 | 0.024%(+1.25)#82 |
| 83. | Penney Farms | 1.25% | 0.038%(+1.21)#4 | 0.024%(+1.22)#83 |
| 84. | Glen Gardner Borough | 1.24% | 0.028%(+1.21)#3 | 0.024%(+1.22)#84 |
| 85. | South Deerfield | 1.23% | 0.029%(+1.20)#2 | 0.024%(+1.20)#85 |
| 86. | Moreland Hills | 1.22% | 0.011%(+1.21)#3 | 0.024%(+1.20)#86 |
| 87. | Aventura | 1.20% | 0.038%(+1.17)#5 | 0.024%(+1.18)#87 |
| 88. | Glencoe | 1.20% | 0.038%(+1.16)#6 | 0.024%(+1.17)#88 |
| 89. | Weatogue | 1.20% | 0.034%(+1.16)#2 | 0.024%(+1.17)#89 |
| 90. | Aberdeen | 1.19% | 0.030%(+1.16)#2 | 0.024%(+1.16)#90 |
| 91. | Bloomsbury Borough | 1.16% | 0.028%(+1.14)#4 | 0.024%(+1.14)#91 |
| 92. | Mellette | 1.14% | 0.027%(+1.11)#3 | 0.024%(+1.11)#92 |
| 93. | Regan | 1.14% | 0.060%(+1.08)#10 | 0.024%(+1.11)#93 |
| 94. | Greens Farms | 1.11% | 0.034%(+1.08)#3 | 0.024%(+1.09)#94 |
| 95. | Clarkson Valley | 1.07% | 0.0089%(+1.06)#3 | 0.024%(+1.05)#95 |
| 96. | Alvarado | 1.07% | 0.014%(+1.06)#2 | 0.024%(+1.05)#96 |
| 97. | Rake | 1.07% | 0.013%(+1.06)#5 | 0.024%(+1.05)#97 |
| 98. | Oxford | 1.04% | 0.013%(+1.03)#3 | 0.024%(+1.02)#98 |
| 99. | Paris | 1.04% | 0.019%(+1.02)#1 | 0.024%(+1.01)#99 |
| 100. | Milford | 1.03% | 0.040%(+0.992)#1 | 0.024%(+1.01)#100 |
Common Questions
What are the Top 10 Cities with the Highest Percentage of South African Population in the United States?
Top 10 Cities with the Highest Percentage of South African Population in the United States are:
What city has the Highest Percentage of South African Population in the United States?
Knowles has the Highest Percentage of South African Population in the United States with 54.55%.
What is the Percentage of South African Population in the United States?
Percentage of South African Population in the United States is 0.024%.