Anderson County, SC Map & Demographics
Anderson County Map
Anderson County Overview
$33,714
PER CAPITA INCOME
$75,962
AVG FAMILY INCOME
$62,347
AVG HOUSEHOLD INCOME
36.6%
WAGE / INCOME GAP [ % ]
63.4¢/ $1
WAGE / INCOME GAP [ $ ]
$11,980
FAMILY INCOME DEFICIT
0.47
INEQUALITY / GINI INDEX
204,592
TOTAL POPULATION
99,223
MALE POPULATION
105,369
FEMALE POPULATION
94.17
MALES / 100 FEMALES
106.19
FEMALES / 100 MALES
40.6
MEDIAN AGE
3.0
AVG FAMILY SIZE
2.5
AVG HOUSEHOLD SIZE
98,648
LABOR FORCE [ PEOPLE ]
60.3%
PERCENT IN LABOR FORCE
5.5%
UNEMPLOYMENT RATE
Anderson County Area Codes
Income in Anderson County
Income Overview in Anderson County
Per Capita Income in Anderson County is $33,714, while median incomes of families and households are $75,962 and $62,347 respectively.
| Characteristic | Number | Measure |
| Per Capita Income | 204,592 | $33,714 |
| Median Family Income | 55,065 | $75,962 |
| Mean Family Income | 55,065 | $96,616 |
| Median Household Income | 80,301 | $62,347 |
| Mean Household Income | 80,301 | $84,294 |
| Income Deficit | 55,065 | $11,980 |
| Wage / Income Gap (%) | 204,592 | 36.64% |
| Wage / Income Gap ($) | 204,592 | 63.36¢ per $1 |
| Gini / Inequality Index | 204,592 | 0.47 |
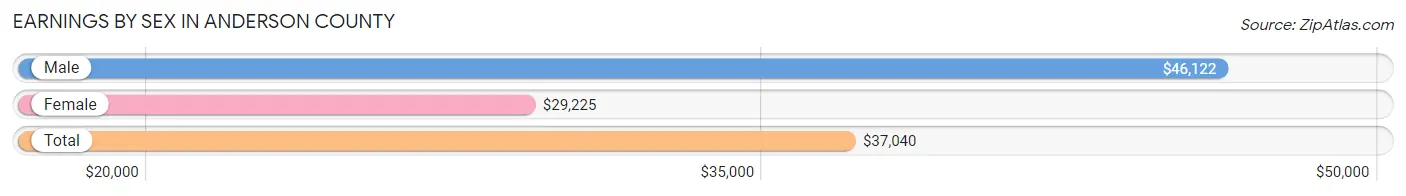
Earnings by Sex in Anderson County
Average Earnings in Anderson County are $37,040, $46,122 for men and $29,225 for women, a difference of 36.6%.
| Sex | Number | Average Earnings |
| Male | 53,648 (52.6%) | $46,122 |
| Female | 48,353 (47.4%) | $29,225 |
| Total | 102,001 (100.0%) | $37,040 |
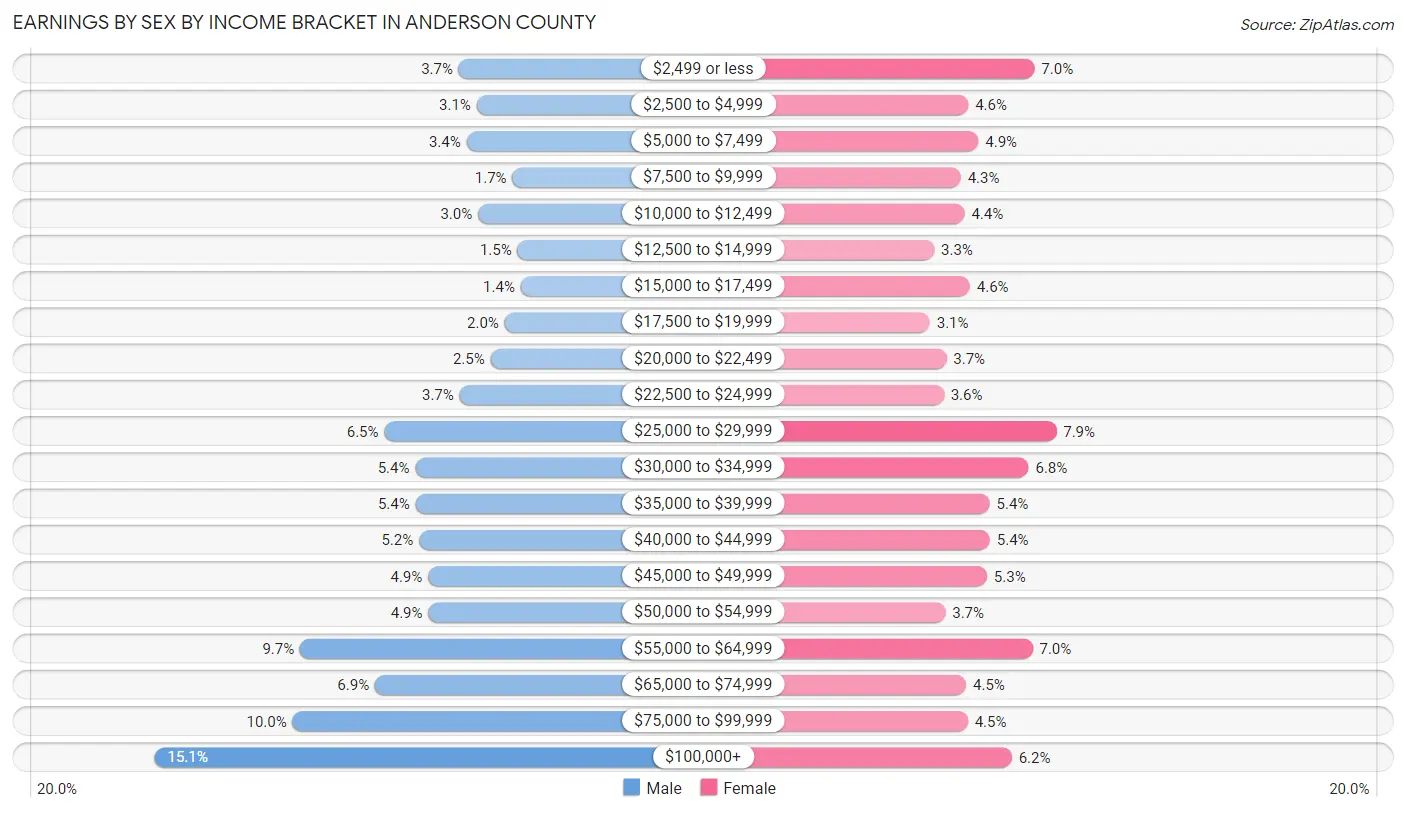
Earnings by Sex by Income Bracket in Anderson County
The most common earnings brackets in Anderson County are $100,000+ for men (8,118 | 15.1%) and $25,000 to $29,999 for women (3,796 | 7.9%).
| Income | Male | Female |
| $2,499 or less | 2,002 (3.7%) | 3,400 (7.0%) |
| $2,500 to $4,999 | 1,639 (3.1%) | 2,200 (4.5%) |
| $5,000 to $7,499 | 1,846 (3.4%) | 2,383 (4.9%) |
| $7,500 to $9,999 | 925 (1.7%) | 2,064 (4.3%) |
| $10,000 to $12,499 | 1,617 (3.0%) | 2,134 (4.4%) |
| $12,500 to $14,999 | 822 (1.5%) | 1,579 (3.3%) |
| $15,000 to $17,499 | 757 (1.4%) | 2,230 (4.6%) |
| $17,500 to $19,999 | 1,081 (2.0%) | 1,505 (3.1%) |
| $20,000 to $22,499 | 1,362 (2.5%) | 1,805 (3.7%) |
| $22,500 to $24,999 | 1,987 (3.7%) | 1,755 (3.6%) |
| $25,000 to $29,999 | 3,496 (6.5%) | 3,796 (7.9%) |
| $30,000 to $34,999 | 2,873 (5.4%) | 3,294 (6.8%) |
| $35,000 to $39,999 | 2,870 (5.3%) | 2,589 (5.3%) |
| $40,000 to $44,999 | 2,799 (5.2%) | 2,591 (5.4%) |
| $45,000 to $49,999 | 2,619 (4.9%) | 2,538 (5.2%) |
| $50,000 to $54,999 | 2,611 (4.9%) | 1,782 (3.7%) |
| $55,000 to $64,999 | 5,192 (9.7%) | 3,367 (7.0%) |
| $65,000 to $74,999 | 3,687 (6.9%) | 2,161 (4.5%) |
| $75,000 to $99,999 | 5,345 (10.0%) | 2,192 (4.5%) |
| $100,000+ | 8,118 (15.1%) | 2,988 (6.2%) |
| Total | 53,648 (100.0%) | 48,353 (100.0%) |
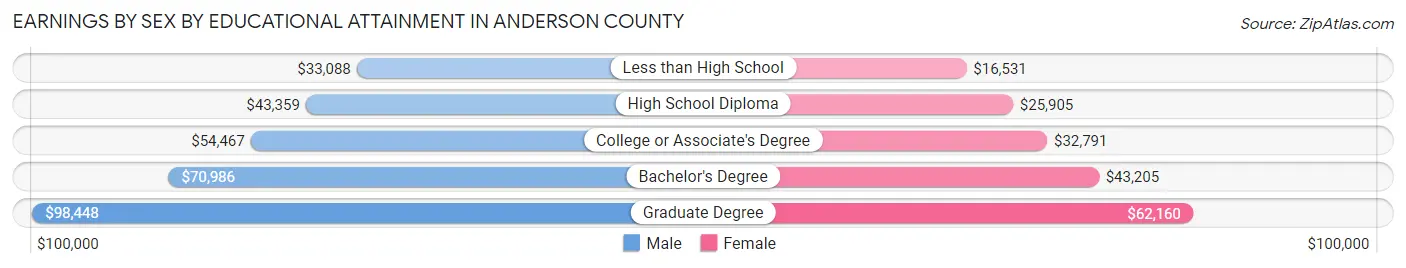
Earnings by Sex by Educational Attainment in Anderson County
Average earnings in Anderson County are $53,004 for men and $34,089 for women, a difference of 35.7%. Men with an educational attainment of graduate degree enjoy the highest average annual earnings of $98,448, while those with less than high school education earn the least with $33,088. Women with an educational attainment of graduate degree earn the most with the average annual earnings of $62,160, while those with less than high school education have the smallest earnings of $16,531.
| Educational Attainment | Male Income | Female Income |
| Less than High School | $33,088 | $16,531 |
| High School Diploma | $43,359 | $25,905 |
| College or Associate's Degree | $54,467 | $32,791 |
| Bachelor's Degree | $70,986 | $43,205 |
| Graduate Degree | $98,448 | $62,160 |
| Total | $53,004 | $34,089 |
Family Income in Anderson County
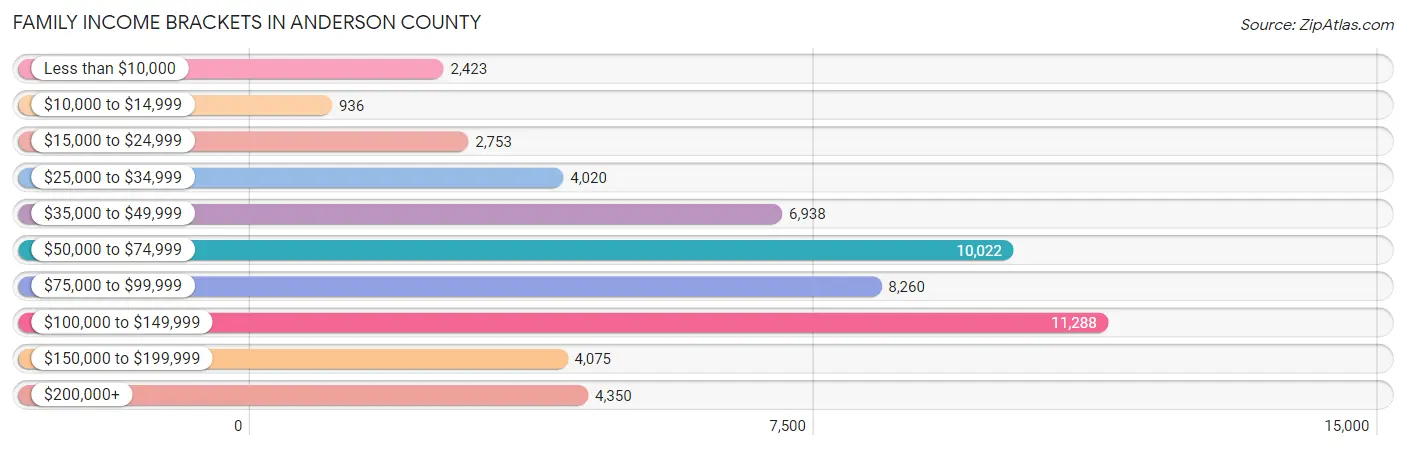
Family Income Brackets in Anderson County
According to the Anderson County family income data, there are 11,288 families falling into the $100,000 to $149,999 income range, which is the most common income bracket and makes up 20.5% of all families. Conversely, the $10,000 to $14,999 income bracket is the least frequent group with only 936 families (1.7%) belonging to this category.
| Income Bracket | # Families | % Families |
| Less than $10,000 | 2,423 | 4.4% |
| $10,000 to $14,999 | 936 | 1.7% |
| $15,000 to $24,999 | 2,753 | 5.0% |
| $25,000 to $34,999 | 4,020 | 7.3% |
| $35,000 to $49,999 | 6,938 | 12.6% |
| $50,000 to $74,999 | 10,022 | 18.2% |
| $75,000 to $99,999 | 8,260 | 15.0% |
| $100,000 to $149,999 | 11,288 | 20.5% |
| $150,000 to $199,999 | 4,075 | 7.4% |
| $200,000+ | 4,350 | 7.9% |
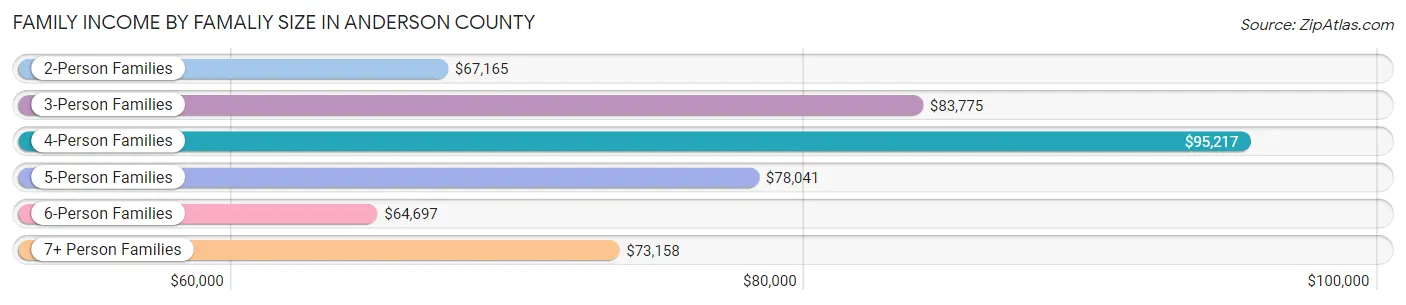
Family Income by Famaliy Size in Anderson County
4-person families (9,516 | 17.3%) account for the highest median family income in Anderson County with $95,217 per family, while 2-person families (27,943 | 50.7%) have the highest median income of $33,582 per family member.
| Income Bracket | # Families | Median Income |
| 2-Person Families | 27,943 (50.7%) | $67,165 |
| 3-Person Families | 11,745 (21.3%) | $83,775 |
| 4-Person Families | 9,516 (17.3%) | $95,217 |
| 5-Person Families | 4,178 (7.6%) | $78,041 |
| 6-Person Families | 1,033 (1.9%) | $64,697 |
| 7+ Person Families | 650 (1.2%) | $73,158 |
| Total | 55,065 (100.0%) | $75,962 |
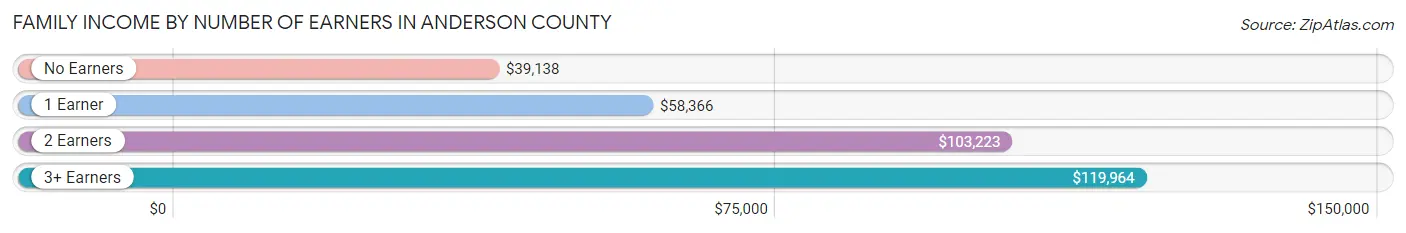
Family Income by Number of Earners in Anderson County
The median family income in Anderson County is $75,962, with families comprising 3+ earners (5,077) having the highest median family income of $119,964, while families with no earners (9,498) have the lowest median family income of $39,138, accounting for 9.2% and 17.2% of families, respectively.
| Number of Earners | # Families | Median Income |
| No Earners | 9,498 (17.2%) | $39,138 |
| 1 Earner | 19,401 (35.2%) | $58,366 |
| 2 Earners | 21,089 (38.3%) | $103,223 |
| 3+ Earners | 5,077 (9.2%) | $119,964 |
| Total | 55,065 (100.0%) | $75,962 |
Household Income in Anderson County
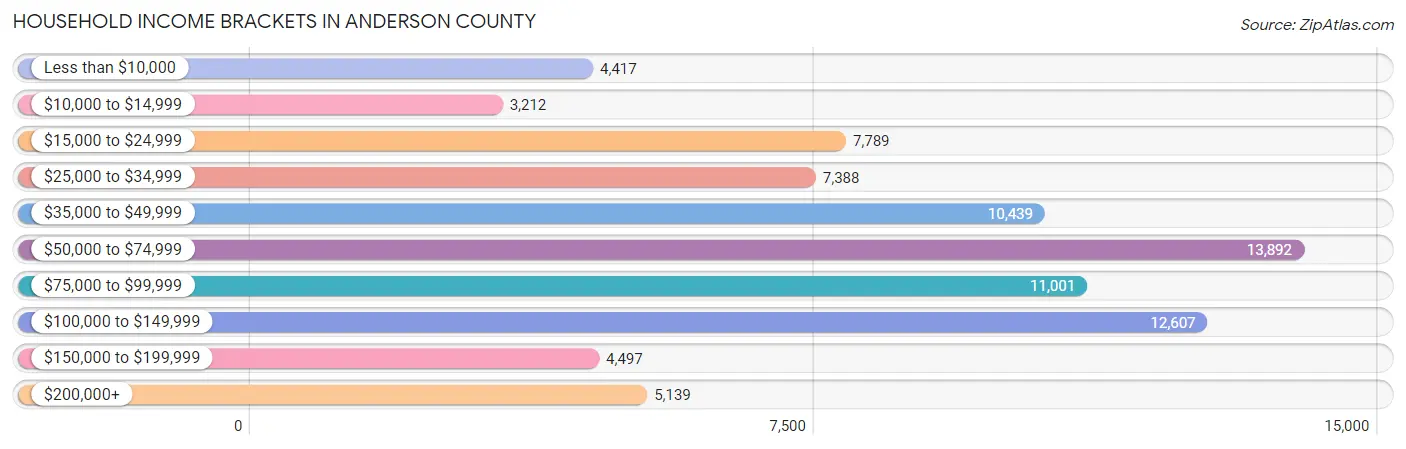
Household Income Brackets in Anderson County
With 13,892 households falling in the category, the $50,000 to $74,999 income range is the most frequent in Anderson County, accounting for 17.3% of all households. In contrast, only 3,212 households (4.0%) fall into the $10,000 to $14,999 income bracket, making it the least populous group.
| Income Bracket | # Households | % Households |
| Less than $10,000 | 4,417 | 5.5% |
| $10,000 to $14,999 | 3,212 | 4.0% |
| $15,000 to $24,999 | 7,789 | 9.7% |
| $25,000 to $34,999 | 7,388 | 9.2% |
| $35,000 to $49,999 | 10,439 | 13.0% |
| $50,000 to $74,999 | 13,892 | 17.3% |
| $75,000 to $99,999 | 11,001 | 13.7% |
| $100,000 to $149,999 | 12,607 | 15.7% |
| $150,000 to $199,999 | 4,497 | 5.6% |
| $200,000+ | 5,139 | 6.4% |
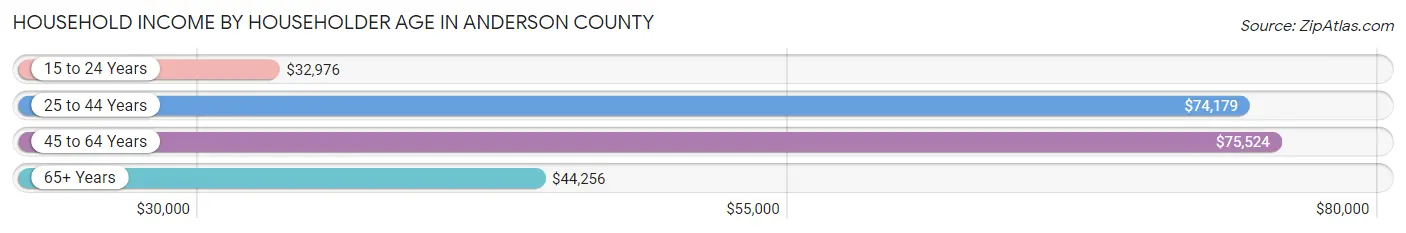
Household Income by Householder Age in Anderson County
The median household income in Anderson County is $62,347, with the highest median household income of $75,524 found in the 45 to 64 years age bracket for the primary householder. A total of 29,958 households (37.3%) fall into this category. Meanwhile, the 15 to 24 years age bracket for the primary householder has the lowest median household income of $32,976, with 2,950 households (3.7%) in this group.
| Income Bracket | # Households | Median Income |
| 15 to 24 Years | 2,950 (3.7%) | $32,976 |
| 25 to 44 Years | 23,985 (29.9%) | $74,179 |
| 45 to 64 Years | 29,958 (37.3%) | $75,524 |
| 65+ Years | 23,408 (29.1%) | $44,256 |
| Total | 80,301 (100.0%) | $62,347 |
Poverty in Anderson County
Income Below Poverty by Sex and Age in Anderson County
With 12.9% poverty level for males and 15.5% for females among the residents of Anderson County, 6 to 11 year old males and 18 to 24 year old females are the most vulnerable to poverty, with 2,016 males (24.3%) and 2,111 females (25.3%) in their respective age groups living below the poverty level.
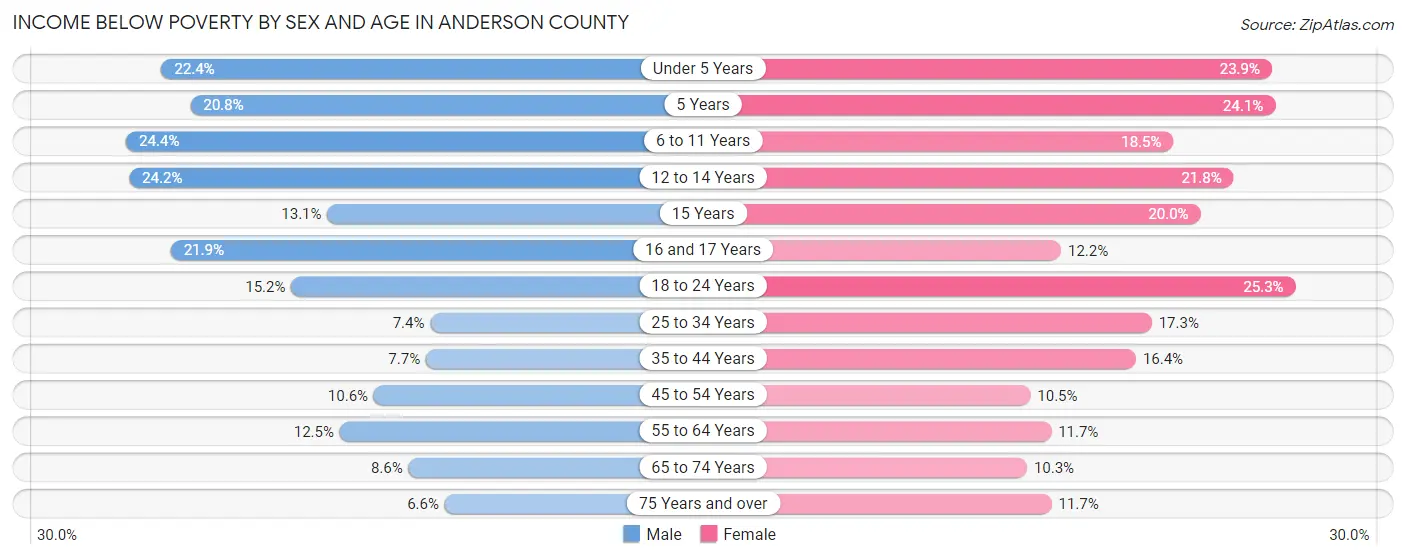
| Age Bracket | Male | Female |
| Under 5 Years | 1,317 (22.4%) | 1,304 (23.9%) |
| 5 Years | 227 (20.8%) | 299 (24.1%) |
| 6 to 11 Years | 2,016 (24.3%) | 1,454 (18.5%) |
| 12 to 14 Years | 960 (24.2%) | 805 (21.8%) |
| 15 Years | 185 (13.1%) | 316 (20.0%) |
| 16 and 17 Years | 605 (21.9%) | 300 (12.2%) |
| 18 to 24 Years | 1,257 (15.1%) | 2,111 (25.3%) |
| 25 to 34 Years | 885 (7.4%) | 2,177 (17.3%) |
| 35 to 44 Years | 906 (7.6%) | 2,107 (16.4%) |
| 45 to 54 Years | 1,372 (10.5%) | 1,399 (10.5%) |
| 55 to 64 Years | 1,657 (12.4%) | 1,657 (11.7%) |
| 65 to 74 Years | 880 (8.6%) | 1,196 (10.3%) |
| 75 Years and over | 378 (6.6%) | 1,000 (11.7%) |
| Total | 12,645 (12.9%) | 16,125 (15.5%) |
Income Above Poverty by Sex and Age in Anderson County
According to the poverty statistics in Anderson County, males aged 75 years and over and females aged 65 to 74 years are the age groups that are most secure financially, with 93.4% of males and 89.7% of females in these age groups living above the poverty line.
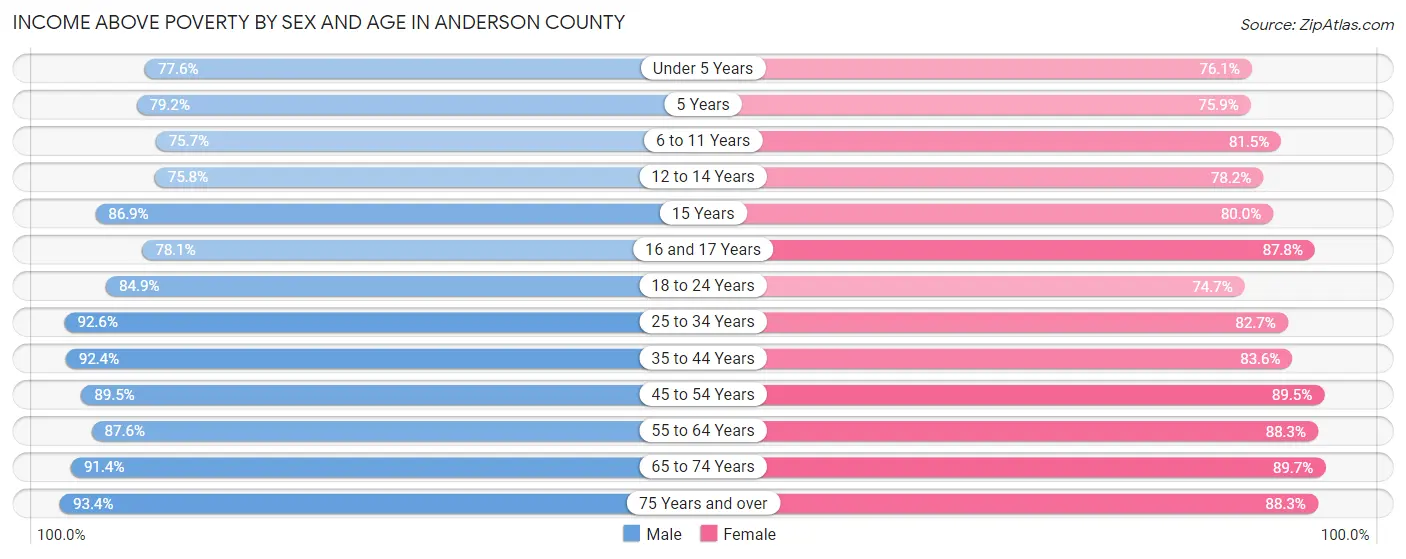
| Age Bracket | Male | Female |
| Under 5 Years | 4,568 (77.6%) | 4,142 (76.1%) |
| 5 Years | 866 (79.2%) | 940 (75.9%) |
| 6 to 11 Years | 6,262 (75.6%) | 6,424 (81.5%) |
| 12 to 14 Years | 3,010 (75.8%) | 2,886 (78.2%) |
| 15 Years | 1,223 (86.9%) | 1,266 (80.0%) |
| 16 and 17 Years | 2,163 (78.1%) | 2,157 (87.8%) |
| 18 to 24 Years | 7,041 (84.9%) | 6,246 (74.7%) |
| 25 to 34 Years | 11,062 (92.6%) | 10,434 (82.7%) |
| 35 to 44 Years | 10,941 (92.3%) | 10,759 (83.6%) |
| 45 to 54 Years | 11,636 (89.4%) | 11,927 (89.5%) |
| 55 to 64 Years | 11,656 (87.5%) | 12,548 (88.3%) |
| 65 to 74 Years | 9,333 (91.4%) | 10,401 (89.7%) |
| 75 Years and over | 5,346 (93.4%) | 7,562 (88.3%) |
| Total | 85,107 (87.1%) | 87,692 (84.5%) |
Income Below Poverty Among Married-Couple Families in Anderson County
The poverty statistics for married-couple families in Anderson County show that 5.5% or 2,279 of the total 41,404 families live below the poverty line. Families with 5 or more children have the highest poverty rate of 22.2%, comprising of 63 families. On the other hand, families with no children have the lowest poverty rate of 4.3%, which includes 1,134 families.
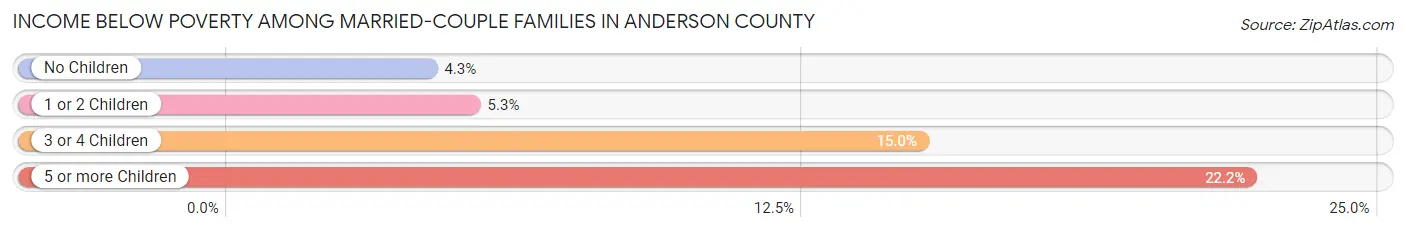
| Children | Above Poverty | Below Poverty |
| No Children | 24,976 (95.7%) | 1,134 (4.3%) |
| 1 or 2 Children | 11,400 (94.7%) | 635 (5.3%) |
| 3 or 4 Children | 2,528 (85.0%) | 447 (15.0%) |
| 5 or more Children | 221 (77.8%) | 63 (22.2%) |
| Total | 39,125 (94.5%) | 2,279 (5.5%) |
Income Below Poverty Among Single-Parent Households in Anderson County
According to the poverty data in Anderson County, 15.1% or 524 single-father households and 28.6% or 2,912 single-mother households are living below the poverty line. Among single-father households, those with 3 or 4 children have the highest poverty rate, with 280 households (78.2%) experiencing poverty. Likewise, among single-mother households, those with 5 or more children have the highest poverty rate, with 152 households (100.0%) falling below the poverty line.
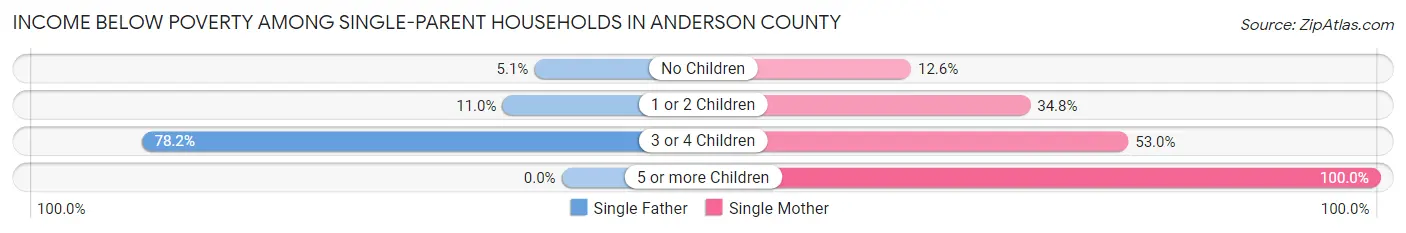
| Children | Single Father | Single Mother |
| No Children | 82 (5.1%) | 518 (12.6%) |
| 1 or 2 Children | 162 (11.0%) | 1,689 (34.8%) |
| 3 or 4 Children | 280 (78.2%) | 553 (53.0%) |
| 5 or more Children | 0 (0.0%) | 152 (100.0%) |
| Total | 524 (15.1%) | 2,912 (28.6%) |
Income Below Poverty Among Married-Couple vs Single-Parent Households in Anderson County
The poverty data for Anderson County shows that 2,279 of the married-couple family households (5.5%) and 3,436 of the single-parent households (25.2%) are living below the poverty level. Within the married-couple family households, those with 5 or more children have the highest poverty rate, with 63 households (22.2%) falling below the poverty line. Among the single-parent households, those with 5 or more children have the highest poverty rate, with 152 household (81.3%) living below poverty.
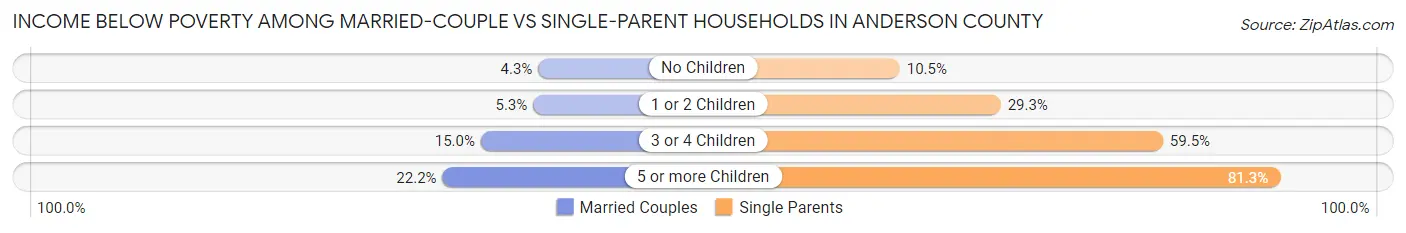
| Children | Married-Couple Families | Single-Parent Households |
| No Children | 1,134 (4.3%) | 600 (10.4%) |
| 1 or 2 Children | 635 (5.3%) | 1,851 (29.2%) |
| 3 or 4 Children | 447 (15.0%) | 833 (59.5%) |
| 5 or more Children | 63 (22.2%) | 152 (81.3%) |
| Total | 2,279 (5.5%) | 3,436 (25.2%) |
Race in Anderson County
The most populous races in Anderson County are White / Caucasian (159,828 | 78.1%), Black / African American (30,574 | 14.9%), and Two or more Races (8,855 | 4.3%).
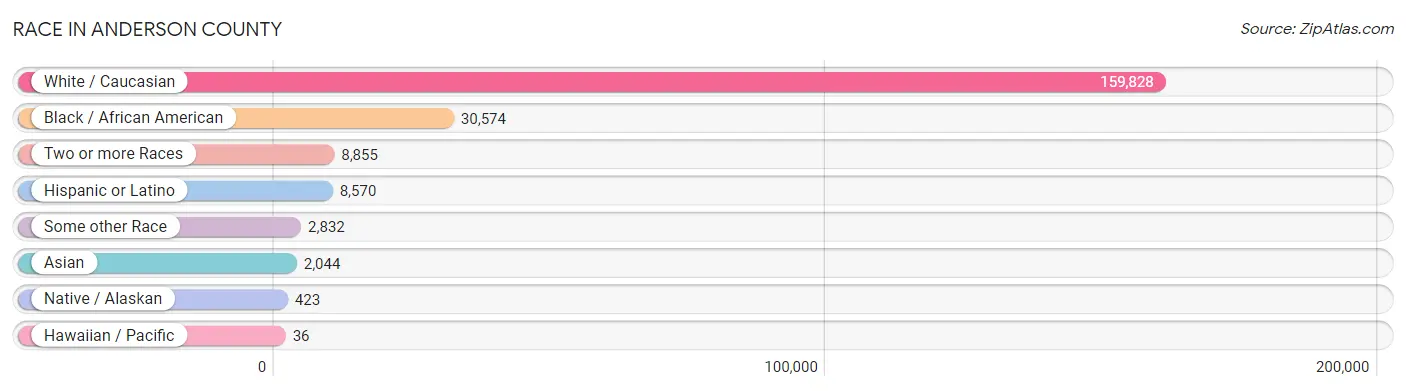
| Race | # Population | % Population |
| Asian | 2,044 | 1.0% |
| Black / African American | 30,574 | 14.9% |
| Hawaiian / Pacific | 36 | 0.0% |
| Hispanic or Latino | 8,570 | 4.2% |
| Native / Alaskan | 423 | 0.2% |
| White / Caucasian | 159,828 | 78.1% |
| Two or more Races | 8,855 | 4.3% |
| Some other Race | 2,832 | 1.4% |
| Total | 204,592 | 100.0% |
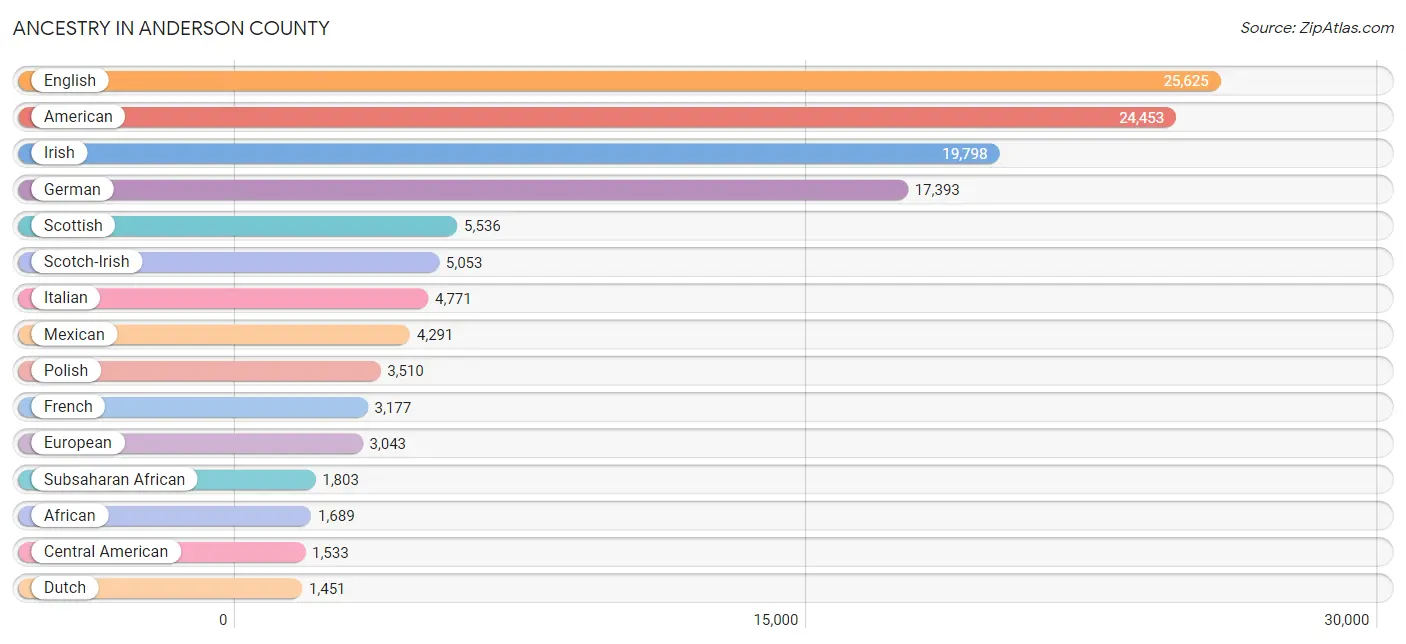
Ancestry in Anderson County
The most populous ancestries reported in Anderson County are English (25,625 | 12.5%), American (24,453 | 11.9%), Irish (19,798 | 9.7%), German (17,393 | 8.5%), and Scottish (5,536 | 2.7%), together accounting for 45.4% of all Anderson County residents.
| Ancestry | # Population | % Population |
| African | 1,689 | 0.8% |
| Alaskan Athabascan | 5 | 0.0% |
| Albanian | 21 | 0.0% |
| Aleut | 11 | 0.0% |
| American | 24,453 | 11.9% |
| Apache | 21 | 0.0% |
| Arab | 517 | 0.3% |
| Argentinean | 28 | 0.0% |
| Armenian | 105 | 0.1% |
| Australian | 36 | 0.0% |
| Austrian | 531 | 0.3% |
| Basque | 36 | 0.0% |
| Belgian | 61 | 0.0% |
| Belizean | 20 | 0.0% |
| Bhutanese | 235 | 0.1% |
| Blackfeet | 53 | 0.0% |
| Brazilian | 259 | 0.1% |
| British | 1,000 | 0.5% |
| Bulgarian | 31 | 0.0% |
| Burmese | 282 | 0.1% |
| Canadian | 187 | 0.1% |
| Central American | 1,533 | 0.7% |
| Central American Indian | 124 | 0.1% |
| Cherokee | 999 | 0.5% |
| Chickasaw | 3 | 0.0% |
| Chilean | 22 | 0.0% |
| Chippewa | 37 | 0.0% |
| Colombian | 559 | 0.3% |
| Costa Rican | 58 | 0.0% |
| Creek | 4 | 0.0% |
| Croatian | 99 | 0.1% |
| Crow | 3 | 0.0% |
| Cuban | 185 | 0.1% |
| Czech | 281 | 0.1% |
| Czechoslovakian | 58 | 0.0% |
| Danish | 102 | 0.1% |
| Dominican | 94 | 0.1% |
| Dutch | 1,451 | 0.7% |
| Dutch West Indian | 24 | 0.0% |
| Eastern European | 232 | 0.1% |
| Ecuadorian | 47 | 0.0% |
| Egyptian | 178 | 0.1% |
| English | 25,625 | 12.5% |
| Ethiopian | 77 | 0.0% |
| European | 3,043 | 1.5% |
| Filipino | 76 | 0.0% |
| Finnish | 204 | 0.1% |
| French | 3,177 | 1.5% |
| French American Indian | 70 | 0.0% |
| French Canadian | 783 | 0.4% |
| German | 17,393 | 8.5% |
| Greek | 373 | 0.2% |
| Guatemalan | 664 | 0.3% |
| Guyanese | 8 | 0.0% |
| Haitian | 201 | 0.1% |
| Honduran | 372 | 0.2% |
| Hungarian | 454 | 0.2% |
| Icelander | 3 | 0.0% |
| Indian (Asian) | 452 | 0.2% |
| Iranian | 53 | 0.0% |
| Irish | 19,798 | 9.7% |
| Iroquois | 36 | 0.0% |
| Israeli | 115 | 0.1% |
| Italian | 4,771 | 2.3% |
| Jamaican | 201 | 0.1% |
| Japanese | 15 | 0.0% |
| Jordanian | 25 | 0.0% |
| Korean | 389 | 0.2% |
| Laotian | 11 | 0.0% |
| Lebanese | 260 | 0.1% |
| Lithuanian | 76 | 0.0% |
| Lumbee | 30 | 0.0% |
| Macedonian | 23 | 0.0% |
| Malaysian | 9 | 0.0% |
| Mexican | 4,291 | 2.1% |
| Mexican American Indian | 30 | 0.0% |
| Native Hawaiian | 9 | 0.0% |
| Navajo | 1 | 0.0% |
| Nicaraguan | 31 | 0.0% |
| Nigerian | 26 | 0.0% |
| Northern European | 101 | 0.1% |
| Norwegian | 1,267 | 0.6% |
| Pakistani | 12 | 0.0% |
| Panamanian | 29 | 0.0% |
| Pennsylvania German | 19 | 0.0% |
| Peruvian | 46 | 0.0% |
| Polish | 3,510 | 1.7% |
| Portuguese | 214 | 0.1% |
| Puerto Rican | 832 | 0.4% |
| Romanian | 266 | 0.1% |
| Russian | 890 | 0.4% |
| Salvadoran | 379 | 0.2% |
| Samoan | 11 | 0.0% |
| Scandinavian | 385 | 0.2% |
| Scotch-Irish | 5,053 | 2.5% |
| Scottish | 5,536 | 2.7% |
| Seminole | 34 | 0.0% |
| Serbian | 106 | 0.1% |
| Sioux | 43 | 0.0% |
| Slavic | 48 | 0.0% |
| Slovak | 226 | 0.1% |
| South American | 834 | 0.4% |
| Spaniard | 202 | 0.1% |
| Spanish | 228 | 0.1% |
| Sri Lankan | 242 | 0.1% |
| Subsaharan African | 1,803 | 0.9% |
| Swedish | 1,095 | 0.5% |
| Swiss | 245 | 0.1% |
| Syrian | 20 | 0.0% |
| Thai | 969 | 0.5% |
| Trinidadian and Tobagonian | 14 | 0.0% |
| Turkish | 22 | 0.0% |
| Ukrainian | 702 | 0.3% |
| Venezuelan | 132 | 0.1% |
| Welsh | 1,037 | 0.5% |
| West Indian | 87 | 0.0% |
| Yugoslavian | 42 | 0.0% | View All 117 Rows |
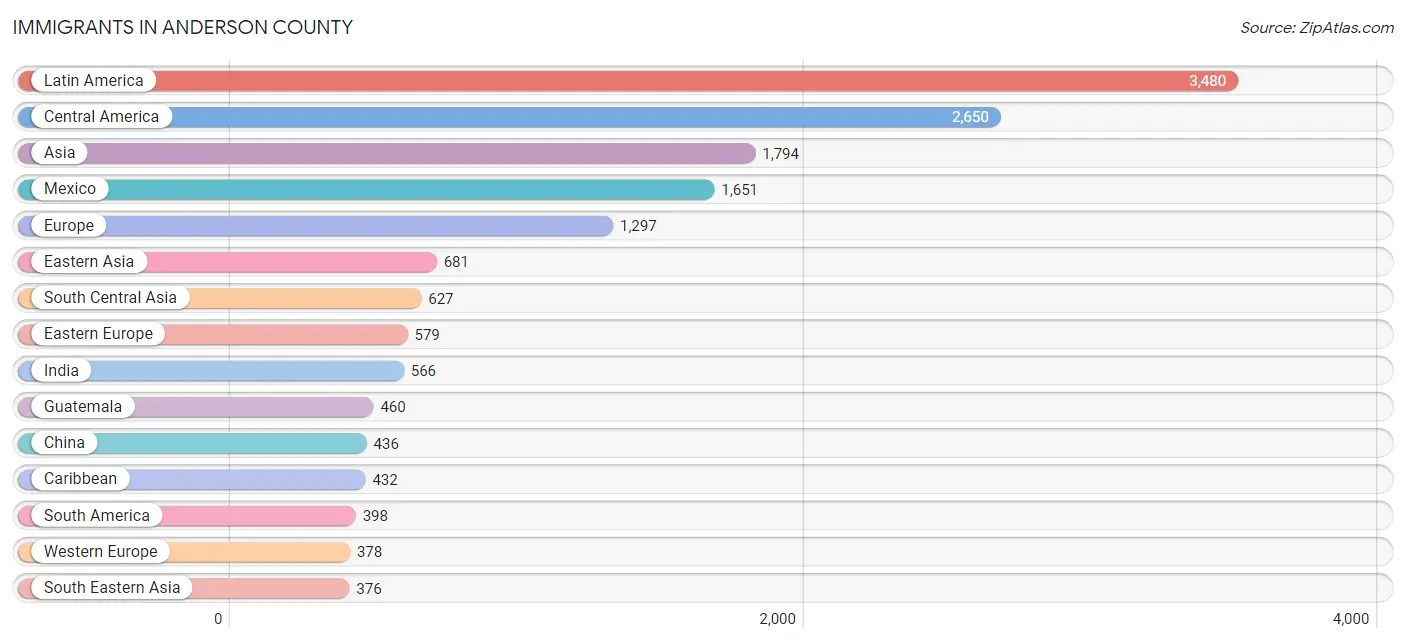
Immigrants in Anderson County
The most numerous immigrant groups reported in Anderson County came from Latin America (3,480 | 1.7%), Central America (2,650 | 1.3%), Asia (1,794 | 0.9%), Mexico (1,651 | 0.8%), and Europe (1,297 | 0.6%), together accounting for 5.3% of all Anderson County residents.
| Immigration Origin | # Population | % Population |
| Africa | 282 | 0.1% |
| Argentina | 28 | 0.0% |
| Asia | 1,794 | 0.9% |
| Australia | 49 | 0.0% |
| Bosnia and Herzegovina | 15 | 0.0% |
| Brazil | 155 | 0.1% |
| Bulgaria | 35 | 0.0% |
| Cameroon | 69 | 0.0% |
| Canada | 346 | 0.2% |
| Caribbean | 432 | 0.2% |
| Central America | 2,650 | 1.3% |
| China | 436 | 0.2% |
| Colombia | 145 | 0.1% |
| Costa Rica | 38 | 0.0% |
| Croatia | 27 | 0.0% |
| Cuba | 49 | 0.0% |
| Czechoslovakia | 24 | 0.0% |
| Dominican Republic | 71 | 0.0% |
| Eastern Africa | 30 | 0.0% |
| Eastern Asia | 681 | 0.3% |
| Eastern Europe | 579 | 0.3% |
| Ecuador | 41 | 0.0% |
| Egypt | 142 | 0.1% |
| El Salvador | 202 | 0.1% |
| England | 110 | 0.1% |
| Ethiopia | 10 | 0.0% |
| Europe | 1,297 | 0.6% |
| Germany | 372 | 0.2% |
| Greece | 47 | 0.0% |
| Guatemala | 460 | 0.2% |
| Guyana | 8 | 0.0% |
| Haiti | 116 | 0.1% |
| Honduras | 257 | 0.1% |
| Hong Kong | 73 | 0.0% |
| Hungary | 6 | 0.0% |
| India | 566 | 0.3% |
| Iran | 34 | 0.0% |
| Ireland | 38 | 0.0% |
| Jamaica | 117 | 0.1% |
| Japan | 51 | 0.0% |
| Jordan | 25 | 0.0% |
| Kenya | 20 | 0.0% |
| Korea | 194 | 0.1% |
| Latin America | 3,480 | 1.7% |
| Latvia | 14 | 0.0% |
| Lebanon | 43 | 0.0% |
| Mexico | 1,651 | 0.8% |
| Micronesia | 21 | 0.0% |
| Middle Africa | 69 | 0.0% |
| Moldova | 182 | 0.1% |
| Netherlands | 6 | 0.0% |
| Nicaragua | 31 | 0.0% |
| Northern Africa | 142 | 0.1% |
| Northern Europe | 260 | 0.1% |
| Norway | 16 | 0.0% |
| Oceania | 70 | 0.0% |
| Pakistan | 12 | 0.0% |
| Panama | 11 | 0.0% |
| Philippines | 282 | 0.1% |
| Poland | 15 | 0.0% |
| Romania | 11 | 0.0% |
| Russia | 91 | 0.0% |
| Serbia | 18 | 0.0% |
| South America | 398 | 0.2% |
| South Central Asia | 627 | 0.3% |
| South Eastern Asia | 376 | 0.2% |
| Southern Europe | 80 | 0.0% |
| Spain | 33 | 0.0% |
| Syria | 20 | 0.0% |
| Taiwan | 76 | 0.0% |
| Trinidad and Tobago | 79 | 0.0% |
| Turkey | 22 | 0.0% |
| Ukraine | 141 | 0.1% |
| Uzbekistan | 15 | 0.0% |
| Venezuela | 21 | 0.0% |
| Vietnam | 94 | 0.1% |
| Western Africa | 4 | 0.0% |
| Western Asia | 110 | 0.1% |
| Western Europe | 378 | 0.2% | View All 79 Rows |
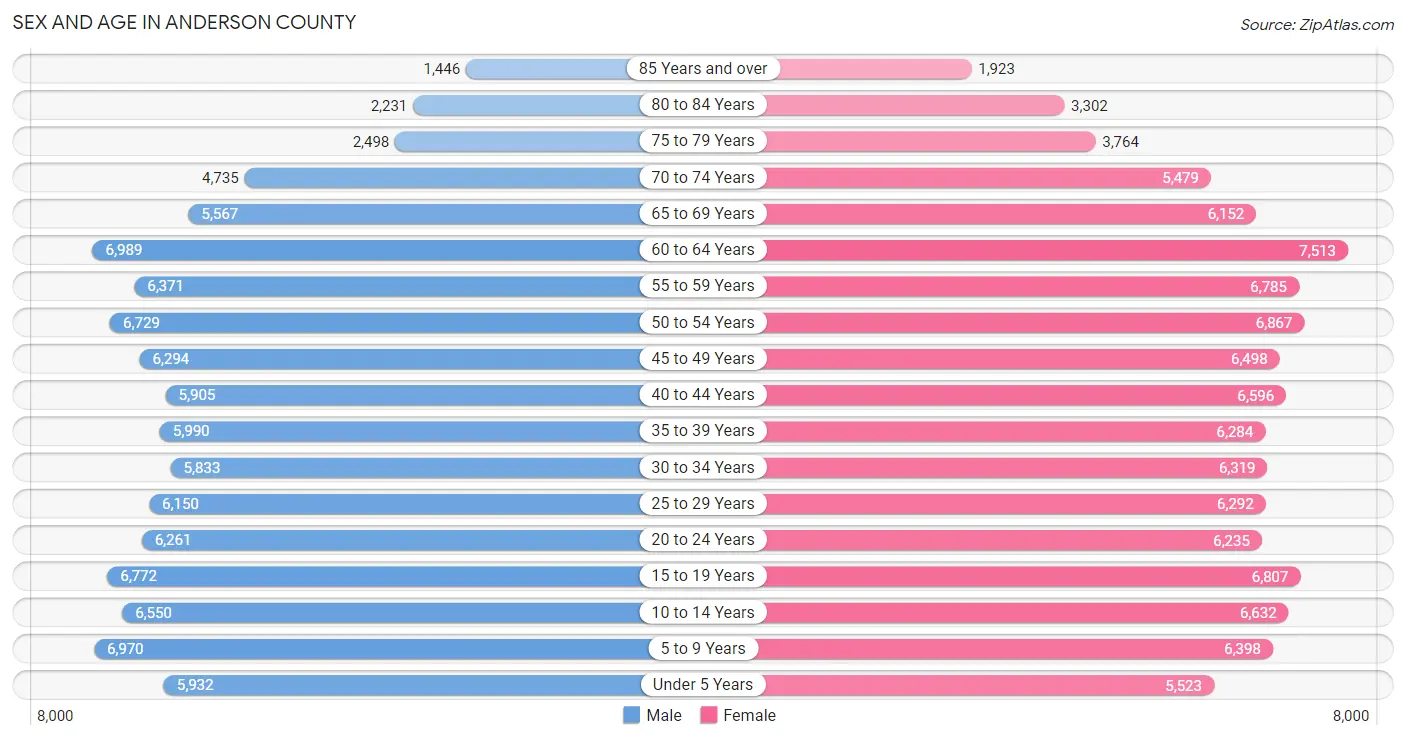
Sex and Age in Anderson County
Sex and Age in Anderson County
The most populous age groups in Anderson County are 60 to 64 Years (6,989 | 7.0%) for men and 60 to 64 Years (7,513 | 7.1%) for women.
| Age Bracket | Male | Female |
| Under 5 Years | 5,932 (6.0%) | 5,523 (5.2%) |
| 5 to 9 Years | 6,970 (7.0%) | 6,398 (6.1%) |
| 10 to 14 Years | 6,550 (6.6%) | 6,632 (6.3%) |
| 15 to 19 Years | 6,772 (6.8%) | 6,807 (6.5%) |
| 20 to 24 Years | 6,261 (6.3%) | 6,235 (5.9%) |
| 25 to 29 Years | 6,150 (6.2%) | 6,292 (6.0%) |
| 30 to 34 Years | 5,833 (5.9%) | 6,319 (6.0%) |
| 35 to 39 Years | 5,990 (6.0%) | 6,284 (6.0%) |
| 40 to 44 Years | 5,905 (5.9%) | 6,596 (6.3%) |
| 45 to 49 Years | 6,294 (6.3%) | 6,498 (6.2%) |
| 50 to 54 Years | 6,729 (6.8%) | 6,867 (6.5%) |
| 55 to 59 Years | 6,371 (6.4%) | 6,785 (6.4%) |
| 60 to 64 Years | 6,989 (7.0%) | 7,513 (7.1%) |
| 65 to 69 Years | 5,567 (5.6%) | 6,152 (5.8%) |
| 70 to 74 Years | 4,735 (4.8%) | 5,479 (5.2%) |
| 75 to 79 Years | 2,498 (2.5%) | 3,764 (3.6%) |
| 80 to 84 Years | 2,231 (2.2%) | 3,302 (3.1%) |
| 85 Years and over | 1,446 (1.5%) | 1,923 (1.8%) |
| Total | 99,223 (100.0%) | 105,369 (100.0%) |
Families and Households in Anderson County
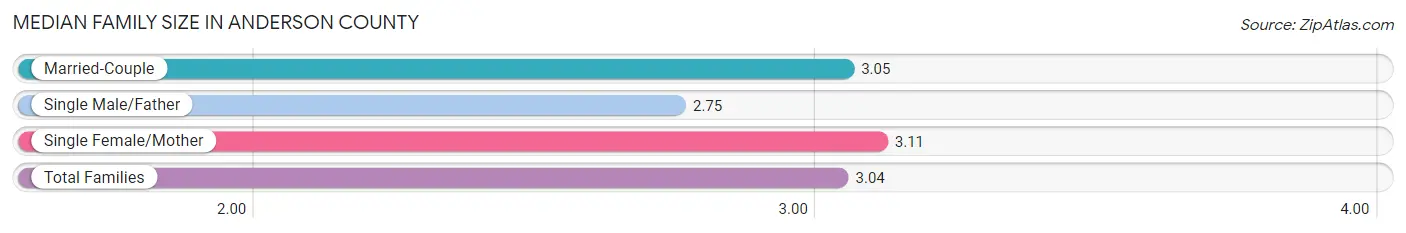
Median Family Size in Anderson County
The median family size in Anderson County is 3.04 persons per family, with single female/mother families (10,183 | 18.5%) accounting for the largest median family size of 3.11 persons per family. On the other hand, single male/father families (3,478 | 6.3%) represent the smallest median family size with 2.75 persons per family.
| Family Type | # Families | Family Size |
| Married-Couple | 41,404 (75.2%) | 3.05 |
| Single Male/Father | 3,478 (6.3%) | 2.75 |
| Single Female/Mother | 10,183 (18.5%) | 3.11 |
| Total Families | 55,065 (100.0%) | 3.04 |
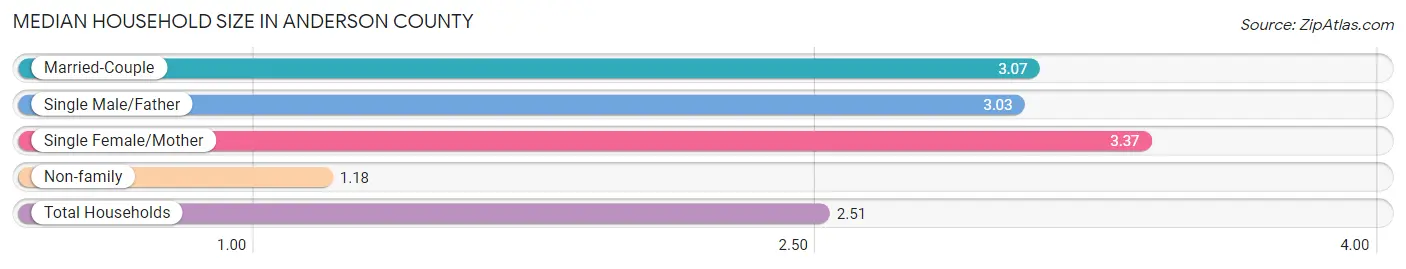
Median Household Size in Anderson County
The median household size in Anderson County is 2.51 persons per household, with single female/mother households (10,183 | 12.7%) accounting for the largest median household size of 3.37 persons per household. non-family households (25,236 | 31.4%) represent the smallest median household size with 1.18 persons per household.
| Household Type | # Households | Household Size |
| Married-Couple | 41,404 (51.6%) | 3.07 |
| Single Male/Father | 3,478 (4.3%) | 3.03 |
| Single Female/Mother | 10,183 (12.7%) | 3.37 |
| Non-family | 25,236 (31.4%) | 1.18 |
| Total Households | 80,301 (100.0%) | 2.51 |
Household Size by Marriage Status in Anderson County
Out of a total of 80,301 households in Anderson County, 55,065 (68.6%) are family households, while 25,236 (31.4%) are nonfamily households. The most numerous type of family households are 2-person households, comprising 26,246, and the most common type of nonfamily households are 1-person households, comprising 21,777.
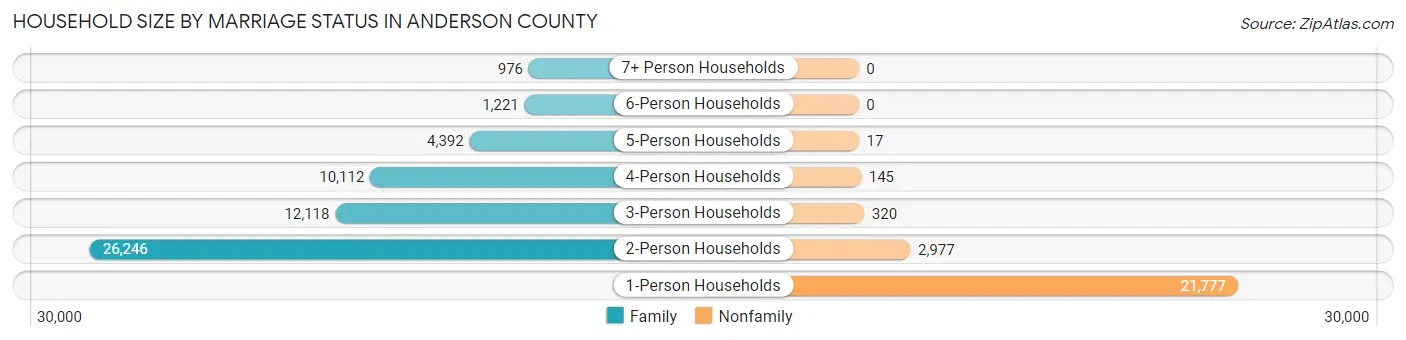
| Household Size | Family Households | Nonfamily Households |
| 1-Person Households | - | 21,777 (27.1%) |
| 2-Person Households | 26,246 (32.7%) | 2,977 (3.7%) |
| 3-Person Households | 12,118 (15.1%) | 320 (0.4%) |
| 4-Person Households | 10,112 (12.6%) | 145 (0.2%) |
| 5-Person Households | 4,392 (5.5%) | 17 (0.0%) |
| 6-Person Households | 1,221 (1.5%) | 0 (0.0%) |
| 7+ Person Households | 976 (1.2%) | 0 (0.0%) |
| Total | 55,065 (68.6%) | 25,236 (31.4%) |
Female Fertility in Anderson County
Fertility by Age in Anderson County
Average fertility rate in Anderson County is 68.0 births per 1,000 women. Women in the age bracket of 20 to 34 years have the highest fertility rate with 127.0 births per 1,000 women. Women in the age bracket of 20 to 34 years acount for 76.4% of all women with births.
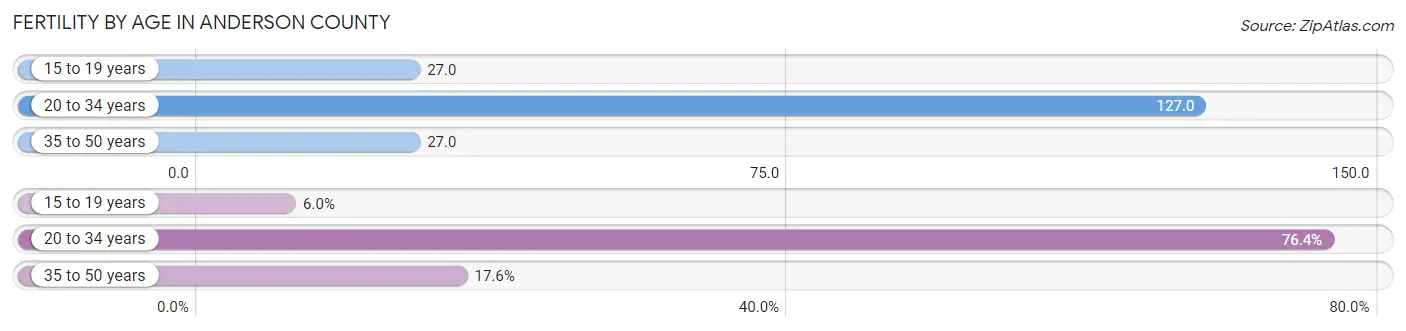
| Age Bracket | Women with Births | Births / 1,000 Women |
| 15 to 19 years | 187 (6.0%) | 27.0 |
| 20 to 34 years | 2,391 (76.4%) | 127.0 |
| 35 to 50 years | 551 (17.6%) | 27.0 |
| Total | 3,129 (100.0%) | 68.0 |
Fertility by Age by Marriage Status in Anderson County
59.1% of women with births (3,129) in Anderson County are married. The highest percentage of unmarried women with births falls into 15 to 19 years age bracket with 100.0% of them unmarried at the time of birth, while the lowest percentage of unmarried women with births belong to 35 to 50 years age bracket with 28.7% of them unmarried.
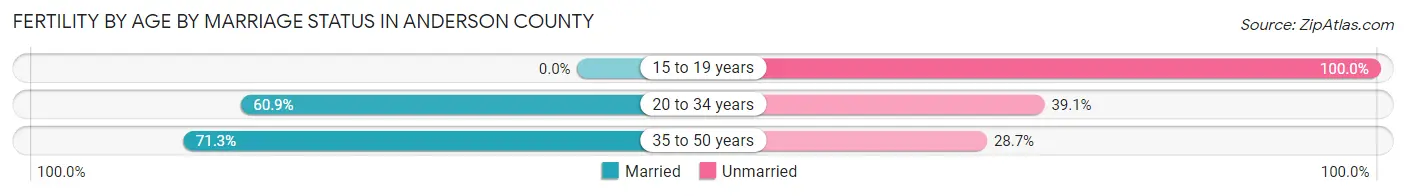
| Age Bracket | Married | Unmarried |
| 15 to 19 years | 0 (0.0%) | 187 (100.0%) |
| 20 to 34 years | 1,456 (60.9%) | 935 (39.1%) |
| 35 to 50 years | 393 (71.3%) | 158 (28.7%) |
| Total | 1,849 (59.1%) | 1,280 (40.9%) |
Fertility by Education in Anderson County
Average fertility rate in Anderson County is 68.0 births per 1,000 women. Women with the education attainment of bachelor's degree have the highest fertility rate of 87.0 births per 1,000 women, while women with the education attainment of less than high school have the lowest fertility at 48.0 births per 1,000 women. Women with the education attainment of college or associate's degree represent 28.8% of all women with births.
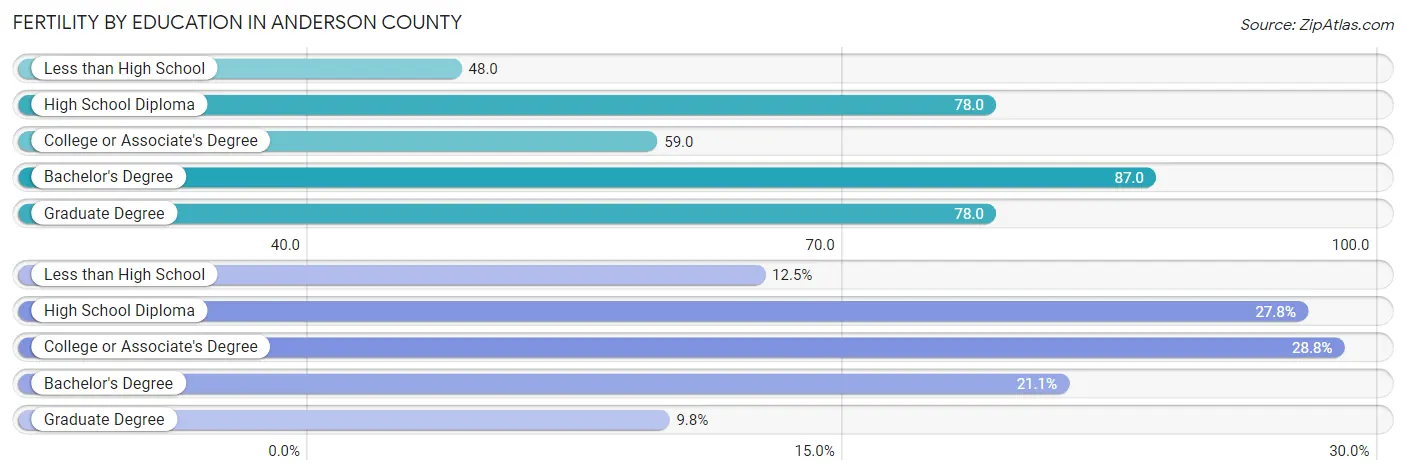
| Educational Attainment | Women with Births | Births / 1,000 Women |
| Less than High School | 392 (12.5%) | 48.0 |
| High School Diploma | 869 (27.8%) | 78.0 |
| College or Associate's Degree | 901 (28.8%) | 59.0 |
| Bachelor's Degree | 659 (21.1%) | 87.0 |
| Graduate Degree | 308 (9.8%) | 78.0 |
| Total | 3,129 (100.0%) | 68.0 |
Fertility by Education by Marriage Status in Anderson County
40.9% of women with births in Anderson County are unmarried. Women with the educational attainment of graduate degree are most likely to be married with 100.0% of them married at childbirth, while women with the educational attainment of less than high school are least likely to be married with 82.1% of them unmarried at childbirth.
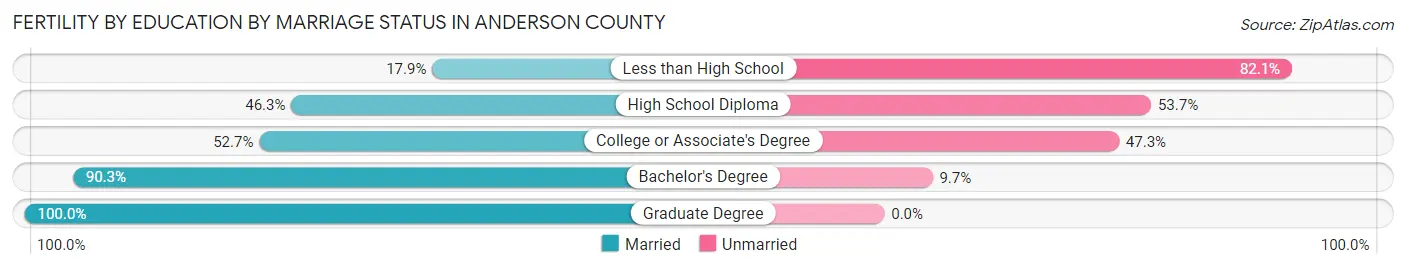
| Educational Attainment | Married | Unmarried |
| Less than High School | 70 (17.9%) | 322 (82.1%) |
| High School Diploma | 402 (46.3%) | 467 (53.7%) |
| College or Associate's Degree | 475 (52.7%) | 426 (47.3%) |
| Bachelor's Degree | 595 (90.3%) | 64 (9.7%) |
| Graduate Degree | 308 (100.0%) | 0 (0.0%) |
| Total | 1,849 (59.1%) | 1,280 (40.9%) |
Employment Characteristics in Anderson County
Employment by Class of Employer in Anderson County
Among the 91,484 employed individuals in Anderson County, private company employees (62,866 | 68.7%), not-for-profit organizations (7,639 | 8.4%), and state government employees (5,657 | 6.2%) make up the most common classes of employment.
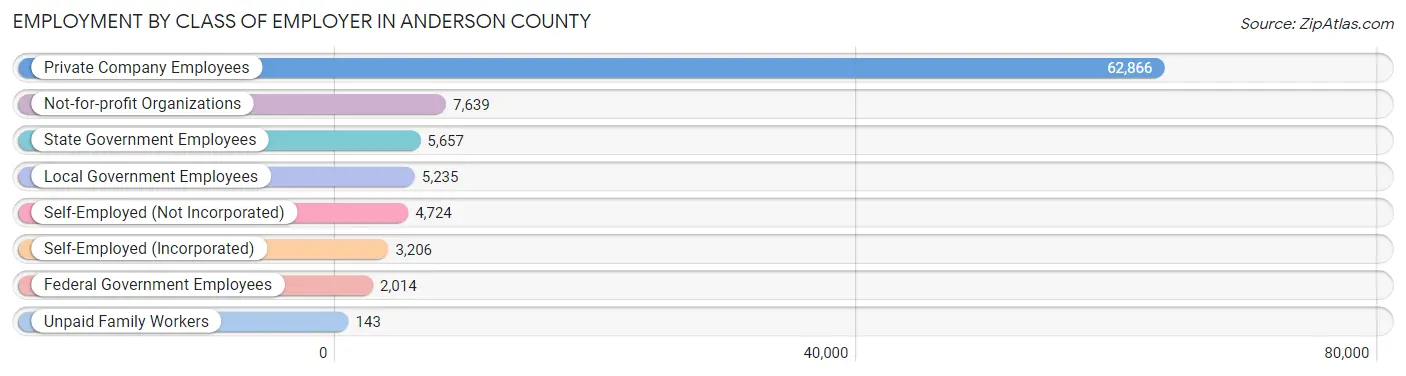
| Employer Class | # Employees | % Employees |
| Private Company Employees | 62,866 | 68.7% |
| Self-Employed (Incorporated) | 3,206 | 3.5% |
| Self-Employed (Not Incorporated) | 4,724 | 5.2% |
| Not-for-profit Organizations | 7,639 | 8.4% |
| Local Government Employees | 5,235 | 5.7% |
| State Government Employees | 5,657 | 6.2% |
| Federal Government Employees | 2,014 | 2.2% |
| Unpaid Family Workers | 143 | 0.2% |
| Total | 91,484 | 100.0% |
Employment Status by Age in Anderson County
According to the labor force statistics for Anderson County, out of the total population over 16 years of age (163,596), 60.3% or 98,648 individuals are in the labor force, with 5.5% or 5,426 of them unemployed. The age group with the highest labor force participation rate is 25 to 29 years, with 86.2% or 10,725 individuals in the labor force. Within the labor force, the 16 to 19 years age range has the highest percentage of unemployed individuals, with 17.3% or 767 of them being unemployed.
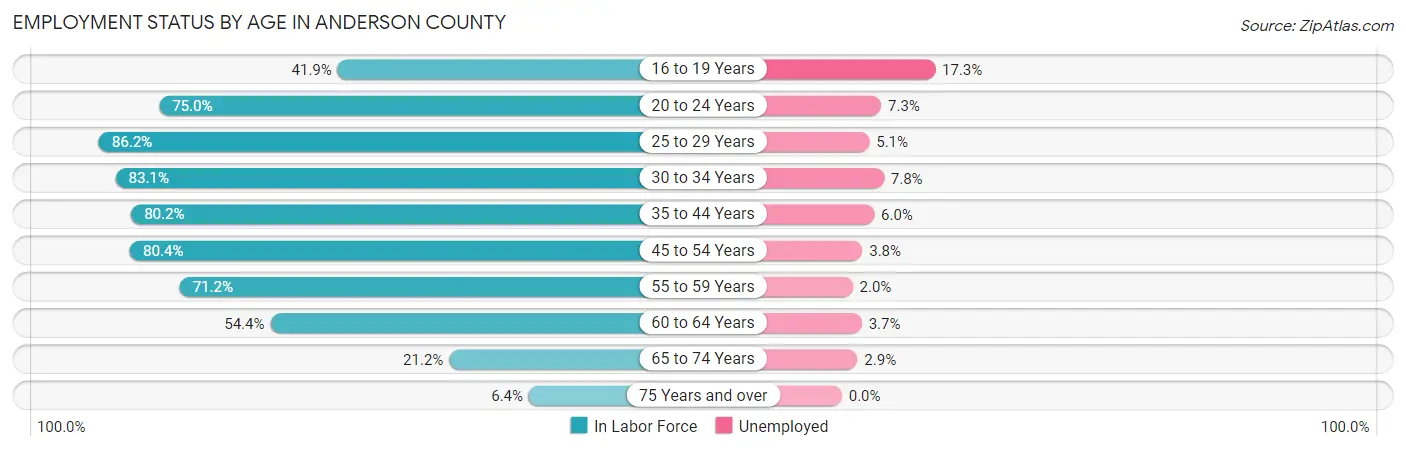
| Age Bracket | In Labor Force | Unemployed |
| 16 to 19 Years | 4,436 (41.9%) | 767 (17.3%) |
| 20 to 24 Years | 9,372 (75.0%) | 684 (7.3%) |
| 25 to 29 Years | 10,725 (86.2%) | 547 (5.1%) |
| 30 to 34 Years | 10,098 (83.1%) | 788 (7.8%) |
| 35 to 44 Years | 19,870 (80.2%) | 1,192 (6.0%) |
| 45 to 54 Years | 21,216 (80.4%) | 806 (3.8%) |
| 55 to 59 Years | 9,367 (71.2%) | 187 (2.0%) |
| 60 to 64 Years | 7,889 (54.4%) | 292 (3.7%) |
| 65 to 74 Years | 4,650 (21.2%) | 135 (2.9%) |
| 75 Years and over | 970 (6.4%) | 0 (0.0%) |
| Total | 98,648 (60.3%) | 5,426 (5.5%) |
Employment Status by Educational Attainment in Anderson County
According to labor force statistics for Anderson County, 76.5% of individuals (79,112) out of the total population between 25 and 64 years of age (103,415) are in the labor force, with 4.8% or 3,797 of them being unemployed. The group with the highest labor force participation rate are those with the educational attainment of bachelor's degree or higher, with 86.7% or 24,829 individuals in the labor force. Within the labor force, individuals with less than high school education have the highest percentage of unemployment, with 8.7% or 589 of them being unemployed.
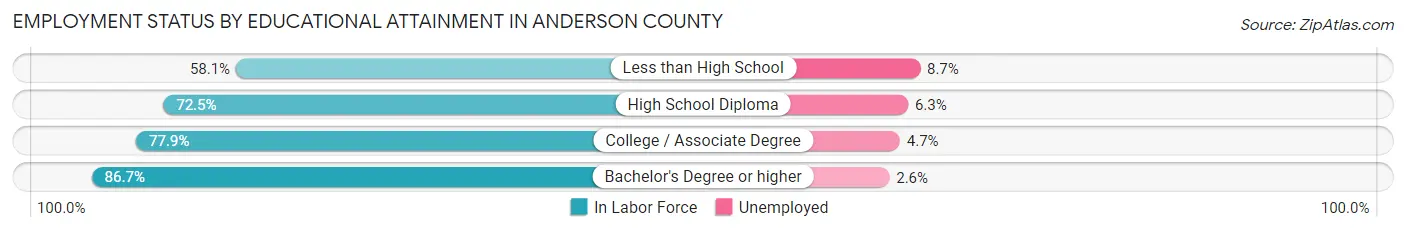
| Educational Attainment | In Labor Force | Unemployed |
| Less than High School | 6,774 (58.1%) | 1,014 (8.7%) |
| High School Diploma | 21,640 (72.5%) | 1,880 (6.3%) |
| College / Associate Degree | 25,917 (77.9%) | 1,564 (4.7%) |
| Bachelor's Degree or higher | 24,829 (86.7%) | 745 (2.6%) |
| Total | 79,112 (76.5%) | 4,964 (4.8%) |
Employment Occupations by Sex in Anderson County
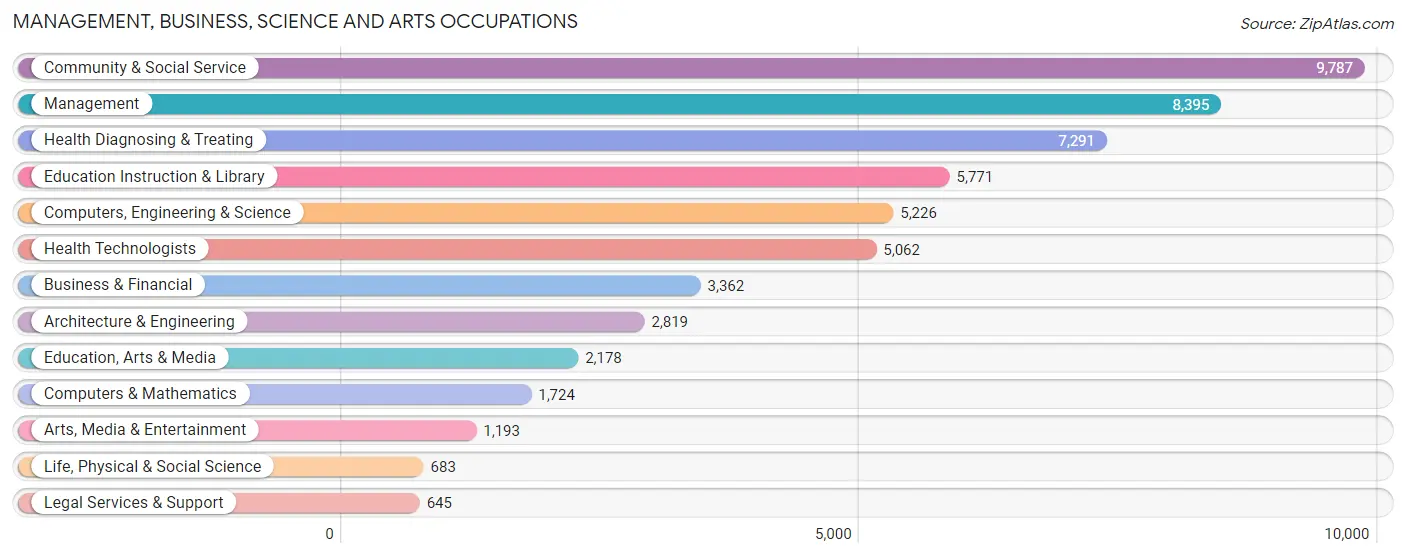
Management, Business, Science and Arts Occupations
The most common Management, Business, Science and Arts occupations in Anderson County are Community & Social Service (9,787 | 10.5%), Management (8,395 | 9.0%), Health Diagnosing & Treating (7,291 | 7.9%), Education Instruction & Library (5,771 | 6.2%), and Computers, Engineering & Science (5,226 | 5.6%).
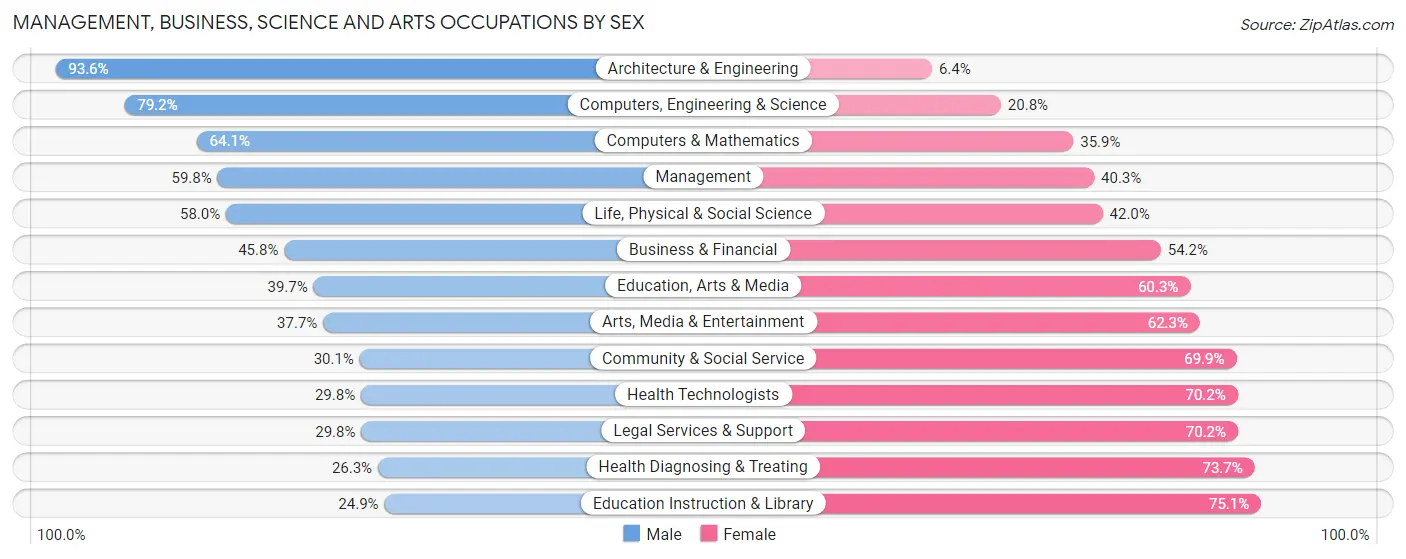
Management, Business, Science and Arts Occupations by Sex
Within the Management, Business, Science and Arts occupations in Anderson County, the most male-oriented occupations are Architecture & Engineering (93.6%), Computers, Engineering & Science (79.2%), and Computers & Mathematics (64.1%), while the most female-oriented occupations are Education Instruction & Library (75.1%), Health Diagnosing & Treating (73.7%), and Legal Services & Support (70.2%).
| Occupation | Male | Female |
| Management | 5,016 (59.8%) | 3,379 (40.3%) |
| Business & Financial | 1,541 (45.8%) | 1,821 (54.2%) |
| Computers, Engineering & Science | 4,139 (79.2%) | 1,087 (20.8%) |
| Computers & Mathematics | 1,105 (64.1%) | 619 (35.9%) |
| Architecture & Engineering | 2,638 (93.6%) | 181 (6.4%) |
| Life, Physical & Social Science | 396 (58.0%) | 287 (42.0%) |
| Community & Social Service | 2,946 (30.1%) | 6,841 (69.9%) |
| Education, Arts & Media | 865 (39.7%) | 1,313 (60.3%) |
| Legal Services & Support | 192 (29.8%) | 453 (70.2%) |
| Education Instruction & Library | 1,439 (24.9%) | 4,332 (75.1%) |
| Arts, Media & Entertainment | 450 (37.7%) | 743 (62.3%) |
| Health Diagnosing & Treating | 1,917 (26.3%) | 5,374 (73.7%) |
| Health Technologists | 1,510 (29.8%) | 3,552 (70.2%) |
| Total (Category) | 15,559 (45.7%) | 18,502 (54.3%) |
| Total (Overall) | 49,485 (53.3%) | 43,429 (46.7%) |
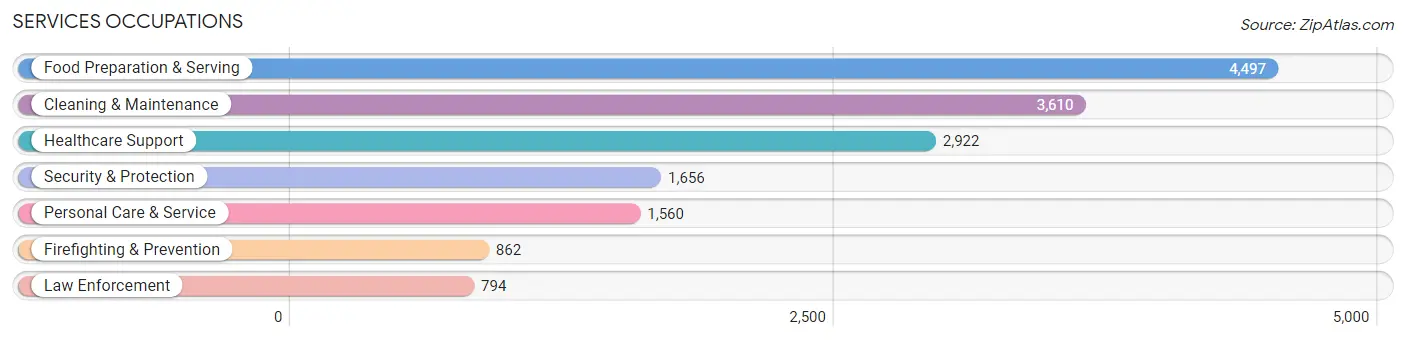
Services Occupations
The most common Services occupations in Anderson County are Food Preparation & Serving (4,497 | 4.8%), Cleaning & Maintenance (3,610 | 3.9%), Healthcare Support (2,922 | 3.1%), Security & Protection (1,656 | 1.8%), and Personal Care & Service (1,560 | 1.7%).
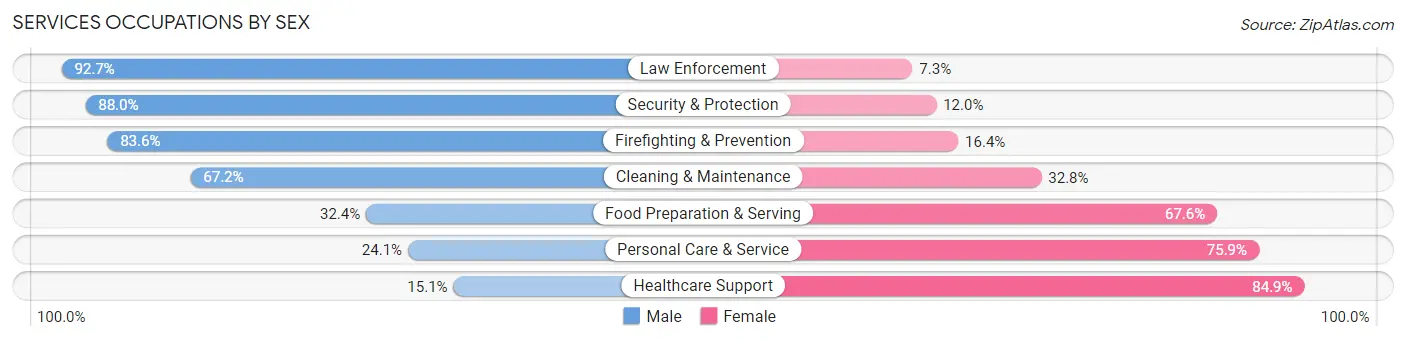
Services Occupations by Sex
Within the Services occupations in Anderson County, the most male-oriented occupations are Law Enforcement (92.7%), Security & Protection (88.0%), and Firefighting & Prevention (83.6%), while the most female-oriented occupations are Healthcare Support (84.9%), Personal Care & Service (75.9%), and Food Preparation & Serving (67.6%).
| Occupation | Male | Female |
| Healthcare Support | 441 (15.1%) | 2,481 (84.9%) |
| Security & Protection | 1,457 (88.0%) | 199 (12.0%) |
| Firefighting & Prevention | 721 (83.6%) | 141 (16.4%) |
| Law Enforcement | 736 (92.7%) | 58 (7.3%) |
| Food Preparation & Serving | 1,456 (32.4%) | 3,041 (67.6%) |
| Cleaning & Maintenance | 2,425 (67.2%) | 1,185 (32.8%) |
| Personal Care & Service | 376 (24.1%) | 1,184 (75.9%) |
| Total (Category) | 6,155 (43.2%) | 8,090 (56.8%) |
| Total (Overall) | 49,485 (53.3%) | 43,429 (46.7%) |
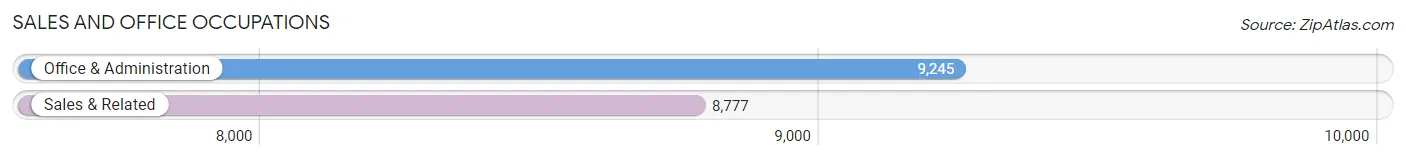
Sales and Office Occupations
The most common Sales and Office occupations in Anderson County are Office & Administration (9,245 | 10.0%), and Sales & Related (8,777 | 9.5%).
Sales and Office Occupations by Sex
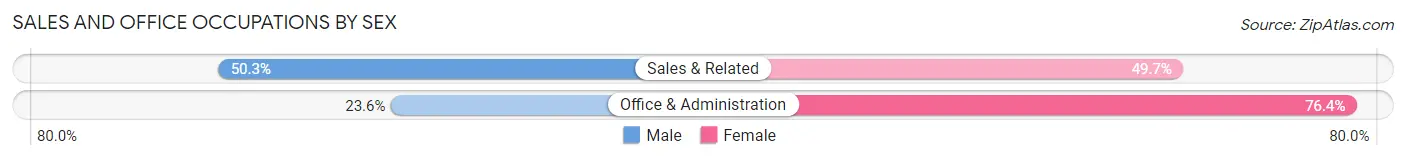
| Occupation | Male | Female |
| Sales & Related | 4,414 (50.3%) | 4,363 (49.7%) |
| Office & Administration | 2,181 (23.6%) | 7,064 (76.4%) |
| Total (Category) | 6,595 (36.6%) | 11,427 (63.4%) |
| Total (Overall) | 49,485 (53.3%) | 43,429 (46.7%) |
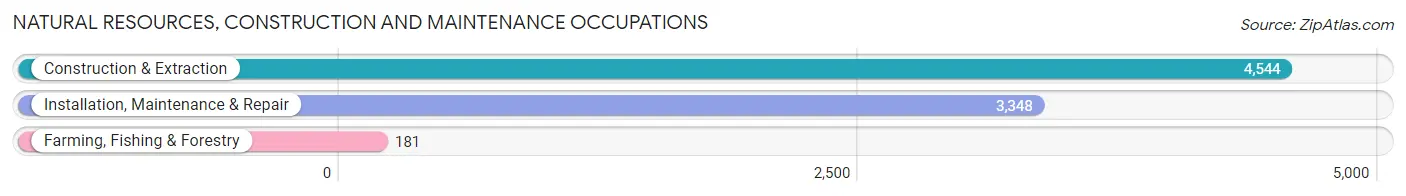
Natural Resources, Construction and Maintenance Occupations
The most common Natural Resources, Construction and Maintenance occupations in Anderson County are Construction & Extraction (4,544 | 4.9%), Installation, Maintenance & Repair (3,348 | 3.6%), and Farming, Fishing & Forestry (181 | 0.2%).
Natural Resources, Construction and Maintenance Occupations by Sex
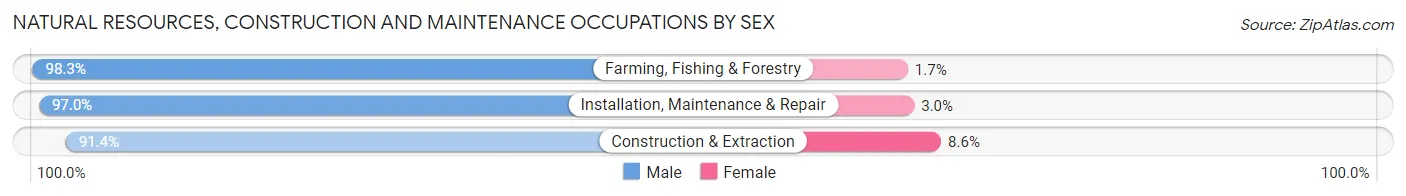
| Occupation | Male | Female |
| Farming, Fishing & Forestry | 178 (98.3%) | 3 (1.7%) |
| Construction & Extraction | 4,154 (91.4%) | 390 (8.6%) |
| Installation, Maintenance & Repair | 3,248 (97.0%) | 100 (3.0%) |
| Total (Category) | 7,580 (93.9%) | 493 (6.1%) |
| Total (Overall) | 49,485 (53.3%) | 43,429 (46.7%) |
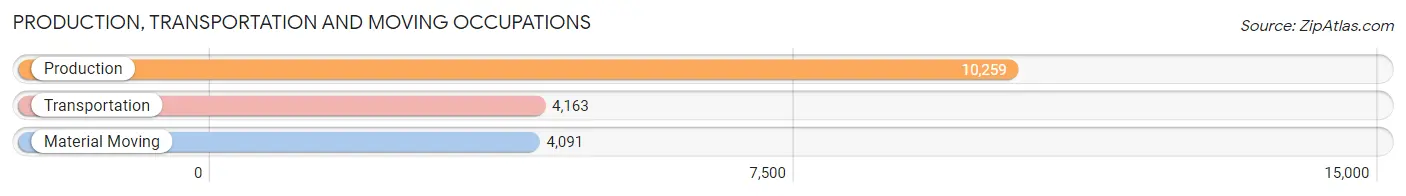
Production, Transportation and Moving Occupations
The most common Production, Transportation and Moving occupations in Anderson County are Production (10,259 | 11.0%), Transportation (4,163 | 4.5%), and Material Moving (4,091 | 4.4%).
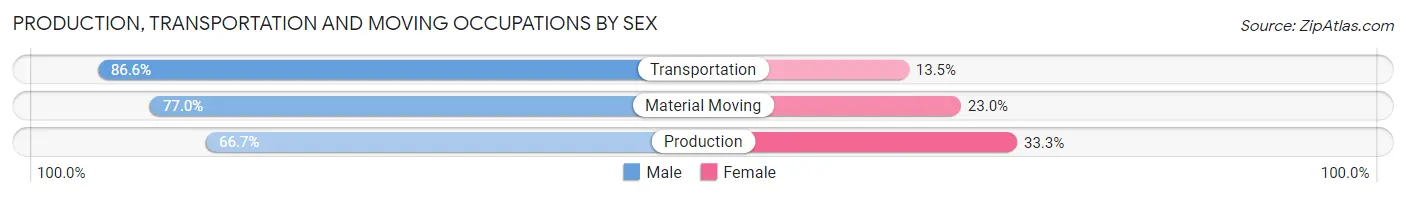
Production, Transportation and Moving Occupations by Sex
| Occupation | Male | Female |
| Production | 6,843 (66.7%) | 3,416 (33.3%) |
| Transportation | 3,603 (86.6%) | 560 (13.5%) |
| Material Moving | 3,150 (77.0%) | 941 (23.0%) |
| Total (Category) | 13,596 (73.4%) | 4,917 (26.6%) |
| Total (Overall) | 49,485 (53.3%) | 43,429 (46.7%) |
Employment Industries by Sex in Anderson County
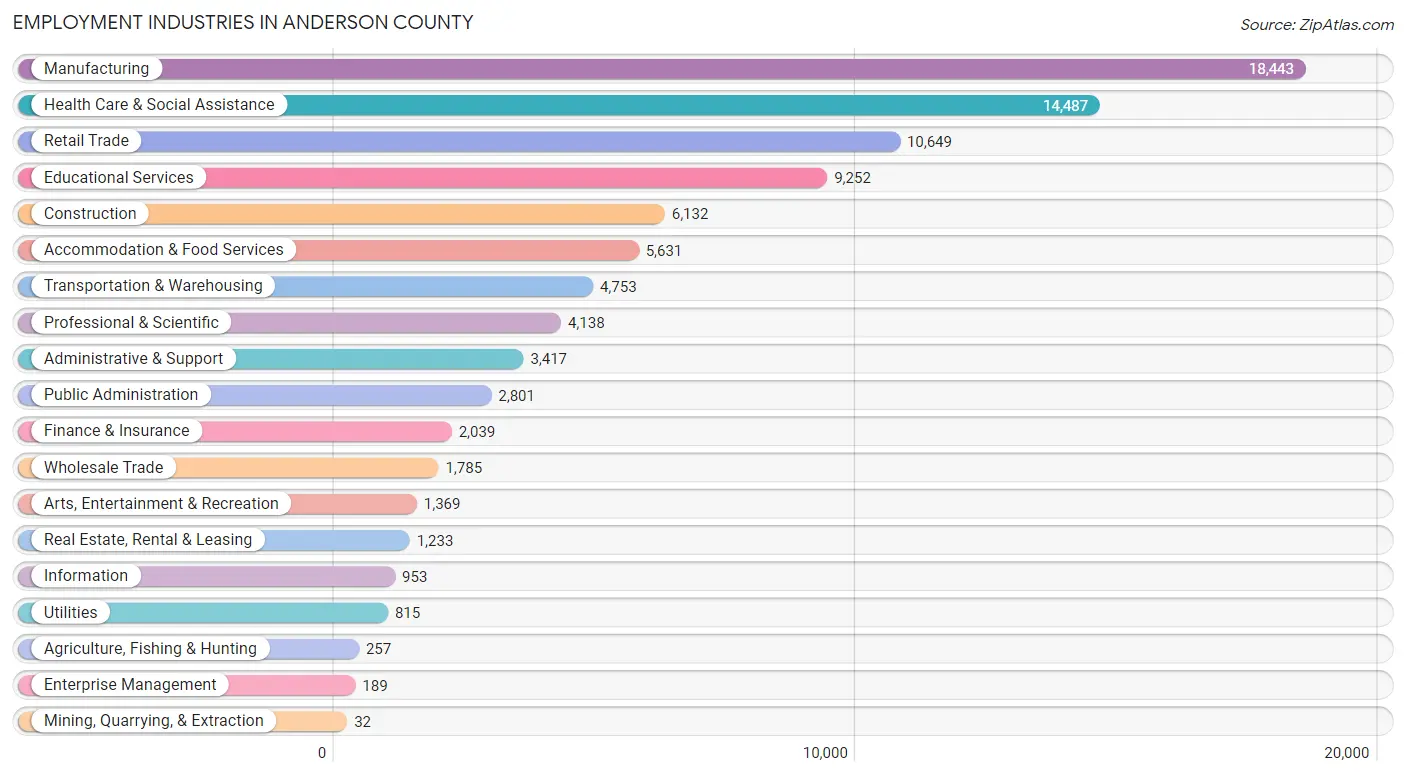
Employment Industries in Anderson County
The major employment industries in Anderson County include Manufacturing (18,443 | 19.9%), Health Care & Social Assistance (14,487 | 15.6%), Retail Trade (10,649 | 11.5%), Educational Services (9,252 | 10.0%), and Construction (6,132 | 6.6%).
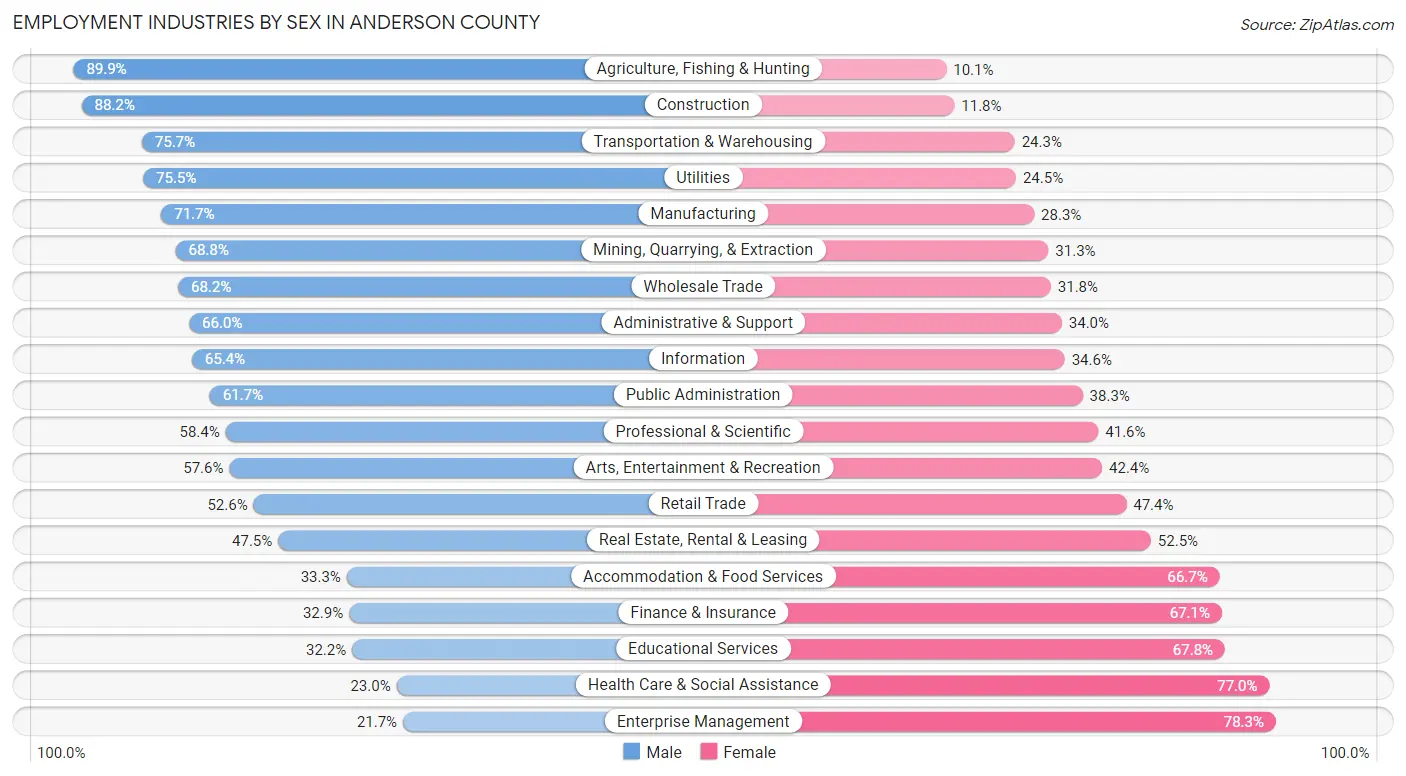
Employment Industries by Sex in Anderson County
The Anderson County industries that see more men than women are Agriculture, Fishing & Hunting (89.9%), Construction (88.2%), and Transportation & Warehousing (75.7%), whereas the industries that tend to have a higher number of women are Enterprise Management (78.3%), Health Care & Social Assistance (77.0%), and Educational Services (67.8%).
| Industry | Male | Female |
| Agriculture, Fishing & Hunting | 231 (89.9%) | 26 (10.1%) |
| Mining, Quarrying, & Extraction | 22 (68.8%) | 10 (31.2%) |
| Construction | 5,409 (88.2%) | 723 (11.8%) |
| Manufacturing | 13,224 (71.7%) | 5,219 (28.3%) |
| Wholesale Trade | 1,218 (68.2%) | 567 (31.8%) |
| Retail Trade | 5,603 (52.6%) | 5,046 (47.4%) |
| Transportation & Warehousing | 3,599 (75.7%) | 1,154 (24.3%) |
| Utilities | 615 (75.5%) | 200 (24.5%) |
| Information | 623 (65.4%) | 330 (34.6%) |
| Finance & Insurance | 670 (32.9%) | 1,369 (67.1%) |
| Real Estate, Rental & Leasing | 586 (47.5%) | 647 (52.5%) |
| Professional & Scientific | 2,417 (58.4%) | 1,721 (41.6%) |
| Enterprise Management | 41 (21.7%) | 148 (78.3%) |
| Administrative & Support | 2,254 (66.0%) | 1,163 (34.0%) |
| Educational Services | 2,981 (32.2%) | 6,271 (67.8%) |
| Health Care & Social Assistance | 3,336 (23.0%) | 11,151 (77.0%) |
| Arts, Entertainment & Recreation | 789 (57.6%) | 580 (42.4%) |
| Accommodation & Food Services | 1,877 (33.3%) | 3,754 (66.7%) |
| Public Administration | 1,727 (61.7%) | 1,074 (38.3%) |
| Total | 49,485 (53.3%) | 43,429 (46.7%) |
Education in Anderson County
School Enrollment in Anderson County
The most common levels of schooling among the 46,901 students in Anderson County are elementary school (10,919 | 23.3%), high school (10,637 | 22.7%), and middle school (9,768 | 20.8%).
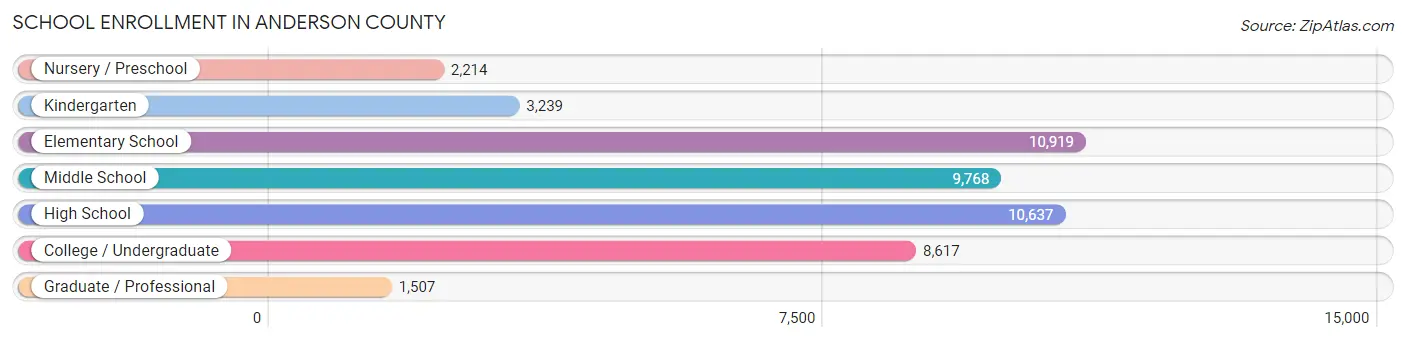
| School Level | # Students | % Students |
| Nursery / Preschool | 2,214 | 4.7% |
| Kindergarten | 3,239 | 6.9% |
| Elementary School | 10,919 | 23.3% |
| Middle School | 9,768 | 20.8% |
| High School | 10,637 | 22.7% |
| College / Undergraduate | 8,617 | 18.4% |
| Graduate / Professional | 1,507 | 3.2% |
| Total | 46,901 | 100.0% |
School Enrollment by Age by Funding Source in Anderson County
Out of a total of 46,901 students who are enrolled in schools in Anderson County, 8,770 (18.7%) attend a private institution, while the remaining 38,131 (81.3%) are enrolled in public schools. The age group of 3 to 4 year olds has the highest likelihood of being enrolled in private schools, with 1,107 (55.6% in the age bracket) enrolled. Conversely, the age group of 15 to 17 year olds has the lowest likelihood of being enrolled in a private school, with 6,968 (89.1% in the age bracket) attending a public institution.
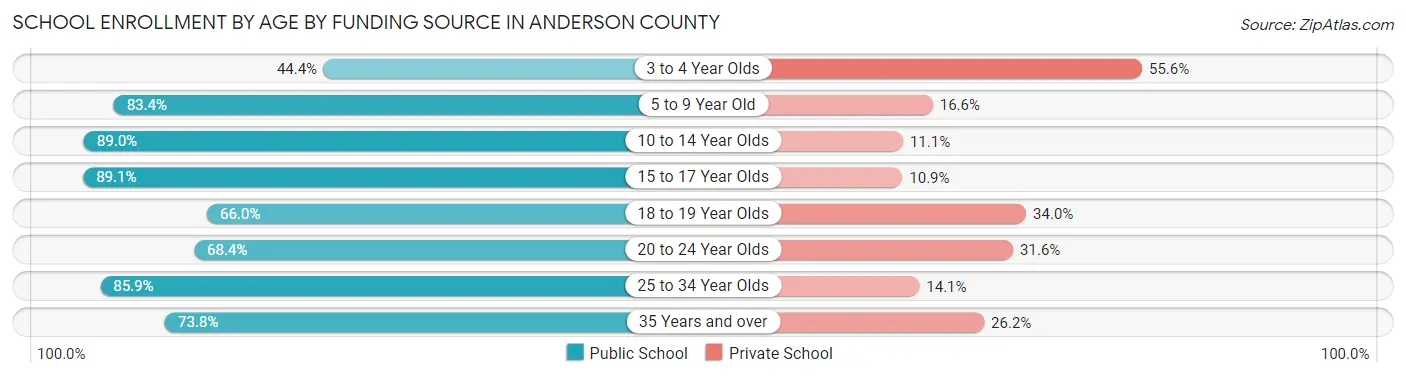
| Age Bracket | Public School | Private School |
| 3 to 4 Year Olds | 885 (44.4%) | 1,107 (55.6%) |
| 5 to 9 Year Old | 10,534 (83.4%) | 2,097 (16.6%) |
| 10 to 14 Year Olds | 11,554 (88.9%) | 1,435 (11.1%) |
| 15 to 17 Year Olds | 6,968 (89.1%) | 855 (10.9%) |
| 18 to 19 Year Olds | 2,076 (66.0%) | 1,069 (34.0%) |
| 20 to 24 Year Olds | 3,099 (68.4%) | 1,430 (31.6%) |
| 25 to 34 Year Olds | 1,511 (85.9%) | 248 (14.1%) |
| 35 Years and over | 1,501 (73.8%) | 532 (26.2%) |
| Total | 38,131 (81.3%) | 8,770 (18.7%) |
Educational Attainment by Field of Study in Anderson County
Business (9,192 | 23.5%), education (5,618 | 14.3%), science & technology (4,313 | 11.0%), engineering (2,999 | 7.6%), and bio, nature & agricultural (2,641 | 6.7%) are the most common fields of study among 39,180 individuals in Anderson County who have obtained a bachelor's degree or higher.
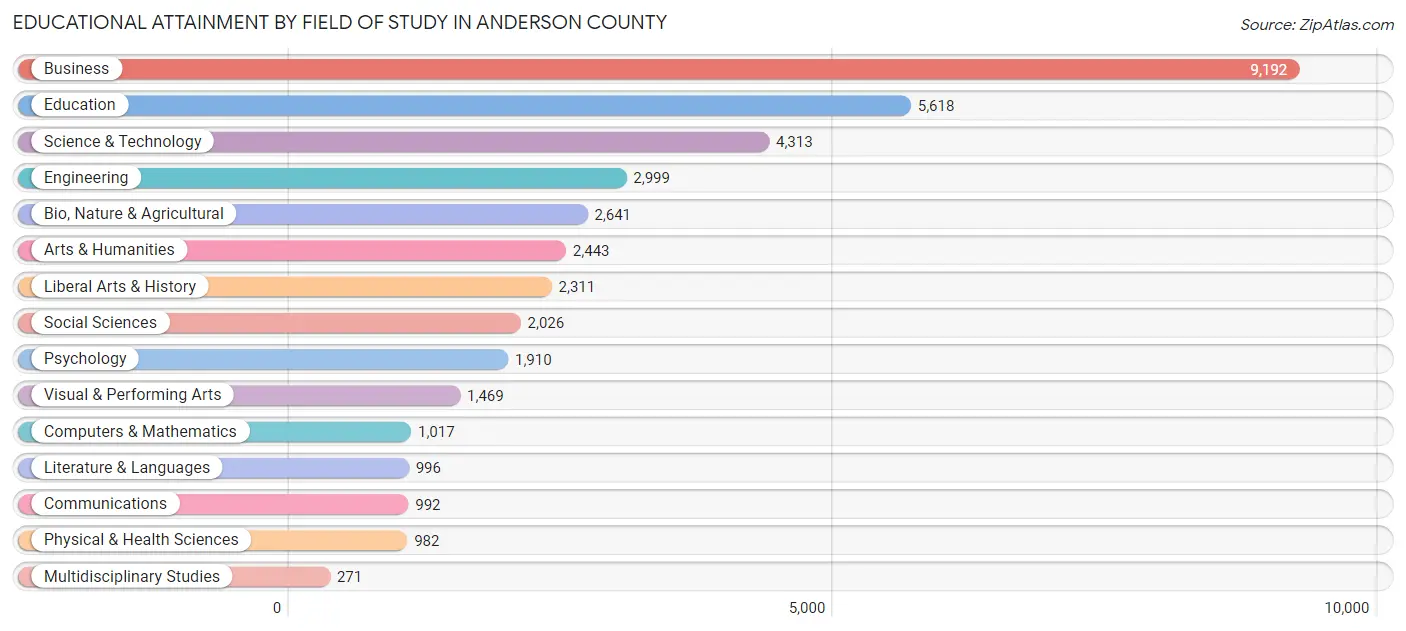
| Field of Study | # Graduates | % Graduates |
| Computers & Mathematics | 1,017 | 2.6% |
| Bio, Nature & Agricultural | 2,641 | 6.7% |
| Physical & Health Sciences | 982 | 2.5% |
| Psychology | 1,910 | 4.9% |
| Social Sciences | 2,026 | 5.2% |
| Engineering | 2,999 | 7.6% |
| Multidisciplinary Studies | 271 | 0.7% |
| Science & Technology | 4,313 | 11.0% |
| Business | 9,192 | 23.5% |
| Education | 5,618 | 14.3% |
| Literature & Languages | 996 | 2.5% |
| Liberal Arts & History | 2,311 | 5.9% |
| Visual & Performing Arts | 1,469 | 3.7% |
| Communications | 992 | 2.5% |
| Arts & Humanities | 2,443 | 6.2% |
| Total | 39,180 | 100.0% |
Transportation & Commute in Anderson County
Vehicle Availability by Sex in Anderson County
The most prevalent vehicle ownership categories in Anderson County are males with 2 vehicles (19,248, accounting for 39.4%) and females with 2 vehicles (15,245, making up 45.7%).
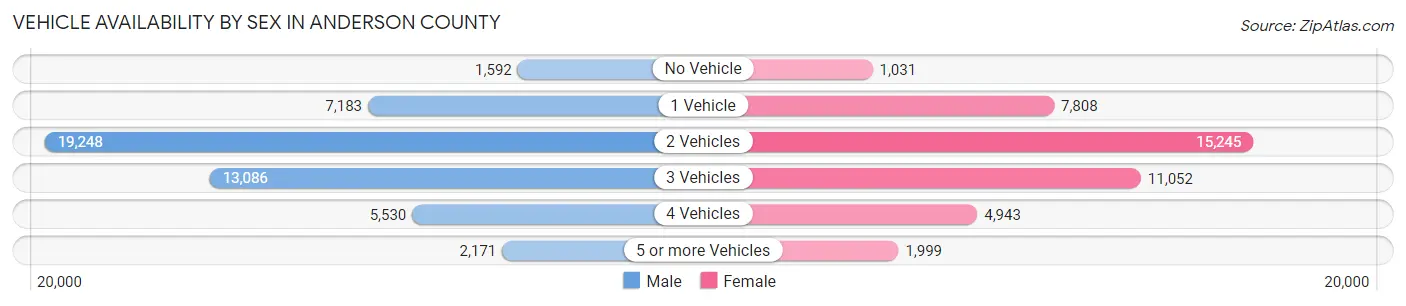
| Vehicles Available | Male | Female |
| No Vehicle | 1,592 (3.3%) | 1,031 (2.5%) |
| 1 Vehicle | 7,183 (14.7%) | 7,808 (18.6%) |
| 2 Vehicles | 19,248 (39.4%) | 15,245 (36.2%) |
| 3 Vehicles | 13,086 (26.8%) | 11,052 (26.3%) |
| 4 Vehicles | 5,530 (11.3%) | 4,943 (11.7%) |
| 5 or more Vehicles | 2,171 (4.4%) | 1,999 (4.8%) |
| Total | 48,810 (100.0%) | 42,078 (100.0%) |
Commute Time in Anderson County
The most frequently occuring commute durations in Anderson County are 15 to 19 minutes (14,531 commuters, 16.8%), 20 to 24 minutes (13,283 commuters, 15.3%), and 30 to 34 minutes (12,175 commuters, 14.1%).
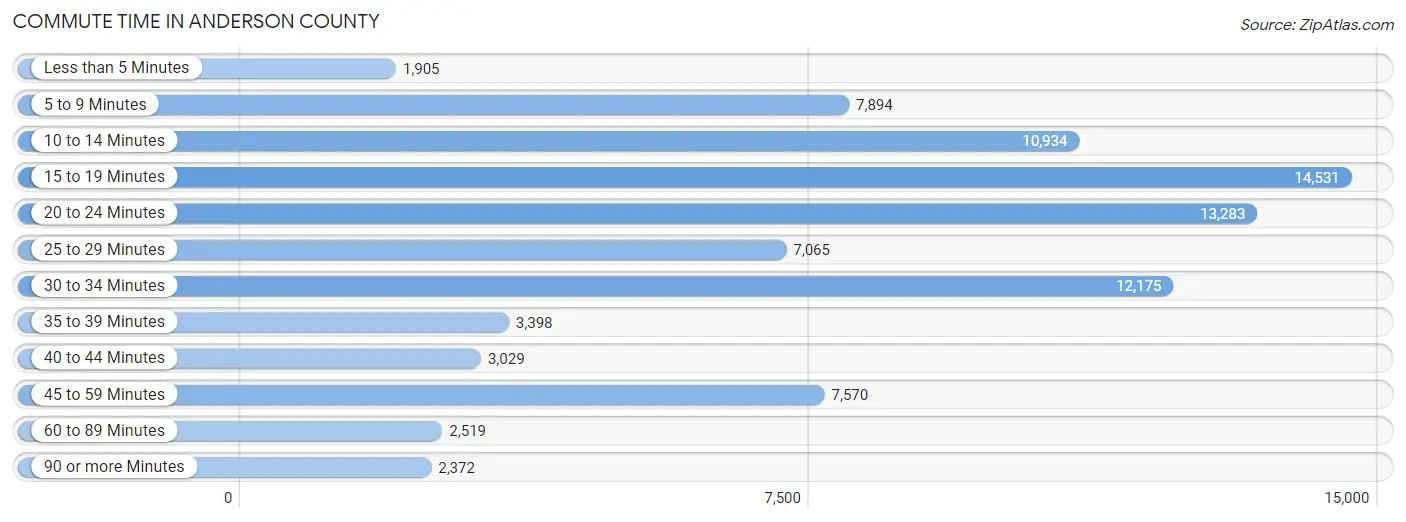
| Commute Time | # Commuters | % Commuters |
| Less than 5 Minutes | 1,905 | 2.2% |
| 5 to 9 Minutes | 7,894 | 9.1% |
| 10 to 14 Minutes | 10,934 | 12.6% |
| 15 to 19 Minutes | 14,531 | 16.8% |
| 20 to 24 Minutes | 13,283 | 15.3% |
| 25 to 29 Minutes | 7,065 | 8.2% |
| 30 to 34 Minutes | 12,175 | 14.1% |
| 35 to 39 Minutes | 3,398 | 3.9% |
| 40 to 44 Minutes | 3,029 | 3.5% |
| 45 to 59 Minutes | 7,570 | 8.7% |
| 60 to 89 Minutes | 2,519 | 2.9% |
| 90 or more Minutes | 2,372 | 2.7% |
Commute Time by Sex in Anderson County
The most common commute times in Anderson County are 15 to 19 minutes (7,254 commuters, 15.4%) for males and 15 to 19 minutes (7,277 commuters, 18.3%) for females.
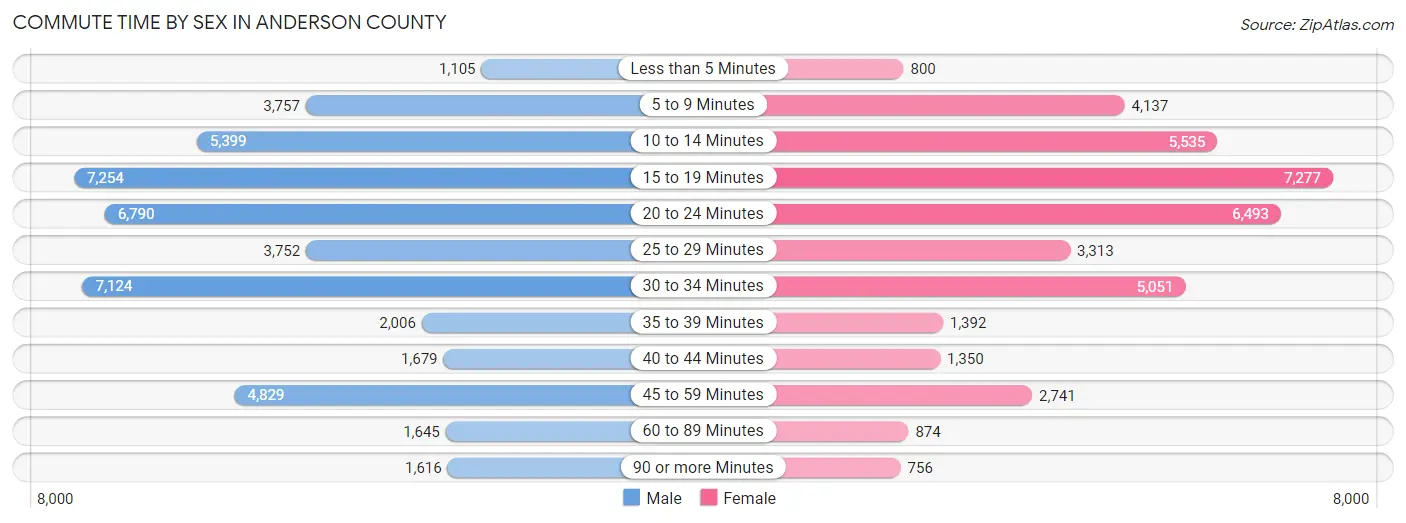
| Commute Time | Male | Female |
| Less than 5 Minutes | 1,105 (2.4%) | 800 (2.0%) |
| 5 to 9 Minutes | 3,757 (8.0%) | 4,137 (10.4%) |
| 10 to 14 Minutes | 5,399 (11.5%) | 5,535 (13.9%) |
| 15 to 19 Minutes | 7,254 (15.4%) | 7,277 (18.3%) |
| 20 to 24 Minutes | 6,790 (14.5%) | 6,493 (16.4%) |
| 25 to 29 Minutes | 3,752 (8.0%) | 3,313 (8.3%) |
| 30 to 34 Minutes | 7,124 (15.2%) | 5,051 (12.7%) |
| 35 to 39 Minutes | 2,006 (4.3%) | 1,392 (3.5%) |
| 40 to 44 Minutes | 1,679 (3.6%) | 1,350 (3.4%) |
| 45 to 59 Minutes | 4,829 (10.3%) | 2,741 (6.9%) |
| 60 to 89 Minutes | 1,645 (3.5%) | 874 (2.2%) |
| 90 or more Minutes | 1,616 (3.4%) | 756 (1.9%) |
Time of Departure to Work by Sex in Anderson County
The most frequent times of departure to work in Anderson County are 7:00 AM to 7:29 AM (6,125, 13.0%) for males and 7:30 AM to 7:59 AM (5,938, 14.9%) for females.
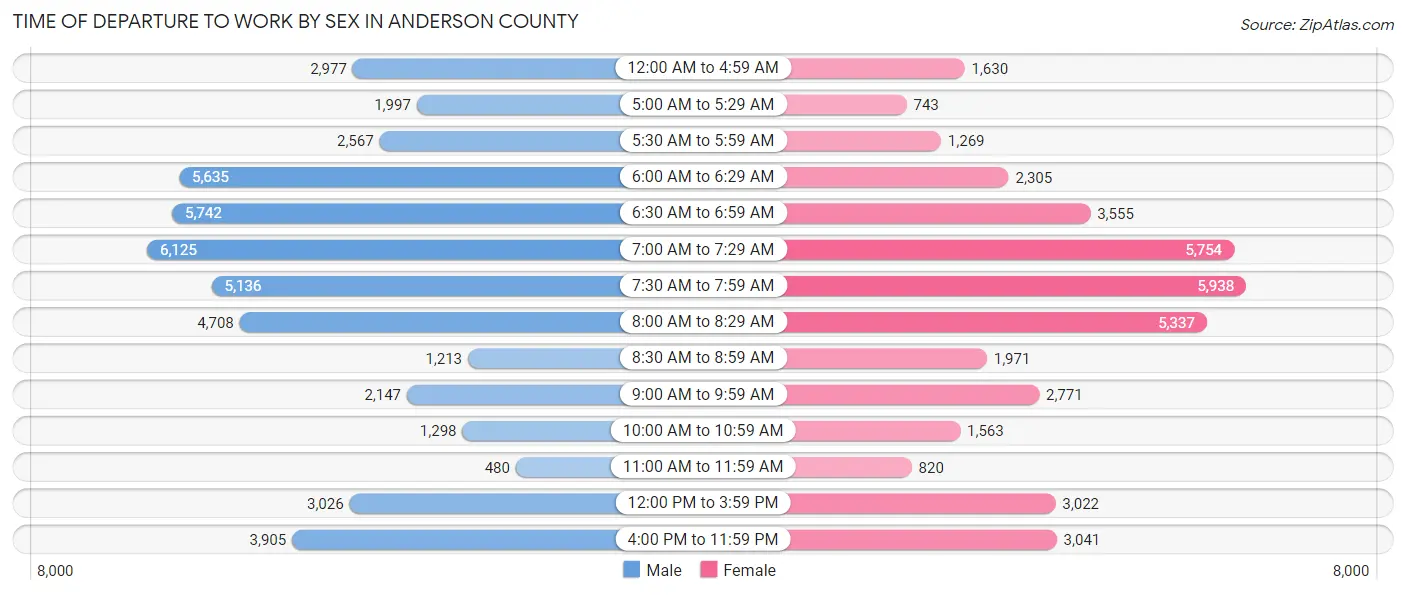
| Time of Departure | Male | Female |
| 12:00 AM to 4:59 AM | 2,977 (6.3%) | 1,630 (4.1%) |
| 5:00 AM to 5:29 AM | 1,997 (4.3%) | 743 (1.9%) |
| 5:30 AM to 5:59 AM | 2,567 (5.5%) | 1,269 (3.2%) |
| 6:00 AM to 6:29 AM | 5,635 (12.0%) | 2,305 (5.8%) |
| 6:30 AM to 6:59 AM | 5,742 (12.2%) | 3,555 (8.9%) |
| 7:00 AM to 7:29 AM | 6,125 (13.0%) | 5,754 (14.5%) |
| 7:30 AM to 7:59 AM | 5,136 (10.9%) | 5,938 (14.9%) |
| 8:00 AM to 8:29 AM | 4,708 (10.0%) | 5,337 (13.4%) |
| 8:30 AM to 8:59 AM | 1,213 (2.6%) | 1,971 (5.0%) |
| 9:00 AM to 9:59 AM | 2,147 (4.6%) | 2,771 (7.0%) |
| 10:00 AM to 10:59 AM | 1,298 (2.8%) | 1,563 (3.9%) |
| 11:00 AM to 11:59 AM | 480 (1.0%) | 820 (2.1%) |
| 12:00 PM to 3:59 PM | 3,026 (6.4%) | 3,022 (7.6%) |
| 4:00 PM to 11:59 PM | 3,905 (8.3%) | 3,041 (7.7%) |
| Total | 46,956 (100.0%) | 39,719 (100.0%) |
Housing Occupancy in Anderson County
Occupancy by Ownership in Anderson County
Of the total 80,301 dwellings in Anderson County, owner-occupied units account for 60,020 (74.7%), while renter-occupied units make up 20,281 (25.3%).
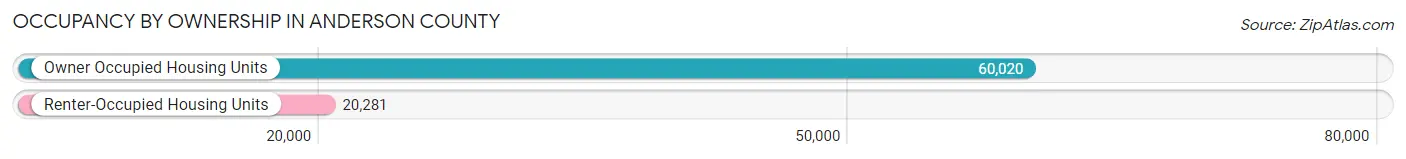
| Occupancy | # Housing Units | % Housing Units |
| Owner Occupied Housing Units | 60,020 | 74.7% |
| Renter-Occupied Housing Units | 20,281 | 25.3% |
| Total Occupied Housing Units | 80,301 | 100.0% |
Occupancy by Household Size in Anderson County
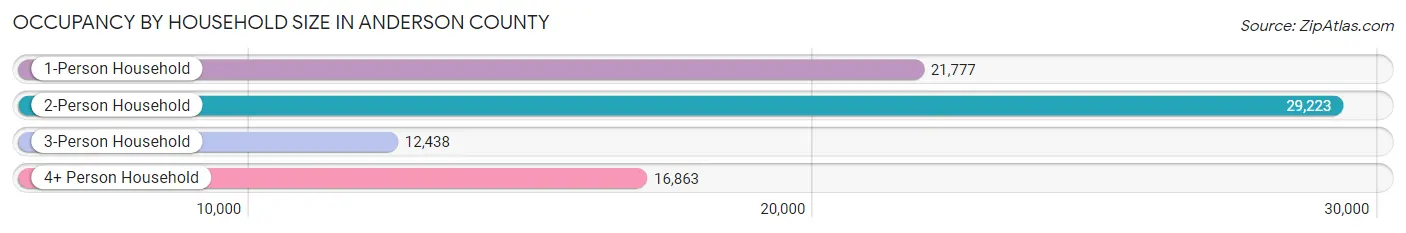
| Household Size | # Housing Units | % Housing Units |
| 1-Person Household | 21,777 | 27.1% |
| 2-Person Household | 29,223 | 36.4% |
| 3-Person Household | 12,438 | 15.5% |
| 4+ Person Household | 16,863 | 21.0% |
| Total Housing Units | 80,301 | 100.0% |
Occupancy by Ownership by Household Size in Anderson County
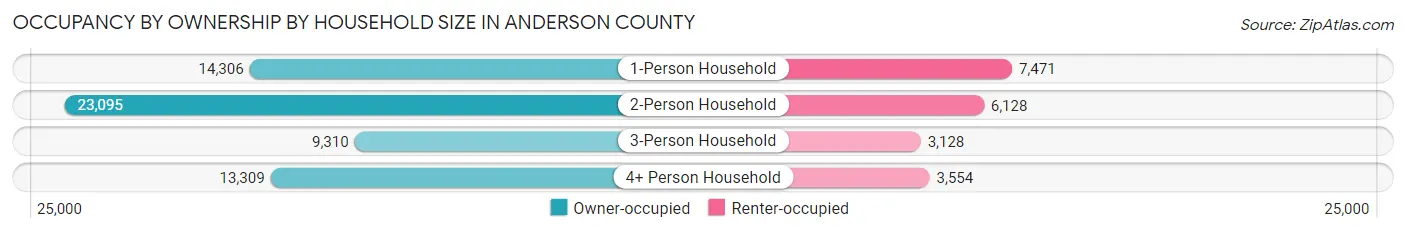
| Household Size | Owner-occupied | Renter-occupied |
| 1-Person Household | 14,306 (65.7%) | 7,471 (34.3%) |
| 2-Person Household | 23,095 (79.0%) | 6,128 (21.0%) |
| 3-Person Household | 9,310 (74.9%) | 3,128 (25.2%) |
| 4+ Person Household | 13,309 (78.9%) | 3,554 (21.1%) |
| Total Housing Units | 60,020 (74.7%) | 20,281 (25.3%) |
Occupancy by Educational Attainment in Anderson County
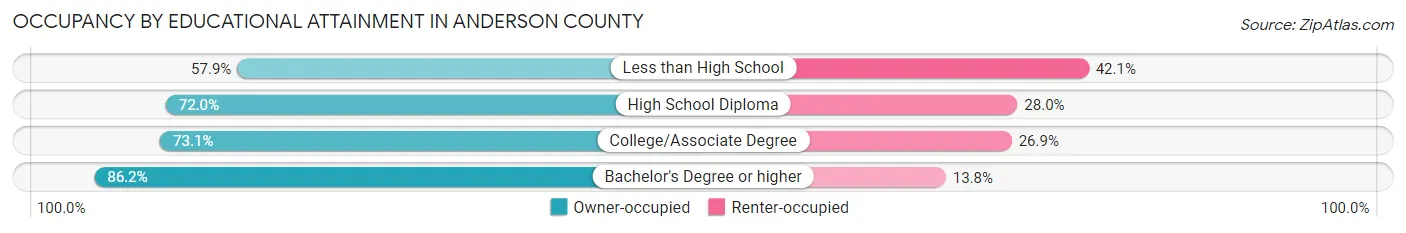
| Household Size | Owner-occupied | Renter-occupied |
| Less than High School | 5,515 (57.9%) | 4,017 (42.1%) |
| High School Diploma | 15,711 (72.0%) | 6,111 (28.0%) |
| College/Associate Degree | 18,961 (73.1%) | 6,972 (26.9%) |
| Bachelor's Degree or higher | 19,833 (86.2%) | 3,181 (13.8%) |
Occupancy by Age of Householder in Anderson County
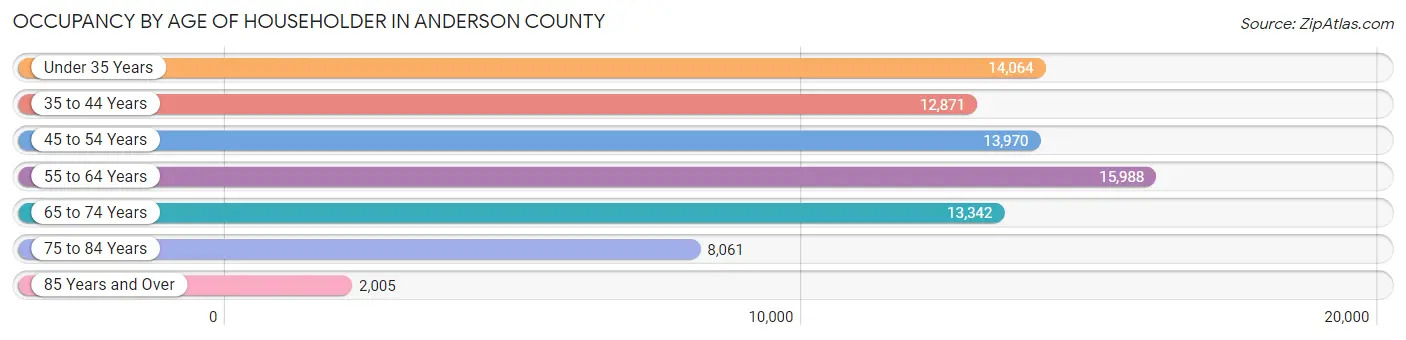
| Age Bracket | # Households | % Households |
| Under 35 Years | 14,064 | 17.5% |
| 35 to 44 Years | 12,871 | 16.0% |
| 45 to 54 Years | 13,970 | 17.4% |
| 55 to 64 Years | 15,988 | 19.9% |
| 65 to 74 Years | 13,342 | 16.6% |
| 75 to 84 Years | 8,061 | 10.0% |
| 85 Years and Over | 2,005 | 2.5% |
| Total | 80,301 | 100.0% |
Housing Finances in Anderson County
Median Income by Occupancy in Anderson County
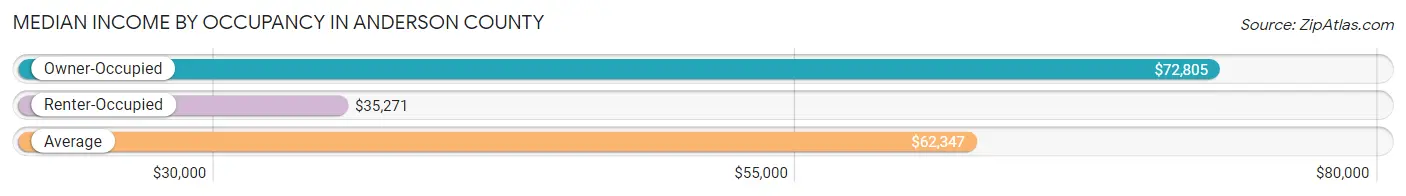
| Occupancy Type | # Households | Median Income |
| Owner-Occupied | 60,020 (74.7%) | $72,805 |
| Renter-Occupied | 20,281 (25.3%) | $35,271 |
| Average | 80,301 (100.0%) | $62,347 |
Occupancy by Householder Income Bracket in Anderson County
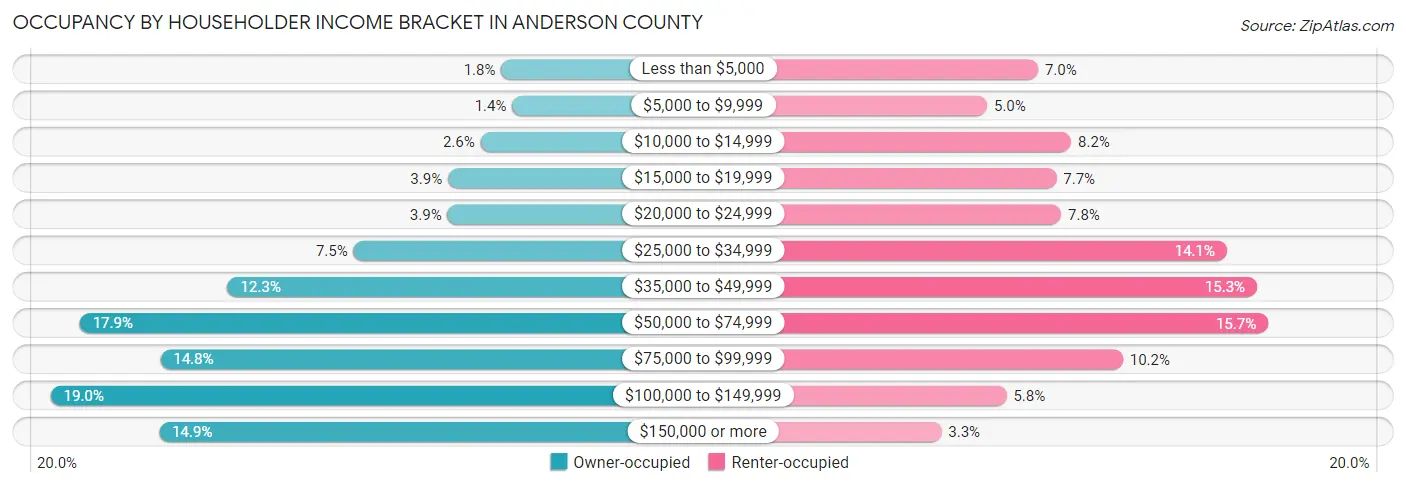
| Income Bracket | Owner-occupied | Renter-occupied |
| Less than $5,000 | 1,105 (1.8%) | 1,410 (7.0%) |
| $5,000 to $9,999 | 851 (1.4%) | 1,016 (5.0%) |
| $10,000 to $14,999 | 1,579 (2.6%) | 1,666 (8.2%) |
| $15,000 to $19,999 | 2,320 (3.9%) | 1,551 (7.6%) |
| $20,000 to $24,999 | 2,332 (3.9%) | 1,588 (7.8%) |
| $25,000 to $34,999 | 4,483 (7.5%) | 2,868 (14.1%) |
| $35,000 to $49,999 | 7,364 (12.3%) | 3,101 (15.3%) |
| $50,000 to $74,999 | 10,745 (17.9%) | 3,187 (15.7%) |
| $75,000 to $99,999 | 8,898 (14.8%) | 2,064 (10.2%) |
| $100,000 to $149,999 | 11,412 (19.0%) | 1,167 (5.8%) |
| $150,000 or more | 8,931 (14.9%) | 663 (3.3%) |
| Total | 60,020 (100.0%) | 20,281 (100.0%) |
Monthly Housing Cost Tiers in Anderson County
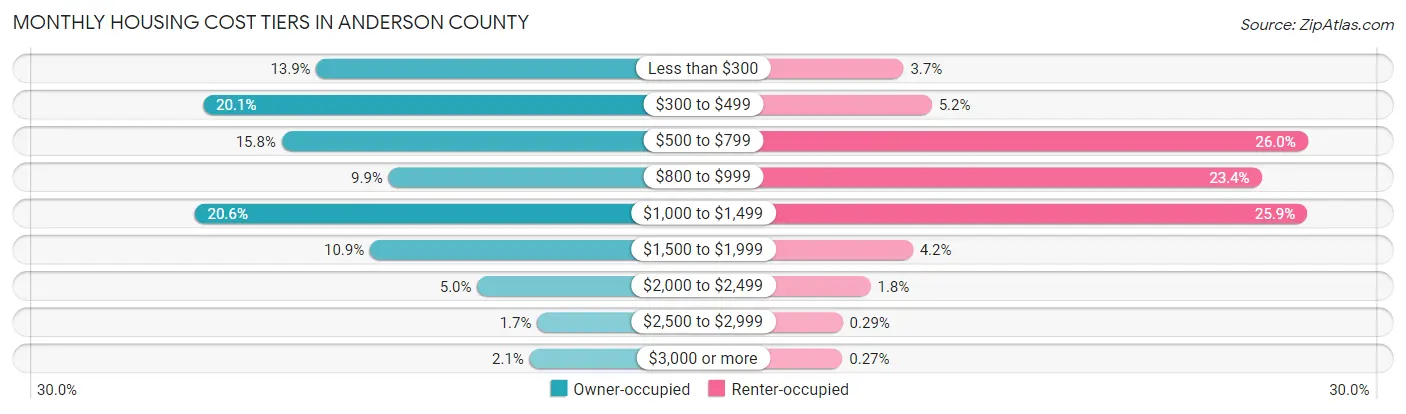
| Monthly Cost | Owner-occupied | Renter-occupied |
| Less than $300 | 8,328 (13.9%) | 741 (3.6%) |
| $300 to $499 | 12,089 (20.1%) | 1,056 (5.2%) |
| $500 to $799 | 9,482 (15.8%) | 5,266 (26.0%) |
| $800 to $999 | 5,933 (9.9%) | 4,750 (23.4%) |
| $1,000 to $1,499 | 12,370 (20.6%) | 5,260 (25.9%) |
| $1,500 to $1,999 | 6,552 (10.9%) | 844 (4.2%) |
| $2,000 to $2,499 | 2,997 (5.0%) | 371 (1.8%) |
| $2,500 to $2,999 | 1,006 (1.7%) | 59 (0.3%) |
| $3,000 or more | 1,263 (2.1%) | 55 (0.3%) |
| Total | 60,020 (100.0%) | 20,281 (100.0%) |
Physical Housing Characteristics in Anderson County
Housing Structures in Anderson County
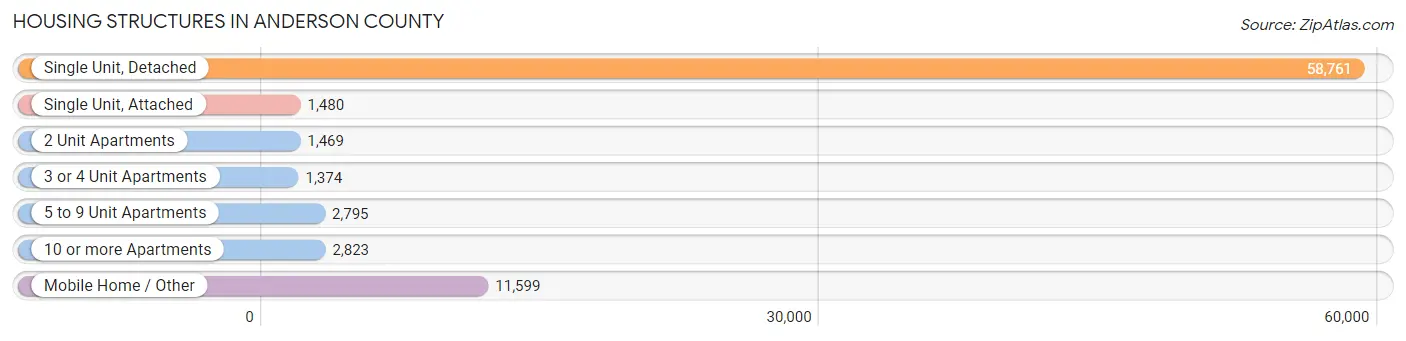
| Structure Type | # Housing Units | % Housing Units |
| Single Unit, Detached | 58,761 | 73.2% |
| Single Unit, Attached | 1,480 | 1.8% |
| 2 Unit Apartments | 1,469 | 1.8% |
| 3 or 4 Unit Apartments | 1,374 | 1.7% |
| 5 to 9 Unit Apartments | 2,795 | 3.5% |
| 10 or more Apartments | 2,823 | 3.5% |
| Mobile Home / Other | 11,599 | 14.4% |
| Total | 80,301 | 100.0% |
Housing Structures by Occupancy in Anderson County
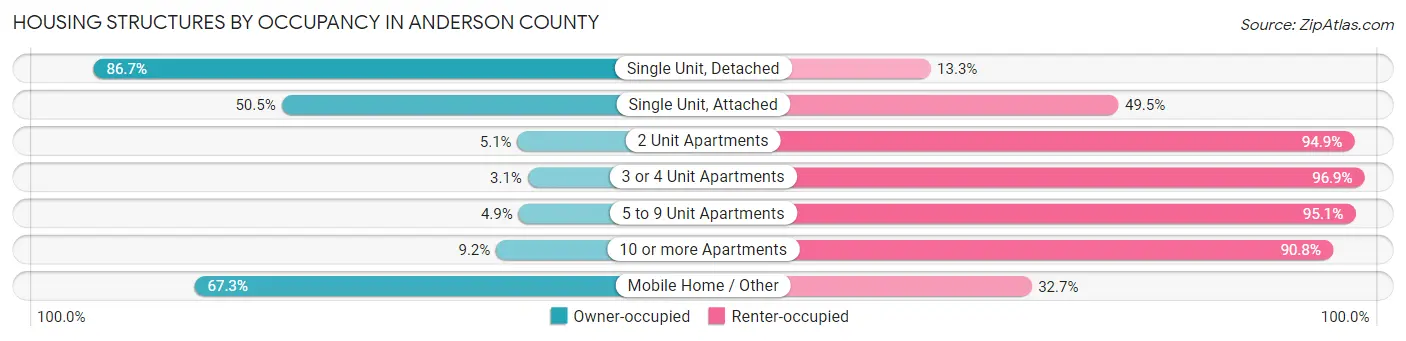
| Structure Type | Owner-occupied | Renter-occupied |
| Single Unit, Detached | 50,956 (86.7%) | 7,805 (13.3%) |
| Single Unit, Attached | 748 (50.5%) | 732 (49.5%) |
| 2 Unit Apartments | 75 (5.1%) | 1,394 (94.9%) |
| 3 or 4 Unit Apartments | 43 (3.1%) | 1,331 (96.9%) |
| 5 to 9 Unit Apartments | 137 (4.9%) | 2,658 (95.1%) |
| 10 or more Apartments | 260 (9.2%) | 2,563 (90.8%) |
| Mobile Home / Other | 7,801 (67.3%) | 3,798 (32.7%) |
| Total | 60,020 (74.7%) | 20,281 (25.3%) |
Housing Structures by Number of Rooms in Anderson County
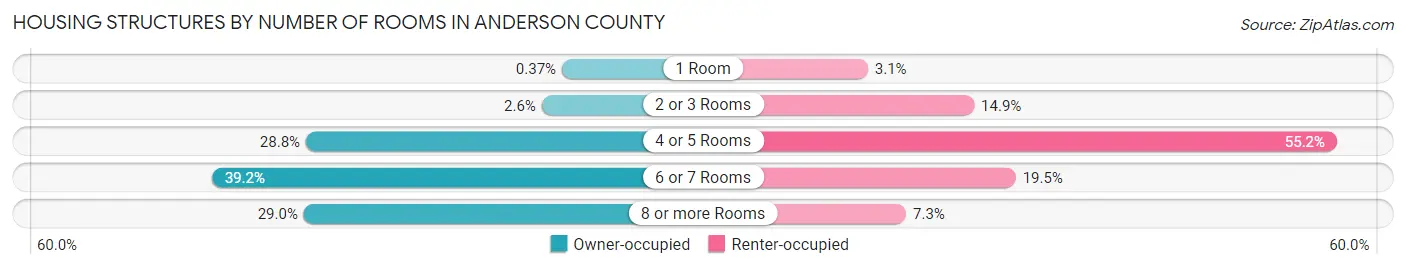
| Number of Rooms | Owner-occupied | Renter-occupied |
| 1 Room | 220 (0.4%) | 629 (3.1%) |
| 2 or 3 Rooms | 1,569 (2.6%) | 3,022 (14.9%) |
| 4 or 5 Rooms | 17,271 (28.8%) | 11,184 (55.1%) |
| 6 or 7 Rooms | 23,544 (39.2%) | 3,957 (19.5%) |
| 8 or more Rooms | 17,416 (29.0%) | 1,489 (7.3%) |
| Total | 60,020 (100.0%) | 20,281 (100.0%) |
Housing Structure by Heating Type in Anderson County
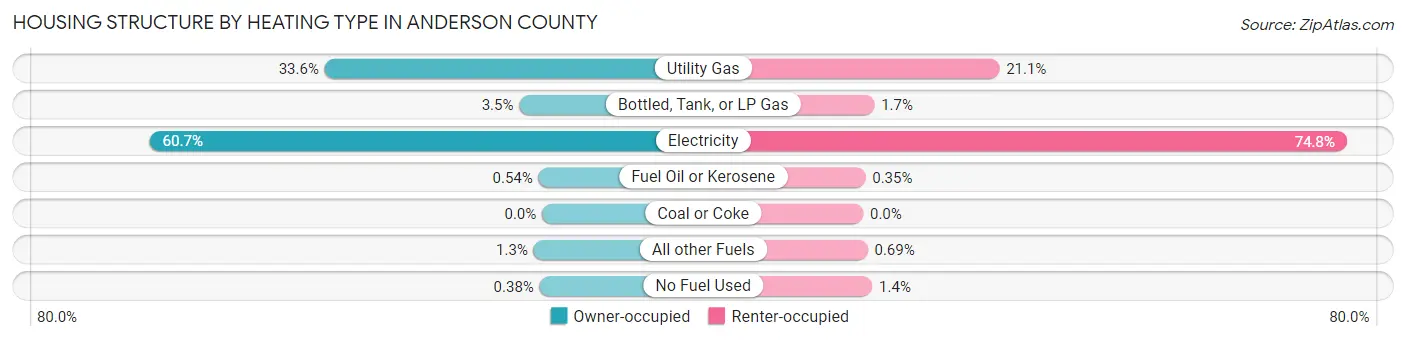
| Heating Type | Owner-occupied | Renter-occupied |
| Utility Gas | 20,168 (33.6%) | 4,270 (21.0%) |
| Bottled, Tank, or LP Gas | 2,114 (3.5%) | 350 (1.7%) |
| Electricity | 36,408 (60.7%) | 15,166 (74.8%) |
| Fuel Oil or Kerosene | 325 (0.5%) | 70 (0.4%) |
| Coal or Coke | 0 (0.0%) | 0 (0.0%) |
| All other Fuels | 776 (1.3%) | 139 (0.7%) |
| No Fuel Used | 229 (0.4%) | 286 (1.4%) |
| Total | 60,020 (100.0%) | 20,281 (100.0%) |
Household Vehicle Usage in Anderson County
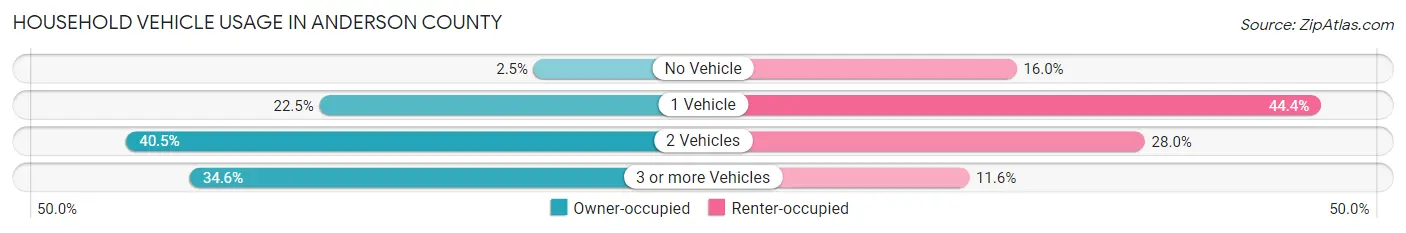
| Vehicles per Household | Owner-occupied | Renter-occupied |
| No Vehicle | 1,478 (2.5%) | 3,246 (16.0%) |
| 1 Vehicle | 13,486 (22.5%) | 9,012 (44.4%) |
| 2 Vehicles | 24,307 (40.5%) | 5,674 (28.0%) |
| 3 or more Vehicles | 20,749 (34.6%) | 2,349 (11.6%) |
| Total | 60,020 (100.0%) | 20,281 (100.0%) |
Real Estate & Mortgages in Anderson County
Real Estate and Mortgage Overview in Anderson County
| Characteristic | Without Mortgage | With Mortgage |
| Housing Units | 25,930 | 34,090 |
| Median Property Value | $151,100 | $212,500 |
| Median Household Income | $52,273 | $6,281 |
| Monthly Housing Costs | $374 | $1,209 |
| Real Estate Taxes | $683 | $963 |
Property Value by Mortgage Status in Anderson County
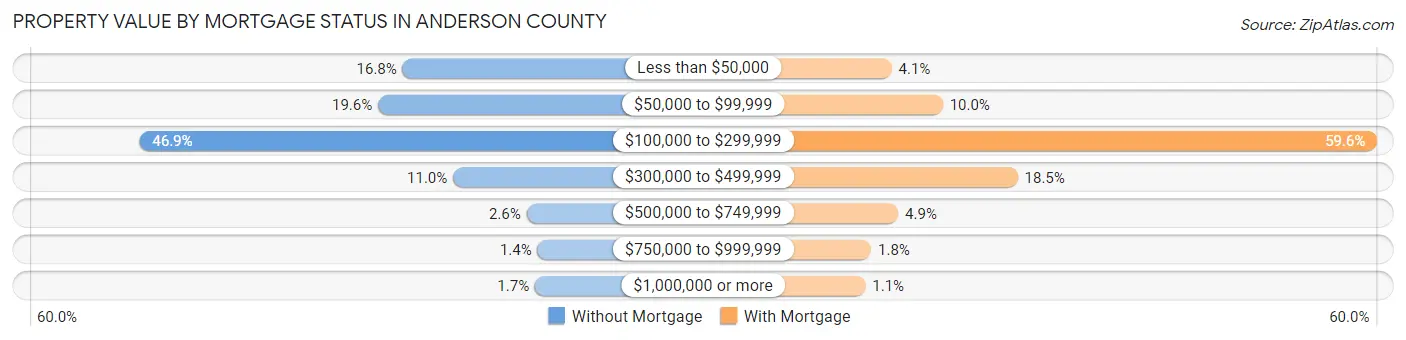
| Property Value | Without Mortgage | With Mortgage |
| Less than $50,000 | 4,355 (16.8%) | 1,405 (4.1%) |
| $50,000 to $99,999 | 5,086 (19.6%) | 3,396 (10.0%) |
| $100,000 to $299,999 | 12,157 (46.9%) | 20,324 (59.6%) |
| $300,000 to $499,999 | 2,859 (11.0%) | 6,315 (18.5%) |
| $500,000 to $749,999 | 682 (2.6%) | 1,661 (4.9%) |
| $750,000 to $999,999 | 357 (1.4%) | 608 (1.8%) |
| $1,000,000 or more | 434 (1.7%) | 381 (1.1%) |
| Total | 25,930 (100.0%) | 34,090 (100.0%) |
Household Income by Mortgage Status in Anderson County
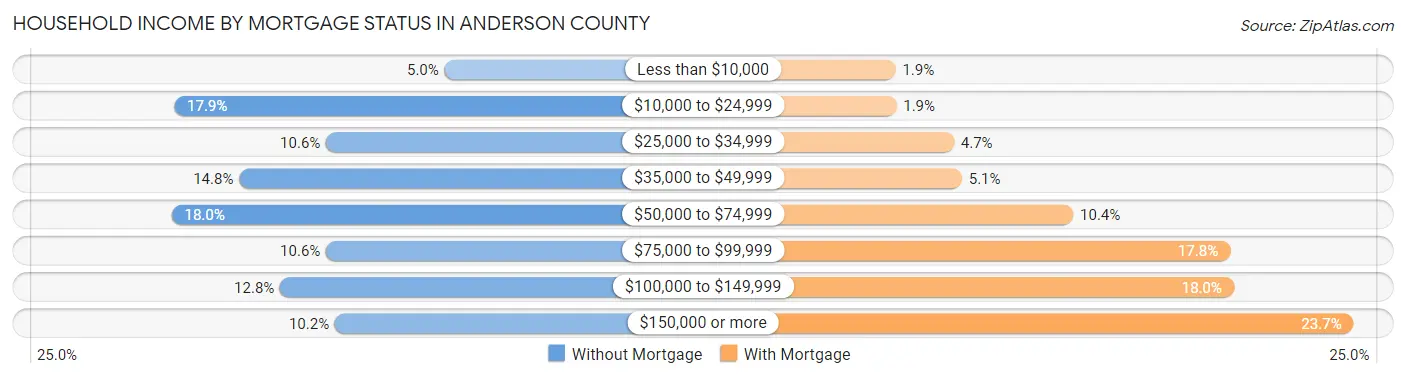
| Household Income | Without Mortgage | With Mortgage |
| Less than $10,000 | 1,296 (5.0%) | 647 (1.9%) |
| $10,000 to $24,999 | 4,637 (17.9%) | 660 (1.9%) |
| $25,000 to $34,999 | 2,758 (10.6%) | 1,594 (4.7%) |
| $35,000 to $49,999 | 3,833 (14.8%) | 1,725 (5.1%) |
| $50,000 to $74,999 | 4,668 (18.0%) | 3,531 (10.4%) |
| $75,000 to $99,999 | 2,760 (10.6%) | 6,077 (17.8%) |
| $100,000 to $149,999 | 3,328 (12.8%) | 6,138 (18.0%) |
| $150,000 or more | 2,650 (10.2%) | 8,084 (23.7%) |
| Total | 25,930 (100.0%) | 34,090 (100.0%) |
Property Value to Household Income Ratio in Anderson County
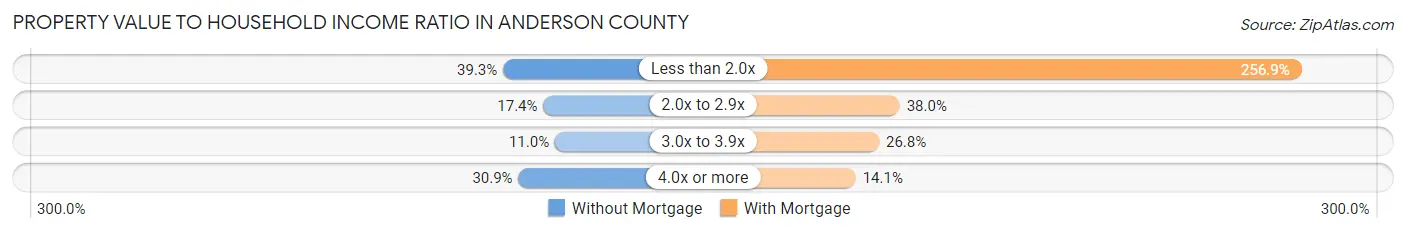
| Value-to-Income Ratio | Without Mortgage | With Mortgage |
| Less than 2.0x | 10,187 (39.3%) | 87,590 (256.9%) |
| 2.0x to 2.9x | 4,505 (17.4%) | 12,967 (38.0%) |
| 3.0x to 3.9x | 2,860 (11.0%) | 9,118 (26.8%) |
| 4.0x or more | 8,019 (30.9%) | 4,794 (14.1%) |
| Total | 25,930 (100.0%) | 34,090 (100.0%) |
Real Estate Taxes by Mortgage Status in Anderson County
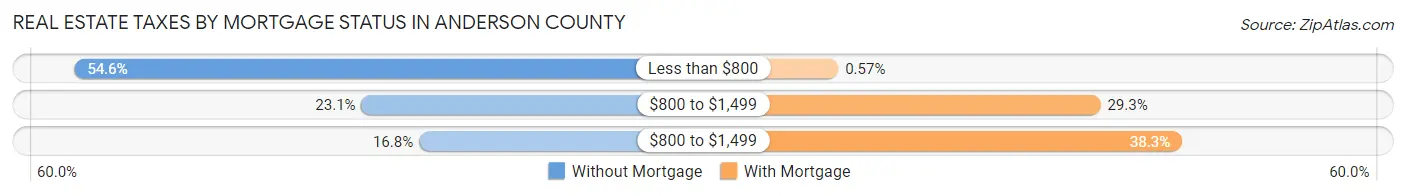
| Property Taxes | Without Mortgage | With Mortgage |
| Less than $800 | 14,144 (54.5%) | 193 (0.6%) |
| $800 to $1,499 | 5,988 (23.1%) | 9,991 (29.3%) |
| $800 to $1,499 | 4,352 (16.8%) | 13,041 (38.3%) |
| Total | 25,930 (100.0%) | 34,090 (100.0%) |
Health & Disability in Anderson County
Health Insurance Coverage by Age in Anderson County
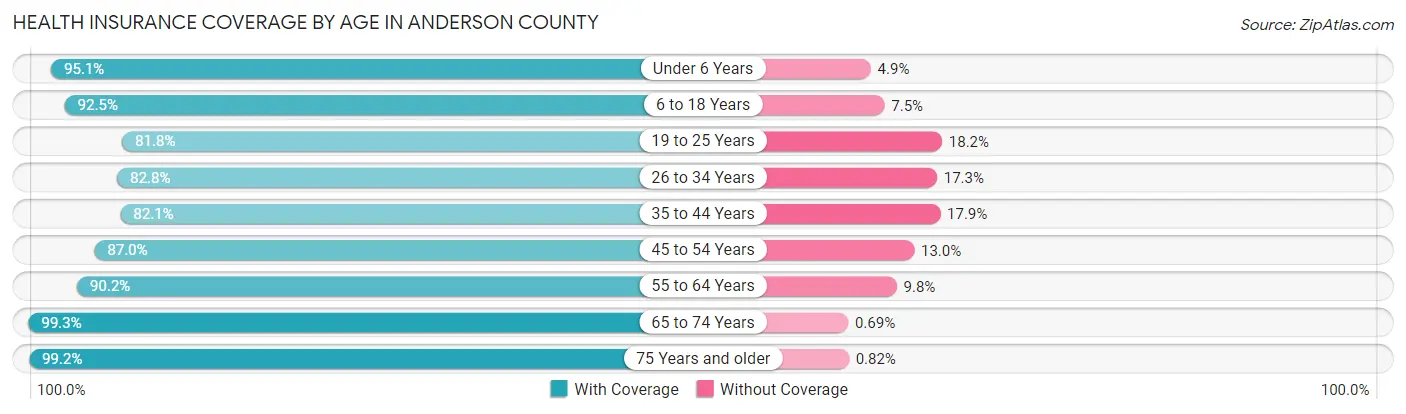
| Age Bracket | With Coverage | Without Coverage |
| Under 6 Years | 13,108 (95.1%) | 679 (4.9%) |
| 6 to 18 Years | 32,216 (92.5%) | 2,602 (7.5%) |
| 19 to 25 Years | 15,006 (81.8%) | 3,337 (18.2%) |
| 26 to 34 Years | 17,714 (82.8%) | 3,693 (17.2%) |
| 35 to 44 Years | 20,280 (82.1%) | 4,414 (17.9%) |
| 45 to 54 Years | 22,869 (87.0%) | 3,419 (13.0%) |
| 55 to 64 Years | 24,831 (90.2%) | 2,687 (9.8%) |
| 65 to 74 Years | 21,659 (99.3%) | 151 (0.7%) |
| 75 Years and older | 14,169 (99.2%) | 117 (0.8%) |
| Total | 181,852 (89.6%) | 21,099 (10.4%) |
Health Insurance Coverage by Citizenship Status in Anderson County
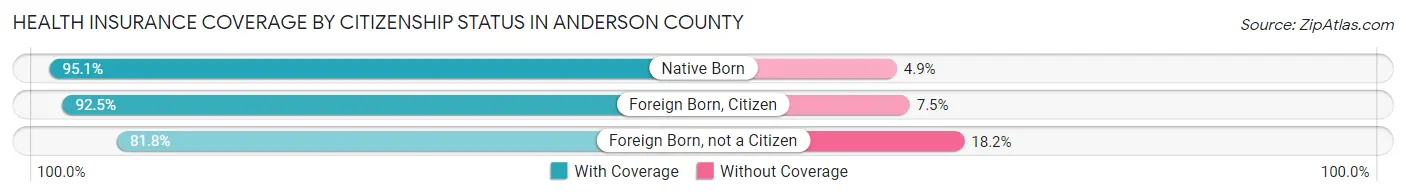
| Citizenship Status | With Coverage | Without Coverage |
| Native Born | 13,108 (95.1%) | 679 (4.9%) |
| Foreign Born, Citizen | 32,216 (92.5%) | 2,602 (7.5%) |
| Foreign Born, not a Citizen | 15,006 (81.8%) | 3,337 (18.2%) |
Health Insurance Coverage by Household Income in Anderson County
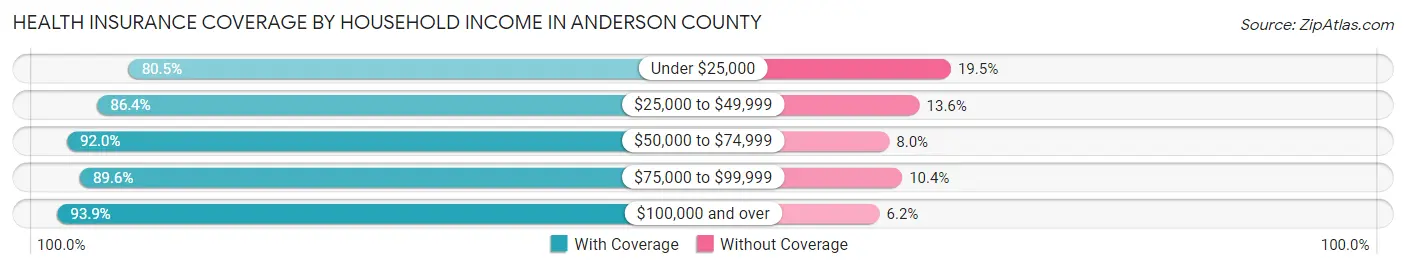
| Household Income | With Coverage | Without Coverage |
| Under $25,000 | 23,045 (80.5%) | 5,590 (19.5%) |
| $25,000 to $49,999 | 32,404 (86.4%) | 5,120 (13.6%) |
| $50,000 to $74,999 | 31,668 (92.0%) | 2,742 (8.0%) |
| $75,000 to $99,999 | 28,624 (89.6%) | 3,316 (10.4%) |
| $100,000 and over | 64,690 (93.9%) | 4,239 (6.1%) |
Public vs Private Health Insurance Coverage by Age in Anderson County
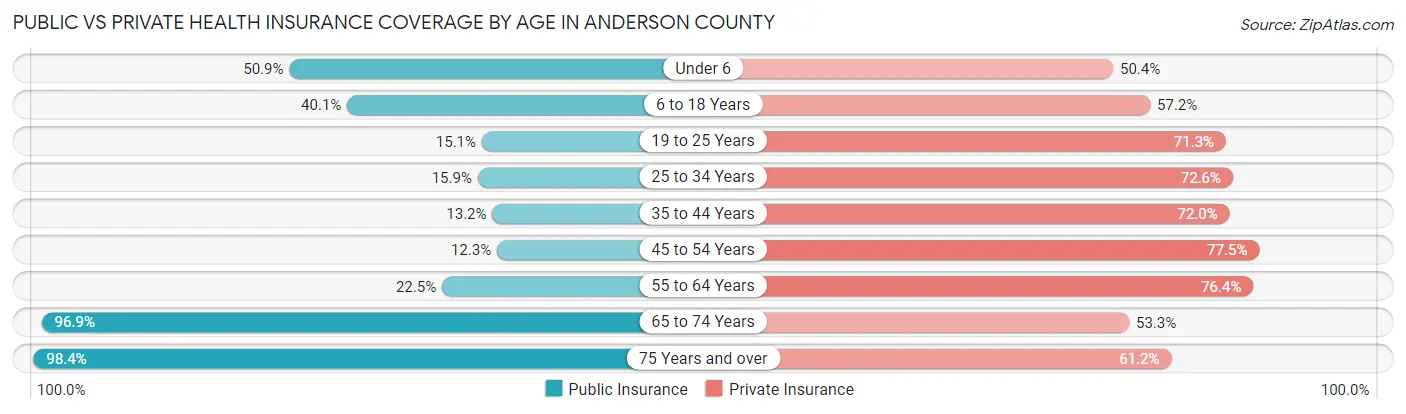
| Age Bracket | Public Insurance | Private Insurance |
| Under 6 | 7,014 (50.9%) | 6,942 (50.3%) |
| 6 to 18 Years | 13,974 (40.1%) | 19,928 (57.2%) |
| 19 to 25 Years | 2,775 (15.1%) | 13,076 (71.3%) |
| 25 to 34 Years | 3,402 (15.9%) | 15,538 (72.6%) |
| 35 to 44 Years | 3,255 (13.2%) | 17,771 (72.0%) |
| 45 to 54 Years | 3,239 (12.3%) | 20,374 (77.5%) |
| 55 to 64 Years | 6,200 (22.5%) | 21,012 (76.4%) |
| 65 to 74 Years | 21,122 (96.9%) | 11,630 (53.3%) |
| 75 Years and over | 14,052 (98.4%) | 8,737 (61.2%) |
| Total | 75,033 (37.0%) | 135,008 (66.5%) |
Disability Status by Sex by Age in Anderson County
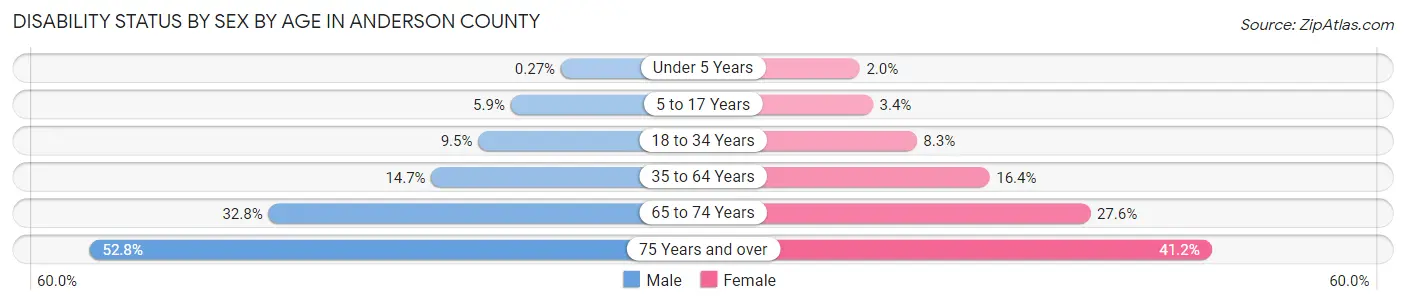
| Age Bracket | Male | Female |
| Under 5 Years | 16 (0.3%) | 109 (2.0%) |
| 5 to 17 Years | 1,036 (5.9%) | 586 (3.4%) |
| 18 to 34 Years | 1,947 (9.5%) | 1,793 (8.3%) |
| 35 to 64 Years | 5,599 (14.7%) | 6,637 (16.4%) |
| 65 to 74 Years | 3,354 (32.8%) | 3,205 (27.6%) |
| 75 Years and over | 3,020 (52.8%) | 3,525 (41.2%) |
Disability Class by Sex by Age in Anderson County
Disability Class: Hearing Difficulty
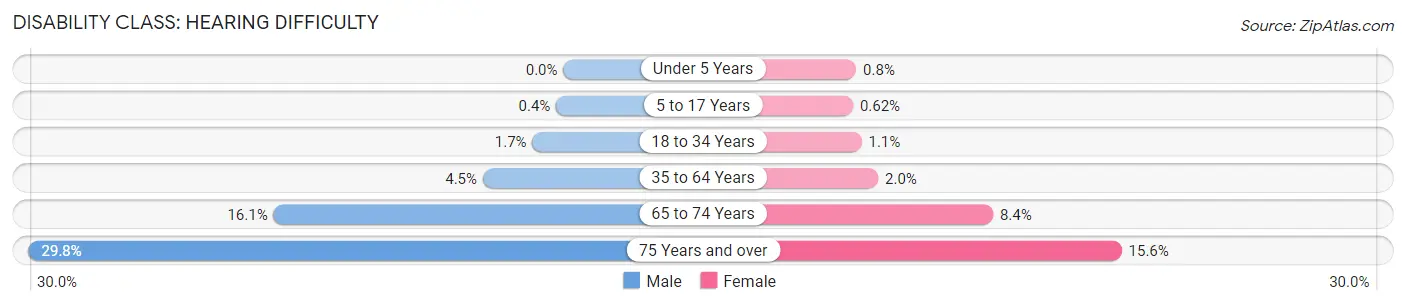
| Age Bracket | Male | Female |
| Under 5 Years | 0 (0.0%) | 44 (0.8%) |
| 5 to 17 Years | 71 (0.4%) | 105 (0.6%) |
| 18 to 34 Years | 354 (1.7%) | 237 (1.1%) |
| 35 to 64 Years | 1,708 (4.5%) | 815 (2.0%) |
| 65 to 74 Years | 1,648 (16.1%) | 977 (8.4%) |
| 75 Years and over | 1,705 (29.8%) | 1,334 (15.6%) |
Disability Class: Vision Difficulty
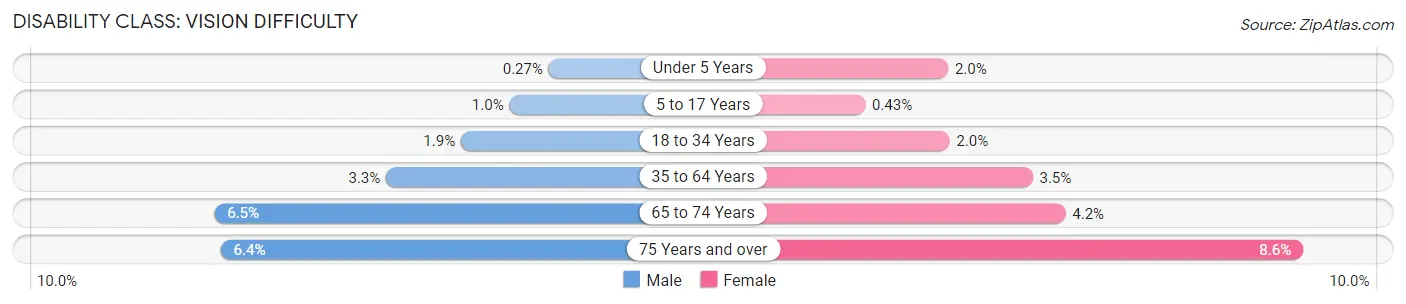
| Age Bracket | Male | Female |
| Under 5 Years | 16 (0.3%) | 109 (2.0%) |
| 5 to 17 Years | 177 (1.0%) | 73 (0.4%) |
| 18 to 34 Years | 391 (1.9%) | 431 (2.0%) |
| 35 to 64 Years | 1,253 (3.3%) | 1,432 (3.5%) |
| 65 to 74 Years | 662 (6.5%) | 481 (4.2%) |
| 75 Years and over | 364 (6.4%) | 733 (8.6%) |
Disability Class: Cognitive Difficulty
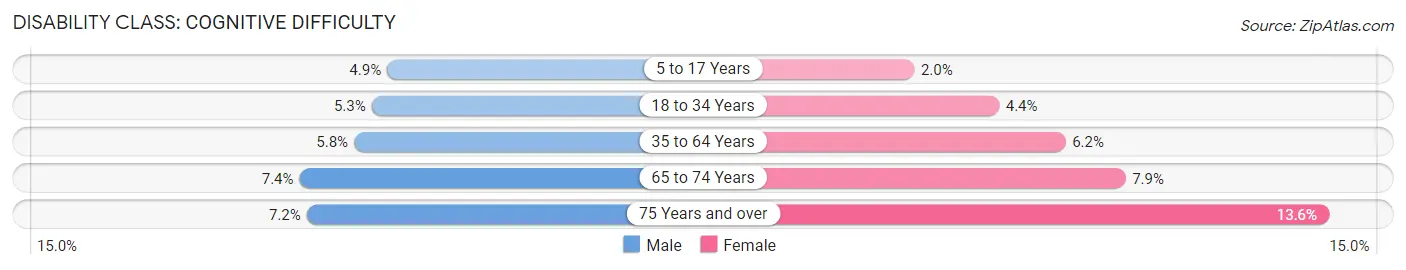
| Age Bracket | Male | Female |
| 5 to 17 Years | 869 (4.9%) | 343 (2.0%) |
| 18 to 34 Years | 1,099 (5.3%) | 943 (4.4%) |
| 35 to 64 Years | 2,223 (5.8%) | 2,514 (6.2%) |
| 65 to 74 Years | 751 (7.3%) | 915 (7.9%) |
| 75 Years and over | 409 (7.1%) | 1,161 (13.6%) |
Disability Class: Ambulatory Difficulty
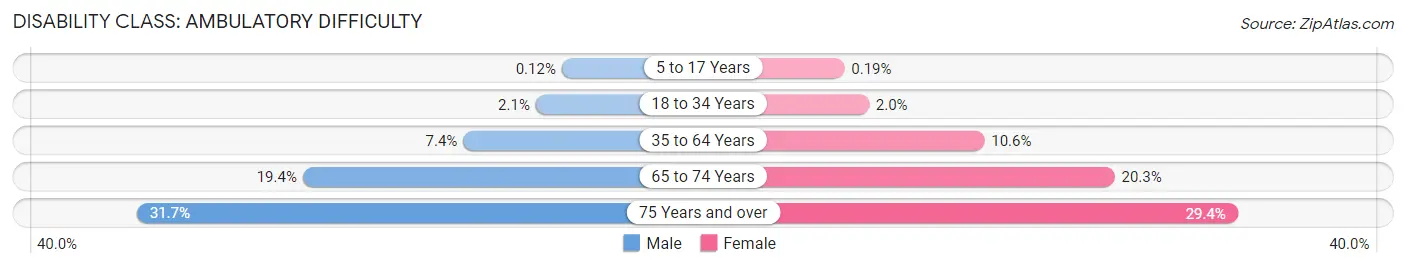
| Age Bracket | Male | Female |
| 5 to 17 Years | 22 (0.1%) | 33 (0.2%) |
| 18 to 34 Years | 422 (2.1%) | 433 (2.0%) |
| 35 to 64 Years | 2,834 (7.4%) | 4,273 (10.6%) |
| 65 to 74 Years | 1,976 (19.4%) | 2,348 (20.3%) |
| 75 Years and over | 1,813 (31.7%) | 2,516 (29.4%) |
Disability Class: Self-Care Difficulty
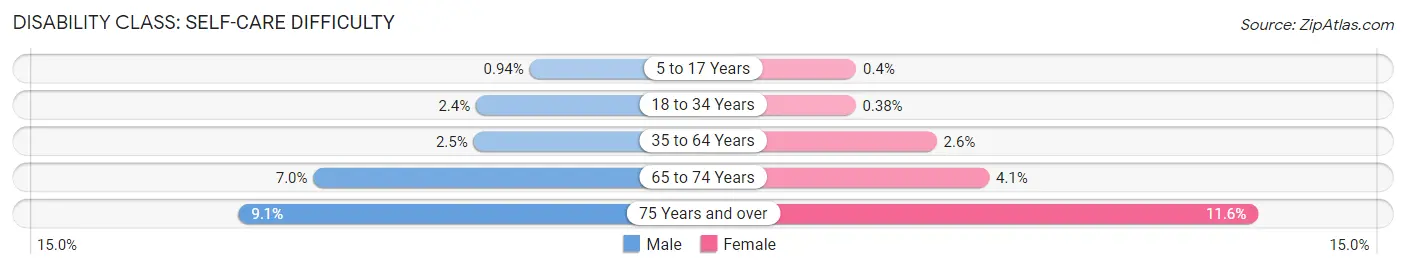
| Age Bracket | Male | Female |
| 5 to 17 Years | 167 (0.9%) | 68 (0.4%) |
| 18 to 34 Years | 499 (2.4%) | 82 (0.4%) |
| 35 to 64 Years | 951 (2.5%) | 1,067 (2.6%) |
| 65 to 74 Years | 711 (7.0%) | 475 (4.1%) |
| 75 Years and over | 518 (9.0%) | 992 (11.6%) |
Technology Access in Anderson County
Computing Device Access in Anderson County
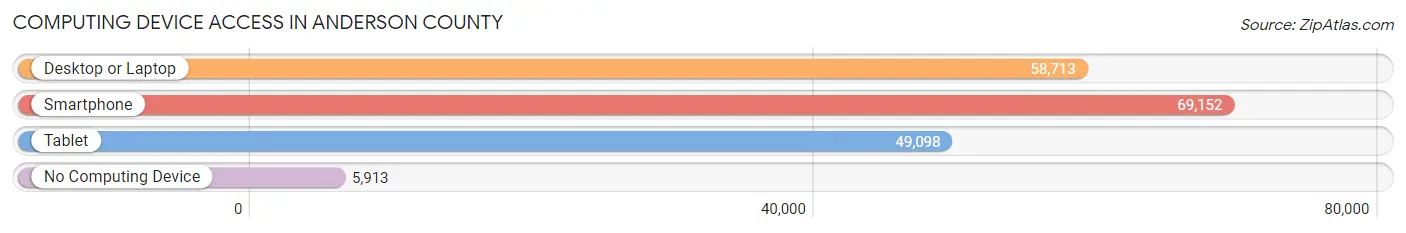
| Device Type | # Households | % Households |
| Desktop or Laptop | 58,713 | 73.1% |
| Smartphone | 69,152 | 86.1% |
| Tablet | 49,098 | 61.1% |
| No Computing Device | 5,913 | 7.4% |
| Total | 80,301 | 100.0% |
Internet Access in Anderson County
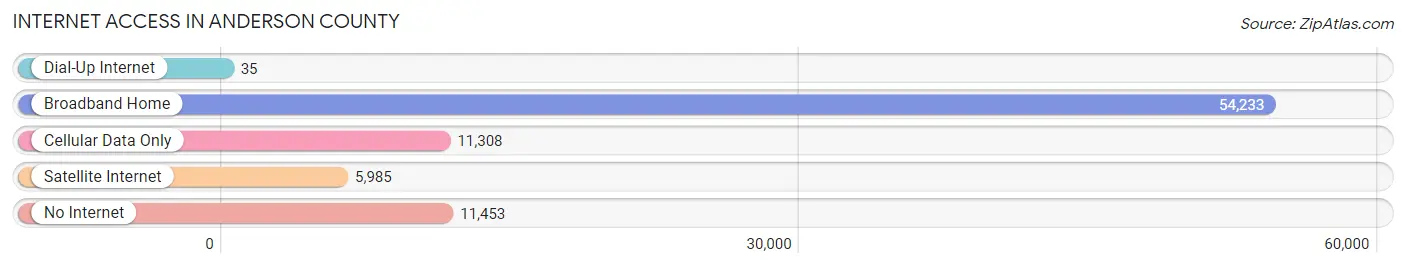
| Internet Type | # Households | % Households |
| Dial-Up Internet | 35 | 0.0% |
| Broadband Home | 54,233 | 67.5% |
| Cellular Data Only | 11,308 | 14.1% |
| Satellite Internet | 5,985 | 7.4% |
| No Internet | 11,453 | 14.3% |
| Total | 80,301 | 100.0% |
Anderson County Summary
Anderson County is located in the Upstate region of South Carolina, and is one of the state’s 46 counties. It is bordered by Abbeville, Greenville, Laurens, Pickens, and Oconee counties. The county seat is Anderson, and the county is named for Revolutionary War leader Robert Anderson.
History
The area that is now Anderson County was originally inhabited by the Cherokee and Catawba Native American tribes. The first European settlers arrived in the area in the late 1700s, and the county was officially established in 1826. The county was named for Robert Anderson, a Revolutionary War hero who fought in the Battle of Cowpens.
The county was largely agricultural in the 19th century, with cotton and tobacco being the main crops. The county also had a thriving textile industry, with several mills being built in the late 1800s. The county was also home to several Confederate military camps during the Civil War.
Geography
Anderson County is located in the Upstate region of South Carolina, and is bordered by Abbeville, Greenville, Laurens, Pickens, and Oconee counties. The county covers an area of 545 square miles, and is home to several rivers and lakes, including the Saluda River, Lake Hartwell, and Lake Russell. The county is also home to several state parks, including Sadlers Creek State Park and Rocky River State Park.
The county is mostly rural, with the majority of the population living in small towns and rural areas. The largest city in the county is Anderson, which is also the county seat. Other cities in the county include Belton, Honea Path, Pendleton, and Williamston.
Economy
The economy of Anderson County is largely based on agriculture and manufacturing. The county is home to several large agricultural operations, including poultry farms, dairy farms, and vegetable farms. The county is also home to several large manufacturing companies, including AnMed Health, Bosch Rexroth, and Michelin North America.
The county is also home to several educational institutions, including Anderson University, Tri-County Technical College, and Clemson University. The county is also home to several tourist attractions, including the Anderson County Museum and the Anderson County Fairgrounds.
Demographics
As of the 2010 census, Anderson County had a population of 187,126. The racial makeup of the county was 79.2% White, 16.2% African American, 0.5% Native American, 1.3% Asian, 0.1% Pacific Islander, 1.7% from other races, and 1.1% from two or more races. Hispanic or Latino of any race were 4.2% of the population.
The median income for a household in the county was $41,945, and the median income for a family was $50,945. The per capita income for the county was $21,845. About 11.2% of families and 15.2% of the population were below the poverty line, including 20.2% of those under age 18 and 10.2% of those age 65 or over.
Common Questions
What is Per Capita Income in Anderson County?
Per Capita income in Anderson County is $33,714.
What is the Median Family Income in Anderson County?
Median Family Income in Anderson County is $75,962.
What is the Median Household income in Anderson County?
Median Household Income in Anderson County is $62,347.
What is Income or Wage Gap in Anderson County?
Income or Wage Gap in Anderson County is 36.6%.
Women in Anderson County earn 63.4 cents for every dollar earned by a man.
What is Family Income Deficit in Anderson County?
Family Income Deficit in Anderson County is $11,980.
Families that are below poverty line in Anderson County earn $11,980 less on average than the poverty threshold level.
What is Inequality or Gini Index in Anderson County?
Inequality or Gini Index in Anderson County is 0.47.
What is the Total Population of Anderson County?
Total Population of Anderson County is 204,592.
What is the Total Male Population of Anderson County?
Total Male Population of Anderson County is 99,223.
What is the Total Female Population of Anderson County?
Total Female Population of Anderson County is 105,369.
What is the Ratio of Males per 100 Females in Anderson County?
There are 94.17 Males per 100 Females in Anderson County.
What is the Ratio of Females per 100 Males in Anderson County?
There are 106.19 Females per 100 Males in Anderson County.
What is the Median Population Age in Anderson County?
Median Population Age in Anderson County is 40.6 Years.
What is the Average Family Size in Anderson County
Average Family Size in Anderson County is 3.0 People.
What is the Average Household Size in Anderson County
Average Household Size in Anderson County is 2.5 People.
How Large is the Labor Force in Anderson County?
There are 98,648 People in the Labor Forcein in Anderson County.
What is the Percentage of People in the Labor Force in Anderson County?
60.3% of People are in the Labor Force in Anderson County.
What is the Unemployment Rate in Anderson County?
Unemployment Rate in Anderson County is 5.5%.