Cities with the Highest Percentage of Immigrants from Sri Lanka in the United States
RELATED REPORTS & OPTIONS
Sri Lanka
United States
Compare Cities
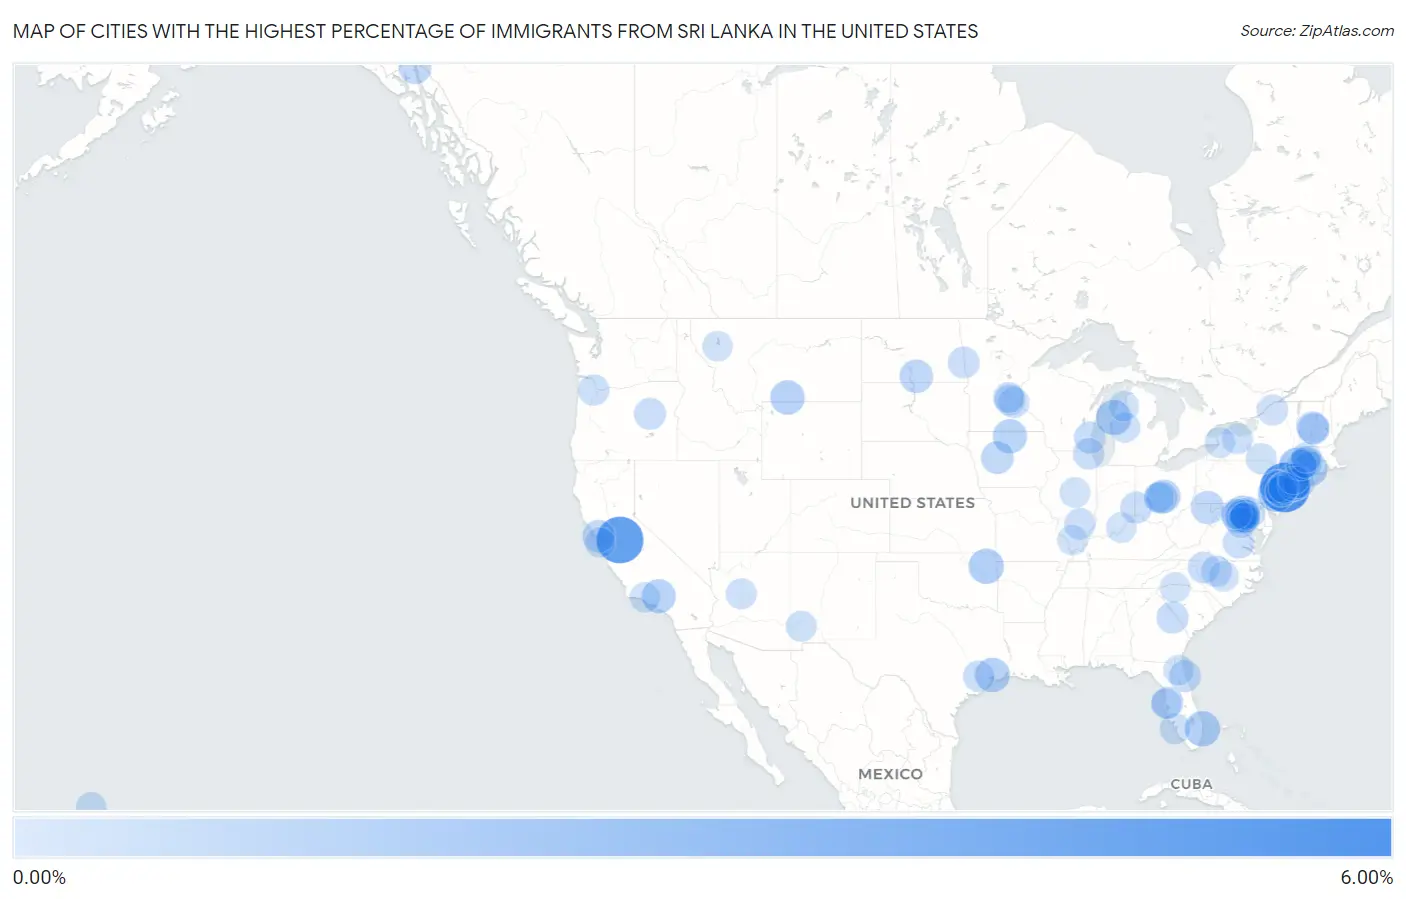
Map of Cities with the Highest Percentage of Immigrants from Sri Lanka in the United States
0.00%
6.00%
Cities with the Highest Percentage of Immigrants from Sri Lanka in the United States
| City | Sri Lanka | vs State | vs National | |
| 1. | Sewaren | 5.05% | 0.038%(+5.01)#45 | 0.017%(+5.03)#346 |
| 2. | Del Rio | 4.36% | 0.029%(+4.33)#-1 | 0.017%(+4.35)#347 |
| 3. | New Preston | 2.05% | 0.032%(+2.02)#-1 | 0.017%(+2.03)#348 |
| 4. | Woodside | 1.81% | 0.0088%(+1.80)#-1 | 0.017%(+1.79)#349 |
| 5. | Stronach | 1.56% | 0.011%(+1.55)#-1 | 0.017%(+1.55)#350 |
| 6. | Gulf Stream | 1.53% | 0.012%(+1.52)#-1 | 0.017%(+1.52)#351 |
| 7. | Sportsmen Acres | 1.52% | 0.0047%(+1.52)#-1 | 0.017%(+1.50)#352 |
| 8. | Lake Pocotopaug | 1.45% | 0.032%(+1.42)#0 | 0.017%(+1.43)#353 |
| 9. | Mont Belvieu | 1.37% | 0.019%(+1.35)#-1 | 0.017%(+1.36)#354 |
| 10. | Red Lodge | 1.34% | 0.017%(+1.32)#-1 | 0.017%(+1.32)#355 |
| 11. | Green Knoll | 1.33% | 0.038%(+1.29)#115 | 0.017%(+1.31)#1,086 |
| 12. | Herricks | 1.30% | 0.040%(+1.26)#215 | 0.017%(+1.28)#2,005 |
| 13. | Forest City | 1.27% | 0.015%(+1.25)#-1 | 0.017%(+1.25)#2,006 |
| 14. | Agua Dulce | 1.23% | 0.029%(+1.21)#0 | 0.017%(+1.22)#2,007 |
| 15. | Clarksburg | 1.22% | 0.055%(+1.17)#40 | 0.017%(+1.20)#2,008 |
| 16. | Broadlands | 1.19% | 0.026%(+1.17)#26 | 0.017%(+1.18)#2,009 |
| 17. | Port Reading | 1.14% | 0.038%(+1.10)#116 | 0.017%(+1.12)#2,010 |
| 18. | Linton | 1.13% | 0.011%(+1.12)#-1 | 0.017%(+1.11)#2,011 |
| 19. | New Albany | 1.10% | 0.012%(+1.09)#-1 | 0.017%(+1.09)#2,012 |
| 20. | Kingwood | 1.03% | 0.0069%(+1.03)#-1 | 0.017%(+1.02)#2,013 |
| 21. | Churdan | 0.97% | 0.015%(+0.956)#0 | 0.017%(+0.954)#2,014 |
| 22. | Haines | 0.96% | 0.0059%(+0.959)#-1 | 0.017%(+0.948)#2,015 |
| 23. | Mountain Lakes Borough | 0.96% | 0.038%(+0.918)#117 | 0.017%(+0.939)#2,016 |
| 24. | Kentfield | 0.94% | 0.029%(+0.916)#1 | 0.017%(+0.928)#2,017 |
| 25. | South Plainfield Borough | 0.93% | 0.038%(+0.893)#118 | 0.017%(+0.914)#2,018 |
| 26. | Othello | 0.91% | 0.038%(+0.871)#119 | 0.017%(+0.892)#2,019 |
| 27. | Clinton | 0.90% | 0.038%(+0.863)#120 | 0.017%(+0.884)#2,020 |
| 28. | Minerva Park | 0.90% | 0.012%(+0.885)#8 | 0.017%(+0.880)#2,021 |
| 29. | Carolina Meadows | 0.87% | 0.0098%(+0.858)#-1 | 0.017%(+0.851)#2,022 |
| 30. | Simsbury Center | 0.83% | 0.032%(+0.803)#1 | 0.017%(+0.818)#2,023 |
| 31. | Wilder | 0.83% | 0.013%(+0.813)#3 | 0.017%(+0.808)#2,024 |
| 32. | Franklin Park | 0.82% | 0.038%(+0.782)#121 | 0.017%(+0.802)#2,025 |
| 33. | Garden City Park | 0.80% | 0.040%(+0.758)#216 | 0.017%(+0.780)#2,026 |
| 34. | Fairview Borough | 0.78% | 0.038%(+0.746)#122 | 0.017%(+0.766)#2,027 |
| 35. | Wormleysburg Borough | 0.75% | 0.0088%(+0.743)#0 | 0.017%(+0.735)#2,028 |
| 36. | Upper Brookville | 0.74% | 0.040%(+0.705)#217 | 0.017%(+0.728)#2,029 |
| 37. | Blythe | 0.74% | 0.013%(+0.731)#-1 | 0.017%(+0.727)#2,030 |
| 38. | Chelsea Cove | 0.73% | 0.040%(+0.690)#218 | 0.017%(+0.713)#2,031 |
| 39. | Butler Beach | 0.72% | 0.012%(+0.712)#0 | 0.017%(+0.707)#2,032 |
| 40. | River Hills | 0.72% | 0.0054%(+0.714)#-1 | 0.017%(+0.702)#2,033 |
| 41. | John Day | 0.70% | 0.016%(+0.689)#-1 | 0.017%(+0.688)#2,034 |
| 42. | Oxford | 0.70% | 0.012%(+0.691)#9 | 0.017%(+0.686)#2,035 |
| 43. | Commack | 0.70% | 0.040%(+0.662)#219 | 0.017%(+0.685)#2,036 |
| 44. | Mckee | 0.70% | 0.038%(+0.663)#123 | 0.017%(+0.683)#2,037 |
| 45. | Lakeside | 0.68% | 0.026%(+0.659)#27 | 0.017%(+0.667)#2,038 |
| 46. | Oak Ridge | 0.67% | 0.0098%(+0.658)#0 | 0.017%(+0.651)#2,039 |
| 47. | Lebanon | 0.66% | 0.013%(+0.648)#3 | 0.017%(+0.644)#2,040 |
| 48. | Strawberry Cdp Marin County | 0.66% | 0.029%(+0.628)#2 | 0.017%(+0.640)#2,041 |
| 49. | Reile S Acres | 0.66% | 0.011%(+0.646)#0 | 0.017%(+0.639)#2,042 |
| 50. | Hainesville | 0.65% | 0.011%(+0.637)#-1 | 0.017%(+0.631)#2,043 |
| 51. | Cheval | 0.64% | 0.012%(+0.632)#1 | 0.017%(+0.627)#2,044 |
| 52. | Xenia | 0.62% | 0.011%(+0.608)#0 | 0.017%(+0.602)#2,045 |
| 53. | Monmouth Junction | 0.61% | 0.038%(+0.567)#124 | 0.017%(+0.588)#2,046 |
| 54. | Cresskill Borough | 0.60% | 0.038%(+0.566)#135 | 0.017%(+0.587)#2,047 |
| 55. | Cinco Ranch | 0.59% | 0.019%(+0.570)#71 | 0.017%(+0.572)#2,048 |
| 56. | Reston | 0.57% | 0.026%(+0.548)#28 | 0.017%(+0.557)#2,049 |
| 57. | Gaithersburg | 0.57% | 0.055%(+0.513)#72 | 0.017%(+0.551)#2,050 |
| 58. | Bethany | 0.56% | 0.016%(+0.549)#3 | 0.017%(+0.548)#2,051 |
| 59. | Dranesville | 0.56% | 0.026%(+0.534)#107 | 0.017%(+0.542)#2,052 |
| 60. | Carrboro | 0.55% | 0.0098%(+0.541)#8 | 0.017%(+0.534)#2,053 |
| 61. | Glenville | 0.55% | 0.032%(+0.515)#26 | 0.017%(+0.529)#2,054 |
| 62. | Golden Valley | 0.54% | 0.016%(+0.522)#-1 | 0.017%(+0.520)#2,055 |
| 63. | Johnson City | 0.53% | 0.040%(+0.486)#220 | 0.017%(+0.508)#2,056 |
| 64. | Canton | 0.52% | 0.040%(+0.485)#229 | 0.017%(+0.507)#2,289 |
| 65. | Corcoran | 0.52% | 0.016%(+0.503)#0 | 0.017%(+0.502)#2,290 |
| 66. | Troy Hills | 0.52% | 0.038%(+0.481)#136 | 0.017%(+0.502)#2,291 |
| 67. | Redland | 0.52% | 0.055%(+0.462)#102 | 0.017%(+0.501)#2,292 |
| 68. | Punta Rassa | 0.51% | 0.012%(+0.499)#2 | 0.017%(+0.494)#2,293 |
| 69. | Arbutus | 0.51% | 0.055%(+0.451)#103 | 0.017%(+0.489)#2,294 |
| 70. | Silver City | 0.50% | 0.0075%(+0.490)#-1 | 0.017%(+0.480)#2,295 |
| 71. | County Center | 0.50% | 0.026%(+0.471)#108 | 0.017%(+0.480)#2,296 |
| 72. | Bogota Borough | 0.49% | 0.038%(+0.454)#137 | 0.017%(+0.475)#2,297 |
| 73. | West Falls Church | 0.49% | 0.026%(+0.466)#135 | 0.017%(+0.475)#2,298 |
| 74. | Brighton | 0.49% | 0.040%(+0.452)#230 | 0.017%(+0.474)#2,299 |
| 75. | Williamson | 0.48% | 0.011%(+0.472)#-1 | 0.017%(+0.466)#2,300 |
| 76. | Hillsborough | 0.47% | 0.038%(+0.433)#138 | 0.017%(+0.454)#2,301 |
| 77. | Aspen Hill | 0.47% | 0.055%(+0.415)#104 | 0.017%(+0.453)#2,302 |
| 78. | Albertville | 0.47% | 0.016%(+0.454)#1 | 0.017%(+0.452)#2,303 |
| 79. | Northwest Harwinton | 0.47% | 0.032%(+0.437)#27 | 0.017%(+0.451)#2,304 |
| 80. | Waianae | 0.47% | 0.016%(+0.449)#-1 | 0.017%(+0.448)#2,305 |
| 81. | West Simsbury | 0.46% | 0.032%(+0.433)#28 | 0.017%(+0.448)#2,306 |
| 82. | Hamilton | 0.45% | 0.026%(+0.419)#136 | 0.017%(+0.428)#2,307 |
| 83. | Eggertsville | 0.44% | 0.040%(+0.405)#231 | 0.017%(+0.427)#2,308 |
| 84. | Sellersburg | 0.44% | 0.012%(+0.430)#-1 | 0.017%(+0.425)#2,309 |
| 85. | Heyworth | 0.44% | 0.011%(+0.429)#1 | 0.017%(+0.423)#2,310 |
| 86. | Friendship Heights Village | 0.44% | 0.055%(+0.385)#105 | 0.017%(+0.423)#2,311 |
| 87. | Millbrae | 0.44% | 0.029%(+0.409)#167 | 0.017%(+0.421)#2,312 |
| 88. | Carbondale | 0.44% | 0.011%(+0.425)#124 | 0.017%(+0.418)#2,313 |
| 89. | Westfield | 0.43% | 0.028%(+0.405)#-1 | 0.017%(+0.417)#2,314 |
| 90. | Westchase | 0.42% | 0.012%(+0.410)#22 | 0.017%(+0.405)#2,315 |
| 91. | Iselin | 0.42% | 0.038%(+0.384)#139 | 0.017%(+0.404)#2,316 |
| 92. | Bellair Meadowbrook Terrace | 0.42% | 0.012%(+0.407)#56 | 0.017%(+0.402)#2,317 |
| 93. | The College Of New Jersey | 0.42% | 0.038%(+0.381)#140 | 0.017%(+0.402)#2,318 |
| 94. | Big Rapids | 0.42% | 0.011%(+0.406)#0 | 0.017%(+0.400)#2,319 |
| 95. | Garner | 0.42% | 0.0098%(+0.407)#41 | 0.017%(+0.400)#2,320 |
| 96. | Hilliard | 0.42% | 0.012%(+0.403)#10 | 0.017%(+0.398)#2,321 |
| 97. | Traverse City | 0.41% | 0.011%(+0.403)#1 | 0.017%(+0.397)#2,322 |
| 98. | Ojai | 0.41% | 0.029%(+0.379)#168 | 0.017%(+0.390)#2,323 |
| 99. | Polson | 0.40% | 0.017%(+0.386)#0 | 0.017%(+0.385)#2,324 |
| 100. | Boiling Springs | 0.39% | 0.0029%(+0.390)#-1 | 0.017%(+0.376)#2,325 |
Common Questions
What are the Top 10 Cities with the Highest Percentage of Immigrants from Sri Lanka in the United States?
Top 10 Cities with the Highest Percentage of Immigrants from Sri Lanka in the United States are:
#1
5.05%
#2
4.36%
#3
2.05%
#4
1.81%
#5
1.56%
#6
1.53%
#7
1.52%
#8
1.45%
#9
1.37%
#10
1.34%
What city has the Highest Percentage of Immigrants from Sri Lanka in the United States?
Sewaren has the Highest Percentage of Immigrants from Sri Lanka in the United States with 5.05%.
What is the Percentage of Immigrants from Sri Lanka in the United States?
Percentage of Immigrants from Sri Lanka in the United States is 0.017%.