Cities with the Most Immigrants from Asia in the United States
RELATED REPORTS & OPTIONS
Asia
United States
Compare Cities
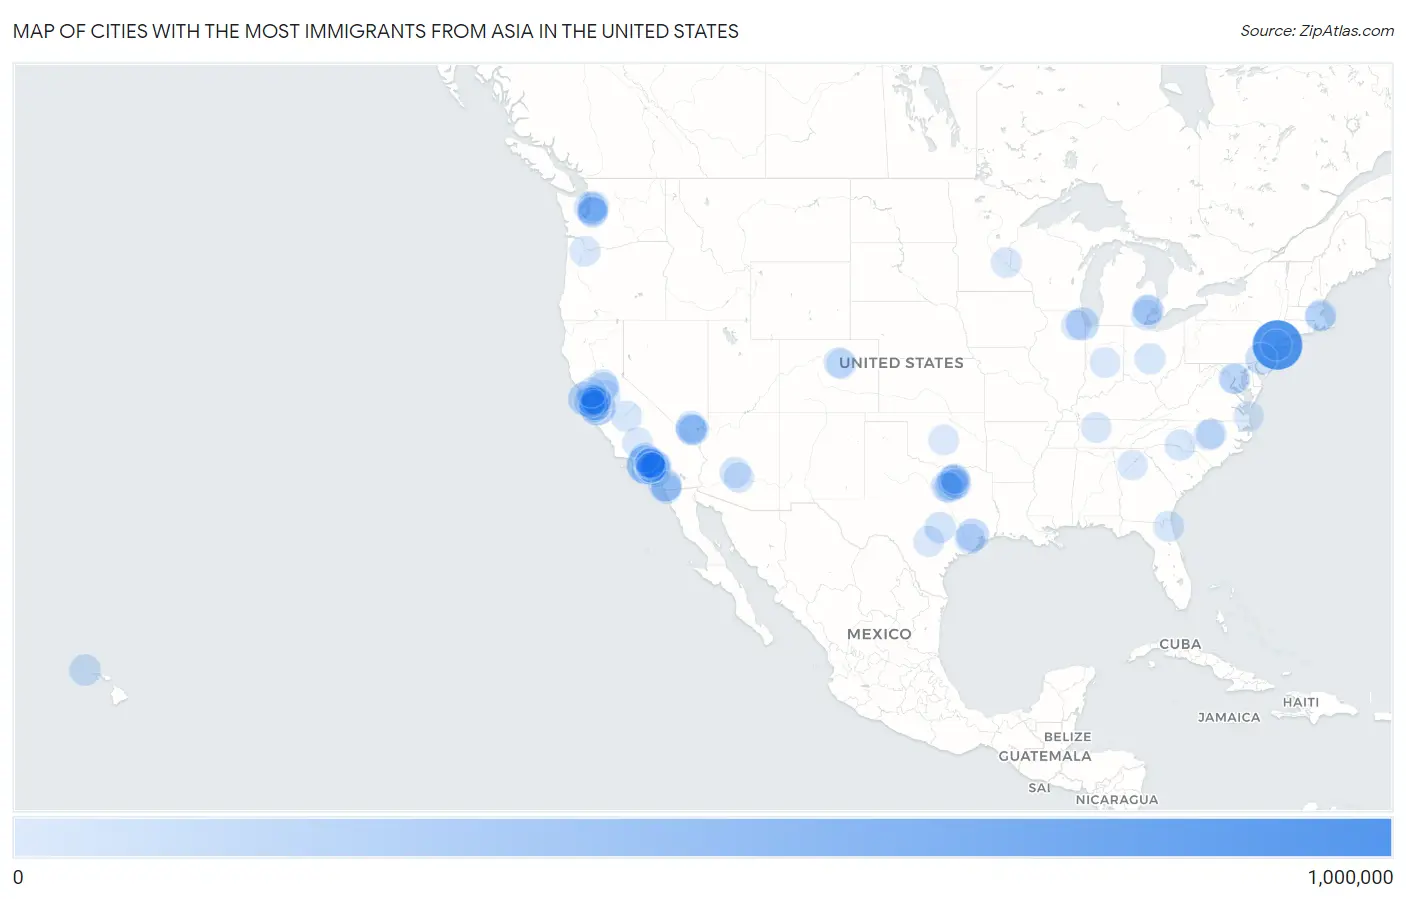
Map of Cities with the Most Immigrants from Asia in the United States
0
1,000,000
Cities with the Most Immigrants from Asia in the United States
| City | Asia | vs State | vs National | |
| 1. | New York | 944,090 | 1,338,407(70.54%)#1 | 14,105,933(6.69%)#1 |
| 2. | Los Angeles | 423,209 | 4,197,463(10.08%)#1 | 14,105,933(3.00%)#2 |
| 3. | San Jose | 268,777 | 4,197,463(6.40%)#2 | 14,105,933(1.91%)#3 |
| 4. | San Francisco | 185,660 | 4,197,463(4.42%)#3 | 14,105,933(1.32%)#4 |
| 5. | San Diego | 162,633 | 4,197,463(3.87%)#4 | 14,105,933(1.15%)#5 |
| 6. | Chicago | 140,551 | 560,341(25.08%)#1 | 14,105,933(1.00%)#6 |
| 7. | Houston | 134,553 | 1,152,369(11.68%)#1 | 14,105,933(0.95%)#7 |
| 8. | Fremont | 97,113 | 4,197,463(2.31%)#5 | 14,105,933(0.69%)#8 |
| 9. | Irvine | 96,749 | 4,197,463(2.30%)#6 | 14,105,933(0.69%)#9 |
| 10. | Philadelphia | 88,719 | 364,461(24.34%)#1 | 14,105,933(0.63%)#10 |
| 11. | Seattle | 82,764 | 510,929(16.20%)#1 | 14,105,933(0.59%)#11 |
| 12. | Urban Honolulu | 79,188 | 200,662(39.46%)#1 | 14,105,933(0.56%)#12 |
| 13. | Glendale | 77,571 | 4,197,463(1.85%)#7 | 14,105,933(0.55%)#13 |
| 14. | Austin | 60,085 | 1,152,369(5.21%)#2 | 14,105,933(0.43%)#14 |
| 15. | Sunnyvale | 59,549 | 4,197,463(1.42%)#8 | 14,105,933(0.42%)#15 |
| 16. | Jersey City | 57,863 | 691,805(8.36%)#1 | 14,105,933(0.41%)#16 |
| 17. | Sacramento | 55,162 | 4,197,463(1.31%)#9 | 14,105,933(0.39%)#17 |
| 18. | Plano | 51,897 | 1,152,369(4.50%)#3 | 14,105,933(0.37%)#18 |
| 19. | Garden Grove | 50,277 | 4,197,463(1.20%)#10 | 14,105,933(0.36%)#19 |
| 20. | Boston | 49,800 | 374,834(13.29%)#1 | 14,105,933(0.35%)#20 |
| 21. | Phoenix | 49,165 | 191,433(25.68%)#1 | 14,105,933(0.35%)#21 |
| 22. | Oakland | 46,859 | 4,197,463(1.12%)#11 | 14,105,933(0.33%)#22 |
| 23. | Charlotte | 45,729 | 246,596(18.54%)#1 | 14,105,933(0.32%)#23 |
| 24. | Anaheim | 44,692 | 4,197,463(1.06%)#12 | 14,105,933(0.32%)#24 |
| 25. | Santa Clara | 44,574 | 4,197,463(1.06%)#13 | 14,105,933(0.32%)#25 |
| 26. | Bellevue | 44,543 | 510,929(8.72%)#2 | 14,105,933(0.32%)#26 |
| 27. | Columbus | 43,515 | 242,488(17.95%)#1 | 14,105,933(0.31%)#27 |
| 28. | Irving | 43,102 | 1,152,369(3.74%)#4 | 14,105,933(0.31%)#28 |
| 29. | Fresno | 42,609 | 4,197,463(1.02%)#14 | 14,105,933(0.30%)#29 |
| 30. | Jacksonville | 39,693 | 486,364(8.16%)#1 | 14,105,933(0.28%)#30 |
| 31. | Daly City | 39,457 | 4,197,463(0.94%)#15 | 14,105,933(0.28%)#31 |
| 32. | Milpitas | 37,685 | 4,197,463(0.90%)#16 | 14,105,933(0.27%)#32 |
| 33. | Portland | 37,267 | 137,513(27.10%)#1 | 14,105,933(0.26%)#33 |
| 34. | San Antonio | 37,139 | 1,152,369(3.22%)#5 | 14,105,933(0.26%)#34 |
| 35. | Dallas | 37,044 | 1,152,369(3.21%)#6 | 14,105,933(0.26%)#35 |
| 36. | Frisco | 35,788 | 1,152,369(3.11%)#7 | 14,105,933(0.25%)#36 |
| 37. | Stockton | 35,598 | 4,197,463(0.85%)#17 | 14,105,933(0.25%)#37 |
| 38. | Las Vegas | 34,825 | 188,343(18.49%)#1 | 14,105,933(0.25%)#38 |
| 39. | Fort Worth | 34,784 | 1,152,369(3.02%)#8 | 14,105,933(0.25%)#39 |
| 40. | Long Beach | 34,670 | 4,197,463(0.83%)#18 | 14,105,933(0.25%)#40 |
| 41. | Hayward | 33,088 | 4,197,463(0.79%)#19 | 14,105,933(0.23%)#41 |
| 42. | Enterprise | 32,526 | 188,343(17.27%)#2 | 14,105,933(0.23%)#42 |
| 43. | Torrance | 31,956 | 4,197,463(0.76%)#20 | 14,105,933(0.23%)#43 |
| 44. | Elk Grove | 31,719 | 4,197,463(0.76%)#21 | 14,105,933(0.22%)#44 |
| 45. | Spring Valley | 31,649 | 188,343(16.80%)#3 | 14,105,933(0.22%)#45 |
| 46. | Westminster | 31,313 | 4,197,463(0.75%)#22 | 14,105,933(0.22%)#46 |
| 47. | St Paul | 30,356 | 177,090(17.14%)#1 | 14,105,933(0.22%)#47 |
| 48. | Sugar Land | 29,959 | 1,152,369(2.60%)#9 | 14,105,933(0.21%)#48 |
| 49. | Alhambra | 29,273 | 4,197,463(0.70%)#23 | 14,105,933(0.21%)#49 |
| 50. | Cupertino | 28,624 | 4,197,463(0.68%)#24 | 14,105,933(0.20%)#50 |
| 51. | Dearborn | 27,829 | 363,163(7.66%)#1 | 14,105,933(0.20%)#51 |
| 52. | Sterling Heights | 27,142 | 363,163(7.47%)#2 | 14,105,933(0.19%)#52 |
| 53. | Monterey Park | 27,080 | 4,197,463(0.65%)#25 | 14,105,933(0.19%)#53 |
| 54. | Indianapolis | 27,048 | 131,472(20.57%)#1 | 14,105,933(0.19%)#54 |
| 55. | Union City | 26,925 | 4,197,463(0.64%)#26 | 14,105,933(0.19%)#55 |
| 56. | Cary | 26,640 | 246,596(10.80%)#2 | 14,105,933(0.19%)#56 |
| 57. | San Ramon | 26,584 | 4,197,463(0.63%)#27 | 14,105,933(0.19%)#57 |
| 58. | Nashville | 26,521 | 109,258(24.27%)#1 | 14,105,933(0.19%)#58 |
| 59. | Arlington | 25,012 | 1,152,369(2.17%)#10 | 14,105,933(0.18%)#59 |
| 60. | Chandler | 24,799 | 191,433(12.95%)#2 | 14,105,933(0.18%)#60 |
| 61. | Santa Ana | 24,738 | 4,197,463(0.59%)#28 | 14,105,933(0.18%)#61 |
| 62. | El Monte | 23,824 | 4,197,463(0.57%)#29 | 14,105,933(0.17%)#62 |
| 63. | Kent | 23,795 | 510,929(4.66%)#3 | 14,105,933(0.17%)#63 |
| 64. | Dublin | 23,735 | 4,197,463(0.57%)#30 | 14,105,933(0.17%)#64 |
| 65. | Redmond | 23,264 | 510,929(4.55%)#4 | 14,105,933(0.16%)#65 |
| 66. | Chula Vista | 23,202 | 4,197,463(0.55%)#31 | 14,105,933(0.16%)#66 |
| 67. | Virginia Beach | 22,787 | 462,056(4.93%)#1 | 14,105,933(0.16%)#67 |
| 68. | Fullerton | 22,766 | 4,197,463(0.54%)#32 | 14,105,933(0.16%)#68 |
| 69. | Rosemead | 22,688 | 4,197,463(0.54%)#33 | 14,105,933(0.16%)#69 |
| 70. | Bakersfield | 22,536 | 4,197,463(0.54%)#34 | 14,105,933(0.16%)#70 |
| 71. | Oklahoma City | 22,420 | 67,760(33.09%)#1 | 14,105,933(0.16%)#71 |
| 72. | West Covina | 22,196 | 4,197,463(0.53%)#35 | 14,105,933(0.16%)#72 |
| 73. | Pleasanton | 22,117 | 4,197,463(0.53%)#36 | 14,105,933(0.16%)#73 |
| 74. | Diamond Bar | 22,033 | 4,197,463(0.52%)#37 | 14,105,933(0.16%)#74 |
| 75. | Quincy | 21,965 | 374,834(5.86%)#2 | 14,105,933(0.16%)#75 |
| 76. | Naperville | 21,764 | 560,341(3.88%)#2 | 14,105,933(0.15%)#76 |
| 77. | Arcadia | 21,690 | 4,197,463(0.52%)#38 | 14,105,933(0.15%)#77 |
| 78. | Garland | 21,615 | 1,152,369(1.88%)#11 | 14,105,933(0.15%)#78 |
| 79. | San Leandro | 21,337 | 4,197,463(0.51%)#39 | 14,105,933(0.15%)#79 |
| 80. | Rowland Heights | 20,812 | 4,197,463(0.50%)#40 | 14,105,933(0.15%)#80 |
| 81. | Arlington | 20,492 | 462,056(4.43%)#2 | 14,105,933(0.15%)#81 |
| 82. | Chino Hills | 19,970 | 4,197,463(0.48%)#41 | 14,105,933(0.14%)#82 |
| 83. | Mountain View | 19,501 | 4,197,463(0.46%)#42 | 14,105,933(0.14%)#83 |
| 84. | Denver | 19,489 | 134,074(14.54%)#1 | 14,105,933(0.14%)#84 |
| 85. | Henderson | 19,407 | 188,343(10.30%)#4 | 14,105,933(0.14%)#85 |
| 86. | Troy | 19,320 | 363,163(5.32%)#3 | 14,105,933(0.14%)#86 |
| 87. | Washington | 19,290 | 19,290(100.00%)#1 | 14,105,933(0.14%)#87 |
| 88. | Aurora | 19,049 | 134,074(14.21%)#2 | 14,105,933(0.14%)#88 |
| 89. | Santa Clarita | 19,018 | 4,197,463(0.45%)#43 | 14,105,933(0.13%)#89 |
| 90. | Johns Creek | 18,768 | 349,085(5.38%)#1 | 14,105,933(0.13%)#90 |
| 91. | El Cajon | 18,742 | 4,197,463(0.45%)#44 | 14,105,933(0.13%)#91 |
| 92. | San Mateo | 18,193 | 4,197,463(0.43%)#45 | 14,105,933(0.13%)#92 |
| 93. | Renton | 18,152 | 510,929(3.55%)#5 | 14,105,933(0.13%)#93 |
| 94. | Vallejo | 17,931 | 4,197,463(0.43%)#46 | 14,105,933(0.13%)#94 |
| 95. | Cerritos | 17,893 | 4,197,463(0.43%)#47 | 14,105,933(0.13%)#95 |
| 96. | Raleigh | 17,708 | 246,596(7.18%)#3 | 14,105,933(0.13%)#96 |
| 97. | Pasadena | 17,505 | 4,197,463(0.42%)#48 | 14,105,933(0.12%)#97 |
| 98. | San Gabriel | 17,500 | 4,197,463(0.42%)#49 | 14,105,933(0.12%)#98 |
| 99. | Buena Park | 17,405 | 4,197,463(0.41%)#50 | 14,105,933(0.12%)#99 |
| 100. | Mckinney | 17,400 | 1,152,369(1.51%)#12 | 14,105,933(0.12%)#100 |
Common Questions
What are the Top 10 Cities with the Most Immigrants from Asia in the United States?
Top 10 Cities with the Most Immigrants from Asia in the United States are:
What city has the Most Immigrants from Asia in the United States?
New York has the Most Immigrants from Asia in the United States with 944,090.
What is the Total Immigrants from Asia in the United States?
Total Immigrants from Asia in the United States is 14,105,933.