Cities with the Highest Percentage of Immigrants from Kazakhstan in the United States
RELATED REPORTS & OPTIONS
Kazakhstan
United States
Compare Cities
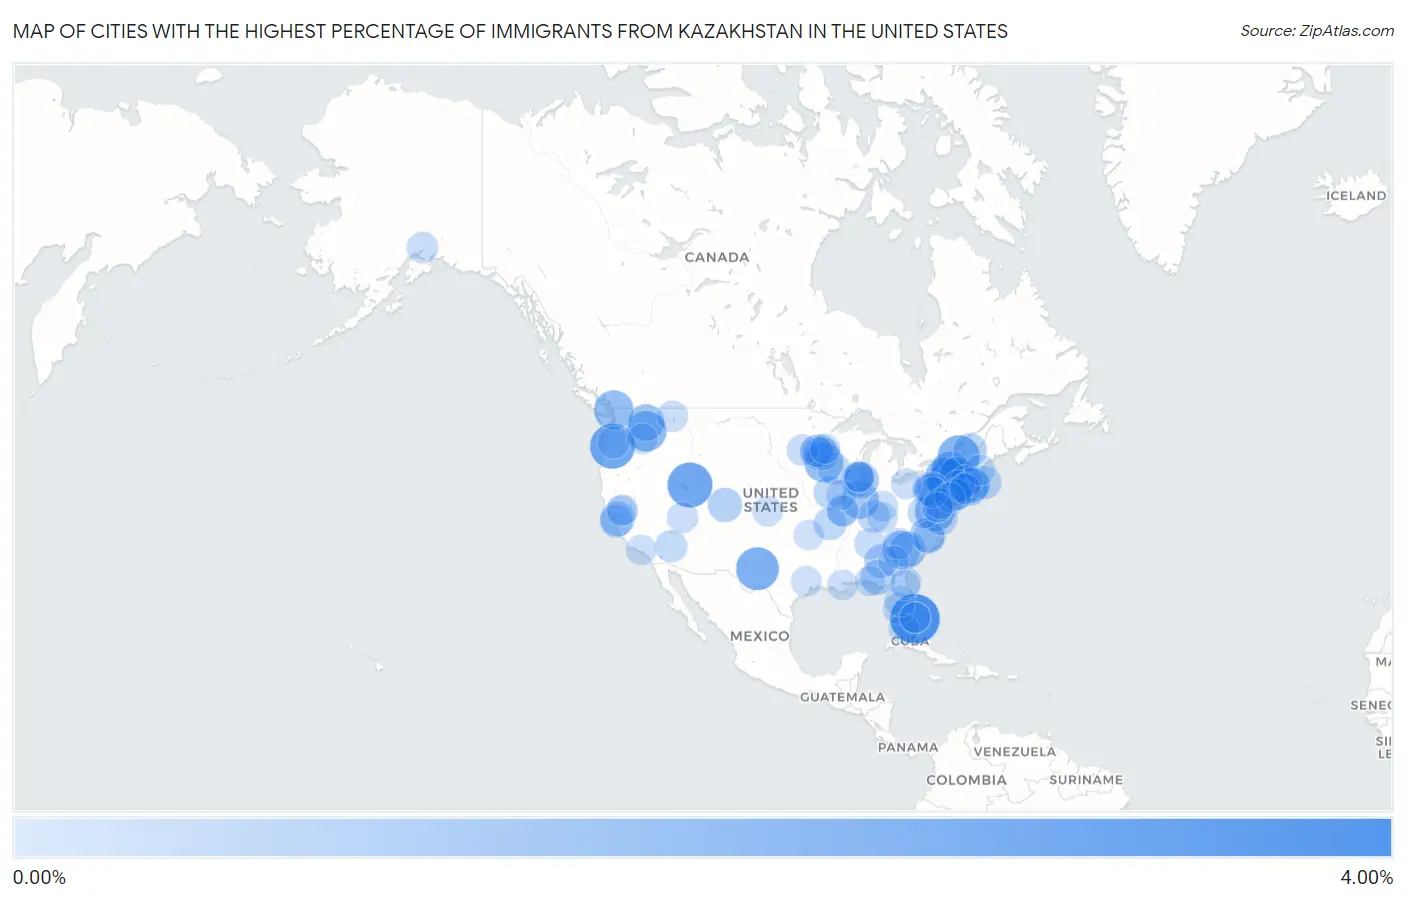
Map of Cities with the Highest Percentage of Immigrants from Kazakhstan in the United States
0.00%
4.00%
Cities with the Highest Percentage of Immigrants from Kazakhstan in the United States
| City | Kazakhstan | vs State | vs National | |
| 1. | Fisher Island | 3.38% | 0.016%(+3.36)#-1 | 0.011%(+3.37)#0 |
| 2. | Narrowsburg | 2.91% | 0.030%(+2.88)#-1 | 0.011%(+2.90)#1 |
| 3. | Liberty | 2.63% | 0.0059%(+2.63)#-1 | 0.011%(+2.62)#2 |
| 4. | Jennings Lodge | 2.61% | 0.027%(+2.58)#-1 | 0.011%(+2.60)#3 |
| 5. | Gardendale | 2.29% | 0.0086%(+2.28)#-1 | 0.011%(+2.28)#4 |
| 6. | Lake Placid | 2.15% | 0.030%(+2.12)#0 | 0.011%(+2.14)#5 |
| 7. | Lacrosse | 1.92% | 0.032%(+1.89)#-1 | 0.011%(+1.91)#6 |
| 8. | Quantico | 1.84% | 0.012%(+1.83)#-1 | 0.011%(+1.83)#7 |
| 9. | Chenango Bridge | 1.83% | 0.030%(+1.80)#1 | 0.011%(+1.82)#8 |
| 10. | Ferndale | 1.75% | 0.032%(+1.72)#25 | 0.011%(+1.74)#548 |
| 11. | Mapleview | 1.72% | 0.013%(+1.71)#-1 | 0.011%(+1.71)#549 |
| 12. | Ninety Six | 1.55% | 0.011%(+1.54)#-1 | 0.011%(+1.54)#550 |
| 13. | Bridgewater | 1.49% | 0.030%(+1.46)#2 | 0.011%(+1.48)#551 |
| 14. | Metcalf | 1.49% | 0.016%(+1.47)#-1 | 0.011%(+1.47)#552 |
| 15. | Oak Brook | 1.41% | 0.016%(+1.40)#1 | 0.011%(+1.40)#553 |
| 16. | Eagleville Cdp Montgomery County | 1.38% | 0.0087%(+1.37)#-1 | 0.011%(+1.36)#554 |
| 17. | Park Forest Village | 1.36% | 0.0087%(+1.35)#0 | 0.011%(+1.35)#555 |
| 18. | Reardan | 1.31% | 0.032%(+1.28)#26 | 0.011%(+1.30)#556 |
| 19. | Preston Potter Hollow | 1.29% | 0.030%(+1.26)#3 | 0.011%(+1.28)#557 |
| 20. | Lake Murray Of Richland | 1.24% | 0.011%(+1.23)#0 | 0.011%(+1.23)#558 |
| 21. | Jordan | 1.22% | 0.013%(+1.21)#0 | 0.011%(+1.21)#559 |
| 22. | Marlene | 1.21% | 0.027%(+1.18)#0 | 0.011%(+1.20)#560 |
| 23. | Long Hill | 1.06% | 0.0091%(+1.05)#-1 | 0.011%(+1.05)#561 |
| 24. | Rolesville | 1.05% | 0.0067%(+1.05)#-1 | 0.011%(+1.04)#562 |
| 25. | Gillette | 1.02% | 0.011%(+1.01)#14 | 0.011%(+1.01)#563 |
| 26. | Jacob City | 1.01% | 0.016%(+0.989)#0 | 0.011%(+0.994)#564 |
| 27. | Fairview | 0.99% | 0.017%(+0.975)#-1 | 0.011%(+0.981)#565 |
| 28. | Aspen | 0.95% | 0.0092%(+0.940)#-1 | 0.011%(+0.938)#566 |
| 29. | Pleasant Gap | 0.93% | 0.0087%(+0.923)#1 | 0.011%(+0.920)#567 |
| 30. | Water Mill | 0.91% | 0.030%(+0.880)#4 | 0.011%(+0.899)#568 |
| 31. | Hamilton | 0.87% | 0.0052%(+0.868)#-1 | 0.011%(+0.862)#569 |
| 32. | North Troy | 0.86% | 0.0076%(+0.849)#-1 | 0.011%(+0.845)#570 |
| 33. | Dilworthtown | 0.83% | 0.0087%(+0.817)#2 | 0.011%(+0.814)#571 |
| 34. | Poquonock Bridge | 0.79% | 0.0091%(+0.782)#0 | 0.011%(+0.780)#572 |
| 35. | Las Flores Cdp Orange County | 0.78% | 0.017%(+0.765)#18 | 0.011%(+0.770)#573 |
| 36. | Sound Beach | 0.77% | 0.030%(+0.739)#5 | 0.011%(+0.758)#574 |
| 37. | West Yarmouth | 0.75% | 0.015%(+0.740)#-1 | 0.011%(+0.743)#575 |
| 38. | Cantril | 0.74% | 0.0021%(+0.739)#-1 | 0.011%(+0.730)#576 |
| 39. | Boothwyn | 0.73% | 0.0087%(+0.718)#3 | 0.011%(+0.715)#577 |
| 40. | Cabool | 0.71% | 0.0030%(+0.705)#-1 | 0.011%(+0.697)#578 |
| 41. | Kilmarnock | 0.70% | 0.012%(+0.688)#0 | 0.011%(+0.690)#579 |
| 42. | East Palo Alto | 0.69% | 0.017%(+0.674)#385 | 0.011%(+0.680)#1,791 |
| 43. | Brownville | 0.69% | 0.011%(+0.676)#15 | 0.011%(+0.676)#1,792 |
| 44. | Postville | 0.68% | 0.0021%(+0.676)#9 | 0.011%(+0.667)#1,793 |
| 45. | Hampton | 0.68% | 0.013%(+0.663)#1 | 0.011%(+0.666)#1,794 |
| 46. | Collinsville | 0.67% | 0.0091%(+0.658)#1 | 0.011%(+0.655)#1,795 |
| 47. | Muldraugh | 0.66% | 0.0029%(+0.652)#-1 | 0.011%(+0.644)#1,796 |
| 48. | Sycamore Hills | 0.64% | 0.0030%(+0.641)#0 | 0.011%(+0.633)#1,797 |
| 49. | Desert Hills | 0.64% | 0.0060%(+0.635)#2 | 0.011%(+0.630)#1,798 |
| 50. | Micro | 0.63% | 0.0067%(+0.622)#0 | 0.011%(+0.618)#1,799 |
| 51. | Meadow Glade | 0.63% | 0.032%(+0.596)#27 | 0.011%(+0.616)#1,800 |
| 52. | Crugers | 0.61% | 0.030%(+0.584)#6 | 0.011%(+0.603)#1,801 |
| 53. | Mount Crawford | 0.59% | 0.012%(+0.577)#1 | 0.011%(+0.578)#1,802 |
| 54. | South Venice | 0.54% | 0.016%(+0.522)#1 | 0.011%(+0.527)#1,803 |
| 55. | Fulton | 0.53% | 0.010%(+0.524)#-1 | 0.011%(+0.522)#1,804 |
| 56. | Stormstown | 0.53% | 0.0087%(+0.519)#4 | 0.011%(+0.516)#1,805 |
| 57. | Lester Prairie | 0.52% | 0.013%(+0.508)#2 | 0.011%(+0.510)#1,806 |
| 58. | Tanaina | 0.52% | 0.0076%(+0.509)#-1 | 0.011%(+0.505)#1,807 |
| 59. | Moores Mill | 0.52% | 0.0038%(+0.512)#12 | 0.011%(+0.505)#1,808 |
| 60. | Dawson | 0.51% | 0.013%(+0.498)#3 | 0.011%(+0.500)#1,809 |
| 61. | Robertsville | 0.50% | 0.011%(+0.487)#16 | 0.011%(+0.487)#1,810 |
| 62. | Green Park | 0.48% | 0.0030%(+0.481)#1 | 0.011%(+0.472)#1,811 |
| 63. | Evergreen | 0.48% | 0.0039%(+0.478)#-1 | 0.011%(+0.470)#1,812 |
| 64. | Sans Souci | 0.47% | 0.011%(+0.461)#1 | 0.011%(+0.461)#1,813 |
| 65. | Mays Chapel | 0.46% | 0.010%(+0.454)#50 | 0.011%(+0.453)#1,814 |
| 66. | Toomsboro | 0.46% | 0.0052%(+0.451)#0 | 0.011%(+0.445)#1,815 |
| 67. | Paragonah | 0.45% | 0.0059%(+0.447)#0 | 0.011%(+0.441)#1,816 |
| 68. | Carver | 0.44% | 0.013%(+0.429)#4 | 0.011%(+0.431)#1,817 |
| 69. | Sunny Isles Beach | 0.44% | 0.016%(+0.426)#22 | 0.011%(+0.430)#1,818 |
| 70. | Lisle | 0.43% | 0.016%(+0.418)#50 | 0.011%(+0.423)#1,819 |
| 71. | Key West | 0.42% | 0.016%(+0.406)#23 | 0.011%(+0.411)#1,820 |
| 72. | Thonotosassa | 0.42% | 0.016%(+0.404)#24 | 0.011%(+0.409)#1,821 |
| 73. | Strodes Mills | 0.42% | 0.0087%(+0.411)#5 | 0.011%(+0.408)#1,822 |
| 74. | West Sacramento | 0.41% | 0.017%(+0.395)#436 | 0.011%(+0.401)#2,154 |
| 75. | Hallandale Beach | 0.40% | 0.016%(+0.388)#67 | 0.011%(+0.393)#2,155 |
| 76. | North Highlands | 0.40% | 0.017%(+0.387)#437 | 0.011%(+0.392)#2,156 |
| 77. | Exeter | 0.40% | 0.0064%(+0.397)#-1 | 0.011%(+0.392)#2,157 |
| 78. | Plymouth Meeting | 0.40% | 0.0087%(+0.391)#6 | 0.011%(+0.388)#2,158 |
| 79. | Panorama Village | 0.40% | 0.0086%(+0.389)#0 | 0.011%(+0.387)#2,159 |
| 80. | North Bend | 0.40% | 0.0054%(+0.392)#-1 | 0.011%(+0.386)#2,160 |
| 81. | Scott City | 0.39% | 0.0039%(+0.384)#-1 | 0.011%(+0.377)#2,161 |
| 82. | Wilmore | 0.38% | 0.0029%(+0.379)#22 | 0.011%(+0.371)#2,162 |
| 83. | Destrehan | 0.38% | 0.0027%(+0.379)#5 | 0.011%(+0.370)#2,163 |
| 84. | Highland Heights | 0.38% | 0.0054%(+0.376)#39 | 0.011%(+0.370)#2,164 |
| 85. | Hidden Hills | 0.38% | 0.017%(+0.363)#438 | 0.011%(+0.369)#2,165 |
| 86. | Garrett | 0.37% | 0.032%(+0.342)#28 | 0.011%(+0.363)#2,166 |
| 87. | Hamilton College | 0.37% | 0.030%(+0.337)#7 | 0.011%(+0.356)#2,167 |
| 88. | Prospect Heights | 0.37% | 0.016%(+0.349)#51 | 0.011%(+0.354)#2,168 |
| 89. | Poquott | 0.36% | 0.030%(+0.331)#8 | 0.011%(+0.350)#2,169 |
| 90. | Jacksonville Beach | 0.36% | 0.016%(+0.345)#68 | 0.011%(+0.349)#2,170 |
| 91. | Hawthorn Woods | 0.35% | 0.016%(+0.335)#52 | 0.011%(+0.340)#2,171 |
| 92. | Industry | 0.35% | 0.016%(+0.334)#53 | 0.011%(+0.339)#2,172 |
| 93. | Forest Glen | 0.35% | 0.010%(+0.340)#51 | 0.011%(+0.339)#2,173 |
| 94. | Long Grove | 0.34% | 0.016%(+0.322)#57 | 0.011%(+0.327)#2,174 |
| 95. | Destin | 0.34% | 0.016%(+0.322)#69 | 0.011%(+0.326)#2,175 |
| 96. | Westport | 0.34% | 0.0091%(+0.328)#2 | 0.011%(+0.326)#2,176 |
| 97. | Woodall | 0.34% | 0.0051%(+0.332)#-1 | 0.011%(+0.326)#2,177 |
| 98. | Suncrest | 0.34% | 0.032%(+0.305)#29 | 0.011%(+0.326)#2,178 |
| 99. | Stillwater | 0.33% | 0.013%(+0.318)#5 | 0.011%(+0.320)#2,179 |
| 100. | World Golf Village | 0.33% | 0.016%(+0.314)#70 | 0.011%(+0.319)#2,180 |
Common Questions
What are the Top 10 Cities with the Highest Percentage of Immigrants from Kazakhstan in the United States?
Top 10 Cities with the Highest Percentage of Immigrants from Kazakhstan in the United States are:
#1
3.38%
#2
2.91%
#3
2.63%
#4
2.61%
#5
2.29%
#6
2.15%
#7
1.92%
#8
1.84%
#9
1.83%
#10
1.75%
What city has the Highest Percentage of Immigrants from Kazakhstan in the United States?
Fisher Island has the Highest Percentage of Immigrants from Kazakhstan in the United States with 3.38%.
What is the Percentage of Immigrants from Kazakhstan in the United States?
Percentage of Immigrants from Kazakhstan in the United States is 0.011%.