Lancaster County, SC Map & Demographics
Lancaster County Map
Lancaster County Overview
$39,172
PER CAPITA INCOME
$87,642
AVG FAMILY INCOME
$72,186
AVG HOUSEHOLD INCOME
29.7%
WAGE / INCOME GAP [ % ]
70.3¢/ $1
WAGE / INCOME GAP [ $ ]
$9,215
FAMILY INCOME DEFICIT
0.46
INEQUALITY / GINI INDEX
97,611
TOTAL POPULATION
47,800
MALE POPULATION
49,811
FEMALE POPULATION
95.96
MALES / 100 FEMALES
104.21
FEMALES / 100 MALES
42.2
MEDIAN AGE
3.0
AVG FAMILY SIZE
2.5
AVG HOUSEHOLD SIZE
45,938
LABOR FORCE [ PEOPLE ]
58.0%
PERCENT IN LABOR FORCE
5.0%
UNEMPLOYMENT RATE
Lancaster County Area Codes
Income in Lancaster County
Income Overview in Lancaster County
Per Capita Income in Lancaster County is $39,172, while median incomes of families and households are $87,642 and $72,186 respectively.
| Characteristic | Number | Measure |
| Per Capita Income | 97,611 | $39,172 |
| Median Family Income | 26,822 | $87,642 |
| Mean Family Income | 26,822 | $107,627 |
| Median Household Income | 37,893 | $72,186 |
| Mean Household Income | 37,893 | $97,132 |
| Income Deficit | 26,822 | $9,215 |
| Wage / Income Gap (%) | 97,611 | 29.70% |
| Wage / Income Gap ($) | 97,611 | 70.30¢ per $1 |
| Gini / Inequality Index | 97,611 | 0.46 |
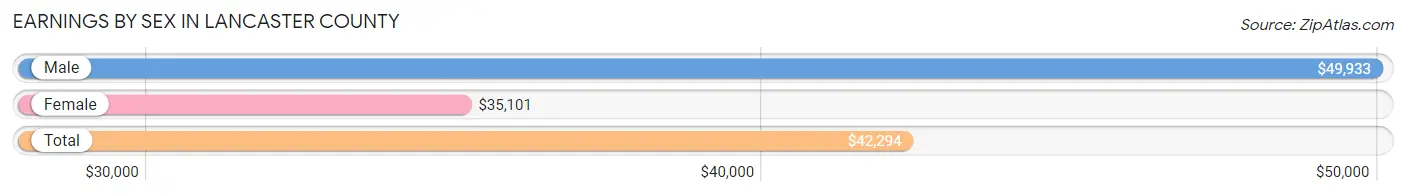
Earnings by Sex in Lancaster County
Average Earnings in Lancaster County are $42,294, $49,933 for men and $35,101 for women, a difference of 29.7%.
| Sex | Number | Average Earnings |
| Male | 24,774 (52.6%) | $49,933 |
| Female | 22,282 (47.3%) | $35,101 |
| Total | 47,056 (100.0%) | $42,294 |
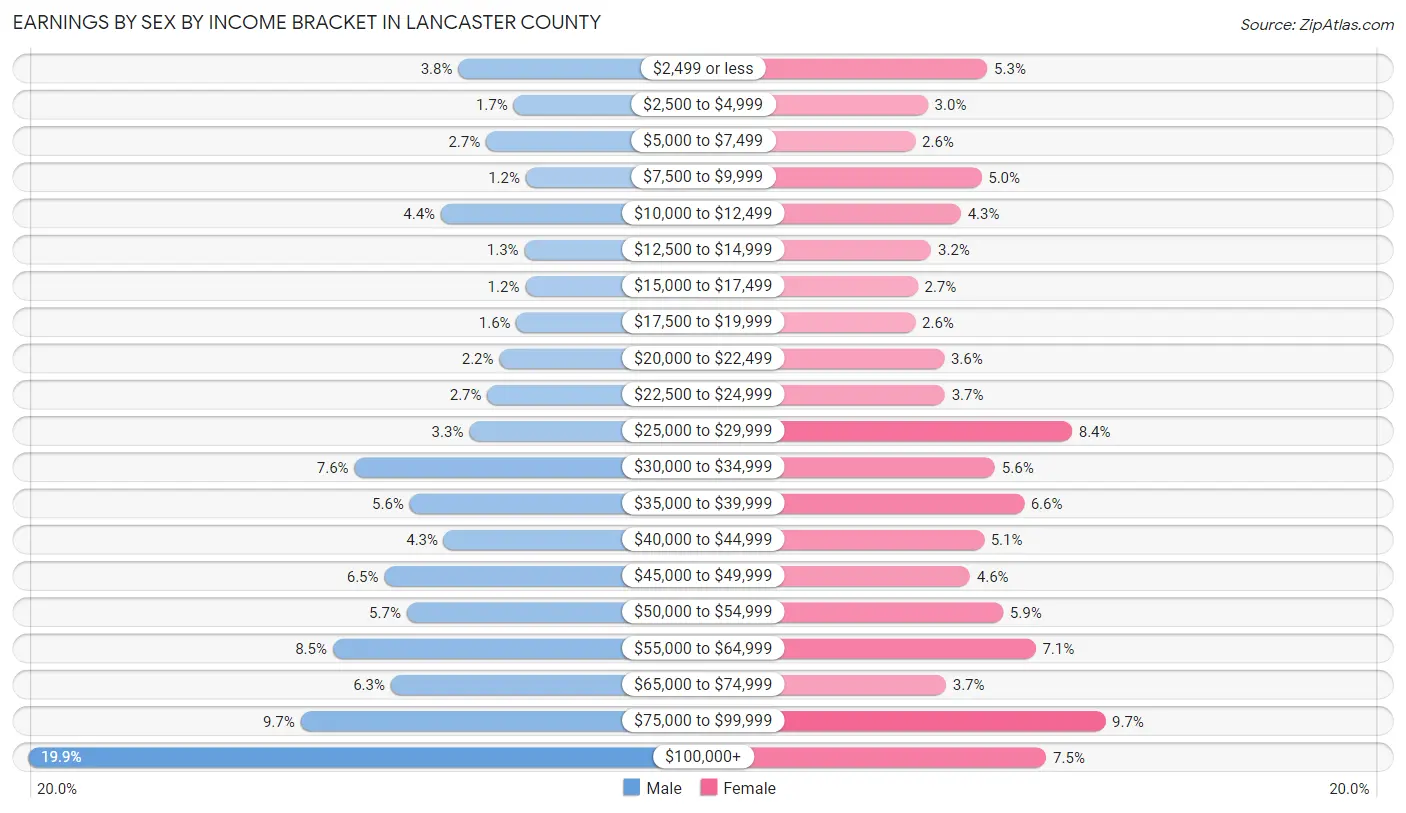
Earnings by Sex by Income Bracket in Lancaster County
The most common earnings brackets in Lancaster County are $100,000+ for men (4,922 | 19.9%) and $75,000 to $99,999 for women (2,158 | 9.7%).
| Income | Male | Female |
| $2,499 or less | 930 (3.7%) | 1,173 (5.3%) |
| $2,500 to $4,999 | 417 (1.7%) | 676 (3.0%) |
| $5,000 to $7,499 | 672 (2.7%) | 571 (2.6%) |
| $7,500 to $9,999 | 303 (1.2%) | 1,124 (5.0%) |
| $10,000 to $12,499 | 1,089 (4.4%) | 952 (4.3%) |
| $12,500 to $14,999 | 314 (1.3%) | 704 (3.2%) |
| $15,000 to $17,499 | 307 (1.2%) | 590 (2.6%) |
| $17,500 to $19,999 | 389 (1.6%) | 571 (2.6%) |
| $20,000 to $22,499 | 548 (2.2%) | 812 (3.6%) |
| $22,500 to $24,999 | 658 (2.7%) | 817 (3.7%) |
| $25,000 to $29,999 | 827 (3.3%) | 1,879 (8.4%) |
| $30,000 to $34,999 | 1,893 (7.6%) | 1,236 (5.6%) |
| $35,000 to $39,999 | 1,381 (5.6%) | 1,478 (6.6%) |
| $40,000 to $44,999 | 1,063 (4.3%) | 1,142 (5.1%) |
| $45,000 to $49,999 | 1,615 (6.5%) | 1,028 (4.6%) |
| $50,000 to $54,999 | 1,406 (5.7%) | 1,303 (5.9%) |
| $55,000 to $64,999 | 2,093 (8.5%) | 1,576 (7.1%) |
| $65,000 to $74,999 | 1,555 (6.3%) | 827 (3.7%) |
| $75,000 to $99,999 | 2,392 (9.7%) | 2,158 (9.7%) |
| $100,000+ | 4,922 (19.9%) | 1,665 (7.5%) |
| Total | 24,774 (100.0%) | 22,282 (100.0%) |
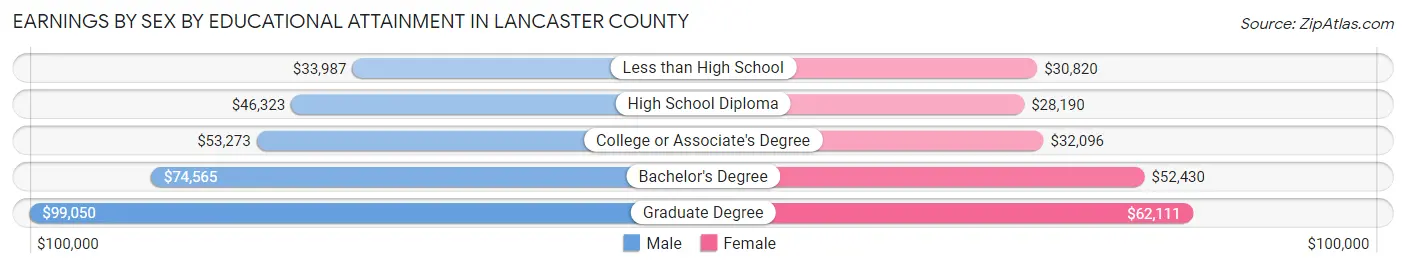
Earnings by Sex by Educational Attainment in Lancaster County
Average earnings in Lancaster County are $54,045 for men and $38,700 for women, a difference of 28.4%. Men with an educational attainment of graduate degree enjoy the highest average annual earnings of $99,050, while those with less than high school education earn the least with $33,987. Women with an educational attainment of graduate degree earn the most with the average annual earnings of $62,111, while those with high school diploma education have the smallest earnings of $28,190.
| Educational Attainment | Male Income | Female Income |
| Less than High School | $33,987 | $30,820 |
| High School Diploma | $46,323 | $28,190 |
| College or Associate's Degree | $53,273 | $32,096 |
| Bachelor's Degree | $74,565 | $52,430 |
| Graduate Degree | $99,050 | $62,111 |
| Total | $54,045 | $38,700 |
Family Income in Lancaster County
Family Income Brackets in Lancaster County
According to the Lancaster County family income data, there are 6,169 families falling into the $100,000 to $149,999 income range, which is the most common income bracket and makes up 23.0% of all families. Conversely, the less than $10,000 income bracket is the least frequent group with only 671 families (2.5%) belonging to this category.
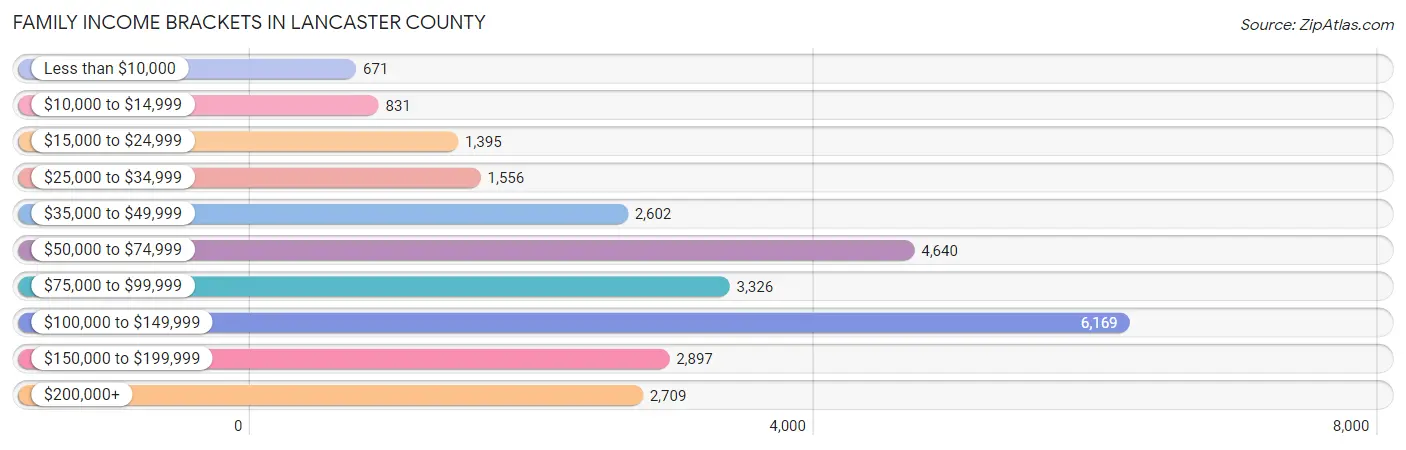
| Income Bracket | # Families | % Families |
| Less than $10,000 | 671 | 2.5% |
| $10,000 to $14,999 | 831 | 3.1% |
| $15,000 to $24,999 | 1,395 | 5.2% |
| $25,000 to $34,999 | 1,556 | 5.8% |
| $35,000 to $49,999 | 2,602 | 9.7% |
| $50,000 to $74,999 | 4,640 | 17.3% |
| $75,000 to $99,999 | 3,326 | 12.4% |
| $100,000 to $149,999 | 6,169 | 23.0% |
| $150,000 to $199,999 | 2,897 | 10.8% |
| $200,000+ | 2,709 | 10.1% |
Family Income by Famaliy Size in Lancaster County
6-person families (575 | 2.1%) account for the highest median family income in Lancaster County with $115,568 per family, while 2-person families (14,049 | 52.4%) have the highest median income of $37,186 per family member.
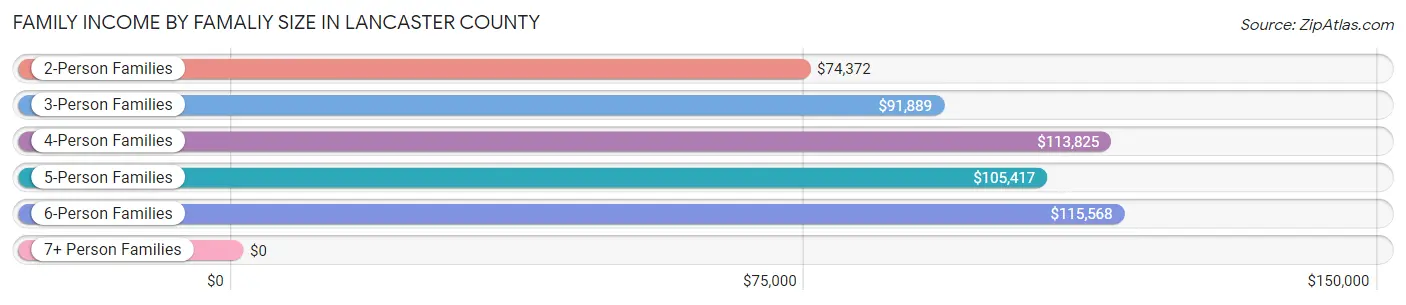
| Income Bracket | # Families | Median Income |
| 2-Person Families | 14,049 (52.4%) | $74,372 |
| 3-Person Families | 5,211 (19.4%) | $91,889 |
| 4-Person Families | 5,037 (18.8%) | $113,825 |
| 5-Person Families | 1,798 (6.7%) | $105,417 |
| 6-Person Families | 575 (2.1%) | $115,568 |
| 7+ Person Families | 152 (0.6%) | $0 |
| Total | 26,822 (100.0%) | $87,642 |
Family Income by Number of Earners in Lancaster County
The median family income in Lancaster County is $87,642, with families comprising 3+ earners (2,154) having the highest median family income of $112,760, while families with no earners (5,998) have the lowest median family income of $55,738, accounting for 8.0% and 22.4% of families, respectively.
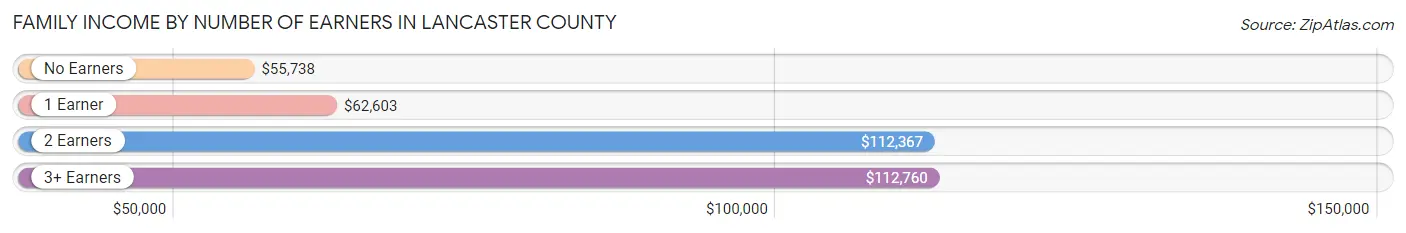
| Number of Earners | # Families | Median Income |
| No Earners | 5,998 (22.4%) | $55,738 |
| 1 Earner | 7,914 (29.5%) | $62,603 |
| 2 Earners | 10,756 (40.1%) | $112,367 |
| 3+ Earners | 2,154 (8.0%) | $112,760 |
| Total | 26,822 (100.0%) | $87,642 |
Household Income in Lancaster County
Household Income Brackets in Lancaster County
With 6,745 households falling in the category, the $100,000 to $149,999 income range is the most frequent in Lancaster County, accounting for 17.8% of all households. In contrast, only 1,402 households (3.7%) fall into the less than $10,000 income bracket, making it the least populous group.
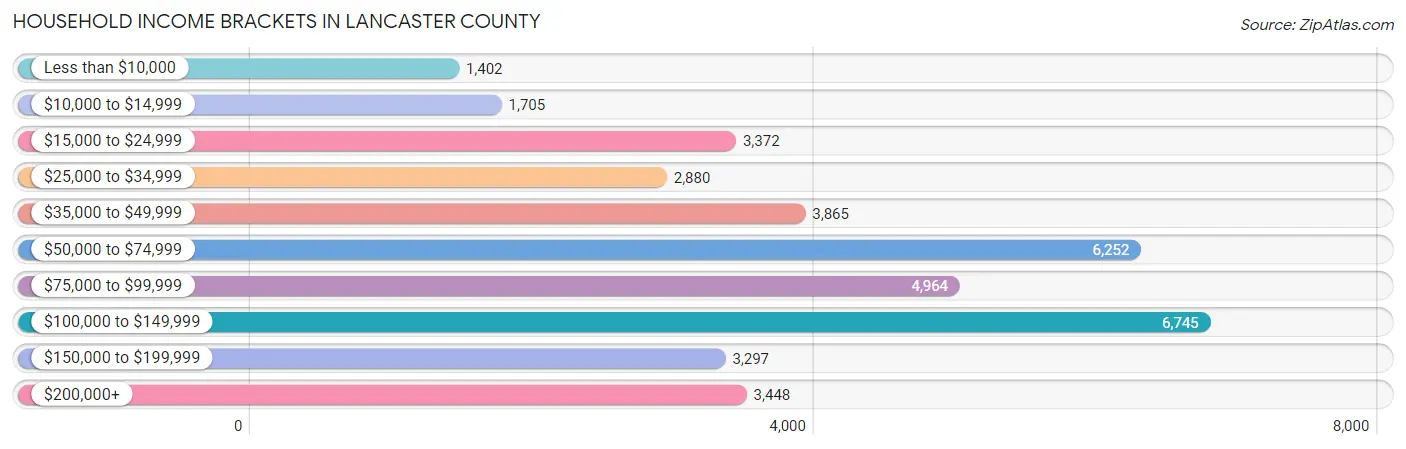
| Income Bracket | # Households | % Households |
| Less than $10,000 | 1,402 | 3.7% |
| $10,000 to $14,999 | 1,705 | 4.5% |
| $15,000 to $24,999 | 3,372 | 8.9% |
| $25,000 to $34,999 | 2,880 | 7.6% |
| $35,000 to $49,999 | 3,865 | 10.2% |
| $50,000 to $74,999 | 6,252 | 16.5% |
| $75,000 to $99,999 | 4,964 | 13.1% |
| $100,000 to $149,999 | 6,745 | 17.8% |
| $150,000 to $199,999 | 3,297 | 8.7% |
| $200,000+ | 3,448 | 9.1% |
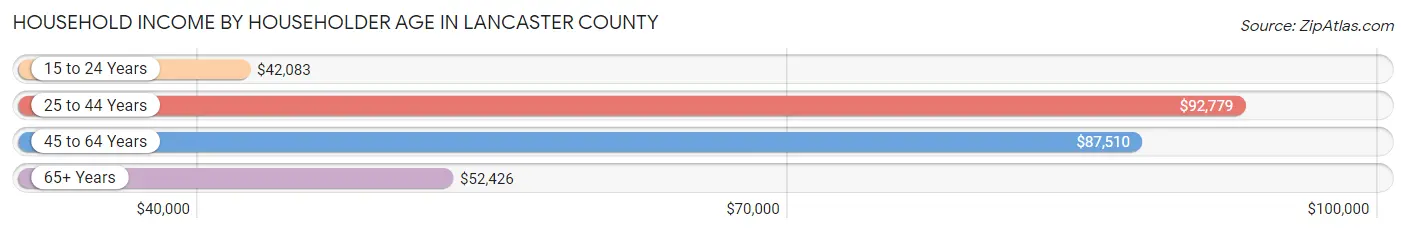
Household Income by Householder Age in Lancaster County
The median household income in Lancaster County is $72,186, with the highest median household income of $92,779 found in the 25 to 44 years age bracket for the primary householder. A total of 10,692 households (28.2%) fall into this category. Meanwhile, the 15 to 24 years age bracket for the primary householder has the lowest median household income of $42,083, with 685 households (1.8%) in this group.
| Income Bracket | # Households | Median Income |
| 15 to 24 Years | 685 (1.8%) | $42,083 |
| 25 to 44 Years | 10,692 (28.2%) | $92,779 |
| 45 to 64 Years | 14,019 (37.0%) | $87,510 |
| 65+ Years | 12,497 (33.0%) | $52,426 |
| Total | 37,893 (100.0%) | $72,186 |
Poverty in Lancaster County
Income Below Poverty by Sex and Age in Lancaster County
With 11.1% poverty level for males and 13.1% for females among the residents of Lancaster County, 5 year old males and 15 year old females are the most vulnerable to poverty, with 145 males (38.1%) and 110 females (21.5%) in their respective age groups living below the poverty level.
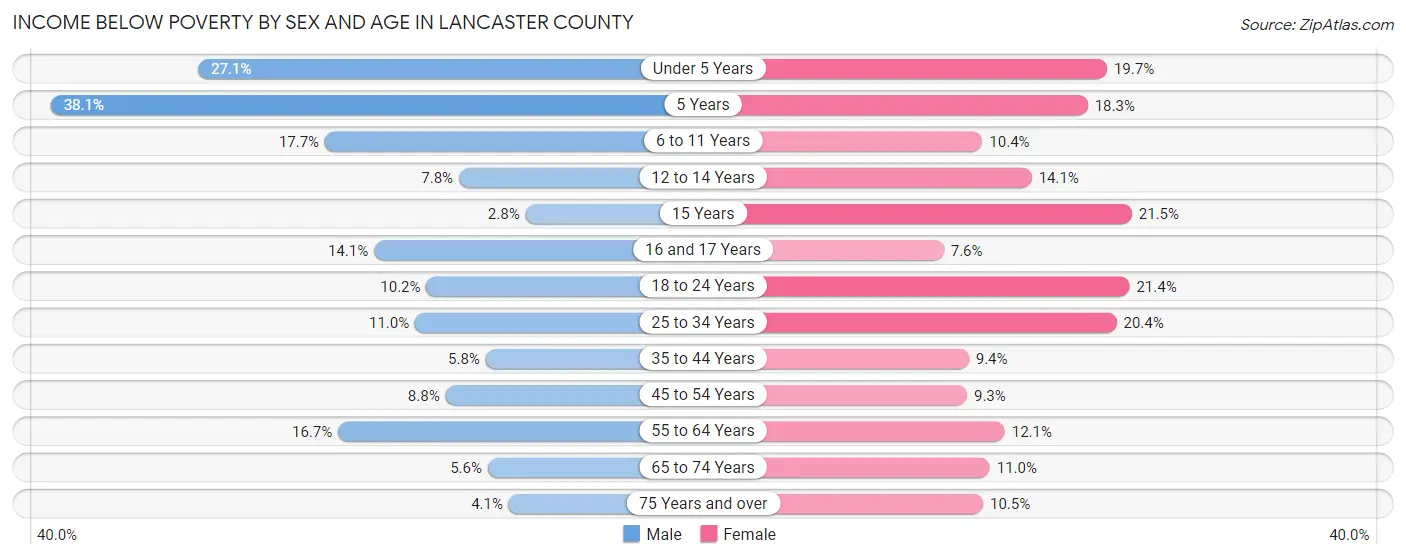
| Age Bracket | Male | Female |
| Under 5 Years | 728 (27.1%) | 510 (19.7%) |
| 5 Years | 145 (38.1%) | 130 (18.3%) |
| 6 to 11 Years | 617 (17.7%) | 335 (10.4%) |
| 12 to 14 Years | 165 (7.7%) | 254 (14.1%) |
| 15 Years | 10 (2.8%) | 110 (21.5%) |
| 16 and 17 Years | 188 (14.1%) | 86 (7.6%) |
| 18 to 24 Years | 319 (10.2%) | 668 (21.4%) |
| 25 to 34 Years | 617 (11.0%) | 1,156 (20.4%) |
| 35 to 44 Years | 340 (5.8%) | 611 (9.4%) |
| 45 to 54 Years | 540 (8.7%) | 579 (9.3%) |
| 55 to 64 Years | 978 (16.7%) | 785 (12.1%) |
| 65 to 74 Years | 309 (5.6%) | 735 (11.0%) |
| 75 Years and over | 148 (4.1%) | 483 (10.5%) |
| Total | 5,104 (11.1%) | 6,442 (13.1%) |
Income Above Poverty by Sex and Age in Lancaster County
According to the poverty statistics in Lancaster County, males aged 15 years and females aged 16 and 17 years are the age groups that are most secure financially, with 97.2% of males and 92.4% of females in these age groups living above the poverty line.
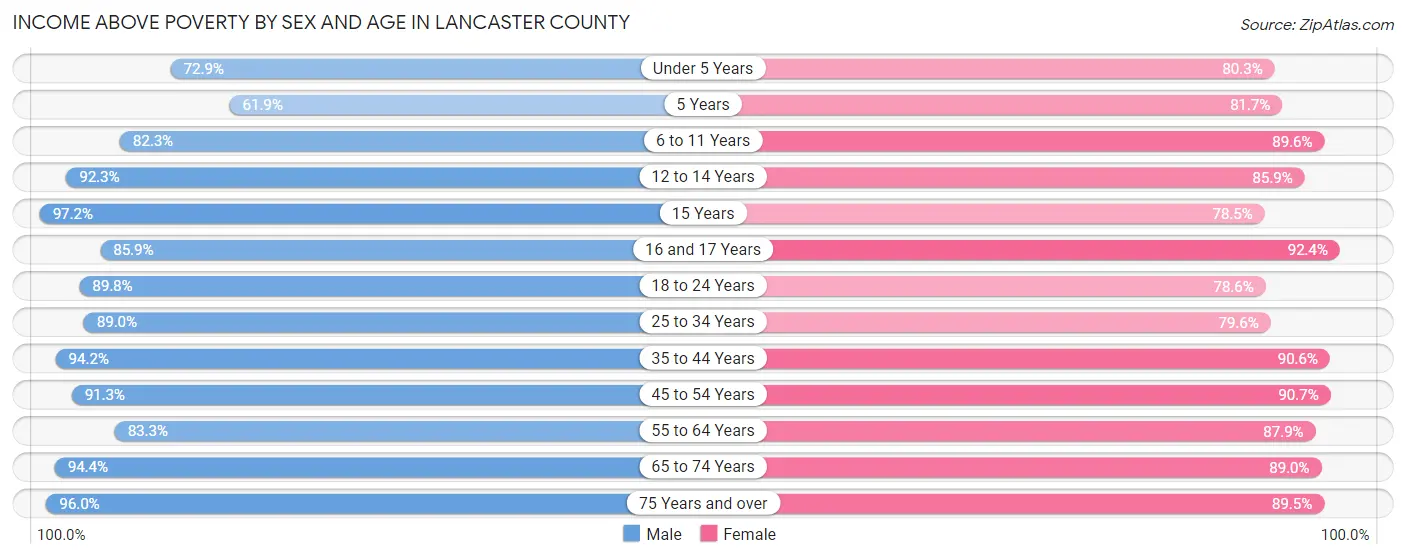
| Age Bracket | Male | Female |
| Under 5 Years | 1,956 (72.9%) | 2,080 (80.3%) |
| 5 Years | 236 (61.9%) | 582 (81.7%) |
| 6 to 11 Years | 2,868 (82.3%) | 2,873 (89.6%) |
| 12 to 14 Years | 1,964 (92.2%) | 1,547 (85.9%) |
| 15 Years | 346 (97.2%) | 401 (78.5%) |
| 16 and 17 Years | 1,149 (85.9%) | 1,050 (92.4%) |
| 18 to 24 Years | 2,817 (89.8%) | 2,459 (78.6%) |
| 25 to 34 Years | 4,988 (89.0%) | 4,511 (79.6%) |
| 35 to 44 Years | 5,550 (94.2%) | 5,869 (90.6%) |
| 45 to 54 Years | 5,629 (91.2%) | 5,646 (90.7%) |
| 55 to 64 Years | 4,869 (83.3%) | 5,701 (87.9%) |
| 65 to 74 Years | 5,202 (94.4%) | 5,955 (89.0%) |
| 75 Years and over | 3,508 (96.0%) | 4,123 (89.5%) |
| Total | 41,082 (88.9%) | 42,797 (86.9%) |
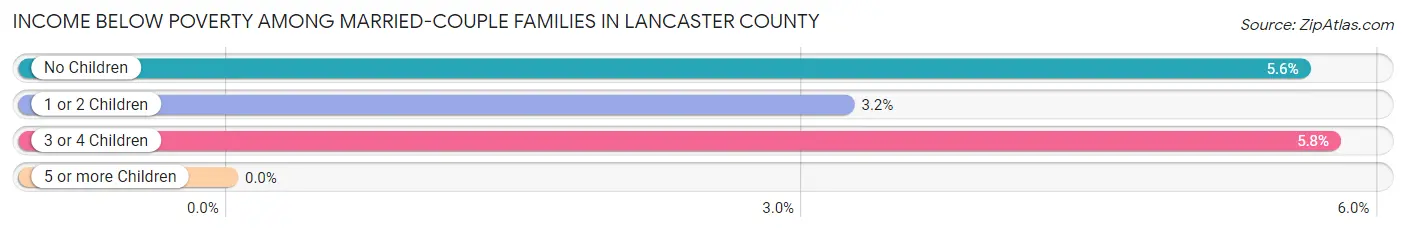
Income Below Poverty Among Married-Couple Families in Lancaster County
The poverty statistics for married-couple families in Lancaster County show that 4.9% or 1,022 of the total 20,994 families live below the poverty line. Families with 3 or 4 children have the highest poverty rate of 5.8%, comprising of 86 families. On the other hand, families with 5 or more children have the lowest poverty rate of 0.0%, which includes 0 families.
| Children | Above Poverty | Below Poverty |
| No Children | 12,231 (94.4%) | 726 (5.6%) |
| 1 or 2 Children | 6,320 (96.8%) | 210 (3.2%) |
| 3 or 4 Children | 1,407 (94.2%) | 86 (5.8%) |
| 5 or more Children | 14 (100.0%) | 0 (0.0%) |
| Total | 19,972 (95.1%) | 1,022 (4.9%) |
Income Below Poverty Among Single-Parent Households in Lancaster County
According to the poverty data in Lancaster County, 8.6% or 112 single-father households and 31.1% or 1,409 single-mother households are living below the poverty line. Among single-father households, those with 1 or 2 children have the highest poverty rate, with 81 households (13.2%) experiencing poverty. Likewise, among single-mother households, those with 3 or 4 children have the highest poverty rate, with 376 households (76.3%) falling below the poverty line.
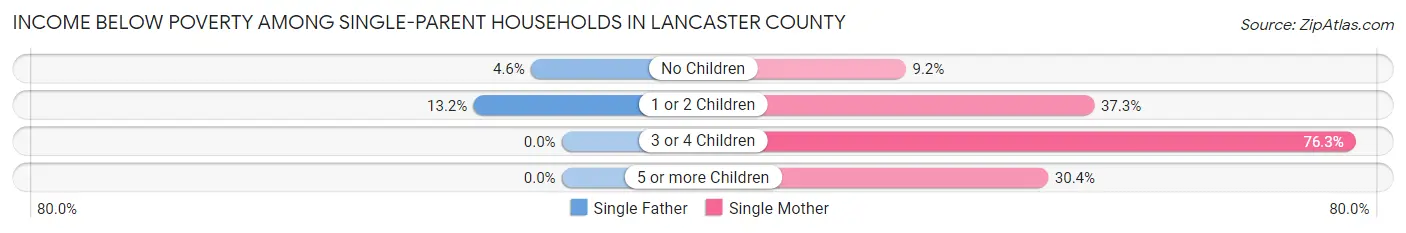
| Children | Single Father | Single Mother |
| No Children | 31 (4.6%) | 155 (9.2%) |
| 1 or 2 Children | 81 (13.2%) | 871 (37.3%) |
| 3 or 4 Children | 0 (0.0%) | 376 (76.3%) |
| 5 or more Children | 0 (0.0%) | 7 (30.4%) |
| Total | 112 (8.6%) | 1,409 (31.1%) |
Income Below Poverty Among Married-Couple vs Single-Parent Households in Lancaster County
The poverty data for Lancaster County shows that 1,022 of the married-couple family households (4.9%) and 1,521 of the single-parent households (26.1%) are living below the poverty level. Within the married-couple family households, those with 3 or 4 children have the highest poverty rate, with 86 households (5.8%) falling below the poverty line. Among the single-parent households, those with 3 or 4 children have the highest poverty rate, with 376 household (75.2%) living below poverty.
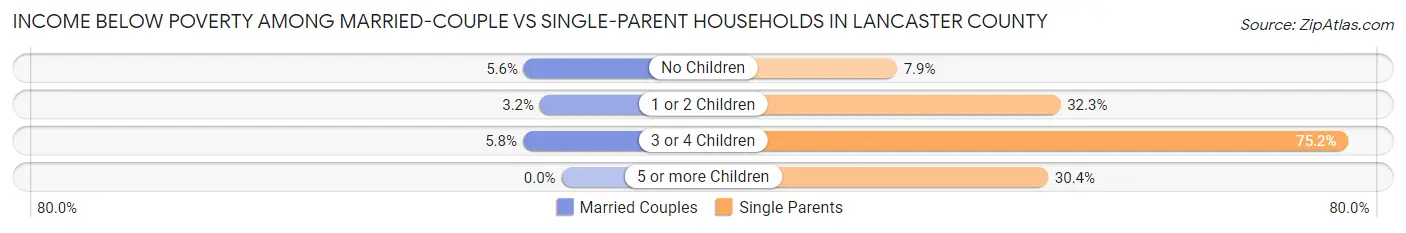
| Children | Married-Couple Families | Single-Parent Households |
| No Children | 726 (5.6%) | 186 (7.9%) |
| 1 or 2 Children | 210 (3.2%) | 952 (32.3%) |
| 3 or 4 Children | 86 (5.8%) | 376 (75.2%) |
| 5 or more Children | 0 (0.0%) | 7 (30.4%) |
| Total | 1,022 (4.9%) | 1,521 (26.1%) |
Race in Lancaster County
The most populous races in Lancaster County are White / Caucasian (70,124 | 71.8%), Black / African American (19,252 | 19.7%), and Hispanic or Latino (6,103 | 6.2%).
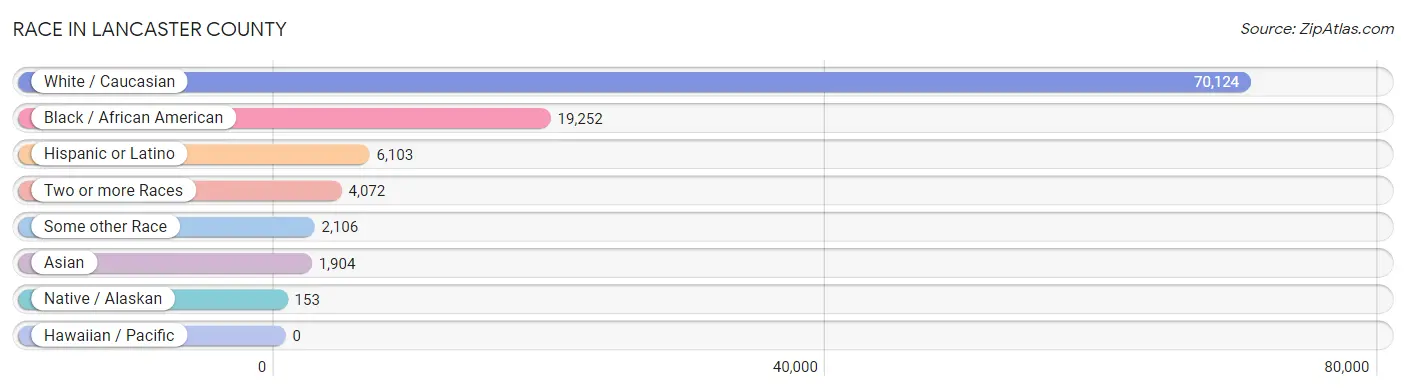
| Race | # Population | % Population |
| Asian | 1,904 | 1.9% |
| Black / African American | 19,252 | 19.7% |
| Hawaiian / Pacific | 0 | 0.0% |
| Hispanic or Latino | 6,103 | 6.2% |
| Native / Alaskan | 153 | 0.2% |
| White / Caucasian | 70,124 | 71.8% |
| Two or more Races | 4,072 | 4.2% |
| Some other Race | 2,106 | 2.2% |
| Total | 97,611 | 100.0% |
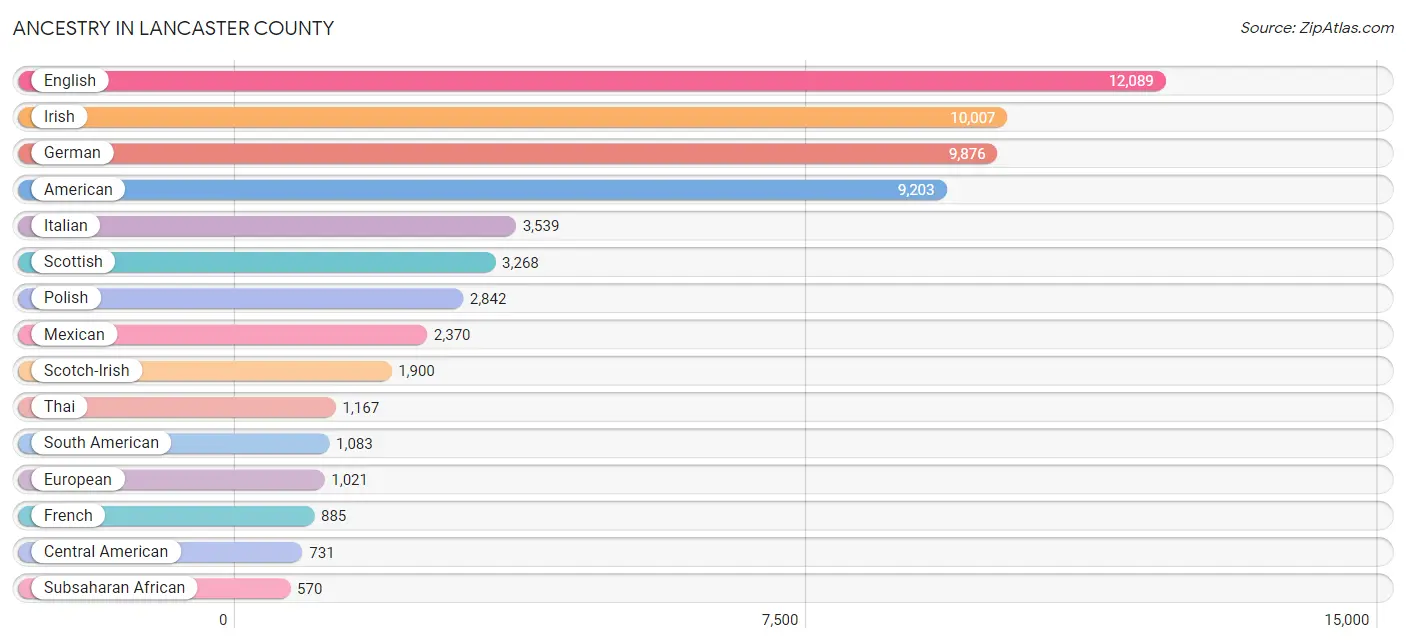
Ancestry in Lancaster County
The most populous ancestries reported in Lancaster County are English (12,089 | 12.4%), Irish (10,007 | 10.2%), German (9,876 | 10.1%), American (9,203 | 9.4%), and Italian (3,539 | 3.6%), together accounting for 45.8% of all Lancaster County residents.
| Ancestry | # Population | % Population |
| African | 474 | 0.5% |
| American | 9,203 | 9.4% |
| Arab | 410 | 0.4% |
| Arapaho | 1 | 0.0% |
| Argentinean | 5 | 0.0% |
| Armenian | 48 | 0.1% |
| Austrian | 3 | 0.0% |
| Belgian | 104 | 0.1% |
| Bhutanese | 98 | 0.1% |
| Blackfeet | 35 | 0.0% |
| Bolivian | 35 | 0.0% |
| Brazilian | 58 | 0.1% |
| British | 248 | 0.3% |
| Burmese | 108 | 0.1% |
| Canadian | 68 | 0.1% |
| Central American | 731 | 0.7% |
| Cherokee | 165 | 0.2% |
| Cheyenne | 1 | 0.0% |
| Chippewa | 1 | 0.0% |
| Colombian | 390 | 0.4% |
| Costa Rican | 9 | 0.0% |
| Creek | 2 | 0.0% |
| Croatian | 50 | 0.1% |
| Cuban | 461 | 0.5% |
| Cypriot | 39 | 0.0% |
| Czech | 131 | 0.1% |
| Czechoslovakian | 52 | 0.1% |
| Danish | 115 | 0.1% |
| Dominican | 309 | 0.3% |
| Dutch | 559 | 0.6% |
| Eastern European | 219 | 0.2% |
| Ecuadorian | 280 | 0.3% |
| Egyptian | 82 | 0.1% |
| English | 12,089 | 12.4% |
| Estonian | 30 | 0.0% |
| European | 1,021 | 1.1% |
| Finnish | 129 | 0.1% |
| French | 885 | 0.9% |
| French American Indian | 2 | 0.0% |
| French Canadian | 105 | 0.1% |
| German | 9,876 | 10.1% |
| Ghanaian | 13 | 0.0% |
| Greek | 245 | 0.3% |
| Guatemalan | 112 | 0.1% |
| Guyanese | 24 | 0.0% |
| Haitian | 78 | 0.1% |
| Honduran | 346 | 0.4% |
| Hopi | 12 | 0.0% |
| Hungarian | 318 | 0.3% |
| Indian (Asian) | 445 | 0.5% |
| Irish | 10,007 | 10.2% |
| Iroquois | 98 | 0.1% |
| Italian | 3,539 | 3.6% |
| Jamaican | 23 | 0.0% |
| Jordanian | 45 | 0.1% |
| Korean | 182 | 0.2% |
| Latvian | 38 | 0.0% |
| Lebanese | 66 | 0.1% |
| Lithuanian | 87 | 0.1% |
| Mexican | 2,370 | 2.4% |
| Native Hawaiian | 9 | 0.0% |
| Navajo | 1 | 0.0% |
| Nigerian | 26 | 0.0% |
| Northern European | 82 | 0.1% |
| Norwegian | 413 | 0.4% |
| Pakistani | 49 | 0.1% |
| Palestinian | 80 | 0.1% |
| Panamanian | 108 | 0.1% |
| Peruvian | 67 | 0.1% |
| Polish | 2,842 | 2.9% |
| Portuguese | 270 | 0.3% |
| Puerto Rican | 493 | 0.5% |
| Romanian | 21 | 0.0% |
| Russian | 416 | 0.4% |
| Salvadoran | 156 | 0.2% |
| Samoan | 34 | 0.0% |
| Scandinavian | 70 | 0.1% |
| Scotch-Irish | 1,900 | 1.9% |
| Scottish | 3,268 | 3.4% |
| Sioux | 1 | 0.0% |
| Slavic | 30 | 0.0% |
| Slovak | 32 | 0.0% |
| Slovene | 25 | 0.0% |
| South African | 24 | 0.0% |
| South American | 1,083 | 1.1% |
| South American Indian | 35 | 0.0% |
| Spaniard | 134 | 0.1% |
| Spanish | 134 | 0.1% |
| Spanish American Indian | 1 | 0.0% |
| Sri Lankan | 155 | 0.2% |
| Subsaharan African | 570 | 0.6% |
| Swedish | 498 | 0.5% |
| Swiss | 147 | 0.2% |
| Thai | 1,167 | 1.2% |
| Trinidadian and Tobagonian | 31 | 0.0% |
| Turkish | 11 | 0.0% |
| Ukrainian | 255 | 0.3% |
| Venezuelan | 306 | 0.3% |
| Welsh | 460 | 0.5% |
| Yugoslavian | 40 | 0.0% | View All 100 Rows |
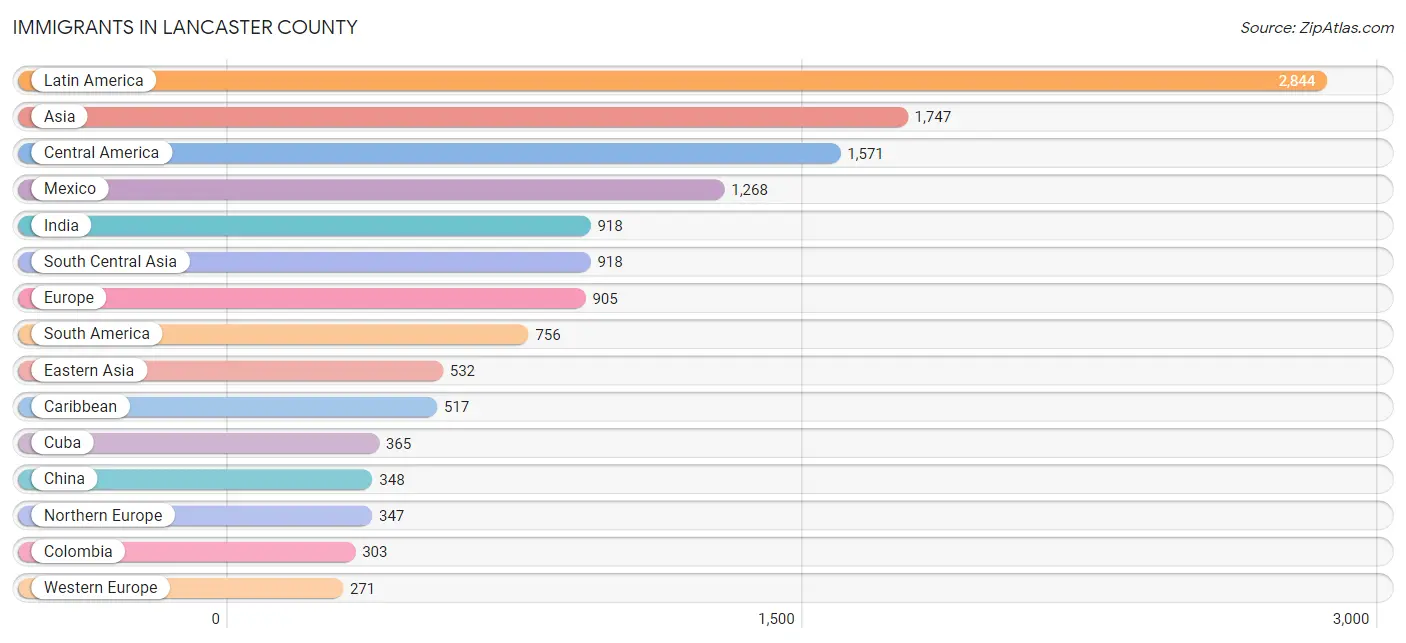
Immigrants in Lancaster County
The most numerous immigrant groups reported in Lancaster County came from Latin America (2,844 | 2.9%), Asia (1,747 | 1.8%), Central America (1,571 | 1.6%), Mexico (1,268 | 1.3%), and India (918 | 0.9%), together accounting for 8.6% of all Lancaster County residents.
| Immigration Origin | # Population | % Population |
| Africa | 127 | 0.1% |
| Argentina | 5 | 0.0% |
| Asia | 1,747 | 1.8% |
| Belgium | 13 | 0.0% |
| Brazil | 80 | 0.1% |
| Bulgaria | 39 | 0.0% |
| Canada | 229 | 0.2% |
| Caribbean | 517 | 0.5% |
| Central America | 1,571 | 1.6% |
| China | 348 | 0.4% |
| Colombia | 303 | 0.3% |
| Costa Rica | 9 | 0.0% |
| Croatia | 25 | 0.0% |
| Cuba | 365 | 0.4% |
| Denmark | 42 | 0.0% |
| Dominican Republic | 21 | 0.0% |
| Eastern Asia | 532 | 0.5% |
| Eastern Europe | 171 | 0.2% |
| Ecuador | 116 | 0.1% |
| Egypt | 32 | 0.0% |
| England | 238 | 0.2% |
| Europe | 905 | 0.9% |
| France | 18 | 0.0% |
| Germany | 202 | 0.2% |
| Guatemala | 20 | 0.0% |
| Honduras | 244 | 0.3% |
| Hong Kong | 15 | 0.0% |
| Hungary | 11 | 0.0% |
| India | 918 | 0.9% |
| Italy | 8 | 0.0% |
| Jamaica | 100 | 0.1% |
| Japan | 40 | 0.0% |
| Jordan | 29 | 0.0% |
| Korea | 144 | 0.2% |
| Kuwait | 45 | 0.1% |
| Latin America | 2,844 | 2.9% |
| Latvia | 9 | 0.0% |
| Malaysia | 17 | 0.0% |
| Mexico | 1,268 | 1.3% |
| Netherlands | 38 | 0.0% |
| Nigeria | 26 | 0.0% |
| Northern Africa | 32 | 0.0% |
| Northern Europe | 347 | 0.4% |
| Panama | 30 | 0.0% |
| Peru | 67 | 0.1% |
| Philippines | 109 | 0.1% |
| Poland | 49 | 0.1% |
| Russia | 12 | 0.0% |
| Scotland | 36 | 0.0% |
| Senegal | 33 | 0.0% |
| South Africa | 36 | 0.0% |
| South America | 756 | 0.8% |
| South Central Asia | 918 | 0.9% |
| South Eastern Asia | 146 | 0.2% |
| Southern Europe | 116 | 0.1% |
| Spain | 108 | 0.1% |
| Trinidad and Tobago | 31 | 0.0% |
| Ukraine | 26 | 0.0% |
| Venezuela | 185 | 0.2% |
| Vietnam | 20 | 0.0% |
| Western Africa | 59 | 0.1% |
| Western Asia | 151 | 0.2% |
| Western Europe | 271 | 0.3% | View All 63 Rows |
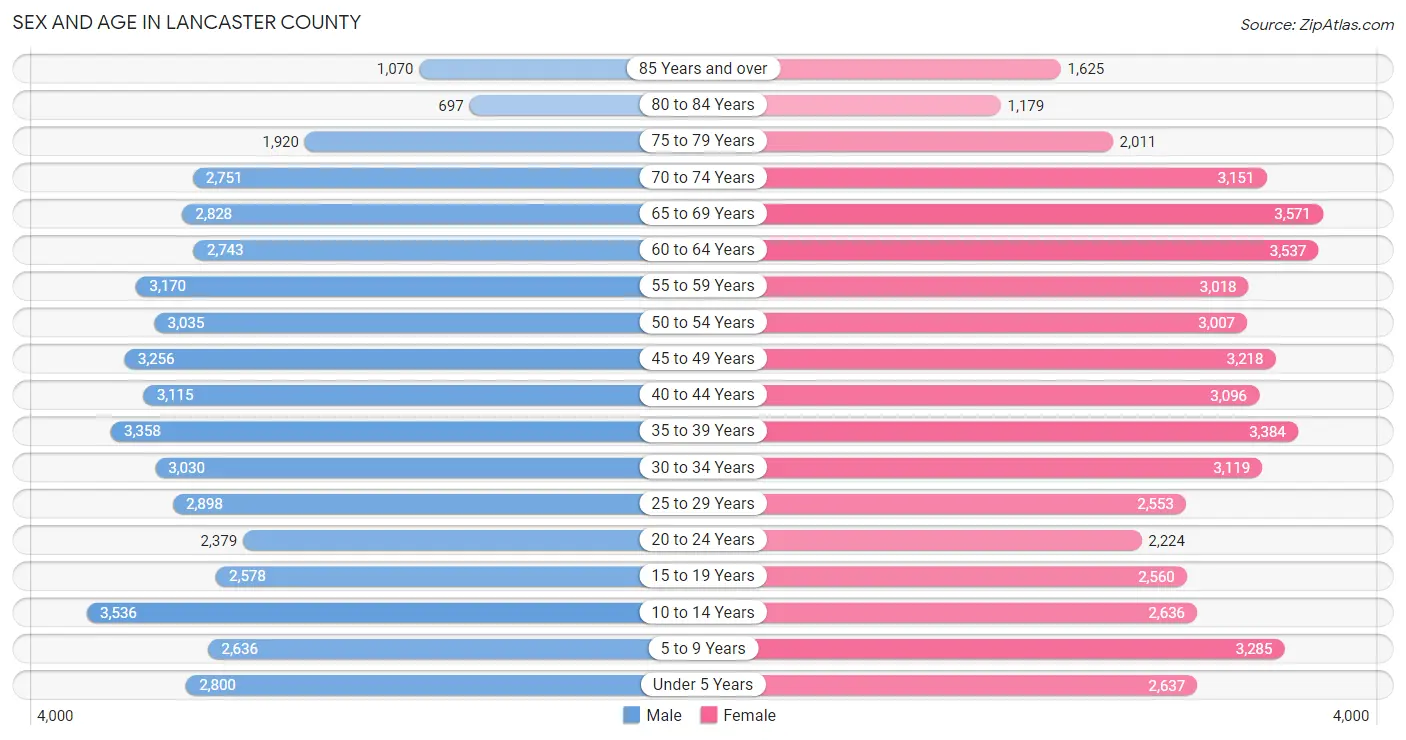
Sex and Age in Lancaster County
Sex and Age in Lancaster County
The most populous age groups in Lancaster County are 10 to 14 Years (3,536 | 7.4%) for men and 65 to 69 Years (3,571 | 7.2%) for women.
| Age Bracket | Male | Female |
| Under 5 Years | 2,800 (5.9%) | 2,637 (5.3%) |
| 5 to 9 Years | 2,636 (5.5%) | 3,285 (6.6%) |
| 10 to 14 Years | 3,536 (7.4%) | 2,636 (5.3%) |
| 15 to 19 Years | 2,578 (5.4%) | 2,560 (5.1%) |
| 20 to 24 Years | 2,379 (5.0%) | 2,224 (4.5%) |
| 25 to 29 Years | 2,898 (6.1%) | 2,553 (5.1%) |
| 30 to 34 Years | 3,030 (6.3%) | 3,119 (6.3%) |
| 35 to 39 Years | 3,358 (7.0%) | 3,384 (6.8%) |
| 40 to 44 Years | 3,115 (6.5%) | 3,096 (6.2%) |
| 45 to 49 Years | 3,256 (6.8%) | 3,218 (6.5%) |
| 50 to 54 Years | 3,035 (6.4%) | 3,007 (6.0%) |
| 55 to 59 Years | 3,170 (6.6%) | 3,018 (6.1%) |
| 60 to 64 Years | 2,743 (5.7%) | 3,537 (7.1%) |
| 65 to 69 Years | 2,828 (5.9%) | 3,571 (7.2%) |
| 70 to 74 Years | 2,751 (5.8%) | 3,151 (6.3%) |
| 75 to 79 Years | 1,920 (4.0%) | 2,011 (4.0%) |
| 80 to 84 Years | 697 (1.5%) | 1,179 (2.4%) |
| 85 Years and over | 1,070 (2.2%) | 1,625 (3.3%) |
| Total | 47,800 (100.0%) | 49,811 (100.0%) |
Families and Households in Lancaster County
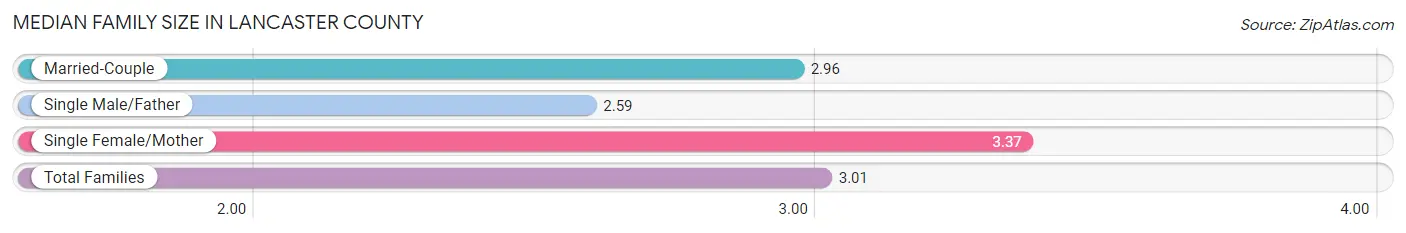
Median Family Size in Lancaster County
The median family size in Lancaster County is 3.01 persons per family, with single female/mother families (4,532 | 16.9%) accounting for the largest median family size of 3.37 persons per family. On the other hand, single male/father families (1,296 | 4.8%) represent the smallest median family size with 2.59 persons per family.
| Family Type | # Families | Family Size |
| Married-Couple | 20,994 (78.3%) | 2.96 |
| Single Male/Father | 1,296 (4.8%) | 2.59 |
| Single Female/Mother | 4,532 (16.9%) | 3.37 |
| Total Families | 26,822 (100.0%) | 3.01 |
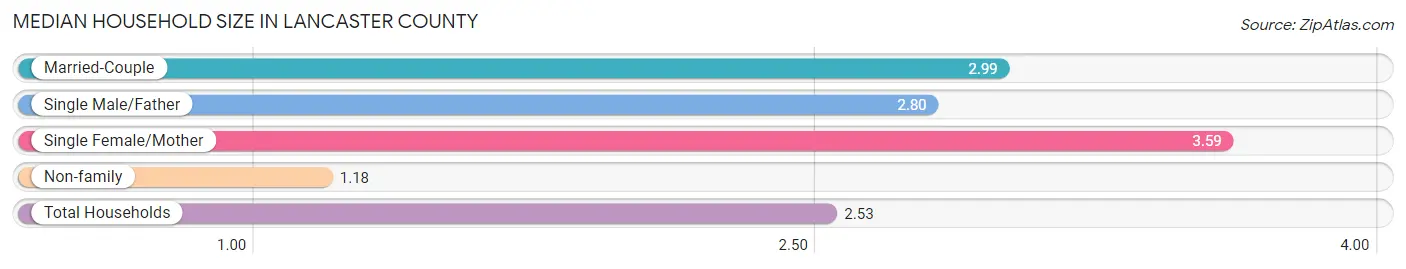
Median Household Size in Lancaster County
The median household size in Lancaster County is 2.53 persons per household, with single female/mother households (4,532 | 12.0%) accounting for the largest median household size of 3.59 persons per household. non-family households (11,071 | 29.2%) represent the smallest median household size with 1.18 persons per household.
| Household Type | # Households | Household Size |
| Married-Couple | 20,994 (55.4%) | 2.99 |
| Single Male/Father | 1,296 (3.4%) | 2.80 |
| Single Female/Mother | 4,532 (12.0%) | 3.59 |
| Non-family | 11,071 (29.2%) | 1.18 |
| Total Households | 37,893 (100.0%) | 2.53 |
Household Size by Marriage Status in Lancaster County
Out of a total of 37,893 households in Lancaster County, 26,822 (70.8%) are family households, while 11,071 (29.2%) are nonfamily households. The most numerous type of family households are 2-person households, comprising 13,592, and the most common type of nonfamily households are 1-person households, comprising 9,907.
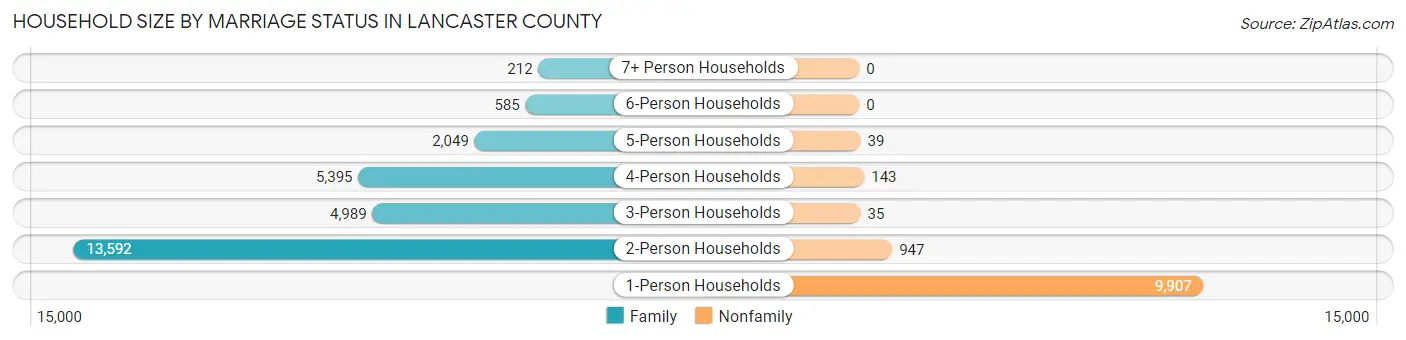
| Household Size | Family Households | Nonfamily Households |
| 1-Person Households | - | 9,907 (26.1%) |
| 2-Person Households | 13,592 (35.9%) | 947 (2.5%) |
| 3-Person Households | 4,989 (13.2%) | 35 (0.1%) |
| 4-Person Households | 5,395 (14.2%) | 143 (0.4%) |
| 5-Person Households | 2,049 (5.4%) | 39 (0.1%) |
| 6-Person Households | 585 (1.5%) | 0 (0.0%) |
| 7+ Person Households | 212 (0.6%) | 0 (0.0%) |
| Total | 26,822 (70.8%) | 11,071 (29.2%) |
Female Fertility in Lancaster County
Fertility by Age in Lancaster County
Average fertility rate in Lancaster County is 70.0 births per 1,000 women. Women in the age bracket of 20 to 34 years have the highest fertility rate with 132.0 births per 1,000 women. Women in the age bracket of 20 to 34 years acount for 72.4% of all women with births.
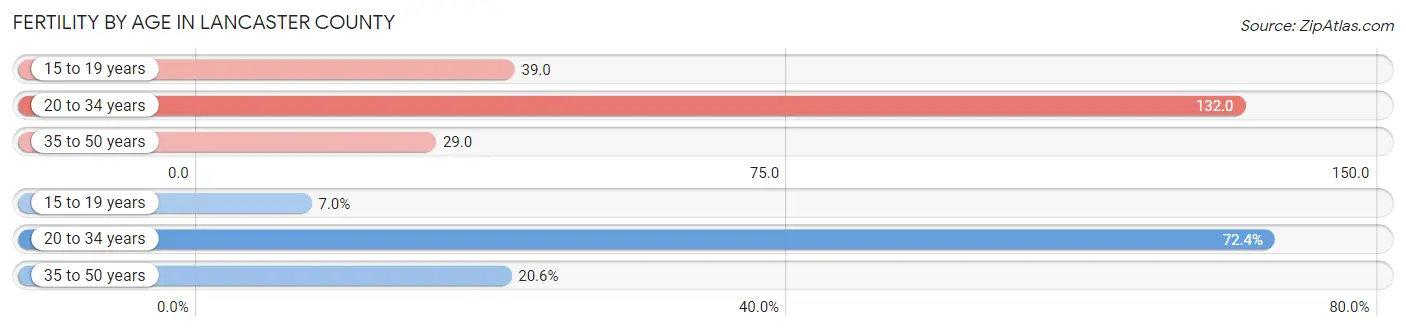
| Age Bracket | Women with Births | Births / 1,000 Women |
| 15 to 19 years | 101 (7.0%) | 39.0 |
| 20 to 34 years | 1,041 (72.4%) | 132.0 |
| 35 to 50 years | 296 (20.6%) | 29.0 |
| Total | 1,438 (100.0%) | 70.0 |
Fertility by Age by Marriage Status in Lancaster County
57.4% of women with births (1,438) in Lancaster County are married. The highest percentage of unmarried women with births falls into 15 to 19 years age bracket with 100.0% of them unmarried at the time of birth, while the lowest percentage of unmarried women with births belong to 20 to 34 years age bracket with 36.2% of them unmarried.
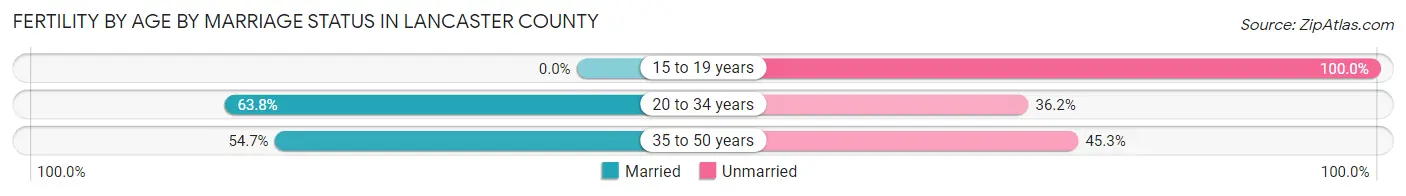
| Age Bracket | Married | Unmarried |
| 15 to 19 years | 0 (0.0%) | 101 (100.0%) |
| 20 to 34 years | 664 (63.8%) | 377 (36.2%) |
| 35 to 50 years | 162 (54.7%) | 134 (45.3%) |
| Total | 825 (57.4%) | 613 (42.6%) |
Fertility by Education in Lancaster County
Average fertility rate in Lancaster County is 70.0 births per 1,000 women. Women with the education attainment of high school diploma have the highest fertility rate of 105.0 births per 1,000 women, while women with the education attainment of less than high school have the lowest fertility at 59.0 births per 1,000 women. Women with the education attainment of college or associate's degree represent 29.7% of all women with births.
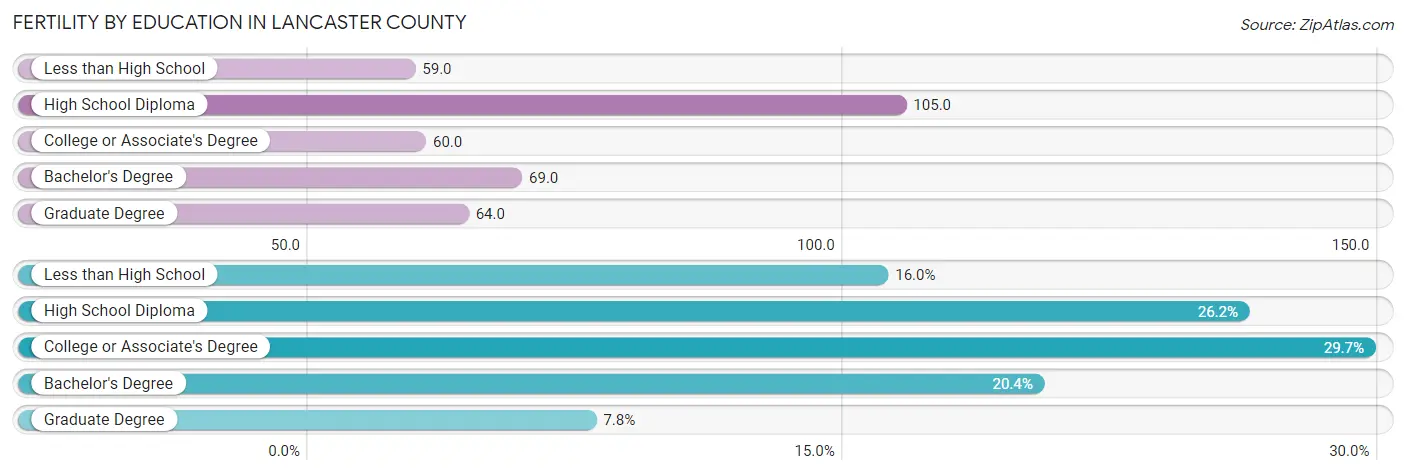
| Educational Attainment | Women with Births | Births / 1,000 Women |
| Less than High School | 230 (16.0%) | 59.0 |
| High School Diploma | 376 (26.2%) | 105.0 |
| College or Associate's Degree | 427 (29.7%) | 60.0 |
| Bachelor's Degree | 293 (20.4%) | 69.0 |
| Graduate Degree | 112 (7.8%) | 64.0 |
| Total | 1,438 (100.0%) | 70.0 |
Fertility by Education by Marriage Status in Lancaster County
42.6% of women with births in Lancaster County are unmarried. Women with the educational attainment of graduate degree are most likely to be married with 100.0% of them married at childbirth, while women with the educational attainment of less than high school are least likely to be married with 93.0% of them unmarried at childbirth.
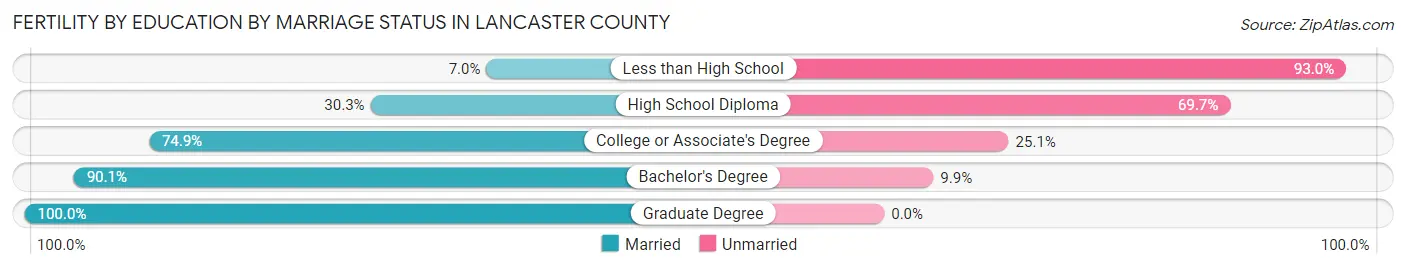
| Educational Attainment | Married | Unmarried |
| Less than High School | 16 (7.0%) | 214 (93.0%) |
| High School Diploma | 114 (30.3%) | 262 (69.7%) |
| College or Associate's Degree | 320 (74.9%) | 107 (25.1%) |
| Bachelor's Degree | 264 (90.1%) | 29 (9.9%) |
| Graduate Degree | 112 (100.0%) | 0 (0.0%) |
| Total | 825 (57.4%) | 613 (42.6%) |
Employment Characteristics in Lancaster County
Employment by Class of Employer in Lancaster County
Among the 43,090 employed individuals in Lancaster County, private company employees (31,670 | 73.5%), local government employees (3,263 | 7.6%), and not-for-profit organizations (2,210 | 5.1%) make up the most common classes of employment.
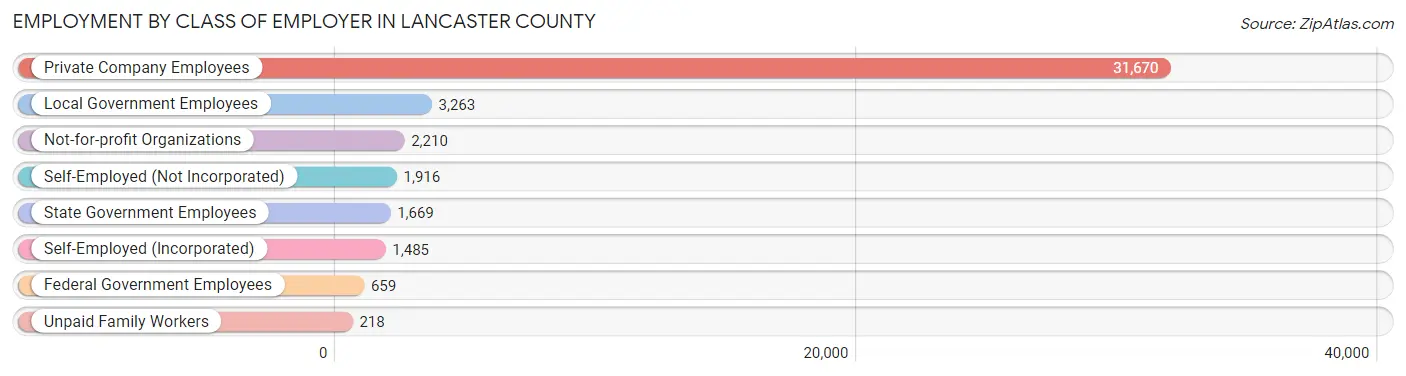
| Employer Class | # Employees | % Employees |
| Private Company Employees | 31,670 | 73.5% |
| Self-Employed (Incorporated) | 1,485 | 3.5% |
| Self-Employed (Not Incorporated) | 1,916 | 4.4% |
| Not-for-profit Organizations | 2,210 | 5.1% |
| Local Government Employees | 3,263 | 7.6% |
| State Government Employees | 1,669 | 3.9% |
| Federal Government Employees | 659 | 1.5% |
| Unpaid Family Workers | 218 | 0.5% |
| Total | 43,090 | 100.0% |
Employment Status by Age in Lancaster County
According to the labor force statistics for Lancaster County, out of the total population over 16 years of age (79,204), 58.0% or 45,938 individuals are in the labor force, with 5.0% or 2,297 of them unemployed. The age group with the highest labor force participation rate is 45 to 54 years, with 84.2% or 10,538 individuals in the labor force. Within the labor force, the 30 to 34 years age range has the highest percentage of unemployed individuals, with 9.6% or 494 of them being unemployed.
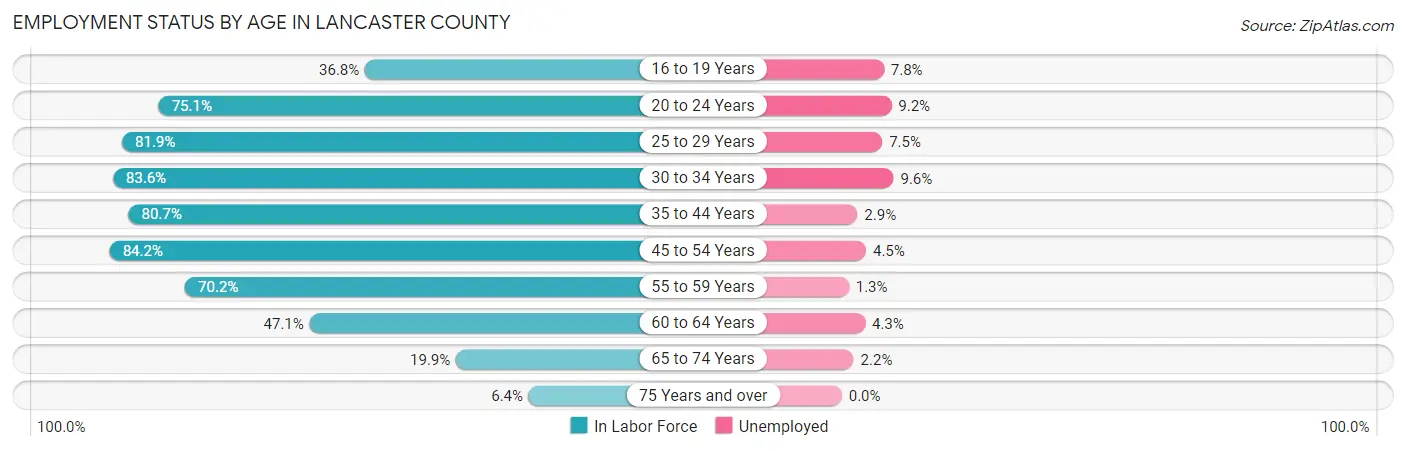
| Age Bracket | In Labor Force | Unemployed |
| 16 to 19 Years | 1,568 (36.8%) | 122 (7.8%) |
| 20 to 24 Years | 3,457 (75.1%) | 318 (9.2%) |
| 25 to 29 Years | 4,464 (81.9%) | 335 (7.5%) |
| 30 to 34 Years | 5,141 (83.6%) | 494 (9.6%) |
| 35 to 44 Years | 10,453 (80.7%) | 303 (2.9%) |
| 45 to 54 Years | 10,538 (84.2%) | 474 (4.5%) |
| 55 to 59 Years | 4,344 (70.2%) | 56 (1.3%) |
| 60 to 64 Years | 2,958 (47.1%) | 127 (4.3%) |
| 65 to 74 Years | 2,448 (19.9%) | 54 (2.2%) |
| 75 Years and over | 544 (6.4%) | 0 (0.0%) |
| Total | 45,938 (58.0%) | 2,297 (5.0%) |
Employment Status by Educational Attainment in Lancaster County
According to labor force statistics for Lancaster County, 76.5% of individuals (37,896) out of the total population between 25 and 64 years of age (49,537) are in the labor force, with 4.7% or 1,781 of them being unemployed. The group with the highest labor force participation rate are those with the educational attainment of bachelor's degree or higher, with 82.3% or 12,420 individuals in the labor force. Within the labor force, individuals with less than high school education have the highest percentage of unemployment, with 9.6% or 307 of them being unemployed.
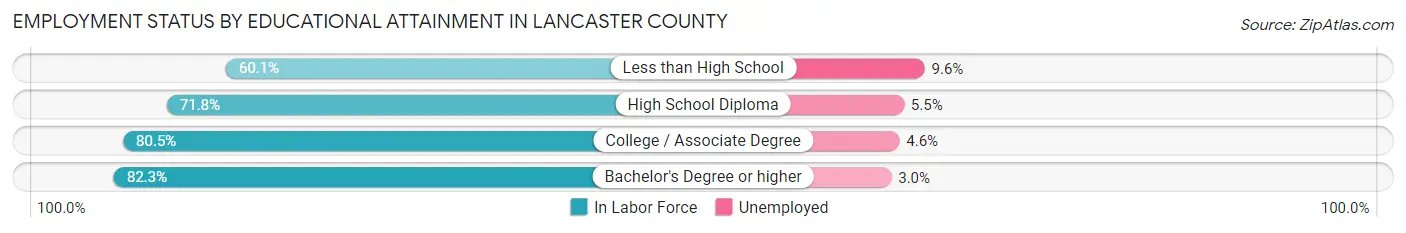
| Educational Attainment | In Labor Force | Unemployed |
| Less than High School | 3,201 (60.1%) | 511 (9.6%) |
| High School Diploma | 9,727 (71.8%) | 745 (5.5%) |
| College / Associate Degree | 12,535 (80.5%) | 716 (4.6%) |
| Bachelor's Degree or higher | 12,420 (82.3%) | 453 (3.0%) |
| Total | 37,896 (76.5%) | 2,328 (4.7%) |
Employment Occupations by Sex in Lancaster County
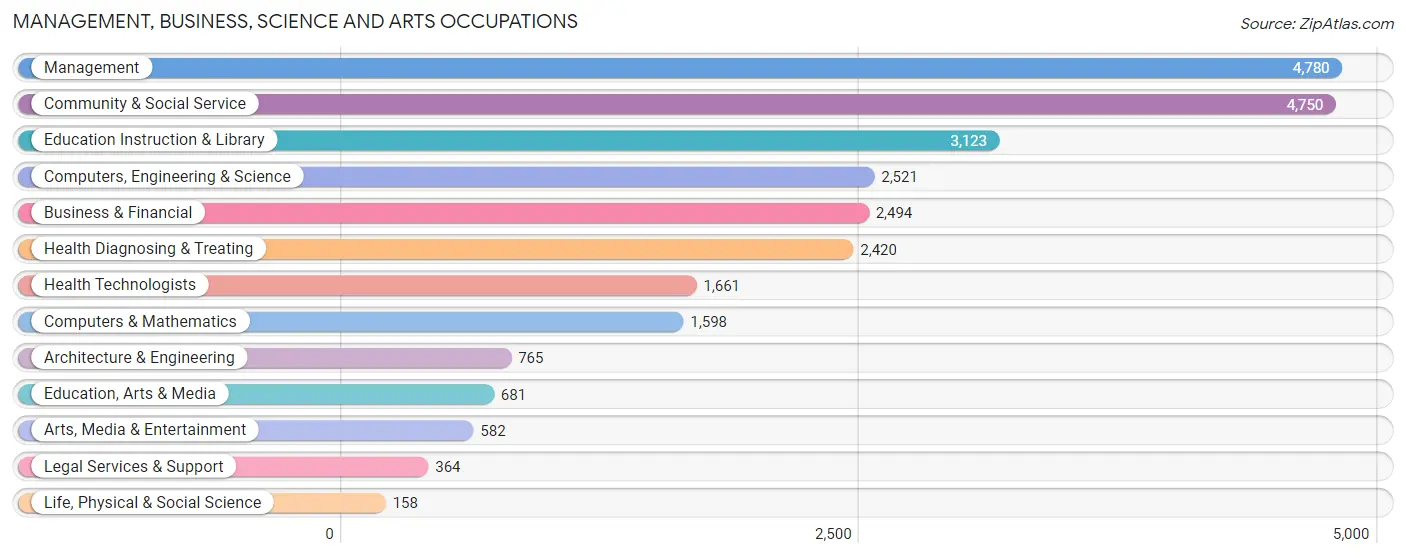
Management, Business, Science and Arts Occupations
The most common Management, Business, Science and Arts occupations in Lancaster County are Management (4,780 | 11.0%), Community & Social Service (4,750 | 10.9%), Education Instruction & Library (3,123 | 7.2%), Computers, Engineering & Science (2,521 | 5.8%), and Business & Financial (2,494 | 5.7%).
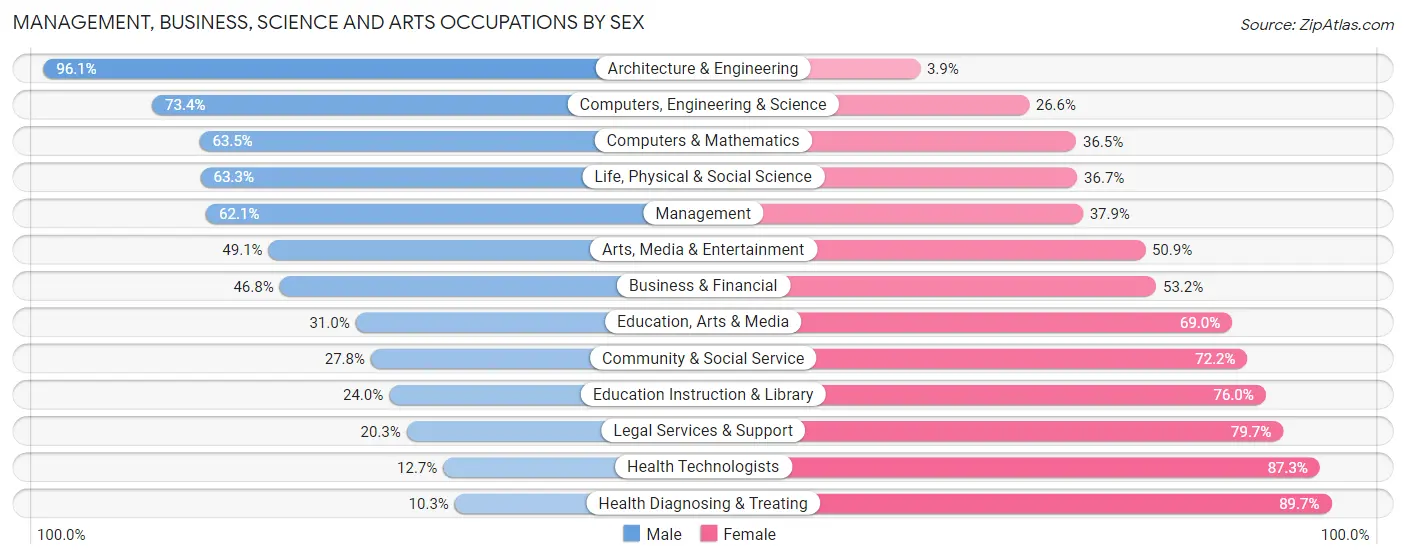
Management, Business, Science and Arts Occupations by Sex
Within the Management, Business, Science and Arts occupations in Lancaster County, the most male-oriented occupations are Architecture & Engineering (96.1%), Computers, Engineering & Science (73.4%), and Computers & Mathematics (63.5%), while the most female-oriented occupations are Health Diagnosing & Treating (89.7%), Health Technologists (87.3%), and Legal Services & Support (79.7%).
| Occupation | Male | Female |
| Management | 2,970 (62.1%) | 1,810 (37.9%) |
| Business & Financial | 1,168 (46.8%) | 1,326 (53.2%) |
| Computers, Engineering & Science | 1,850 (73.4%) | 671 (26.6%) |
| Computers & Mathematics | 1,015 (63.5%) | 583 (36.5%) |
| Architecture & Engineering | 735 (96.1%) | 30 (3.9%) |
| Life, Physical & Social Science | 100 (63.3%) | 58 (36.7%) |
| Community & Social Service | 1,320 (27.8%) | 3,430 (72.2%) |
| Education, Arts & Media | 211 (31.0%) | 470 (69.0%) |
| Legal Services & Support | 74 (20.3%) | 290 (79.7%) |
| Education Instruction & Library | 749 (24.0%) | 2,374 (76.0%) |
| Arts, Media & Entertainment | 286 (49.1%) | 296 (50.9%) |
| Health Diagnosing & Treating | 249 (10.3%) | 2,171 (89.7%) |
| Health Technologists | 211 (12.7%) | 1,450 (87.3%) |
| Total (Category) | 7,557 (44.5%) | 9,408 (55.5%) |
| Total (Overall) | 23,308 (53.6%) | 20,196 (46.4%) |
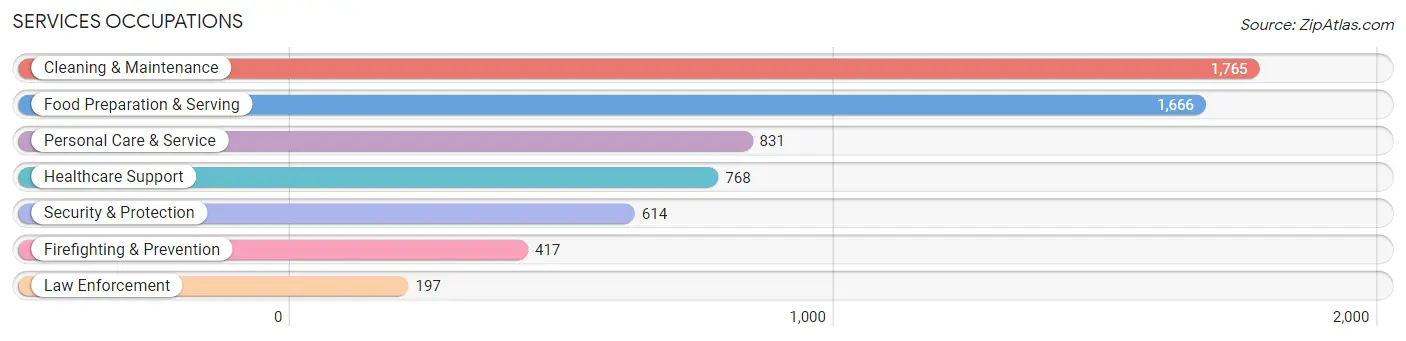
Services Occupations
The most common Services occupations in Lancaster County are Cleaning & Maintenance (1,765 | 4.1%), Food Preparation & Serving (1,666 | 3.8%), Personal Care & Service (831 | 1.9%), Healthcare Support (768 | 1.8%), and Security & Protection (614 | 1.4%).
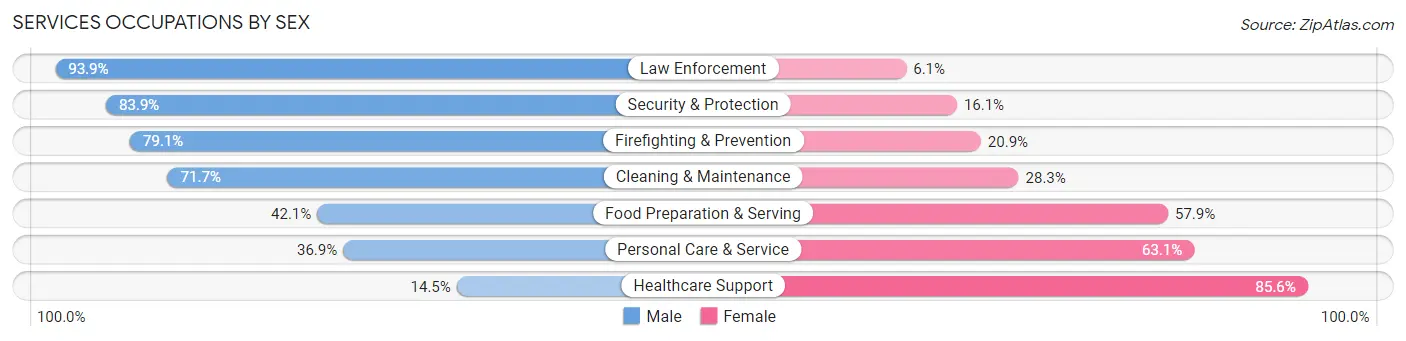
Services Occupations by Sex
Within the Services occupations in Lancaster County, the most male-oriented occupations are Law Enforcement (93.9%), Security & Protection (83.9%), and Firefighting & Prevention (79.1%), while the most female-oriented occupations are Healthcare Support (85.6%), Personal Care & Service (63.1%), and Food Preparation & Serving (57.9%).
| Occupation | Male | Female |
| Healthcare Support | 111 (14.4%) | 657 (85.6%) |
| Security & Protection | 515 (83.9%) | 99 (16.1%) |
| Firefighting & Prevention | 330 (79.1%) | 87 (20.9%) |
| Law Enforcement | 185 (93.9%) | 12 (6.1%) |
| Food Preparation & Serving | 701 (42.1%) | 965 (57.9%) |
| Cleaning & Maintenance | 1,265 (71.7%) | 500 (28.3%) |
| Personal Care & Service | 307 (36.9%) | 524 (63.1%) |
| Total (Category) | 2,899 (51.4%) | 2,745 (48.6%) |
| Total (Overall) | 23,308 (53.6%) | 20,196 (46.4%) |
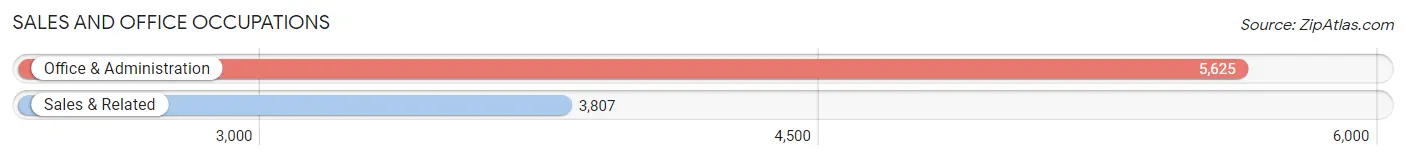
Sales and Office Occupations
The most common Sales and Office occupations in Lancaster County are Office & Administration (5,625 | 12.9%), and Sales & Related (3,807 | 8.7%).
Sales and Office Occupations by Sex
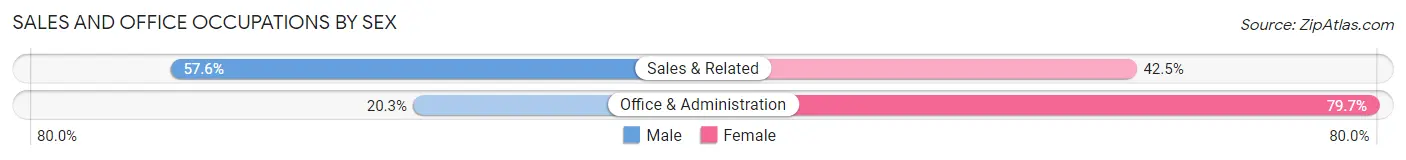
| Occupation | Male | Female |
| Sales & Related | 2,191 (57.6%) | 1,616 (42.4%) |
| Office & Administration | 1,141 (20.3%) | 4,484 (79.7%) |
| Total (Category) | 3,332 (35.3%) | 6,100 (64.7%) |
| Total (Overall) | 23,308 (53.6%) | 20,196 (46.4%) |
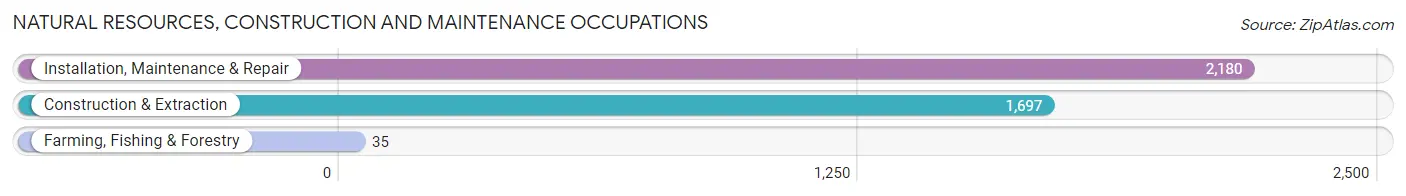
Natural Resources, Construction and Maintenance Occupations
The most common Natural Resources, Construction and Maintenance occupations in Lancaster County are Installation, Maintenance & Repair (2,180 | 5.0%), Construction & Extraction (1,697 | 3.9%), and Farming, Fishing & Forestry (35 | 0.1%).
Natural Resources, Construction and Maintenance Occupations by Sex
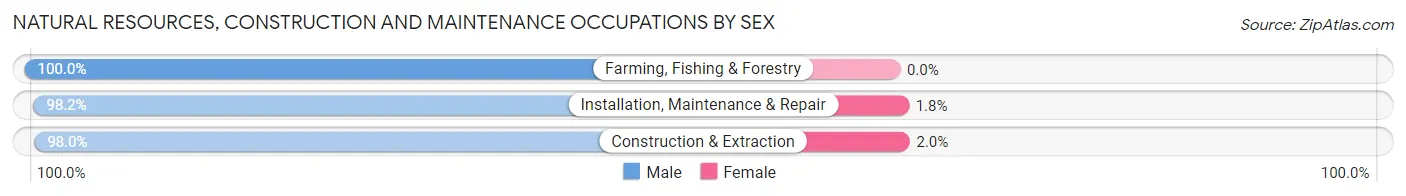
| Occupation | Male | Female |
| Farming, Fishing & Forestry | 35 (100.0%) | 0 (0.0%) |
| Construction & Extraction | 1,663 (98.0%) | 34 (2.0%) |
| Installation, Maintenance & Repair | 2,140 (98.2%) | 40 (1.8%) |
| Total (Category) | 3,838 (98.1%) | 74 (1.9%) |
| Total (Overall) | 23,308 (53.6%) | 20,196 (46.4%) |
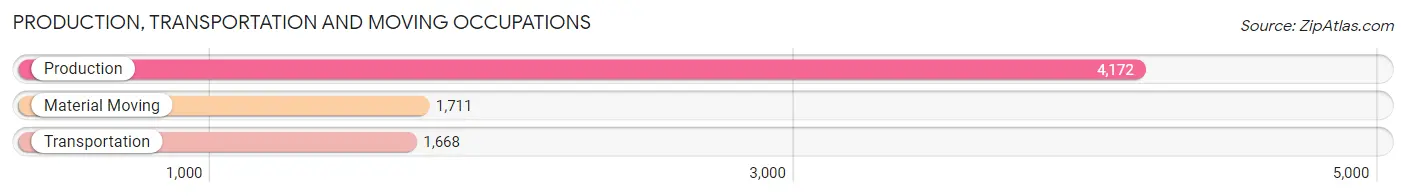
Production, Transportation and Moving Occupations
The most common Production, Transportation and Moving occupations in Lancaster County are Production (4,172 | 9.6%), Material Moving (1,711 | 3.9%), and Transportation (1,668 | 3.8%).
Production, Transportation and Moving Occupations by Sex
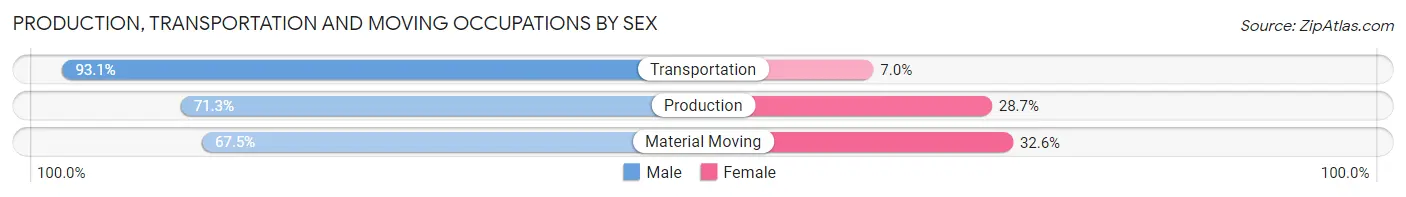
| Occupation | Male | Female |
| Production | 2,976 (71.3%) | 1,196 (28.7%) |
| Transportation | 1,552 (93.0%) | 116 (7.0%) |
| Material Moving | 1,154 (67.4%) | 557 (32.6%) |
| Total (Category) | 5,682 (75.2%) | 1,869 (24.7%) |
| Total (Overall) | 23,308 (53.6%) | 20,196 (46.4%) |
Employment Industries by Sex in Lancaster County
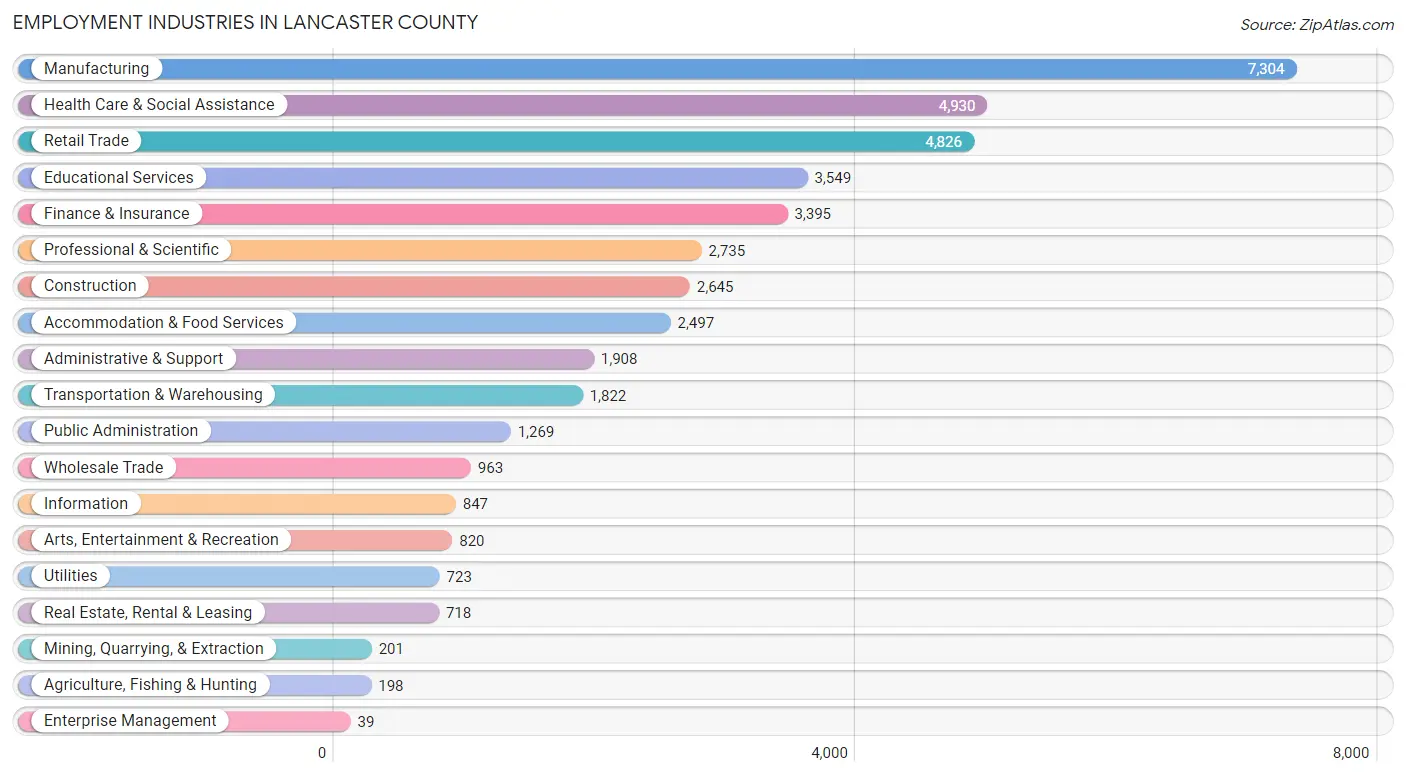
Employment Industries in Lancaster County
The major employment industries in Lancaster County include Manufacturing (7,304 | 16.8%), Health Care & Social Assistance (4,930 | 11.3%), Retail Trade (4,826 | 11.1%), Educational Services (3,549 | 8.2%), and Finance & Insurance (3,395 | 7.8%).
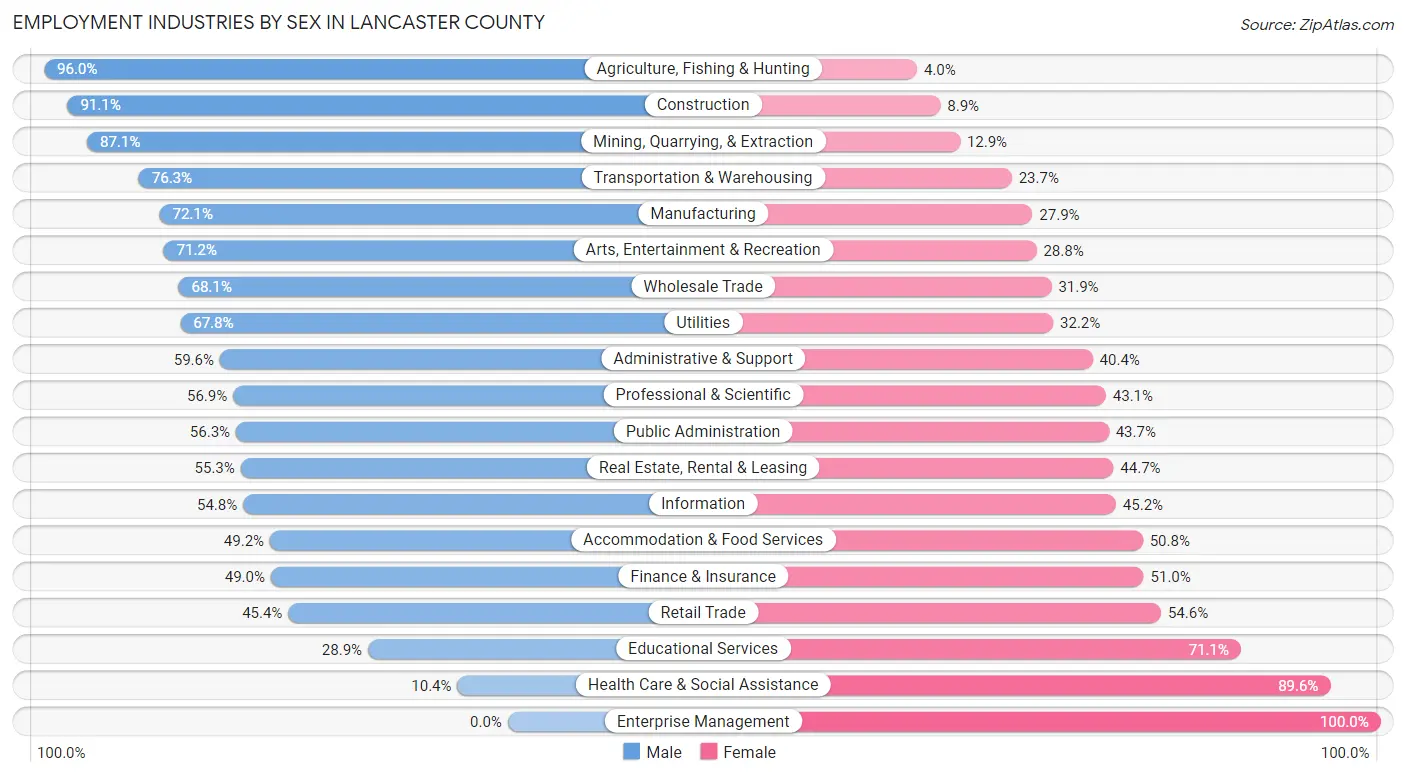
Employment Industries by Sex in Lancaster County
The Lancaster County industries that see more men than women are Agriculture, Fishing & Hunting (96.0%), Construction (91.1%), and Mining, Quarrying, & Extraction (87.1%), whereas the industries that tend to have a higher number of women are Enterprise Management (100.0%), Health Care & Social Assistance (89.6%), and Educational Services (71.1%).
| Industry | Male | Female |
| Agriculture, Fishing & Hunting | 190 (96.0%) | 8 (4.0%) |
| Mining, Quarrying, & Extraction | 175 (87.1%) | 26 (12.9%) |
| Construction | 2,410 (91.1%) | 235 (8.9%) |
| Manufacturing | 5,263 (72.1%) | 2,041 (27.9%) |
| Wholesale Trade | 656 (68.1%) | 307 (31.9%) |
| Retail Trade | 2,193 (45.4%) | 2,633 (54.6%) |
| Transportation & Warehousing | 1,391 (76.3%) | 431 (23.7%) |
| Utilities | 490 (67.8%) | 233 (32.2%) |
| Information | 464 (54.8%) | 383 (45.2%) |
| Finance & Insurance | 1,665 (49.0%) | 1,730 (51.0%) |
| Real Estate, Rental & Leasing | 397 (55.3%) | 321 (44.7%) |
| Professional & Scientific | 1,555 (56.9%) | 1,180 (43.1%) |
| Enterprise Management | 0 (0.0%) | 39 (100.0%) |
| Administrative & Support | 1,137 (59.6%) | 771 (40.4%) |
| Educational Services | 1,027 (28.9%) | 2,522 (71.1%) |
| Health Care & Social Assistance | 514 (10.4%) | 4,416 (89.6%) |
| Arts, Entertainment & Recreation | 584 (71.2%) | 236 (28.8%) |
| Accommodation & Food Services | 1,229 (49.2%) | 1,268 (50.8%) |
| Public Administration | 714 (56.3%) | 555 (43.7%) |
| Total | 23,308 (53.6%) | 20,196 (46.4%) |
Education in Lancaster County
School Enrollment in Lancaster County
The most common levels of schooling among the 19,526 students in Lancaster County are middle school (4,969 | 25.5%), elementary school (4,810 | 24.6%), and high school (4,263 | 21.8%).
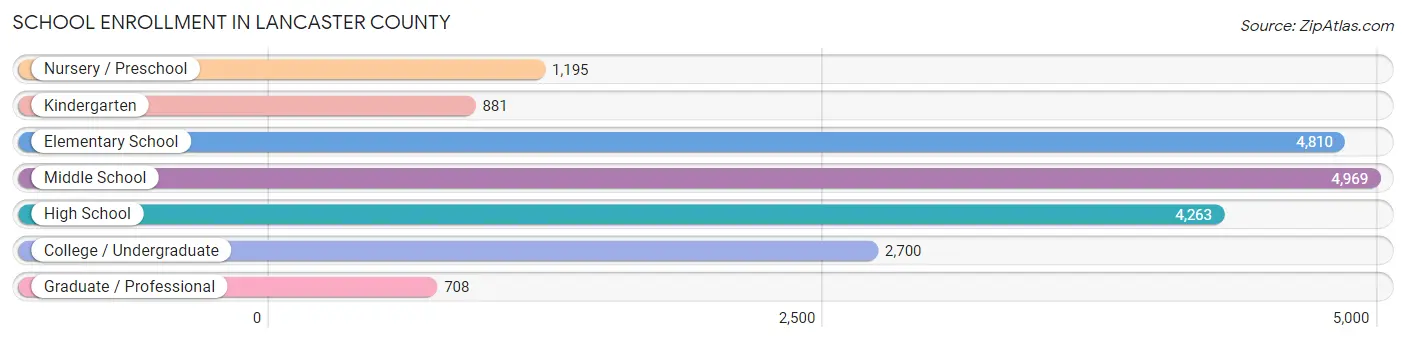
| School Level | # Students | % Students |
| Nursery / Preschool | 1,195 | 6.1% |
| Kindergarten | 881 | 4.5% |
| Elementary School | 4,810 | 24.6% |
| Middle School | 4,969 | 25.5% |
| High School | 4,263 | 21.8% |
| College / Undergraduate | 2,700 | 13.8% |
| Graduate / Professional | 708 | 3.6% |
| Total | 19,526 | 100.0% |
School Enrollment by Age by Funding Source in Lancaster County
Out of a total of 19,526 students who are enrolled in schools in Lancaster County, 3,339 (17.1%) attend a private institution, while the remaining 16,187 (82.9%) are enrolled in public schools. The age group of 3 to 4 year olds has the highest likelihood of being enrolled in private schools, with 434 (48.5% in the age bracket) enrolled. Conversely, the age group of 20 to 24 year olds has the lowest likelihood of being enrolled in a private school, with 1,002 (95.5% in the age bracket) attending a public institution.
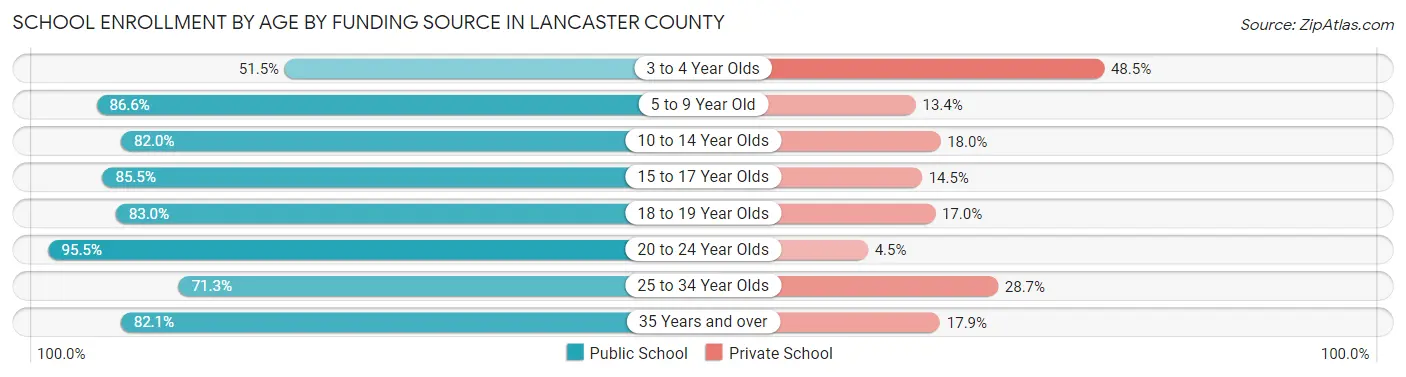
| Age Bracket | Public School | Private School |
| 3 to 4 Year Olds | 461 (51.5%) | 434 (48.5%) |
| 5 to 9 Year Old | 4,753 (86.6%) | 735 (13.4%) |
| 10 to 14 Year Olds | 4,954 (82.0%) | 1,086 (18.0%) |
| 15 to 17 Year Olds | 2,723 (85.5%) | 463 (14.5%) |
| 18 to 19 Year Olds | 937 (83.0%) | 192 (17.0%) |
| 20 to 24 Year Olds | 1,002 (95.5%) | 47 (4.5%) |
| 25 to 34 Year Olds | 484 (71.3%) | 195 (28.7%) |
| 35 Years and over | 870 (82.1%) | 190 (17.9%) |
| Total | 16,187 (82.9%) | 3,339 (17.1%) |
Educational Attainment by Field of Study in Lancaster County
Business (6,333 | 28.0%), education (3,546 | 15.7%), science & technology (1,761 | 7.8%), engineering (1,647 | 7.3%), and psychology (1,284 | 5.7%) are the most common fields of study among 22,629 individuals in Lancaster County who have obtained a bachelor's degree or higher.
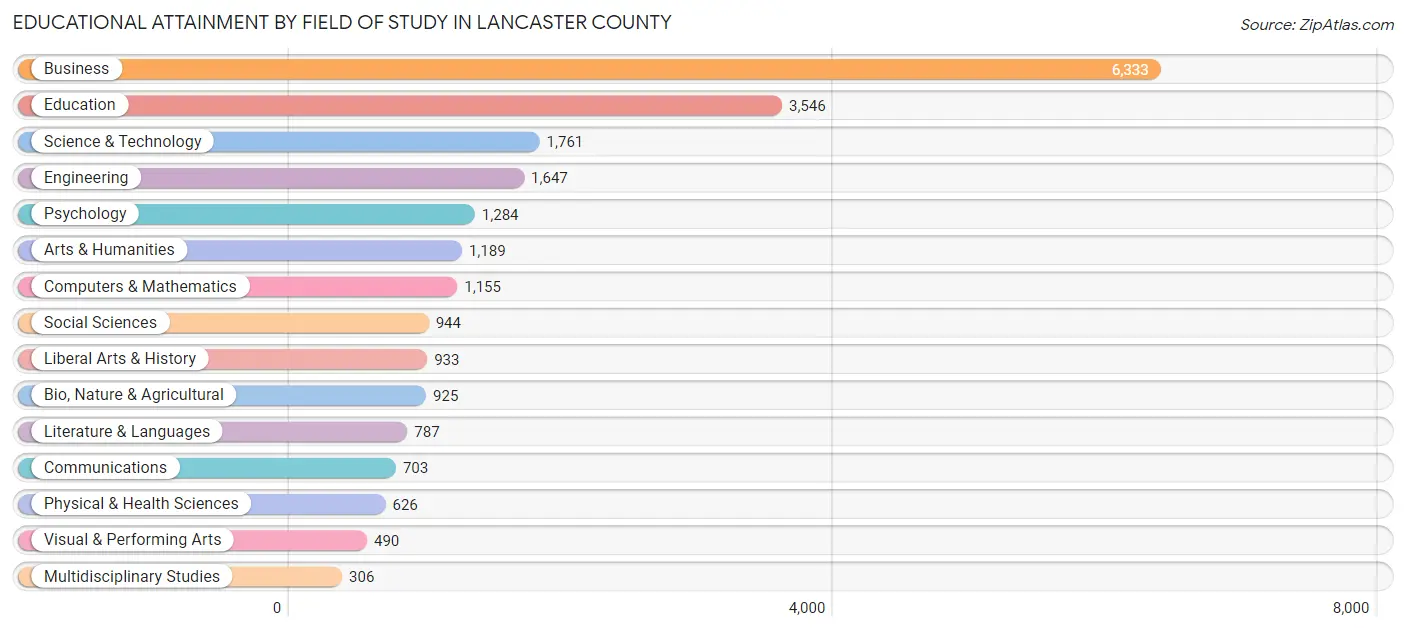
| Field of Study | # Graduates | % Graduates |
| Computers & Mathematics | 1,155 | 5.1% |
| Bio, Nature & Agricultural | 925 | 4.1% |
| Physical & Health Sciences | 626 | 2.8% |
| Psychology | 1,284 | 5.7% |
| Social Sciences | 944 | 4.2% |
| Engineering | 1,647 | 7.3% |
| Multidisciplinary Studies | 306 | 1.3% |
| Science & Technology | 1,761 | 7.8% |
| Business | 6,333 | 28.0% |
| Education | 3,546 | 15.7% |
| Literature & Languages | 787 | 3.5% |
| Liberal Arts & History | 933 | 4.1% |
| Visual & Performing Arts | 490 | 2.2% |
| Communications | 703 | 3.1% |
| Arts & Humanities | 1,189 | 5.2% |
| Total | 22,629 | 100.0% |
Transportation & Commute in Lancaster County
Vehicle Availability by Sex in Lancaster County
The most prevalent vehicle ownership categories in Lancaster County are males with 2 vehicles (10,531, accounting for 45.2%) and females with 2 vehicles (7,951, making up 53.3%).
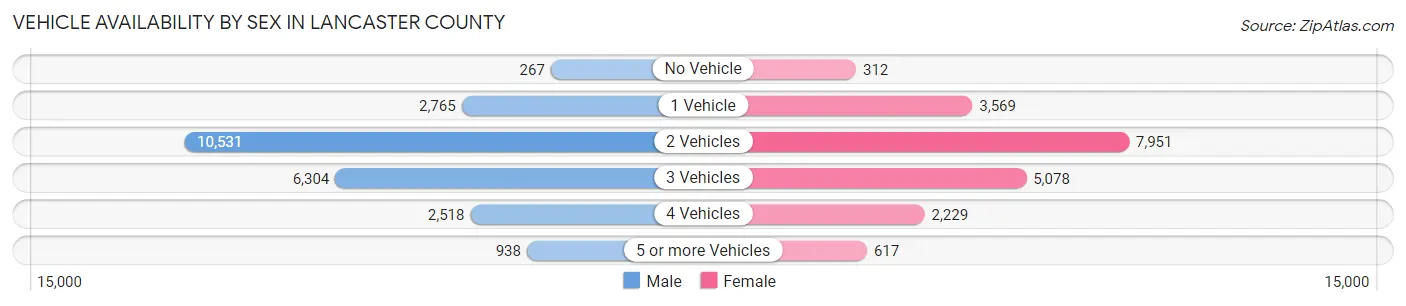
| Vehicles Available | Male | Female |
| No Vehicle | 267 (1.1%) | 312 (1.6%) |
| 1 Vehicle | 2,765 (11.9%) | 3,569 (18.1%) |
| 2 Vehicles | 10,531 (45.2%) | 7,951 (40.3%) |
| 3 Vehicles | 6,304 (27.0%) | 5,078 (25.7%) |
| 4 Vehicles | 2,518 (10.8%) | 2,229 (11.3%) |
| 5 or more Vehicles | 938 (4.0%) | 617 (3.1%) |
| Total | 23,323 (100.0%) | 19,756 (100.0%) |
Commute Time in Lancaster County
The most frequently occuring commute durations in Lancaster County are 30 to 34 minutes (5,849 commuters, 15.5%), 45 to 59 minutes (5,228 commuters, 13.9%), and 20 to 24 minutes (4,463 commuters, 11.8%).
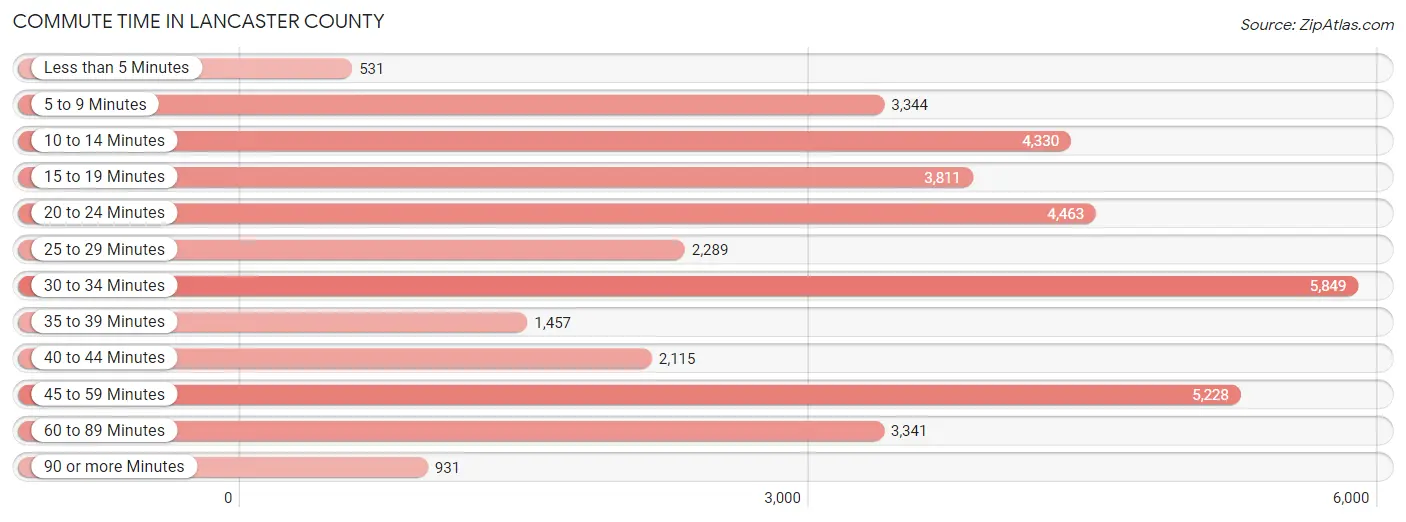
| Commute Time | # Commuters | % Commuters |
| Less than 5 Minutes | 531 | 1.4% |
| 5 to 9 Minutes | 3,344 | 8.9% |
| 10 to 14 Minutes | 4,330 | 11.5% |
| 15 to 19 Minutes | 3,811 | 10.1% |
| 20 to 24 Minutes | 4,463 | 11.8% |
| 25 to 29 Minutes | 2,289 | 6.1% |
| 30 to 34 Minutes | 5,849 | 15.5% |
| 35 to 39 Minutes | 1,457 | 3.9% |
| 40 to 44 Minutes | 2,115 | 5.6% |
| 45 to 59 Minutes | 5,228 | 13.9% |
| 60 to 89 Minutes | 3,341 | 8.9% |
| 90 or more Minutes | 931 | 2.5% |
Commute Time by Sex in Lancaster County
The most common commute times in Lancaster County are 45 to 59 minutes (3,354 commuters, 16.3%) for males and 30 to 34 minutes (2,701 commuters, 15.8%) for females.
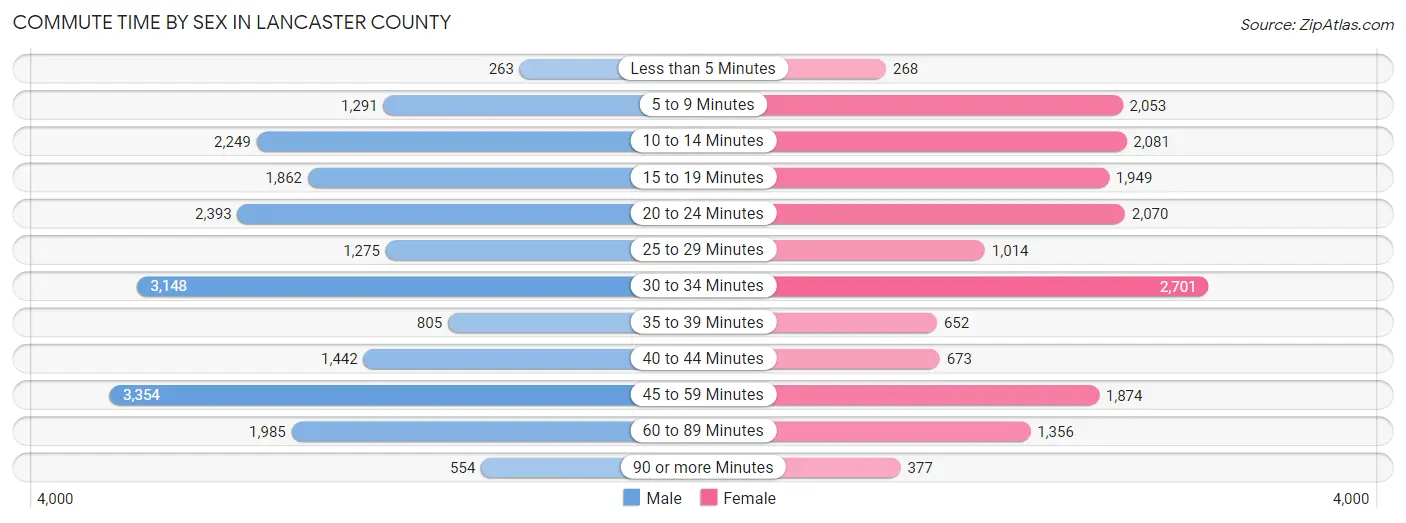
| Commute Time | Male | Female |
| Less than 5 Minutes | 263 (1.3%) | 268 (1.6%) |
| 5 to 9 Minutes | 1,291 (6.3%) | 2,053 (12.0%) |
| 10 to 14 Minutes | 2,249 (10.9%) | 2,081 (12.2%) |
| 15 to 19 Minutes | 1,862 (9.0%) | 1,949 (11.4%) |
| 20 to 24 Minutes | 2,393 (11.6%) | 2,070 (12.1%) |
| 25 to 29 Minutes | 1,275 (6.2%) | 1,014 (5.9%) |
| 30 to 34 Minutes | 3,148 (15.3%) | 2,701 (15.8%) |
| 35 to 39 Minutes | 805 (3.9%) | 652 (3.8%) |
| 40 to 44 Minutes | 1,442 (7.0%) | 673 (3.9%) |
| 45 to 59 Minutes | 3,354 (16.3%) | 1,874 (11.0%) |
| 60 to 89 Minutes | 1,985 (9.6%) | 1,356 (7.9%) |
| 90 or more Minutes | 554 (2.7%) | 377 (2.2%) |
Time of Departure to Work by Sex in Lancaster County
The most frequent times of departure to work in Lancaster County are 7:00 AM to 7:29 AM (3,216, 15.6%) for males and 7:00 AM to 7:29 AM (2,954, 17.3%) for females.
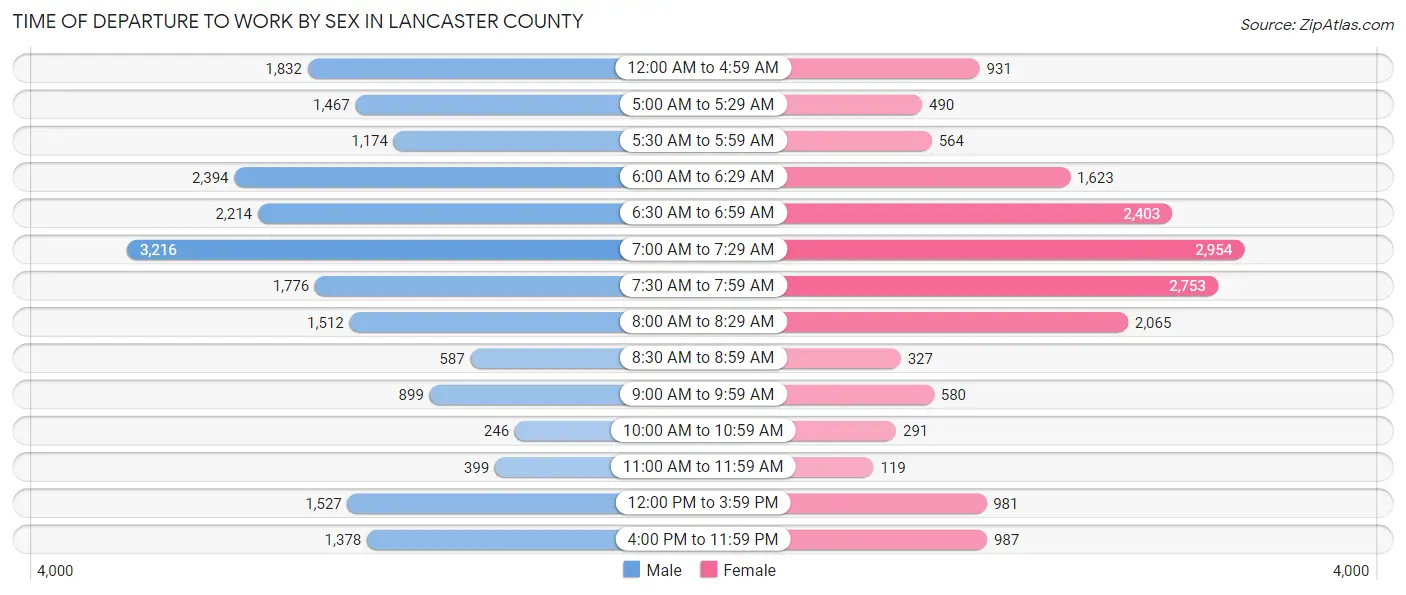
| Time of Departure | Male | Female |
| 12:00 AM to 4:59 AM | 1,832 (8.9%) | 931 (5.4%) |
| 5:00 AM to 5:29 AM | 1,467 (7.1%) | 490 (2.9%) |
| 5:30 AM to 5:59 AM | 1,174 (5.7%) | 564 (3.3%) |
| 6:00 AM to 6:29 AM | 2,394 (11.6%) | 1,623 (9.5%) |
| 6:30 AM to 6:59 AM | 2,214 (10.7%) | 2,403 (14.1%) |
| 7:00 AM to 7:29 AM | 3,216 (15.6%) | 2,954 (17.3%) |
| 7:30 AM to 7:59 AM | 1,776 (8.6%) | 2,753 (16.1%) |
| 8:00 AM to 8:29 AM | 1,512 (7.3%) | 2,065 (12.1%) |
| 8:30 AM to 8:59 AM | 587 (2.9%) | 327 (1.9%) |
| 9:00 AM to 9:59 AM | 899 (4.4%) | 580 (3.4%) |
| 10:00 AM to 10:59 AM | 246 (1.2%) | 291 (1.7%) |
| 11:00 AM to 11:59 AM | 399 (1.9%) | 119 (0.7%) |
| 12:00 PM to 3:59 PM | 1,527 (7.4%) | 981 (5.8%) |
| 4:00 PM to 11:59 PM | 1,378 (6.7%) | 987 (5.8%) |
| Total | 20,621 (100.0%) | 17,068 (100.0%) |
Housing Occupancy in Lancaster County
Occupancy by Ownership in Lancaster County
Of the total 37,893 dwellings in Lancaster County, owner-occupied units account for 30,906 (81.6%), while renter-occupied units make up 6,987 (18.4%).
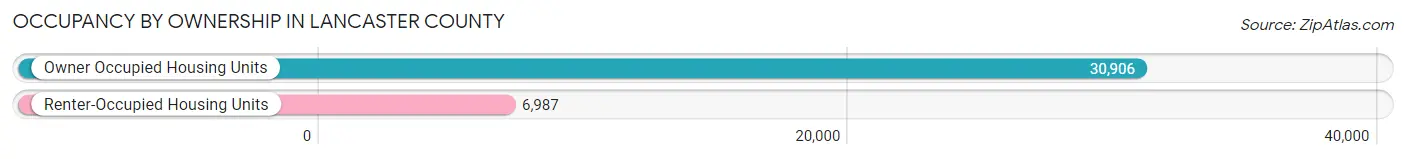
| Occupancy | # Housing Units | % Housing Units |
| Owner Occupied Housing Units | 30,906 | 81.6% |
| Renter-Occupied Housing Units | 6,987 | 18.4% |
| Total Occupied Housing Units | 37,893 | 100.0% |
Occupancy by Household Size in Lancaster County
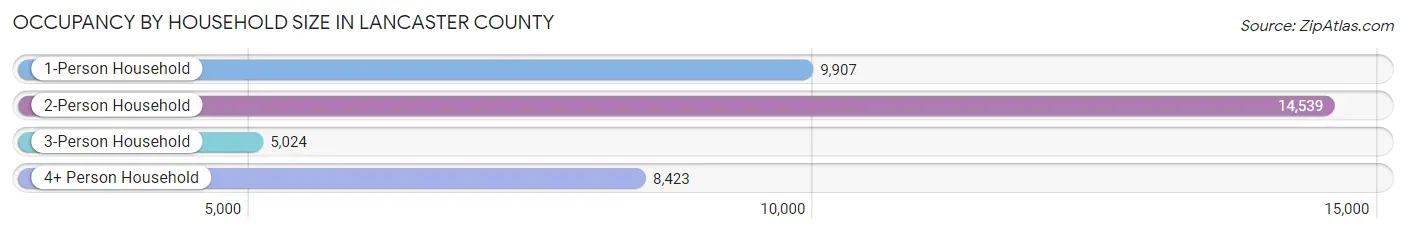
| Household Size | # Housing Units | % Housing Units |
| 1-Person Household | 9,907 | 26.1% |
| 2-Person Household | 14,539 | 38.4% |
| 3-Person Household | 5,024 | 13.3% |
| 4+ Person Household | 8,423 | 22.2% |
| Total Housing Units | 37,893 | 100.0% |
Occupancy by Ownership by Household Size in Lancaster County
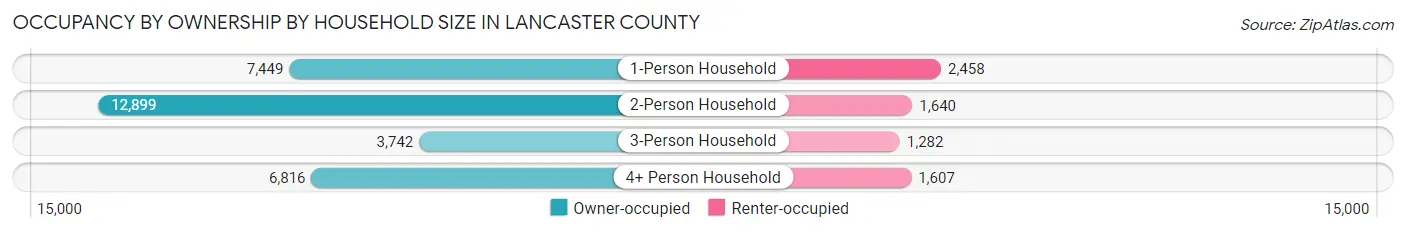
| Household Size | Owner-occupied | Renter-occupied |
| 1-Person Household | 7,449 (75.2%) | 2,458 (24.8%) |
| 2-Person Household | 12,899 (88.7%) | 1,640 (11.3%) |
| 3-Person Household | 3,742 (74.5%) | 1,282 (25.5%) |
| 4+ Person Household | 6,816 (80.9%) | 1,607 (19.1%) |
| Total Housing Units | 30,906 (81.6%) | 6,987 (18.4%) |
Occupancy by Educational Attainment in Lancaster County
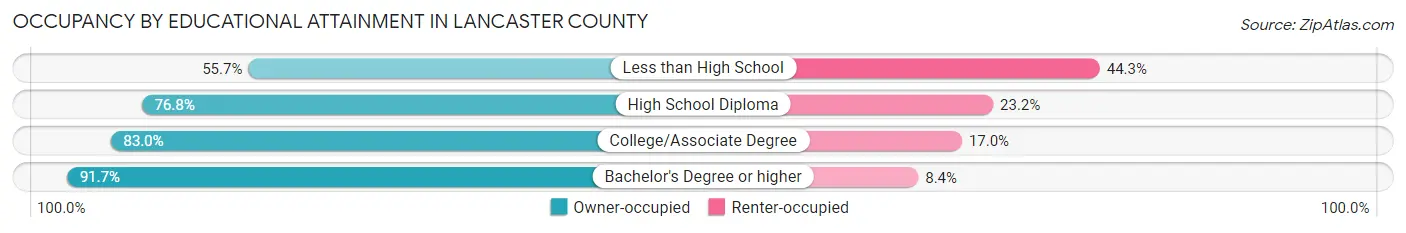
| Household Size | Owner-occupied | Renter-occupied |
| Less than High School | 1,966 (55.7%) | 1,566 (44.3%) |
| High School Diploma | 7,673 (76.8%) | 2,315 (23.2%) |
| College/Associate Degree | 10,267 (83.0%) | 2,104 (17.0%) |
| Bachelor's Degree or higher | 11,000 (91.6%) | 1,002 (8.4%) |
Occupancy by Age of Householder in Lancaster County
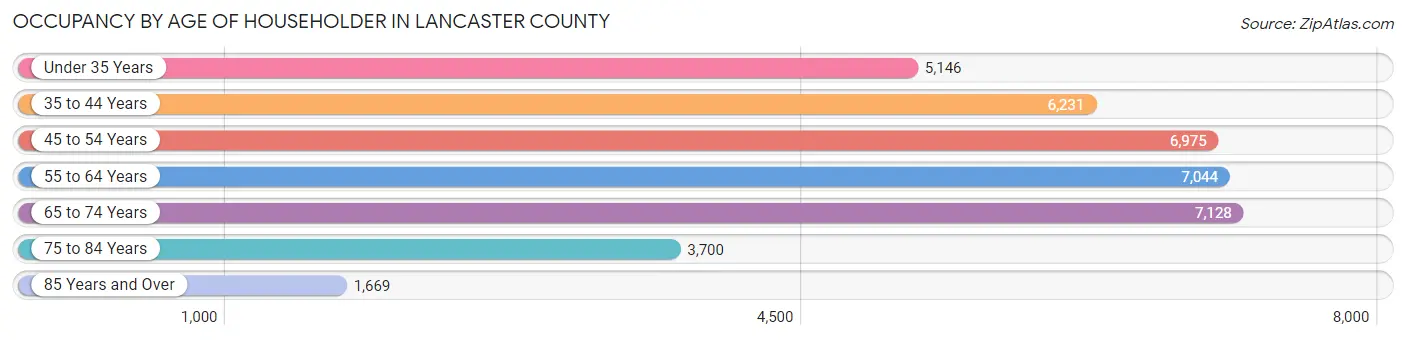
| Age Bracket | # Households | % Households |
| Under 35 Years | 5,146 | 13.6% |
| 35 to 44 Years | 6,231 | 16.4% |
| 45 to 54 Years | 6,975 | 18.4% |
| 55 to 64 Years | 7,044 | 18.6% |
| 65 to 74 Years | 7,128 | 18.8% |
| 75 to 84 Years | 3,700 | 9.8% |
| 85 Years and Over | 1,669 | 4.4% |
| Total | 37,893 | 100.0% |
Housing Finances in Lancaster County
Median Income by Occupancy in Lancaster County
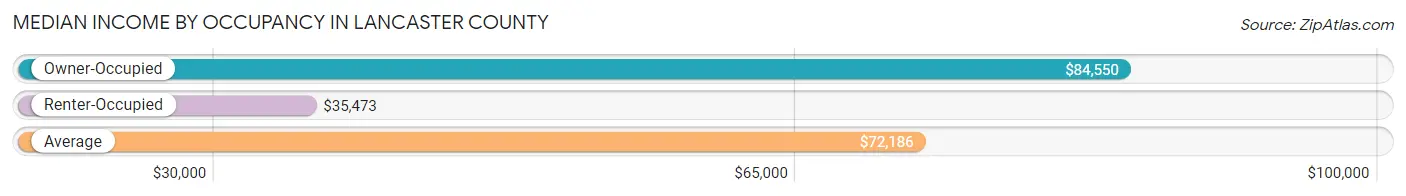
| Occupancy Type | # Households | Median Income |
| Owner-Occupied | 30,906 (81.6%) | $84,550 |
| Renter-Occupied | 6,987 (18.4%) | $35,473 |
| Average | 37,893 (100.0%) | $72,186 |
Occupancy by Householder Income Bracket in Lancaster County
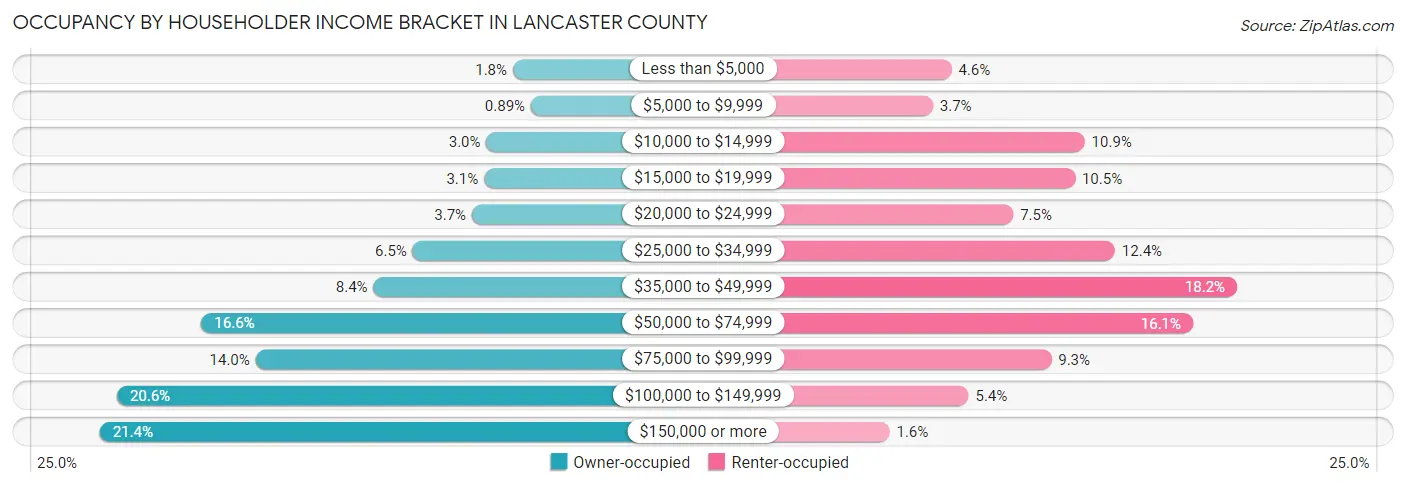
| Income Bracket | Owner-occupied | Renter-occupied |
| Less than $5,000 | 542 (1.8%) | 319 (4.6%) |
| $5,000 to $9,999 | 276 (0.9%) | 257 (3.7%) |
| $10,000 to $14,999 | 930 (3.0%) | 762 (10.9%) |
| $15,000 to $19,999 | 964 (3.1%) | 730 (10.4%) |
| $20,000 to $24,999 | 1,144 (3.7%) | 525 (7.5%) |
| $25,000 to $34,999 | 2,016 (6.5%) | 863 (12.3%) |
| $35,000 to $49,999 | 2,593 (8.4%) | 1,269 (18.2%) |
| $50,000 to $74,999 | 5,125 (16.6%) | 1,122 (16.1%) |
| $75,000 to $99,999 | 4,328 (14.0%) | 651 (9.3%) |
| $100,000 to $149,999 | 6,368 (20.6%) | 376 (5.4%) |
| $150,000 or more | 6,620 (21.4%) | 113 (1.6%) |
| Total | 30,906 (100.0%) | 6,987 (100.0%) |
Monthly Housing Cost Tiers in Lancaster County
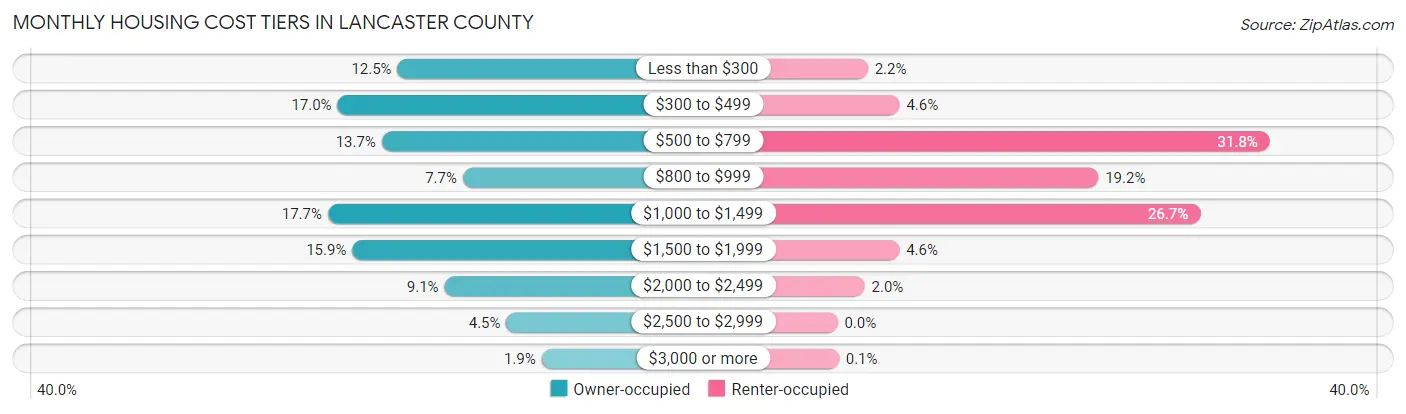
| Monthly Cost | Owner-occupied | Renter-occupied |
| Less than $300 | 3,877 (12.5%) | 156 (2.2%) |
| $300 to $499 | 5,243 (17.0%) | 319 (4.6%) |
| $500 to $799 | 4,235 (13.7%) | 2,224 (31.8%) |
| $800 to $999 | 2,388 (7.7%) | 1,342 (19.2%) |
| $1,000 to $1,499 | 5,461 (17.7%) | 1,866 (26.7%) |
| $1,500 to $1,999 | 4,904 (15.9%) | 318 (4.5%) |
| $2,000 to $2,499 | 2,806 (9.1%) | 140 (2.0%) |
| $2,500 to $2,999 | 1,397 (4.5%) | 0 (0.0%) |
| $3,000 or more | 595 (1.9%) | 7 (0.1%) |
| Total | 30,906 (100.0%) | 6,987 (100.0%) |
Physical Housing Characteristics in Lancaster County
Housing Structures in Lancaster County
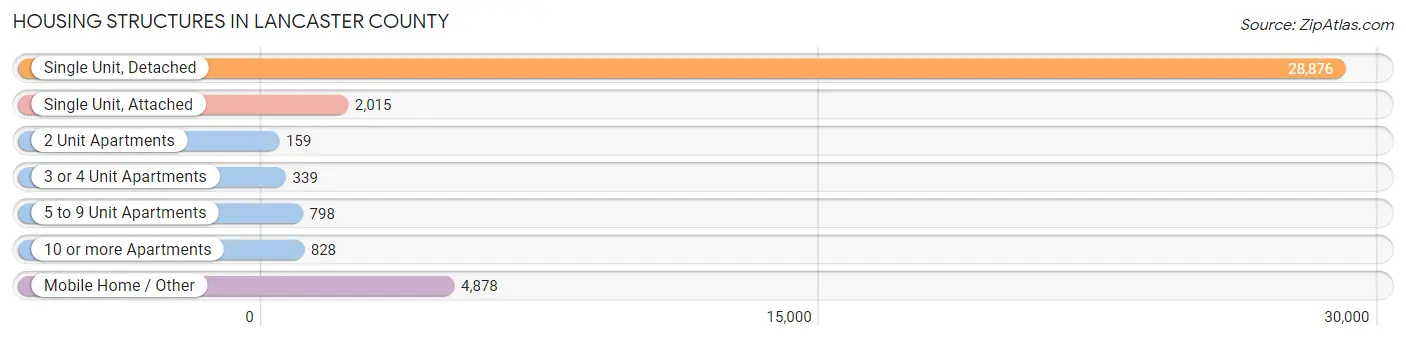
| Structure Type | # Housing Units | % Housing Units |
| Single Unit, Detached | 28,876 | 76.2% |
| Single Unit, Attached | 2,015 | 5.3% |
| 2 Unit Apartments | 159 | 0.4% |
| 3 or 4 Unit Apartments | 339 | 0.9% |
| 5 to 9 Unit Apartments | 798 | 2.1% |
| 10 or more Apartments | 828 | 2.2% |
| Mobile Home / Other | 4,878 | 12.9% |
| Total | 37,893 | 100.0% |
Housing Structures by Occupancy in Lancaster County
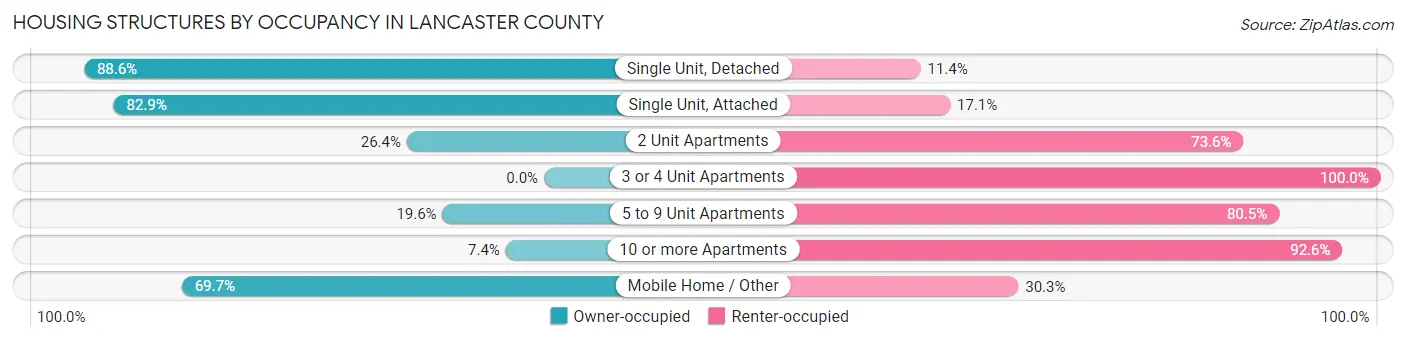
| Structure Type | Owner-occupied | Renter-occupied |
| Single Unit, Detached | 25,575 (88.6%) | 3,301 (11.4%) |
| Single Unit, Attached | 1,670 (82.9%) | 345 (17.1%) |
| 2 Unit Apartments | 42 (26.4%) | 117 (73.6%) |
| 3 or 4 Unit Apartments | 0 (0.0%) | 339 (100.0%) |
| 5 to 9 Unit Apartments | 156 (19.6%) | 642 (80.4%) |
| 10 or more Apartments | 61 (7.4%) | 767 (92.6%) |
| Mobile Home / Other | 3,402 (69.7%) | 1,476 (30.3%) |
| Total | 30,906 (81.6%) | 6,987 (18.4%) |
Housing Structures by Number of Rooms in Lancaster County
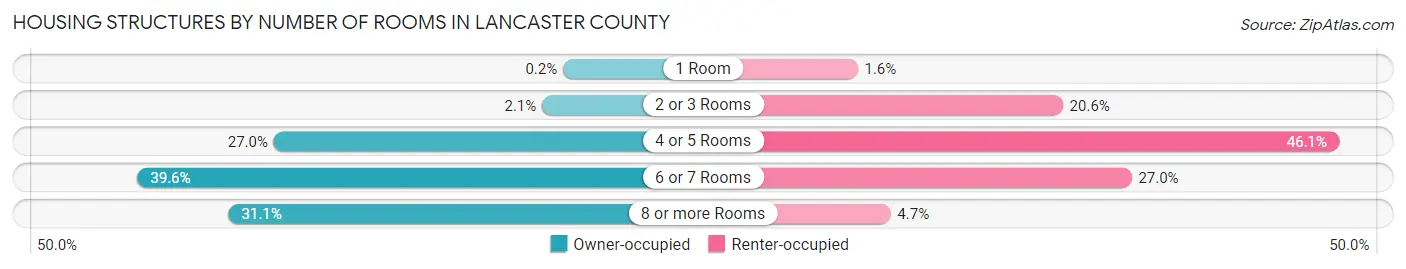
| Number of Rooms | Owner-occupied | Renter-occupied |
| 1 Room | 63 (0.2%) | 114 (1.6%) |
| 2 or 3 Rooms | 660 (2.1%) | 1,439 (20.6%) |
| 4 or 5 Rooms | 8,328 (27.0%) | 3,224 (46.1%) |
| 6 or 7 Rooms | 12,230 (39.6%) | 1,884 (27.0%) |
| 8 or more Rooms | 9,625 (31.1%) | 326 (4.7%) |
| Total | 30,906 (100.0%) | 6,987 (100.0%) |
Housing Structure by Heating Type in Lancaster County
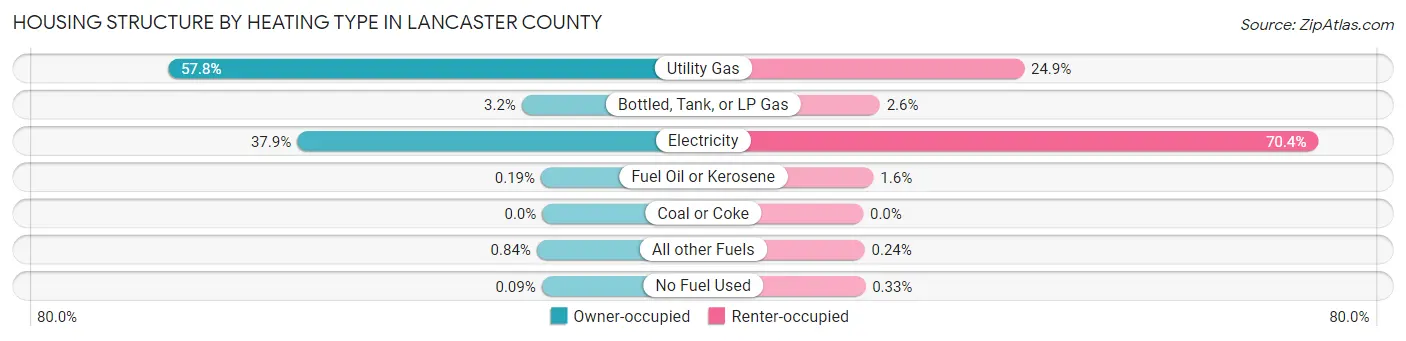
| Heating Type | Owner-occupied | Renter-occupied |
| Utility Gas | 17,874 (57.8%) | 1,739 (24.9%) |
| Bottled, Tank, or LP Gas | 976 (3.2%) | 180 (2.6%) |
| Electricity | 11,711 (37.9%) | 4,916 (70.4%) |
| Fuel Oil or Kerosene | 58 (0.2%) | 112 (1.6%) |
| Coal or Coke | 0 (0.0%) | 0 (0.0%) |
| All other Fuels | 259 (0.8%) | 17 (0.2%) |
| No Fuel Used | 28 (0.1%) | 23 (0.3%) |
| Total | 30,906 (100.0%) | 6,987 (100.0%) |
Household Vehicle Usage in Lancaster County
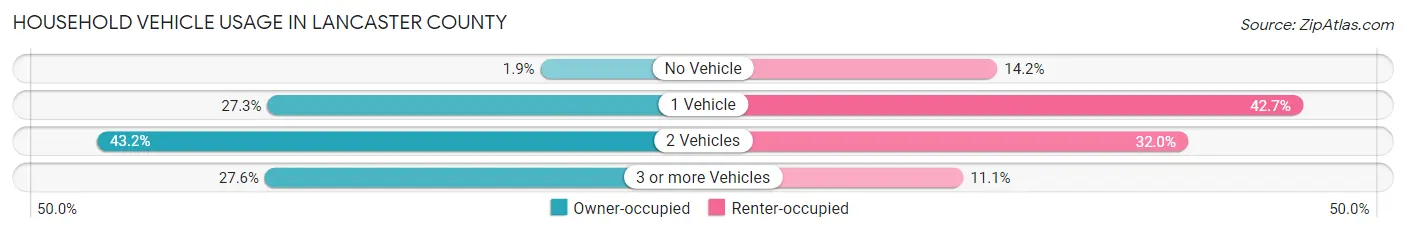
| Vehicles per Household | Owner-occupied | Renter-occupied |
| No Vehicle | 573 (1.8%) | 994 (14.2%) |
| 1 Vehicle | 8,450 (27.3%) | 2,984 (42.7%) |
| 2 Vehicles | 13,363 (43.2%) | 2,236 (32.0%) |
| 3 or more Vehicles | 8,520 (27.6%) | 773 (11.1%) |
| Total | 30,906 (100.0%) | 6,987 (100.0%) |
Real Estate & Mortgages in Lancaster County
Real Estate and Mortgage Overview in Lancaster County
| Characteristic | Without Mortgage | With Mortgage |
| Housing Units | 12,748 | 18,158 |
| Median Property Value | $188,400 | $312,800 |
| Median Household Income | $58,853 | $5,171 |
| Monthly Housing Costs | $399 | $595 |
| Real Estate Taxes | $969 | $298 |
Property Value by Mortgage Status in Lancaster County
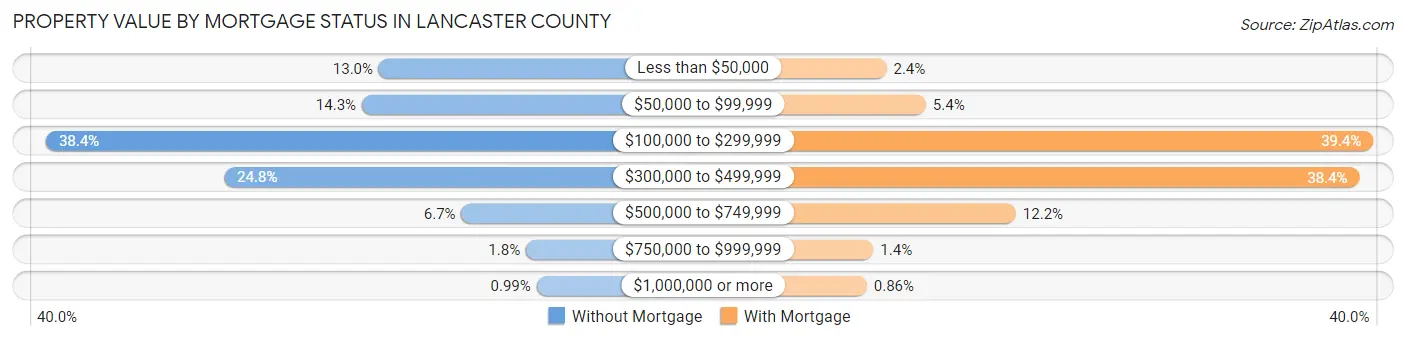
| Property Value | Without Mortgage | With Mortgage |
| Less than $50,000 | 1,659 (13.0%) | 429 (2.4%) |
| $50,000 to $99,999 | 1,823 (14.3%) | 974 (5.4%) |
| $100,000 to $299,999 | 4,891 (38.4%) | 7,162 (39.4%) |
| $300,000 to $499,999 | 3,162 (24.8%) | 6,970 (38.4%) |
| $500,000 to $749,999 | 857 (6.7%) | 2,219 (12.2%) |
| $750,000 to $999,999 | 230 (1.8%) | 247 (1.4%) |
| $1,000,000 or more | 126 (1.0%) | 157 (0.9%) |
| Total | 12,748 (100.0%) | 18,158 (100.0%) |
Household Income by Mortgage Status in Lancaster County
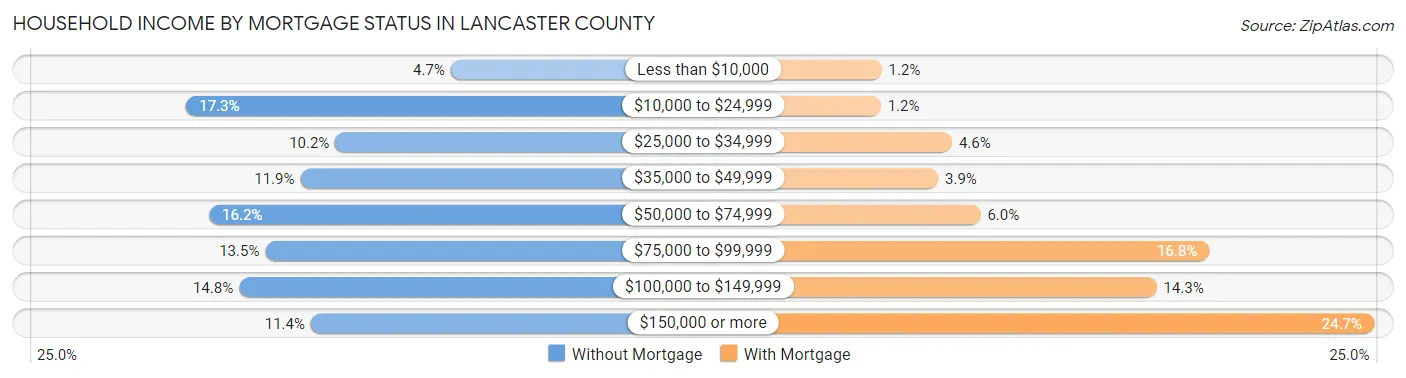
| Household Income | Without Mortgage | With Mortgage |
| Less than $10,000 | 600 (4.7%) | 226 (1.2%) |
| $10,000 to $24,999 | 2,205 (17.3%) | 218 (1.2%) |
| $25,000 to $34,999 | 1,302 (10.2%) | 833 (4.6%) |
| $35,000 to $49,999 | 1,513 (11.9%) | 714 (3.9%) |
| $50,000 to $74,999 | 2,067 (16.2%) | 1,080 (5.9%) |
| $75,000 to $99,999 | 1,726 (13.5%) | 3,058 (16.8%) |
| $100,000 to $149,999 | 1,886 (14.8%) | 2,602 (14.3%) |
| $150,000 or more | 1,449 (11.4%) | 4,482 (24.7%) |
| Total | 12,748 (100.0%) | 18,158 (100.0%) |
Property Value to Household Income Ratio in Lancaster County
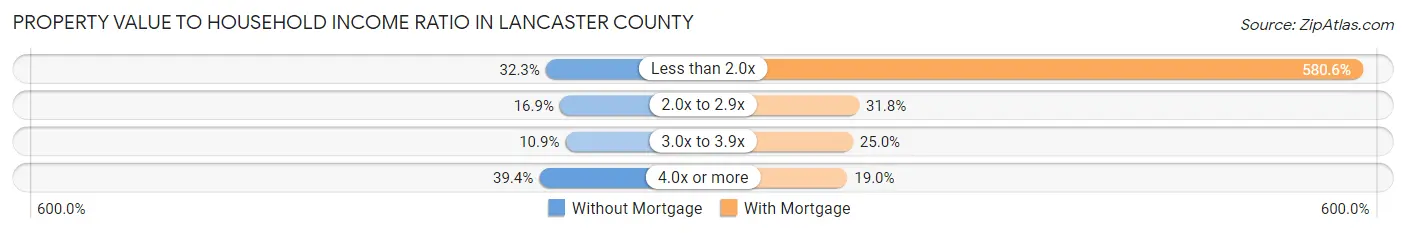
| Value-to-Income Ratio | Without Mortgage | With Mortgage |
| Less than 2.0x | 4,115 (32.3%) | 105,427 (580.6%) |
| 2.0x to 2.9x | 2,152 (16.9%) | 5,765 (31.8%) |
| 3.0x to 3.9x | 1,384 (10.9%) | 4,545 (25.0%) |
| 4.0x or more | 5,024 (39.4%) | 3,453 (19.0%) |
| Total | 12,748 (100.0%) | 18,158 (100.0%) |
Real Estate Taxes by Mortgage Status in Lancaster County
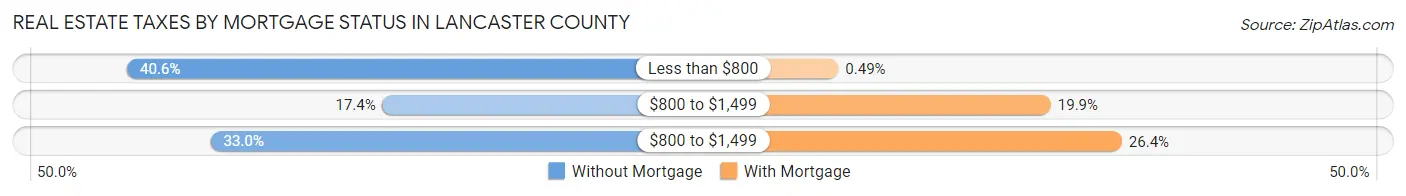
| Property Taxes | Without Mortgage | With Mortgage |
| Less than $800 | 5,181 (40.6%) | 89 (0.5%) |
| $800 to $1,499 | 2,218 (17.4%) | 3,611 (19.9%) |
| $800 to $1,499 | 4,210 (33.0%) | 4,790 (26.4%) |
| Total | 12,748 (100.0%) | 18,158 (100.0%) |
Health & Disability in Lancaster County
Health Insurance Coverage by Age in Lancaster County
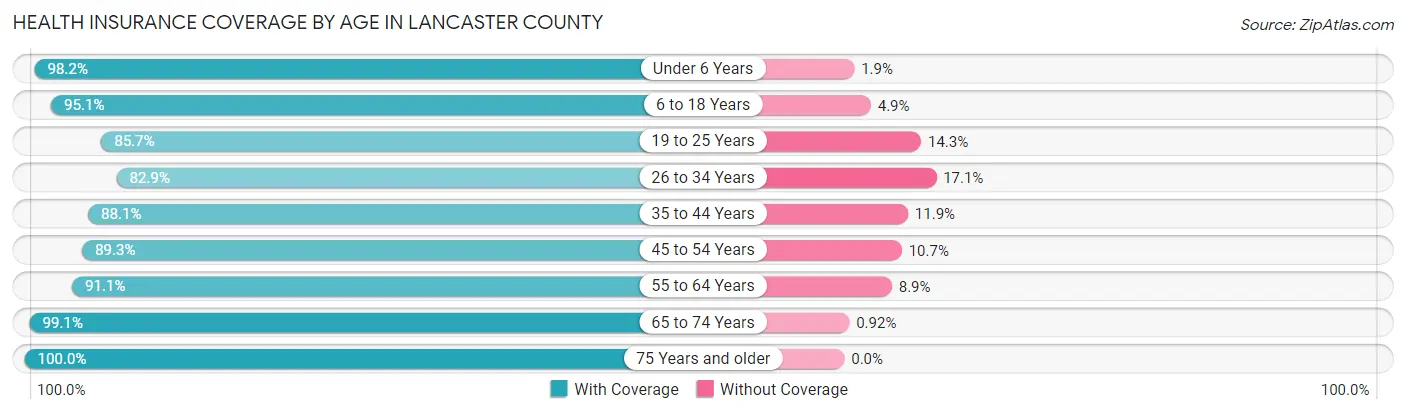
| Age Bracket | With Coverage | Without Coverage |
| Under 6 Years | 6,409 (98.2%) | 121 (1.8%) |
| 6 to 18 Years | 14,349 (95.1%) | 746 (4.9%) |
| 19 to 25 Years | 5,567 (85.7%) | 930 (14.3%) |
| 26 to 34 Years | 8,467 (82.9%) | 1,751 (17.1%) |
| 35 to 44 Years | 10,847 (88.1%) | 1,460 (11.9%) |
| 45 to 54 Years | 11,063 (89.3%) | 1,327 (10.7%) |
| 55 to 64 Years | 11,240 (91.1%) | 1,093 (8.9%) |
| 65 to 74 Years | 12,089 (99.1%) | 112 (0.9%) |
| 75 Years and older | 8,262 (100.0%) | 0 (0.0%) |
| Total | 88,293 (92.1%) | 7,540 (7.9%) |
Health Insurance Coverage by Citizenship Status in Lancaster County
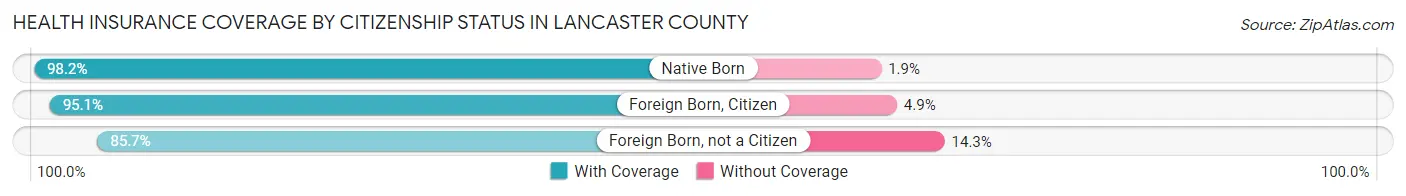
| Citizenship Status | With Coverage | Without Coverage |
| Native Born | 6,409 (98.2%) | 121 (1.8%) |
| Foreign Born, Citizen | 14,349 (95.1%) | 746 (4.9%) |
| Foreign Born, not a Citizen | 5,567 (85.7%) | 930 (14.3%) |
Health Insurance Coverage by Household Income in Lancaster County
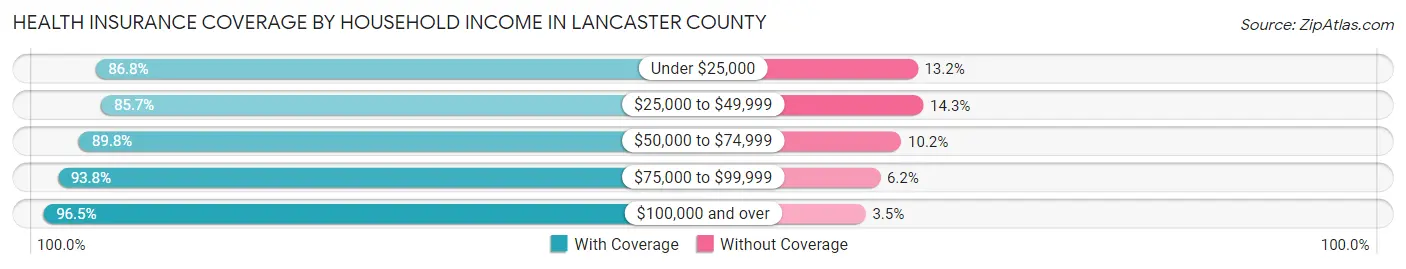
| Household Income | With Coverage | Without Coverage |
| Under $25,000 | 9,800 (86.8%) | 1,495 (13.2%) |
| $25,000 to $49,999 | 13,238 (85.7%) | 2,211 (14.3%) |
| $50,000 to $74,999 | 14,372 (89.8%) | 1,629 (10.2%) |
| $75,000 to $99,999 | 12,105 (93.8%) | 802 (6.2%) |
| $100,000 and over | 38,672 (96.5%) | 1,402 (3.5%) |
Public vs Private Health Insurance Coverage by Age in Lancaster County
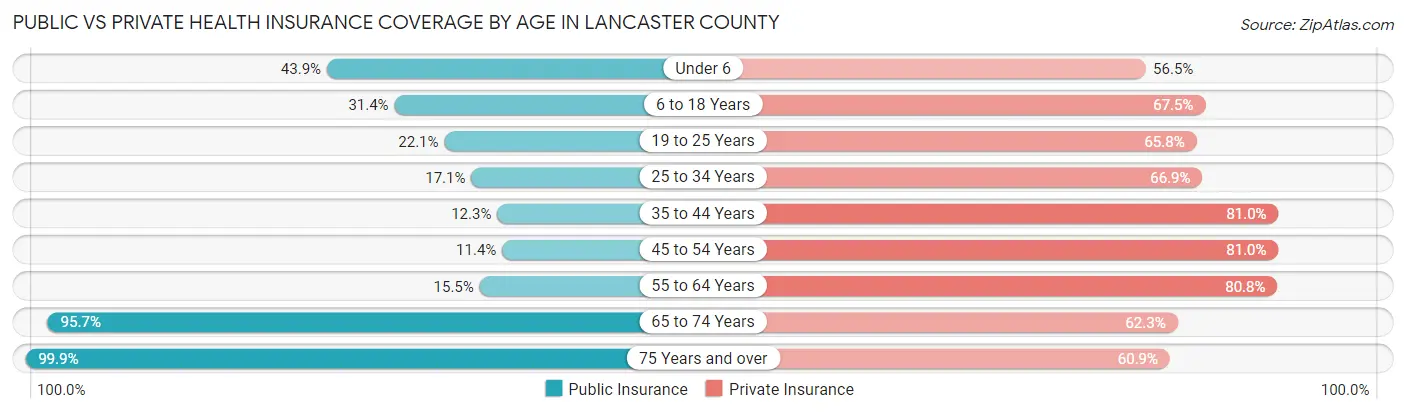
| Age Bracket | Public Insurance | Private Insurance |
| Under 6 | 2,866 (43.9%) | 3,689 (56.5%) |
| 6 to 18 Years | 4,732 (31.4%) | 10,185 (67.5%) |
| 19 to 25 Years | 1,435 (22.1%) | 4,277 (65.8%) |
| 25 to 34 Years | 1,746 (17.1%) | 6,838 (66.9%) |
| 35 to 44 Years | 1,510 (12.3%) | 9,974 (81.0%) |
| 45 to 54 Years | 1,408 (11.4%) | 10,040 (81.0%) |
| 55 to 64 Years | 1,916 (15.5%) | 9,969 (80.8%) |
| 65 to 74 Years | 11,679 (95.7%) | 7,601 (62.3%) |
| 75 Years and over | 8,252 (99.9%) | 5,031 (60.9%) |
| Total | 35,544 (37.1%) | 67,604 (70.5%) |
Disability Status by Sex by Age in Lancaster County
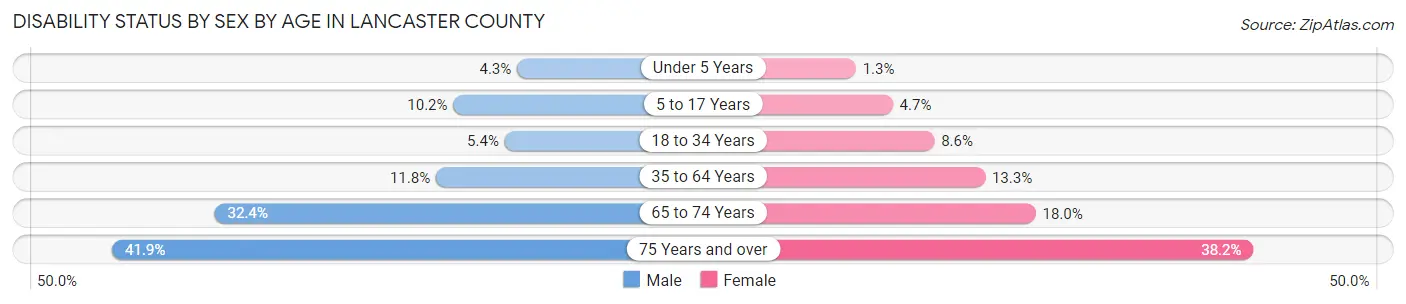
| Age Bracket | Male | Female |
| Under 5 Years | 120 (4.3%) | 34 (1.3%) |
| 5 to 17 Years | 803 (10.2%) | 357 (4.7%) |
| 18 to 34 Years | 474 (5.4%) | 752 (8.6%) |
| 35 to 64 Years | 2,108 (11.8%) | 2,551 (13.3%) |
| 65 to 74 Years | 1,784 (32.4%) | 1,203 (18.0%) |
| 75 Years and over | 1,531 (41.9%) | 1,759 (38.2%) |
Disability Class by Sex by Age in Lancaster County
Disability Class: Hearing Difficulty
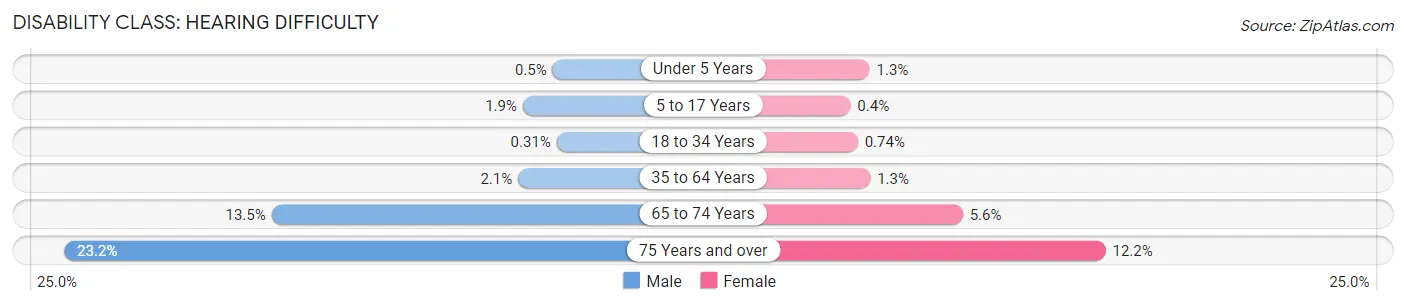
| Age Bracket | Male | Female |
| Under 5 Years | 14 (0.5%) | 34 (1.3%) |
| 5 to 17 Years | 148 (1.9%) | 30 (0.4%) |
| 18 to 34 Years | 27 (0.3%) | 65 (0.7%) |
| 35 to 64 Years | 375 (2.1%) | 254 (1.3%) |
| 65 to 74 Years | 746 (13.5%) | 375 (5.6%) |
| 75 Years and over | 847 (23.2%) | 564 (12.2%) |
Disability Class: Vision Difficulty
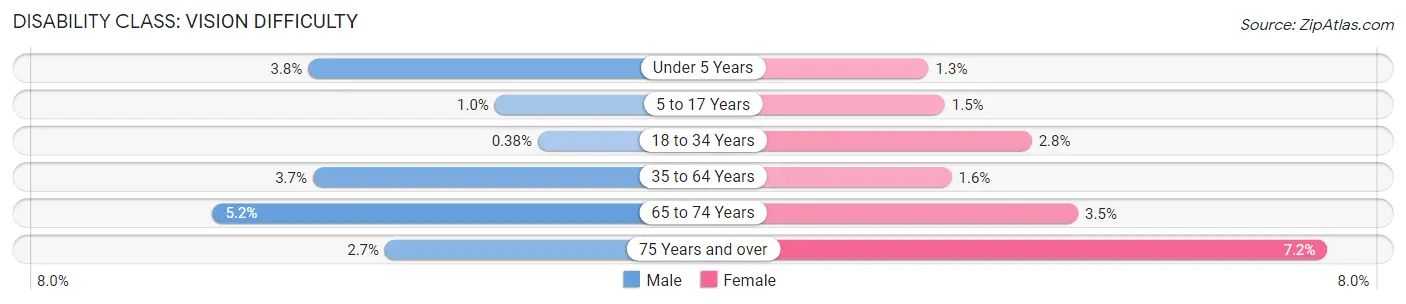
| Age Bracket | Male | Female |
| Under 5 Years | 106 (3.8%) | 34 (1.3%) |
| 5 to 17 Years | 80 (1.0%) | 116 (1.5%) |
| 18 to 34 Years | 33 (0.4%) | 247 (2.8%) |
| 35 to 64 Years | 663 (3.7%) | 313 (1.6%) |
| 65 to 74 Years | 287 (5.2%) | 235 (3.5%) |
| 75 Years and over | 97 (2.6%) | 332 (7.2%) |
Disability Class: Cognitive Difficulty
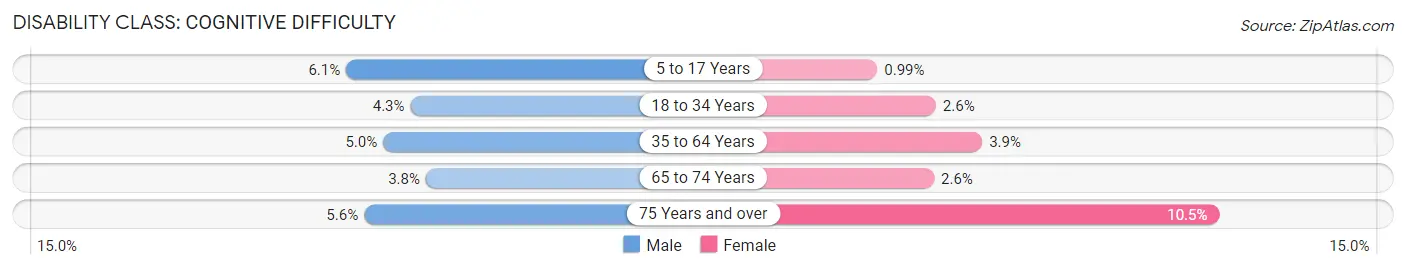
| Age Bracket | Male | Female |
| 5 to 17 Years | 476 (6.0%) | 75 (1.0%) |
| 18 to 34 Years | 371 (4.3%) | 230 (2.6%) |
| 35 to 64 Years | 895 (5.0%) | 751 (3.9%) |
| 65 to 74 Years | 211 (3.8%) | 172 (2.6%) |
| 75 Years and over | 203 (5.6%) | 484 (10.5%) |
Disability Class: Ambulatory Difficulty
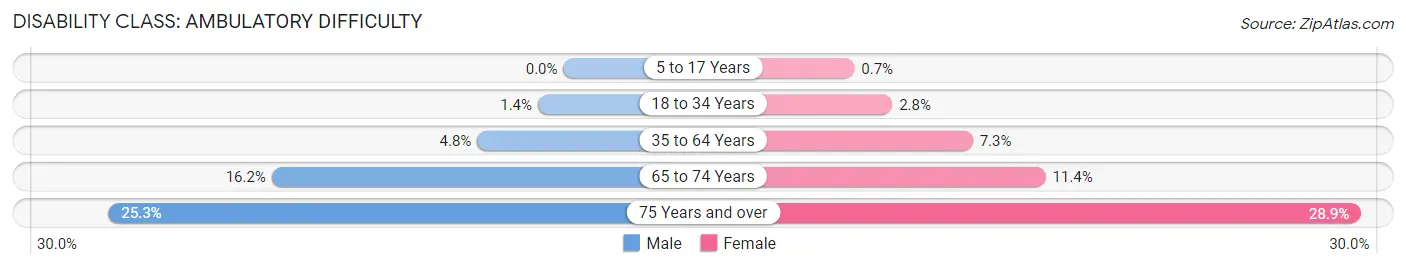
| Age Bracket | Male | Female |
| 5 to 17 Years | 0 (0.0%) | 53 (0.7%) |
| 18 to 34 Years | 124 (1.4%) | 246 (2.8%) |
| 35 to 64 Years | 856 (4.8%) | 1,399 (7.3%) |
| 65 to 74 Years | 895 (16.2%) | 759 (11.4%) |
| 75 Years and over | 926 (25.3%) | 1,332 (28.9%) |
Disability Class: Self-Care Difficulty
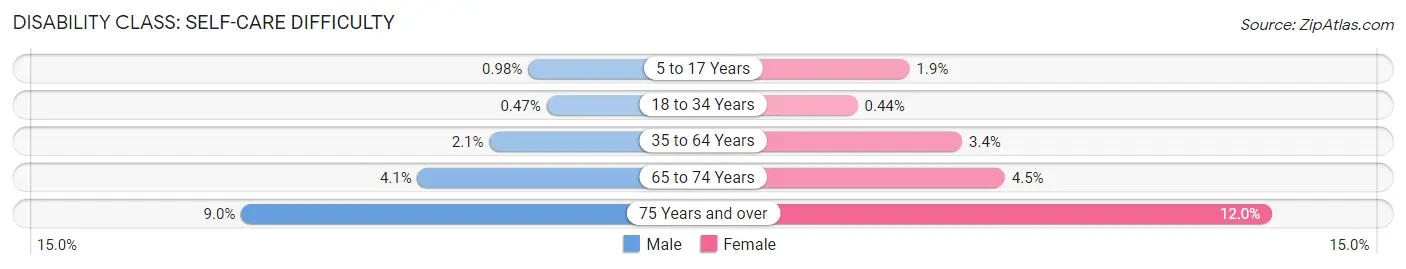
| Age Bracket | Male | Female |
| 5 to 17 Years | 77 (1.0%) | 143 (1.9%) |
| 18 to 34 Years | 41 (0.5%) | 39 (0.4%) |
| 35 to 64 Years | 367 (2.1%) | 643 (3.4%) |
| 65 to 74 Years | 224 (4.1%) | 304 (4.5%) |
| 75 Years and over | 328 (9.0%) | 552 (12.0%) |
Technology Access in Lancaster County
Computing Device Access in Lancaster County
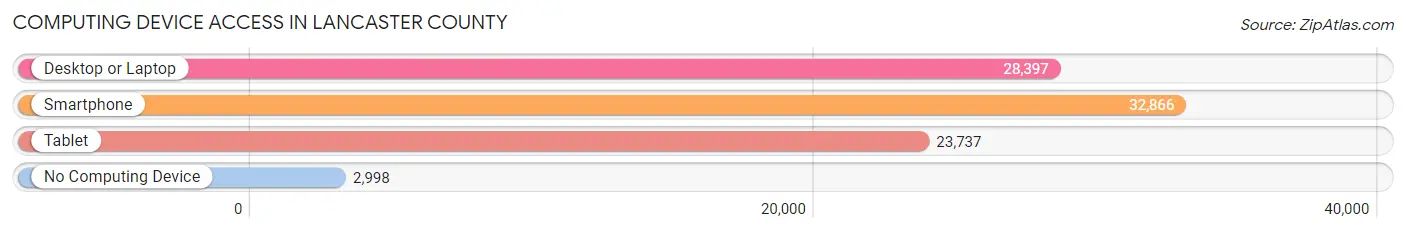
| Device Type | # Households | % Households |
| Desktop or Laptop | 28,397 | 74.9% |
| Smartphone | 32,866 | 86.7% |
| Tablet | 23,737 | 62.6% |
| No Computing Device | 2,998 | 7.9% |
| Total | 37,893 | 100.0% |
Internet Access in Lancaster County
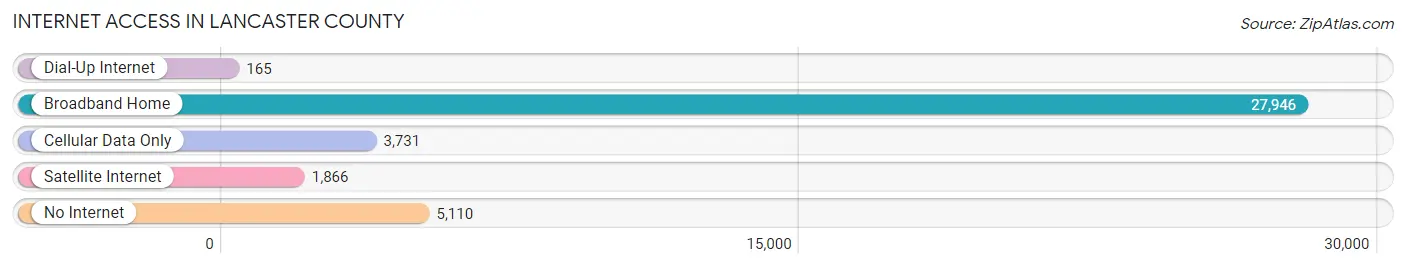
| Internet Type | # Households | % Households |
| Dial-Up Internet | 165 | 0.4% |
| Broadband Home | 27,946 | 73.8% |
| Cellular Data Only | 3,731 | 9.9% |
| Satellite Internet | 1,866 | 4.9% |
| No Internet | 5,110 | 13.5% |
| Total | 37,893 | 100.0% |
Lancaster County Summary
Lancaster County is located in the north-central part of South Carolina, and is part of the Charlotte metropolitan area. It is bordered by York County to the north, Chester County to the east, Union County to the south, and Mecklenburg County to the west. The county seat is Lancaster, and the largest city is Fort Lawn. The population of Lancaster County was 75,837 as of the 2010 census.
History
Lancaster County was formed in 1785 from the western part of York County. It was named for the House of Lancaster, a branch of the English royal family. The county was originally part of the Catawba Nation, and was settled by European-American settlers in the late 1700s.
The county was the site of several battles during the Revolutionary War, including the Battle of Waxhaws in 1780. The county was also the site of the Battle of Hanging Rock in 1781, which was a major victory for the American forces.
Geography
Lancaster County is located in the Piedmont region of South Carolina. The terrain is generally flat, with some rolling hills in the northern part of the county. The Catawba River forms the western border of the county, and the Broad River forms the eastern border.
The county has a total area of 517 square miles, of which 514 square miles is land and 3 square miles is water. The county is located in the Charlotte metropolitan area, and is approximately 40 miles south of Charlotte.
Economy
The economy of Lancaster County is largely based on agriculture and manufacturing. The county is home to several large farms, and is a major producer of cotton, soybeans, and tobacco. The county is also home to several manufacturing companies, including a large paper mill and a textile mill.
The county is also home to several large retail stores, including Walmart, Lowe's, and Target. The county is served by the Charlotte Douglas International Airport, which is located in nearby Mecklenburg County.
Demographics
As of the 2010 census, the population of Lancaster County was 75,837. The racial makeup of the county was 68.3% White, 28.2% African American, 0.4% Native American, 0.7% Asian, 0.1% Pacific Islander, 1.2% from other races, and 1.1% from two or more races. Hispanic or Latino of any race were 3.2% of the population.
The median income for a household in the county was $41,945, and the median income for a family was $50,945. The per capita income for the county was $20,945. About 15.2% of families and 19.2% of the population were below the poverty line, including 28.2% of those under age 18 and 11.2% of those age 65 or over.
Common Questions
What is Per Capita Income in Lancaster County?
Per Capita income in Lancaster County is $39,172.
What is the Median Family Income in Lancaster County?
Median Family Income in Lancaster County is $87,642.
What is the Median Household income in Lancaster County?
Median Household Income in Lancaster County is $72,186.
What is Income or Wage Gap in Lancaster County?
Income or Wage Gap in Lancaster County is 29.7%.
Women in Lancaster County earn 70.3 cents for every dollar earned by a man.
What is Family Income Deficit in Lancaster County?
Family Income Deficit in Lancaster County is $9,215.
Families that are below poverty line in Lancaster County earn $9,215 less on average than the poverty threshold level.
What is Inequality or Gini Index in Lancaster County?
Inequality or Gini Index in Lancaster County is 0.46.
What is the Total Population of Lancaster County?
Total Population of Lancaster County is 97,611.
What is the Total Male Population of Lancaster County?
Total Male Population of Lancaster County is 47,800.
What is the Total Female Population of Lancaster County?
Total Female Population of Lancaster County is 49,811.
What is the Ratio of Males per 100 Females in Lancaster County?
There are 95.96 Males per 100 Females in Lancaster County.
What is the Ratio of Females per 100 Males in Lancaster County?
There are 104.21 Females per 100 Males in Lancaster County.
What is the Median Population Age in Lancaster County?
Median Population Age in Lancaster County is 42.2 Years.
What is the Average Family Size in Lancaster County
Average Family Size in Lancaster County is 3.0 People.
What is the Average Household Size in Lancaster County
Average Household Size in Lancaster County is 2.5 People.
How Large is the Labor Force in Lancaster County?
There are 45,938 People in the Labor Forcein in Lancaster County.
What is the Percentage of People in the Labor Force in Lancaster County?
58.0% of People are in the Labor Force in Lancaster County.
What is the Unemployment Rate in Lancaster County?
Unemployment Rate in Lancaster County is 5.0%.