Cities with the Largest South African Community in the United States
RELATED REPORTS & OPTIONS
South African
United States
Compare Cities
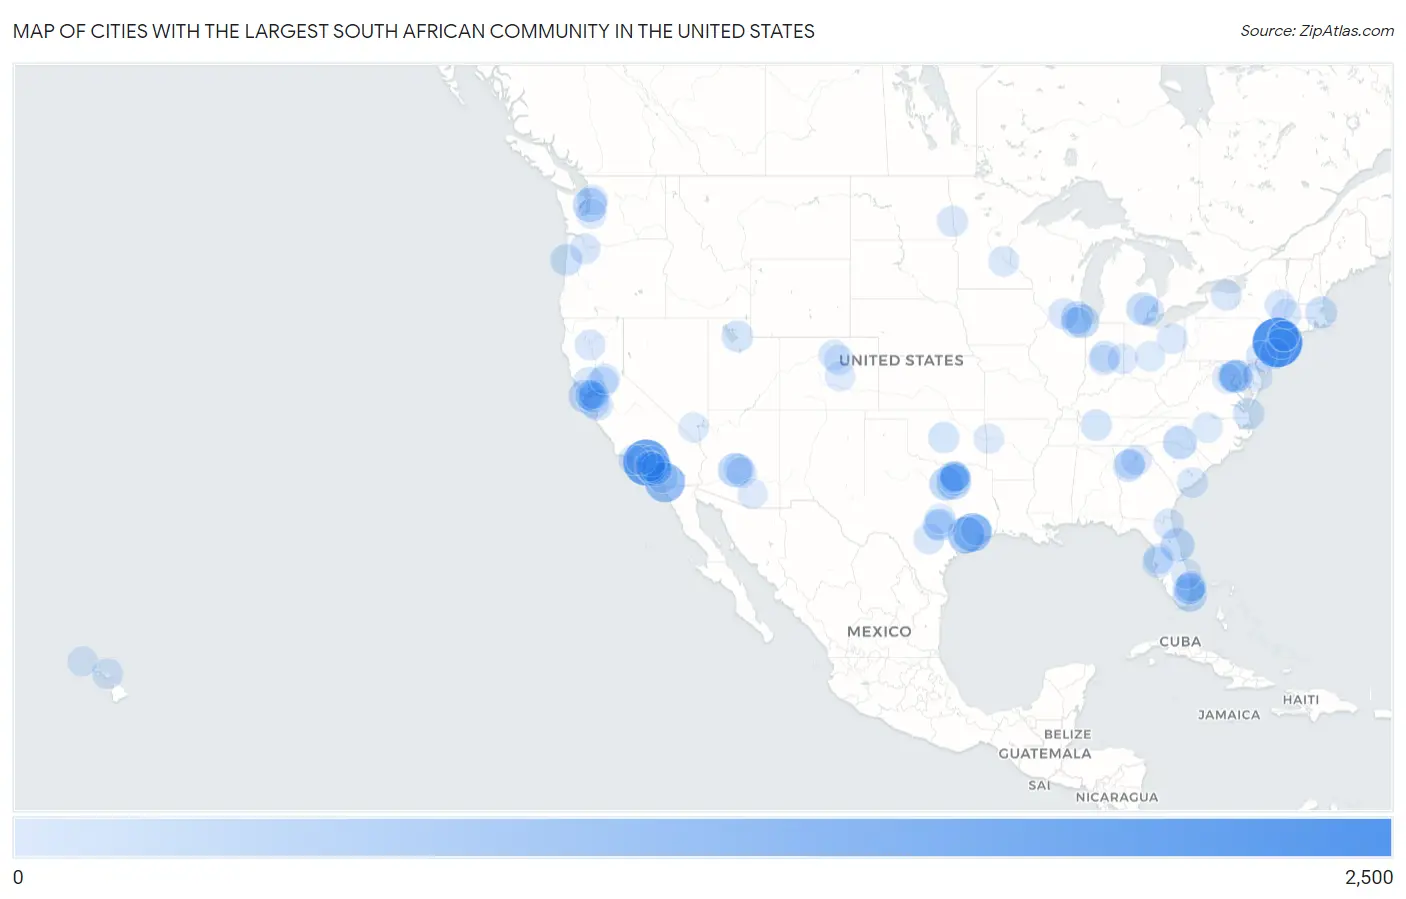
Map of Cities with the Largest South African Community in the United States
0
2,500
Cities with the Largest South African Community in the United States
| City | South African | vs State | vs National | |
| 1. | New York | 2,263 | 4,975(45.49%)#1 | 79,446(2.85%)#1 |
| 2. | Los Angeles | 1,852 | 12,663(14.63%)#1 | 79,446(2.33%)#2 |
| 3. | San Diego | 1,136 | 12,663(8.97%)#2 | 79,446(1.43%)#3 |
| 4. | Houston | 1,010 | 7,704(13.11%)#1 | 79,446(1.27%)#4 |
| 5. | Fulshear | 826 | 7,704(10.72%)#2 | 79,446(1.04%)#5 |
| 6. | Irvine | 612 | 12,663(4.83%)#3 | 79,446(0.77%)#6 |
| 7. | Dallas | 548 | 7,704(7.11%)#3 | 79,446(0.69%)#7 |
| 8. | Seattle | 511 | 2,192(23.31%)#1 | 79,446(0.64%)#8 |
| 9. | Phoenix | 508 | 1,620(31.36%)#1 | 79,446(0.64%)#9 |
| 10. | Port Orange | 491 | 8,297(5.92%)#1 | 79,446(0.62%)#10 |
| 11. | Charlotte | 484 | 3,150(15.37%)#1 | 79,446(0.61%)#11 |
| 12. | Aventura | 477 | 8,297(5.75%)#2 | 79,446(0.60%)#12 |
| 13. | Fort Worth | 475 | 7,704(6.17%)#4 | 79,446(0.60%)#13 |
| 14. | Chicago | 448 | 2,068(21.66%)#1 | 79,446(0.56%)#14 |
| 15. | Washington | 439 | 439(100.00%)#1 | 79,446(0.55%)#15 |
| 16. | San Francisco | 431 | 12,663(3.40%)#4 | 79,446(0.54%)#16 |
| 17. | Schaumburg | 362 | 2,068(17.50%)#2 | 79,446(0.46%)#17 |
| 18. | Novi | 357 | 1,290(27.67%)#1 | 79,446(0.45%)#18 |
| 19. | Summerfield | 349 | 2,250(15.51%)#1 | 79,446(0.44%)#19 |
| 20. | Boston | 303 | 2,007(15.10%)#1 | 79,446(0.38%)#20 |
| 21. | Austin | 293 | 7,704(3.80%)#5 | 79,446(0.37%)#21 |
| 22. | Lincoln City | 290 | 1,150(25.22%)#1 | 79,446(0.37%)#22 |
| 23. | Parkland | 289 | 8,297(3.48%)#3 | 79,446(0.36%)#23 |
| 24. | Richardson | 253 | 7,704(3.28%)#6 | 79,446(0.32%)#24 |
| 25. | Atlanta | 252 | 3,812(6.61%)#1 | 79,446(0.32%)#25 |
| 26. | Virginia Beach | 250 | 2,400(10.42%)#1 | 79,446(0.31%)#26 |
| 27. | Frisco | 250 | 7,704(3.25%)#7 | 79,446(0.31%)#27 |
| 28. | Layton | 248 | 906(27.37%)#1 | 79,446(0.31%)#28 |
| 29. | Carlsbad | 225 | 12,663(1.78%)#5 | 79,446(0.28%)#29 |
| 30. | Mountain View | 223 | 12,663(1.76%)#6 | 79,446(0.28%)#30 |
| 31. | Oklahoma City | 222 | 619(35.86%)#1 | 79,446(0.28%)#31 |
| 32. | Nashville | 221 | 1,308(16.90%)#1 | 79,446(0.28%)#32 |
| 33. | Sacramento | 215 | 12,663(1.70%)#7 | 79,446(0.27%)#33 |
| 34. | Ambler Borough | 213 | 2,193(9.71%)#1 | 79,446(0.27%)#34 |
| 35. | Huntington Beach | 207 | 12,663(1.63%)#8 | 79,446(0.26%)#35 |
| 36. | Atascocita | 207 | 7,704(2.69%)#8 | 79,446(0.26%)#36 |
| 37. | Fargo | 206 | 467(44.11%)#1 | 79,446(0.26%)#37 |
| 38. | Woodlawn Cdp Prince George S County | 206 | 2,250(9.16%)#2 | 79,446(0.26%)#38 |
| 39. | St Helena | 206 | 12,663(1.63%)#9 | 79,446(0.26%)#39 |
| 40. | San Jose | 201 | 12,663(1.59%)#10 | 79,446(0.25%)#40 |
| 41. | Oakland | 195 | 12,663(1.54%)#11 | 79,446(0.25%)#41 |
| 42. | Rochester | 195 | 4,975(3.92%)#2 | 79,446(0.25%)#42 |
| 43. | Rockford | 193 | 2,068(9.33%)#3 | 79,446(0.24%)#43 |
| 44. | Boca Raton | 193 | 8,297(2.33%)#4 | 79,446(0.24%)#44 |
| 45. | Tampa | 191 | 8,297(2.30%)#5 | 79,446(0.24%)#45 |
| 46. | Portland | 187 | 1,150(16.26%)#2 | 79,446(0.24%)#46 |
| 47. | Carmel | 184 | 1,264(14.56%)#1 | 79,446(0.23%)#47 |
| 48. | San Antonio | 182 | 7,704(2.36%)#9 | 79,446(0.23%)#48 |
| 49. | Naperville | 171 | 2,068(8.27%)#4 | 79,446(0.22%)#49 |
| 50. | Charleston | 170 | 1,324(12.84%)#1 | 79,446(0.21%)#50 |
| 51. | Castro Valley | 170 | 12,663(1.34%)#12 | 79,446(0.21%)#51 |
| 52. | Haiku Pauwela | 169 | 400(42.25%)#1 | 79,446(0.21%)#52 |
| 53. | Detroit | 168 | 1,290(13.02%)#2 | 79,446(0.21%)#53 |
| 54. | Redding | 166 | 12,663(1.31%)#13 | 79,446(0.21%)#54 |
| 55. | Scottsdale | 164 | 1,620(10.12%)#2 | 79,446(0.21%)#55 |
| 56. | Boynton Beach | 162 | 8,297(1.95%)#6 | 79,446(0.20%)#56 |
| 57. | Stamford | 160 | 1,216(13.16%)#1 | 79,446(0.20%)#57 |
| 58. | Greentown | 158 | 1,285(12.30%)#1 | 79,446(0.20%)#58 |
| 59. | Lakewood | 156 | 2,569(6.07%)#1 | 79,446(0.20%)#59 |
| 60. | Temple City | 156 | 12,663(1.23%)#14 | 79,446(0.20%)#60 |
| 61. | Richfield | 154 | 805(19.13%)#1 | 79,446(0.19%)#61 |
| 62. | Albany | 153 | 4,975(3.08%)#3 | 79,446(0.19%)#62 |
| 63. | Allen | 152 | 7,704(1.97%)#10 | 79,446(0.19%)#63 |
| 64. | Arlington | 151 | 2,400(6.29%)#2 | 79,446(0.19%)#64 |
| 65. | Boulder | 151 | 1,659(9.10%)#1 | 79,446(0.19%)#65 |
| 66. | Wesley Chapel | 151 | 8,297(1.82%)#7 | 79,446(0.19%)#66 |
| 67. | Philadelphia | 150 | 2,193(6.84%)#2 | 79,446(0.19%)#67 |
| 68. | Jacksonville | 150 | 8,297(1.81%)#8 | 79,446(0.19%)#68 |
| 69. | Mesa | 150 | 1,620(9.26%)#3 | 79,446(0.19%)#69 |
| 70. | Flowery Branch | 148 | 3,812(3.88%)#2 | 79,446(0.19%)#70 |
| 71. | Oxnard | 146 | 12,663(1.15%)#15 | 79,446(0.18%)#71 |
| 72. | Mill Creek | 143 | 2,192(6.52%)#2 | 79,446(0.18%)#72 |
| 73. | Woodmere | 143 | 4,975(2.87%)#4 | 79,446(0.18%)#73 |
| 74. | Lake Forest | 141 | 12,663(1.11%)#16 | 79,446(0.18%)#74 |
| 75. | Agoura Hills | 141 | 12,663(1.11%)#17 | 79,446(0.18%)#75 |
| 76. | Sandy Springs | 139 | 3,812(3.65%)#3 | 79,446(0.17%)#76 |
| 77. | Speedway | 139 | 1,264(11.00%)#2 | 79,446(0.17%)#77 |
| 78. | Tucson | 137 | 1,620(8.46%)#4 | 79,446(0.17%)#78 |
| 79. | Berkeley | 137 | 12,663(1.08%)#18 | 79,446(0.17%)#79 |
| 80. | Port St Lucie | 136 | 8,297(1.64%)#9 | 79,446(0.17%)#80 |
| 81. | Long Beach | 133 | 12,663(1.05%)#19 | 79,446(0.17%)#81 |
| 82. | Richmond | 131 | 1,264(10.36%)#3 | 79,446(0.16%)#82 |
| 83. | Columbus | 129 | 1,285(10.04%)#2 | 79,446(0.16%)#83 |
| 84. | Durham | 129 | 3,150(4.10%)#2 | 79,446(0.16%)#84 |
| 85. | Manassas | 128 | 2,400(5.33%)#3 | 79,446(0.16%)#85 |
| 86. | Pupukea | 128 | 400(32.00%)#2 | 79,446(0.16%)#86 |
| 87. | Denver | 127 | 1,659(7.66%)#2 | 79,446(0.16%)#87 |
| 88. | Old Greenwich | 125 | 1,216(10.28%)#2 | 79,446(0.16%)#88 |
| 89. | Barton Creek | 125 | 7,704(1.62%)#11 | 79,446(0.16%)#89 |
| 90. | Mckinney | 124 | 7,704(1.61%)#12 | 79,446(0.16%)#90 |
| 91. | Fort Smith | 124 | 629(19.71%)#1 | 79,446(0.16%)#91 |
| 92. | Edgewood | 124 | 2,192(5.66%)#3 | 79,446(0.16%)#92 |
| 93. | Lafayette | 123 | 12,663(0.97%)#20 | 79,446(0.15%)#93 |
| 94. | Colorado Springs | 122 | 1,659(7.35%)#3 | 79,446(0.15%)#94 |
| 95. | Georgetown | 121 | 7,704(1.57%)#13 | 79,446(0.15%)#95 |
| 96. | Milford | 121 | 402(30.10%)#1 | 79,446(0.15%)#96 |
| 97. | Henderson | 120 | 528(22.73%)#1 | 79,446(0.15%)#97 |
| 98. | Roseville | 120 | 12,663(0.95%)#21 | 79,446(0.15%)#98 |
| 99. | Bakersfield Country Club | 120 | 12,663(0.95%)#22 | 79,446(0.15%)#99 |
| 100. | Housatonic | 120 | 2,007(5.98%)#2 | 79,446(0.15%)#100 |
Common Questions
What are the Top 10 Cities with the Largest South African Community in the United States?
Top 10 Cities with the Largest South African Community in the United States are:
What city has the Largest South African Community in the United States?
New York has the Largest South African Community in the United States with 2,263.
What is the Total South African Population in the United States?
Total South African Population in the United States is 79,446.