Cities with the Highest Percentage of Immigrants from Sudan in the United States
RELATED REPORTS & OPTIONS
Sudan
United States
Compare Cities
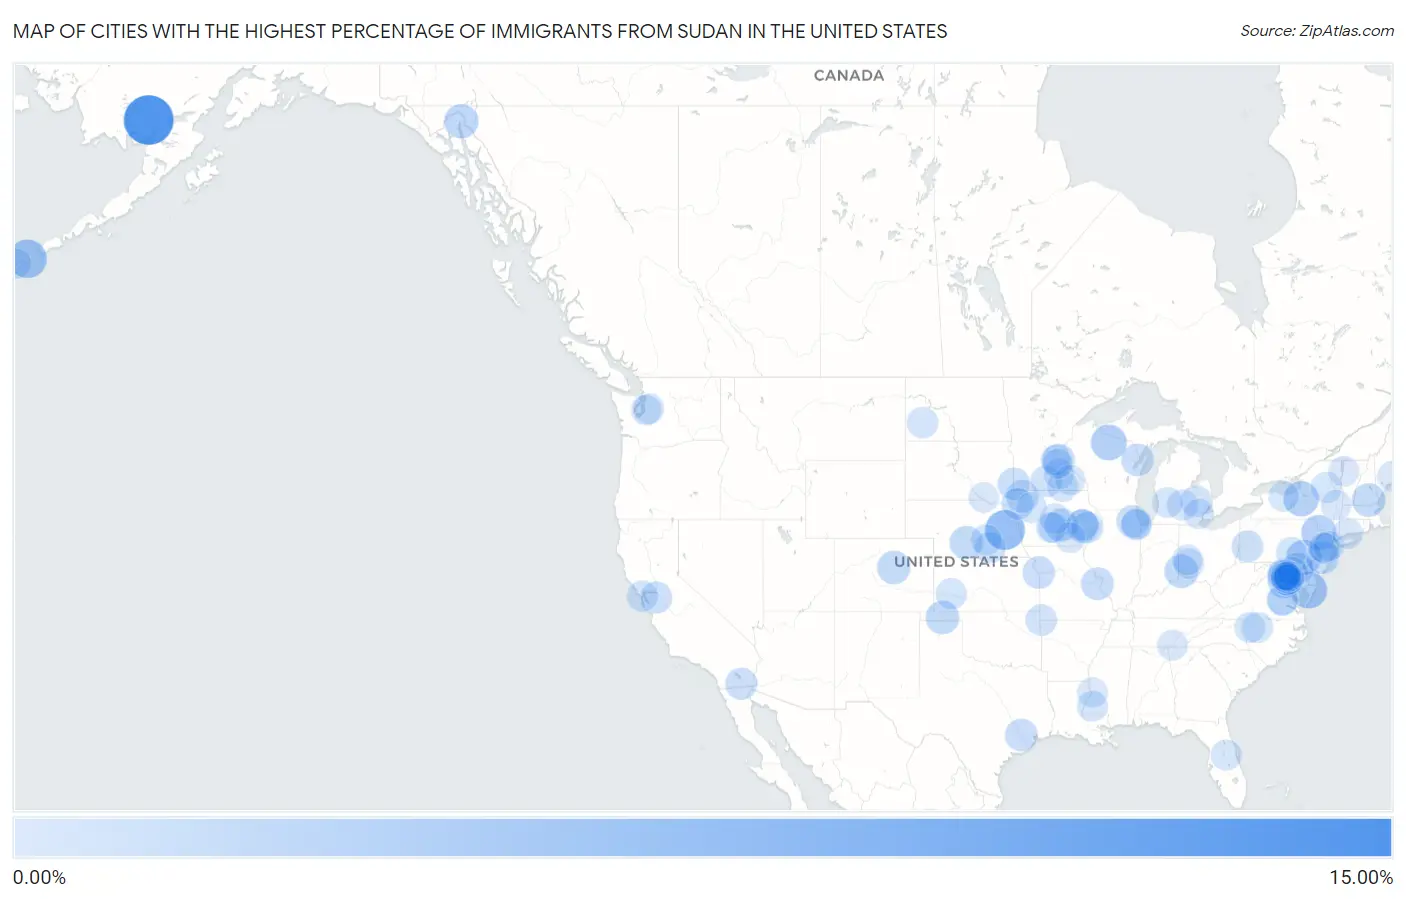
Map of Cities with the Highest Percentage of Immigrants from Sudan in the United States
0.00%
15.00%
Cities with the Highest Percentage of Immigrants from Sudan in the United States
| City | Sudan | vs State | vs National | |
| 1. | New Stuyahok | 10.12% | 0.053%(+10.1)#-1 | 0.017%(+10.1)#0 |
| 2. | Schuyler | 5.03% | 0.13%(+4.91)#-1 | 0.017%(+5.02)#1 |
| 3. | Akutan | 4.28% | 0.053%(+4.23)#0 | 0.017%(+4.26)#2 |
| 4. | Princess Anne | 3.58% | 0.029%(+3.55)#-1 | 0.017%(+3.56)#3 |
| 5. | Four Square Mile | 3.03% | 0.036%(+3.00)#1 | 0.017%(+3.02)#128 |
| 6. | Minocqua | 2.96% | 0.0036%(+2.96)#-1 | 0.017%(+2.94)#129 |
| 7. | Gap | 2.75% | 0.012%(+2.74)#-1 | 0.017%(+2.74)#130 |
| 8. | Lakeland | 2.71% | 0.019%(+2.69)#-1 | 0.017%(+2.69)#131 |
| 9. | Sunrise Lake | 2.64% | 0.012%(+2.62)#0 | 0.017%(+2.62)#132 |
| 10. | Skagway | 2.21% | 0.053%(+2.15)#1 | 0.017%(+2.19)#133 |
| 11. | Potomac Mills | 2.06% | 0.052%(+2.01)#-1 | 0.017%(+2.04)#134 |
| 12. | Dry Ridge | 1.94% | 0.014%(+1.92)#-1 | 0.017%(+1.92)#135 |
| 13. | South Hooksett | 1.89% | 0.022%(+1.87)#-1 | 0.017%(+1.88)#136 |
| 14. | Guymon | 1.80% | 0.0098%(+1.80)#-1 | 0.017%(+1.79)#137 |
| 15. | Castle Pines | 1.77% | 0.036%(+1.73)#2 | 0.017%(+1.75)#138 |
| 16. | Iowa City | 1.70% | 0.13%(+1.57)#6 | 0.017%(+1.69)#139 |
| 17. | Newton | 1.68% | 0.13%(+1.55)#7 | 0.017%(+1.67)#140 |
| 18. | Lexington | 1.64% | 0.13%(+1.51)#0 | 0.017%(+1.62)#141 |
| 19. | Pemberton Heights | 1.55% | 0.014%(+1.54)#-1 | 0.017%(+1.53)#142 |
| 20. | Dulles Town Center | 1.48% | 0.052%(+1.43)#0 | 0.017%(+1.46)#143 |
| 21. | Twin Oaks | 1.45% | 0.013%(+1.44)#-1 | 0.017%(+1.44)#144 |
| 22. | Bailey S Crossroads | 1.42% | 0.052%(+1.37)#15 | 0.017%(+1.40)#220 |
| 23. | Hilltop | 1.39% | 0.036%(+1.36)#-1 | 0.017%(+1.38)#221 |
| 24. | Woodland Park Borough | 1.38% | 0.014%(+1.37)#0 | 0.017%(+1.37)#222 |
| 25. | Peshtigo | 1.35% | 0.0036%(+1.34)#0 | 0.017%(+1.33)#223 |
| 26. | Katy | 1.32% | 0.018%(+1.30)#-1 | 0.017%(+1.30)#224 |
| 27. | Middle River | 1.29% | 0.029%(+1.26)#0 | 0.017%(+1.27)#225 |
| 28. | Riverside | 1.27% | 0.013%(+1.26)#0 | 0.017%(+1.25)#226 |
| 29. | Groveton | 1.27% | 0.052%(+1.21)#16 | 0.017%(+1.25)#227 |
| 30. | Sheldon | 1.24% | 0.13%(+1.11)#8 | 0.017%(+1.22)#228 |
| 31. | Glendale Heights | 1.23% | 0.0082%(+1.22)#-1 | 0.017%(+1.21)#229 |
| 32. | Jasper | 1.19% | 0.036%(+1.15)#0 | 0.017%(+1.17)#230 |
| 33. | Mcnair | 1.16% | 0.052%(+1.11)#17 | 0.017%(+1.15)#231 |
| 34. | Imperial | 1.11% | 0.011%(+1.10)#-1 | 0.017%(+1.09)#232 |
| 35. | Le Mars | 1.01% | 0.13%(+0.886)#9 | 0.017%(+0.998)#233 |
| 36. | Mountain House | 1.01% | 0.011%(+0.998)#0 | 0.017%(+0.992)#234 |
| 37. | Allison Park | 0.96% | 0.012%(+0.944)#1 | 0.017%(+0.939)#235 |
| 38. | Noel | 0.88% | 0.013%(+0.868)#1 | 0.017%(+0.864)#236 |
| 39. | West Liberty | 0.86% | 0.13%(+0.736)#10 | 0.017%(+0.847)#237 |
| 40. | Grand Blanc | 0.86% | 0.018%(+0.840)#-1 | 0.017%(+0.842)#238 |
| 41. | Coralville | 0.84% | 0.13%(+0.708)#11 | 0.017%(+0.819)#239 |
| 42. | Vernon Center | 0.83% | 0.036%(+0.793)#1 | 0.017%(+0.812)#240 |
| 43. | Clay Center | 0.77% | 0.13%(+0.643)#1 | 0.017%(+0.753)#241 |
| 44. | Vienna | 0.74% | 0.052%(+0.692)#19 | 0.017%(+0.727)#292 |
| 45. | Dickinson | 0.72% | 0.055%(+0.665)#-1 | 0.017%(+0.704)#293 |
| 46. | Marin City | 0.70% | 0.011%(+0.691)#1 | 0.017%(+0.685)#294 |
| 47. | Franklin Park | 0.70% | 0.014%(+0.686)#1 | 0.017%(+0.684)#295 |
| 48. | Laurel | 0.68% | 0.052%(+0.630)#20 | 0.017%(+0.665)#296 |
| 49. | Flemington Borough | 0.68% | 0.014%(+0.665)#2 | 0.017%(+0.662)#297 |
| 50. | East Lansdowne Borough | 0.63% | 0.012%(+0.617)#2 | 0.017%(+0.612)#298 |
| 51. | Grand Island | 0.63% | 0.13%(+0.502)#2 | 0.017%(+0.612)#299 |
| 52. | Garden City | 0.62% | 0.017%(+0.606)#-1 | 0.017%(+0.606)#300 |
| 53. | Newington | 0.60% | 0.052%(+0.553)#21 | 0.017%(+0.588)#301 |
| 54. | North Laurel | 0.58% | 0.029%(+0.549)#1 | 0.017%(+0.561)#302 |
| 55. | Faribault | 0.58% | 0.036%(+0.542)#2 | 0.017%(+0.561)#303 |
| 56. | Austin | 0.55% | 0.036%(+0.519)#3 | 0.017%(+0.538)#304 |
| 57. | Mebane | 0.55% | 0.025%(+0.522)#-1 | 0.017%(+0.531)#305 |
| 58. | Des Moines | 0.54% | 0.13%(+0.414)#15 | 0.017%(+0.525)#308 |
| 59. | Lansing | 0.54% | 0.018%(+0.519)#8 | 0.017%(+0.521)#309 |
| 60. | Greensboro | 0.53% | 0.025%(+0.507)#6 | 0.017%(+0.515)#310 |
| 61. | Speculator | 0.52% | 0.019%(+0.497)#0 | 0.017%(+0.499)#311 |
| 62. | Kentwood | 0.51% | 0.018%(+0.489)#9 | 0.017%(+0.490)#312 |
| 63. | Glen Allen | 0.50% | 0.052%(+0.453)#22 | 0.017%(+0.488)#313 |
| 64. | Orlovista | 0.50% | 0.0061%(+0.489)#-1 | 0.017%(+0.479)#314 |
| 65. | Issaquah | 0.48% | 0.017%(+0.465)#-1 | 0.017%(+0.466)#315 |
| 66. | Hickory Hills | 0.47% | 0.0082%(+0.461)#0 | 0.017%(+0.453)#316 |
| 67. | Lower Allen | 0.46% | 0.012%(+0.451)#3 | 0.017%(+0.446)#317 |
| 68. | New Hope | 0.46% | 0.036%(+0.422)#4 | 0.017%(+0.441)#318 |
| 69. | Countryside | 0.46% | 0.052%(+0.405)#23 | 0.017%(+0.440)#319 |
| 70. | Webster | 0.45% | 0.019%(+0.436)#1 | 0.017%(+0.438)#320 |
| 71. | Justice | 0.45% | 0.0082%(+0.439)#1 | 0.017%(+0.430)#321 |
| 72. | Storm Lake | 0.44% | 0.13%(+0.310)#16 | 0.017%(+0.421)#322 |
| 73. | Meadville | 0.43% | 0.0026%(+0.432)#-1 | 0.017%(+0.418)#323 |
| 74. | Swissvale Borough | 0.43% | 0.012%(+0.419)#4 | 0.017%(+0.414)#324 |
| 75. | Port Reading | 0.42% | 0.014%(+0.407)#3 | 0.017%(+0.404)#325 |
| 76. | Weston | 0.42% | 0.014%(+0.406)#4 | 0.017%(+0.403)#326 |
| 77. | Ottumwa | 0.41% | 0.13%(+0.286)#17 | 0.017%(+0.397)#327 |
| 78. | Crosspointe | 0.40% | 0.052%(+0.344)#24 | 0.017%(+0.379)#328 |
| 79. | Randolph | 0.39% | 0.014%(+0.380)#-1 | 0.017%(+0.378)#329 |
| 80. | Rochester | 0.38% | 0.036%(+0.349)#15 | 0.017%(+0.368)#497 |
| 81. | Centerville | 0.38% | 0.014%(+0.365)#0 | 0.017%(+0.363)#498 |
| 82. | Unalaska | 0.37% | 0.053%(+0.315)#2 | 0.017%(+0.352)#499 |
| 83. | Alexandria | 0.36% | 0.052%(+0.313)#25 | 0.017%(+0.348)#500 |
| 84. | Nevada | 0.36% | 0.13%(+0.233)#18 | 0.017%(+0.344)#501 |
| 85. | Reston | 0.36% | 0.052%(+0.308)#26 | 0.017%(+0.343)#502 |
| 86. | Burlington | 0.36% | 0.025%(+0.331)#4 | 0.017%(+0.339)#503 |
| 87. | Red Bank | 0.35% | 0.026%(+0.326)#-1 | 0.017%(+0.336)#504 |
| 88. | Cohoes | 0.35% | 0.019%(+0.332)#2 | 0.017%(+0.334)#505 |
| 89. | Travilah | 0.34% | 0.029%(+0.313)#2 | 0.017%(+0.324)#506 |
| 90. | Westland | 0.34% | 0.018%(+0.322)#10 | 0.017%(+0.324)#507 |
| 91. | Vicksburg | 0.34% | 0.0026%(+0.335)#0 | 0.017%(+0.321)#508 |
| 92. | Bloomington | 0.34% | 0.036%(+0.300)#16 | 0.017%(+0.320)#509 |
| 93. | Merrifield | 0.33% | 0.052%(+0.280)#27 | 0.017%(+0.315)#510 |
| 94. | West Haven | 0.33% | 0.021%(+0.309)#-1 | 0.017%(+0.314)#511 |
| 95. | Leesylvania | 0.33% | 0.052%(+0.274)#28 | 0.017%(+0.309)#512 |
| 96. | Dayton | 0.32% | 0.014%(+0.309)#8 | 0.017%(+0.307)#513 |
| 97. | Lake Andes | 0.32% | 0.029%(+0.289)#-1 | 0.017%(+0.301)#514 |
| 98. | Tukwila | 0.32% | 0.017%(+0.298)#0 | 0.017%(+0.299)#515 |
| 99. | Bethesda | 0.31% | 0.029%(+0.281)#19 | 0.017%(+0.292)#516 |
| 100. | West Des Moines | 0.30% | 0.13%(+0.167)#19 | 0.017%(+0.279)#517 |
Common Questions
What are the Top 10 Cities with the Highest Percentage of Immigrants from Sudan in the United States?
Top 10 Cities with the Highest Percentage of Immigrants from Sudan in the United States are:
#1
10.12%
#2
5.03%
#3
4.28%
#4
3.58%
#5
2.96%
#6
2.75%
#7
2.71%
#8
2.64%
#9
2.21%
#10
2.06%
What city has the Highest Percentage of Immigrants from Sudan in the United States?
New Stuyahok has the Highest Percentage of Immigrants from Sudan in the United States with 10.12%.
What is the Percentage of Immigrants from Sudan in the United States?
Percentage of Immigrants from Sudan in the United States is 0.017%.