Cities with the Most Immigrants from Syria in the United States
RELATED REPORTS & OPTIONS
Syria
United States
Compare Cities
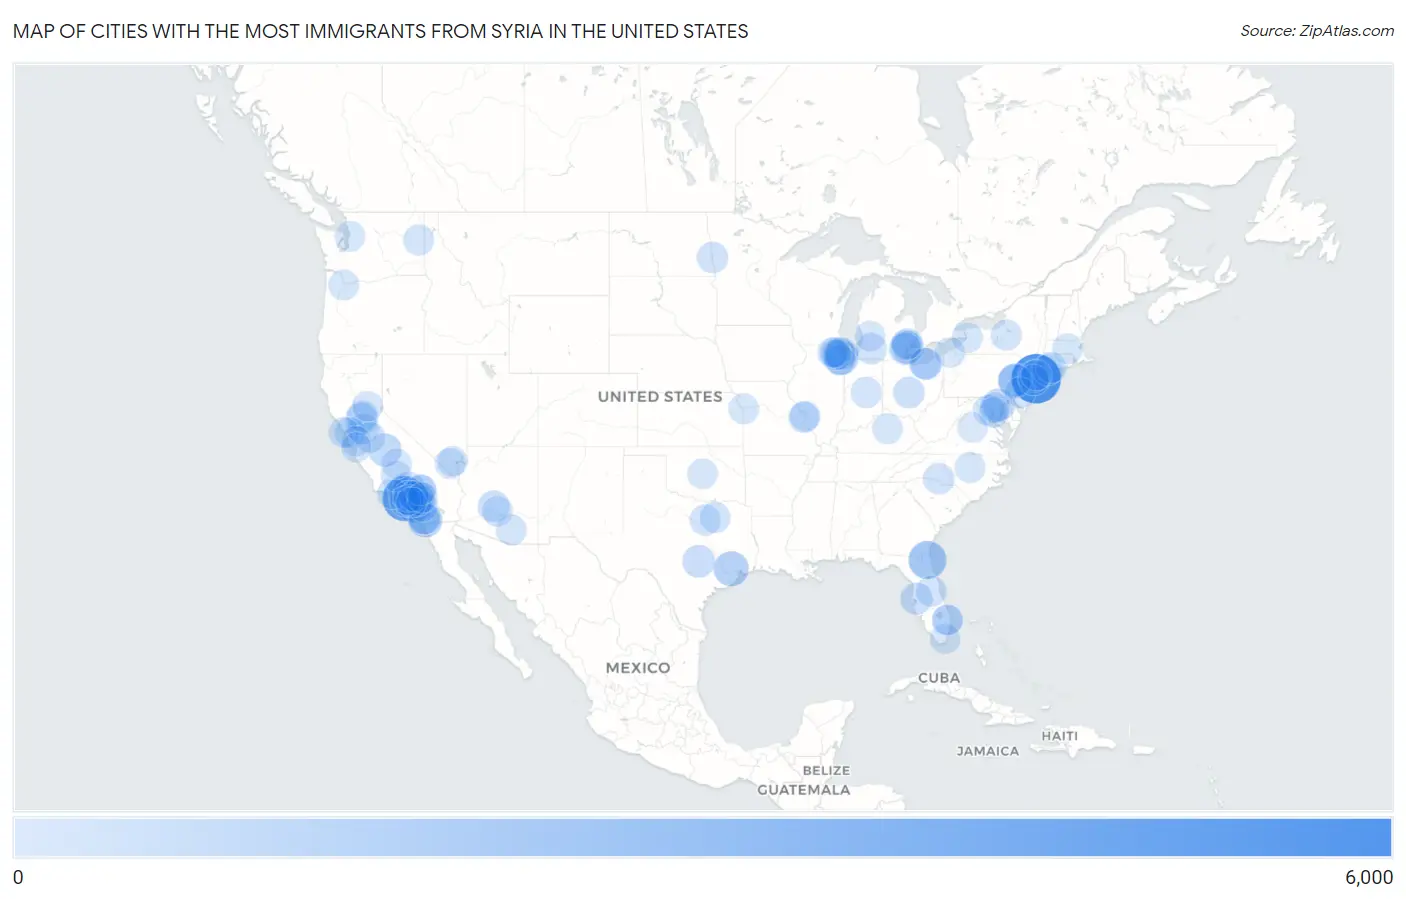
Map of Cities with the Most Immigrants from Syria in the United States
0
6,000
Cities with the Most Immigrants from Syria in the United States
| City | Syria | vs State | vs National | |
| 1. | New York | 5,285 | 7,798(67.77%)#1 | 108,470(4.87%)#1 |
| 2. | Los Angeles | 4,016 | 30,949(12.98%)#1 | 108,470(3.70%)#2 |
| 3. | Jacksonville | 2,158 | 7,299(29.57%)#1 | 108,470(1.99%)#3 |
| 4. | Glendale | 1,796 | 30,949(5.80%)#2 | 108,470(1.66%)#4 |
| 5. | Irvine | 1,511 | 30,949(4.88%)#3 | 108,470(1.39%)#5 |
| 6. | Houston | 1,373 | 6,586(20.85%)#1 | 108,470(1.27%)#6 |
| 7. | El Cajon | 1,284 | 30,949(4.15%)#4 | 108,470(1.18%)#7 |
| 8. | Chicago | 1,270 | 6,781(18.73%)#1 | 108,470(1.17%)#8 |
| 9. | Allentown | 997 | 5,121(19.47%)#1 | 108,470(0.92%)#9 |
| 10. | Fresno | 920 | 30,949(2.97%)#5 | 108,470(0.85%)#10 |
| 11. | Skokie | 914 | 6,781(13.48%)#2 | 108,470(0.84%)#11 |
| 12. | Fullerton | 907 | 5,121(17.71%)#2 | 108,470(0.84%)#12 |
| 13. | Baltimore | 838 | 2,145(39.07%)#1 | 108,470(0.77%)#13 |
| 14. | Detroit | 749 | 5,978(12.53%)#1 | 108,470(0.69%)#14 |
| 15. | Austin | 746 | 6,586(11.33%)#2 | 108,470(0.69%)#15 |
| 16. | Dearborn | 639 | 5,978(10.69%)#2 | 108,470(0.59%)#16 |
| 17. | Tampa | 603 | 7,299(8.26%)#2 | 108,470(0.56%)#17 |
| 18. | Cleveland | 592 | 3,842(15.41%)#1 | 108,470(0.55%)#18 |
| 19. | Glendora | 581 | 30,949(1.88%)#6 | 108,470(0.54%)#19 |
| 20. | Phoenix | 557 | 1,804(30.88%)#1 | 108,470(0.51%)#20 |
| 21. | Columbus | 544 | 3,842(14.16%)#2 | 108,470(0.50%)#21 |
| 22. | Fontana | 536 | 30,949(1.73%)#7 | 108,470(0.49%)#22 |
| 23. | Anaheim | 484 | 30,949(1.56%)#8 | 108,470(0.45%)#23 |
| 24. | San Diego | 480 | 30,949(1.55%)#9 | 108,470(0.44%)#24 |
| 25. | Sacramento | 476 | 30,949(1.54%)#10 | 108,470(0.44%)#25 |
| 26. | Rancho Cucamonga | 467 | 30,949(1.51%)#11 | 108,470(0.43%)#26 |
| 27. | Santa Clarita | 465 | 30,949(1.50%)#12 | 108,470(0.43%)#27 |
| 28. | Kalamazoo | 458 | 5,978(7.66%)#3 | 108,470(0.42%)#28 |
| 29. | Clifton | 455 | 5,966(7.63%)#1 | 108,470(0.42%)#29 |
| 30. | Moorhead | 454 | 928(48.92%)#1 | 108,470(0.42%)#30 |
| 31. | Charlotte | 450 | 1,332(33.78%)#1 | 108,470(0.41%)#31 |
| 32. | Santee | 443 | 30,949(1.43%)#13 | 108,470(0.41%)#32 |
| 33. | Lakewood | 436 | 3,842(11.35%)#3 | 108,470(0.40%)#33 |
| 34. | Lancaster | 431 | 30,949(1.39%)#14 | 108,470(0.40%)#34 |
| 35. | Altadena | 421 | 30,949(1.36%)#15 | 108,470(0.39%)#35 |
| 36. | Pasadena | 411 | 30,949(1.33%)#16 | 108,470(0.38%)#36 |
| 37. | Corona | 406 | 30,949(1.31%)#17 | 108,470(0.37%)#37 |
| 38. | Niles | 384 | 6,781(5.66%)#3 | 108,470(0.35%)#38 |
| 39. | Sterling Heights | 380 | 5,978(6.36%)#4 | 108,470(0.35%)#39 |
| 40. | Fishers | 379 | 975(38.87%)#1 | 108,470(0.35%)#40 |
| 41. | Wellington | 359 | 7,299(4.92%)#3 | 108,470(0.33%)#41 |
| 42. | Bridgeport | 358 | 1,475(24.27%)#1 | 108,470(0.33%)#42 |
| 43. | Riverside | 356 | 30,949(1.15%)#18 | 108,470(0.33%)#43 |
| 44. | Fort Worth | 355 | 6,586(5.39%)#3 | 108,470(0.33%)#44 |
| 45. | Philadelphia | 354 | 5,121(6.91%)#3 | 108,470(0.33%)#45 |
| 46. | New Haven | 352 | 1,475(23.86%)#2 | 108,470(0.32%)#46 |
| 47. | Syracuse | 346 | 7,798(4.44%)#2 | 108,470(0.32%)#47 |
| 48. | Murrieta | 346 | 30,949(1.12%)#19 | 108,470(0.32%)#48 |
| 49. | Garland | 345 | 6,586(5.24%)#4 | 108,470(0.32%)#49 |
| 50. | Foothill Farms | 345 | 30,949(1.11%)#20 | 108,470(0.32%)#50 |
| 51. | Stockton | 344 | 30,949(1.11%)#21 | 108,470(0.32%)#51 |
| 52. | Oakland | 331 | 30,949(1.07%)#22 | 108,470(0.31%)#52 |
| 53. | Tucson | 329 | 1,804(18.24%)#2 | 108,470(0.30%)#53 |
| 54. | Hickory Hills | 320 | 6,781(4.72%)#4 | 108,470(0.30%)#54 |
| 55. | Spokane | 314 | 1,624(19.33%)#1 | 108,470(0.29%)#55 |
| 56. | Orlando | 313 | 7,299(4.29%)#4 | 108,470(0.29%)#56 |
| 57. | San Buenaventura Ventura | 312 | 30,949(1.01%)#23 | 108,470(0.29%)#57 |
| 58. | Clayton | 309 | 1,478(20.91%)#1 | 108,470(0.28%)#58 |
| 59. | St Louis | 304 | 1,478(20.57%)#2 | 108,470(0.28%)#59 |
| 60. | Raleigh | 303 | 1,332(22.75%)#2 | 108,470(0.28%)#60 |
| 61. | Portland | 297 | 885(33.56%)#1 | 108,470(0.27%)#61 |
| 62. | Turlock | 297 | 30,949(0.96%)#24 | 108,470(0.27%)#62 |
| 63. | Lexington | 296 | 519(57.03%)#1 | 108,470(0.27%)#63 |
| 64. | Elizabeth | 290 | 5,966(4.86%)#2 | 108,470(0.27%)#64 |
| 65. | Victorville | 284 | 30,949(0.92%)#25 | 108,470(0.26%)#65 |
| 66. | Chandler | 283 | 1,804(15.69%)#3 | 108,470(0.26%)#66 |
| 67. | Worcester | 283 | 2,918(9.70%)#1 | 108,470(0.26%)#67 |
| 68. | Sugarland Run | 282 | 2,743(10.28%)#1 | 108,470(0.26%)#68 |
| 69. | Kansas City | 281 | 1,478(19.01%)#3 | 108,470(0.26%)#69 |
| 70. | Hackensack | 281 | 5,966(4.71%)#3 | 108,470(0.26%)#70 |
| 71. | Buffalo | 279 | 7,798(3.58%)#3 | 108,470(0.26%)#71 |
| 72. | Preakness | 279 | 5,966(4.68%)#4 | 108,470(0.26%)#72 |
| 73. | Spring Valley Lake | 273 | 30,949(0.88%)#26 | 108,470(0.25%)#73 |
| 74. | San Francisco | 272 | 30,949(0.88%)#27 | 108,470(0.25%)#74 |
| 75. | Grass Valley | 264 | 30,949(0.85%)#28 | 108,470(0.24%)#75 |
| 76. | Washington Borough | 259 | 5,966(4.34%)#5 | 108,470(0.24%)#76 |
| 77. | Bakersfield | 255 | 30,949(0.82%)#29 | 108,470(0.24%)#77 |
| 78. | Lawndale | 245 | 30,949(0.79%)#30 | 108,470(0.23%)#78 |
| 79. | Roselle | 243 | 6,781(3.58%)#5 | 108,470(0.22%)#79 |
| 80. | Grand Rapids | 235 | 5,978(3.93%)#5 | 108,470(0.22%)#80 |
| 81. | Oak Park | 234 | 5,978(3.91%)#6 | 108,470(0.22%)#81 |
| 82. | Oklahoma City | 233 | 623(37.40%)#1 | 108,470(0.21%)#82 |
| 83. | Martha Lake | 233 | 1,624(14.35%)#2 | 108,470(0.21%)#83 |
| 84. | Enterprise | 230 | 819(28.08%)#1 | 108,470(0.21%)#84 |
| 85. | Gilberts | 229 | 6,781(3.38%)#6 | 108,470(0.21%)#85 |
| 86. | Downey | 228 | 30,949(0.74%)#31 | 108,470(0.21%)#86 |
| 87. | Porterville | 227 | 30,949(0.73%)#32 | 108,470(0.21%)#87 |
| 88. | Washington | 223 | 223(100.00%)#1 | 108,470(0.21%)#88 |
| 89. | San Jose | 220 | 30,949(0.71%)#33 | 108,470(0.20%)#89 |
| 90. | Sunrise Manor | 220 | 819(26.86%)#2 | 108,470(0.20%)#90 |
| 91. | La Verne | 217 | 30,949(0.70%)#34 | 108,470(0.20%)#91 |
| 92. | Naranja | 217 | 7,299(2.97%)#5 | 108,470(0.20%)#92 |
| 93. | Charlottesville | 216 | 2,743(7.87%)#2 | 108,470(0.20%)#93 |
| 94. | Columbia | 210 | 2,145(9.79%)#2 | 108,470(0.19%)#94 |
| 95. | Erie | 210 | 5,121(4.10%)#4 | 108,470(0.19%)#95 |
| 96. | Redlands | 209 | 30,949(0.68%)#35 | 108,470(0.19%)#96 |
| 97. | Watsonville | 209 | 30,949(0.68%)#36 | 108,470(0.19%)#97 |
| 98. | Hoffman Estates | 209 | 6,781(3.08%)#7 | 108,470(0.19%)#98 |
| 99. | Stanton | 207 | 30,949(0.67%)#37 | 108,470(0.19%)#99 |
| 100. | Royal Palm Beach | 205 | 7,299(2.81%)#6 | 108,470(0.19%)#100 |
Common Questions
What are the Top 10 Cities with the Most Immigrants from Syria in the United States?
Top 10 Cities with the Most Immigrants from Syria in the United States are:
What city has the Most Immigrants from Syria in the United States?
New York has the Most Immigrants from Syria in the United States with 5,285.
What is the Total Immigrants from Syria in the United States?
Total Immigrants from Syria in the United States is 108,470.