Connecticut Map & Demographics
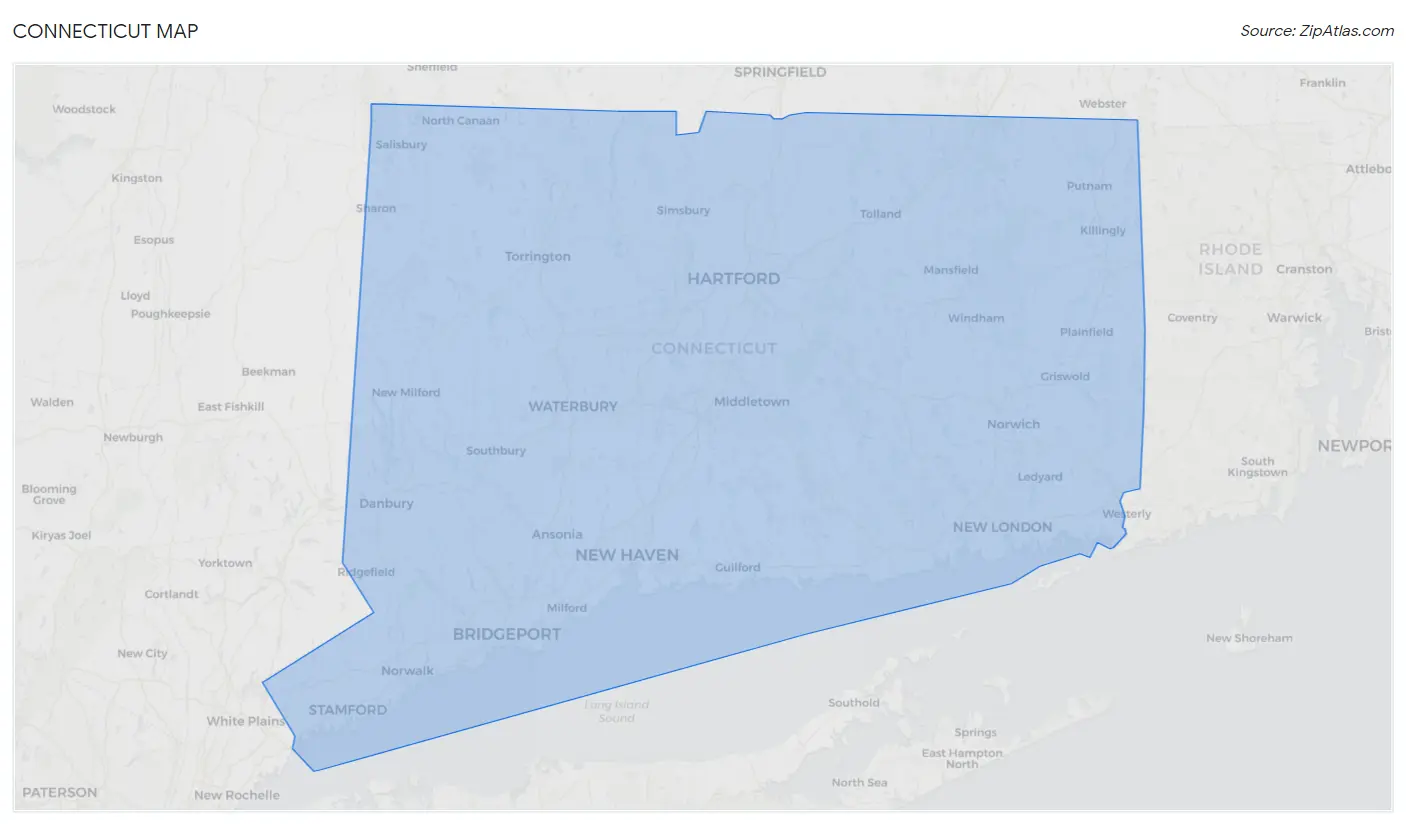
Connecticut Map
Connecticut Overview
Jan 9, 1788
INCORPORATED
5,544
TOTAL AREA [ SQ MI ]
4,840
LAND AREA [ SQ MI ]
703
WATER AREA [ SQ MI ]
500
ELEVATION AVG [ FT ]
2,380
ELEVATION HIGH [ FT ]
Sea Level
ELEVATION LOW [ FT ]
746.1
POP DENSITY [ PPL / SQ MI ]
$52,034
PER CAPITA INCOME
$115,539
AVG FAMILY INCOME
$90,213
AVG HOUSEHOLD INCOME
27.8%
WAGE / INCOME GAP [ % ]
72.2¢/ $1
WAGE / INCOME GAP [ $ ]
$10,900
FAMILY INCOME DEFICIT
0.50
INEQUALITY / GINI INDEX
06902
LARGEST ZIP CODE
Bridgeport
LARGEST CITY
Capitol Planning Region
LARGEST COUNTY
3,611,317
TOTAL POPULATION
1,769,196
MALE POPULATION
1,842,121
FEMALE POPULATION
96.04
MALES / 100 FEMALES
104.12
FEMALES / 100 MALES
40.9
MEDIAN AGE
3.1
AVG FAMILY SIZE
2.5
AVG HOUSEHOLD SIZE
1,954,584
LABOR FORCE [ PEOPLE ]
66.0%
PERCENT IN LABOR FORCE
5.9%
UNEMPLOYMENT RATE
Income in Connecticut
Income Overview in Connecticut
Per Capita Income in Connecticut is $52,034, while median incomes of families and households are $115,539 and $90,213 respectively.
| Characteristic | Number | Measure |
| Per Capita Income | 3,611,317 | $52,034 |
| Median Family Income | 911,868 | $115,539 |
| Mean Family Income | 911,868 | $158,585 |
| Median Household Income | 1,409,807 | $90,213 |
| Mean Household Income | 1,409,807 | $130,601 |
| Income Deficit | 911,868 | $10,900 |
| Wage / Income Gap (%) | 3,611,317 | 27.81% |
| Wage / Income Gap ($) | 3,611,317 | 72.19¢ per $1 |
| Gini / Inequality Index | 3,611,317 | 0.50 |
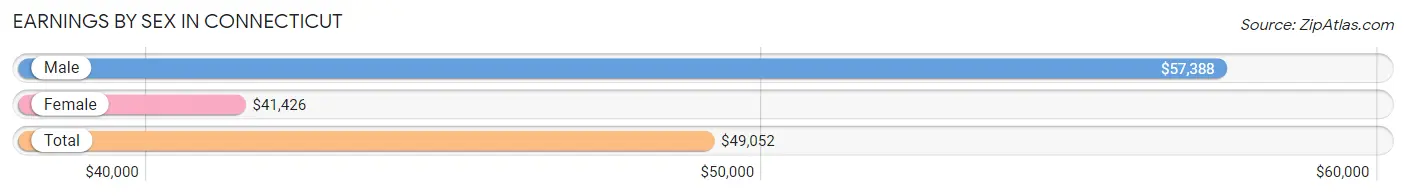
Earnings by Sex in Connecticut
Average Earnings in Connecticut are $49,052, $57,388 for men and $41,426 for women, a difference of 27.8%.
| Sex | Number | Average Earnings |
| Male | 1,049,724 (51.7%) | $57,388 |
| Female | 981,902 (48.3%) | $41,426 |
| Total | 2,031,626 (100.0%) | $49,052 |
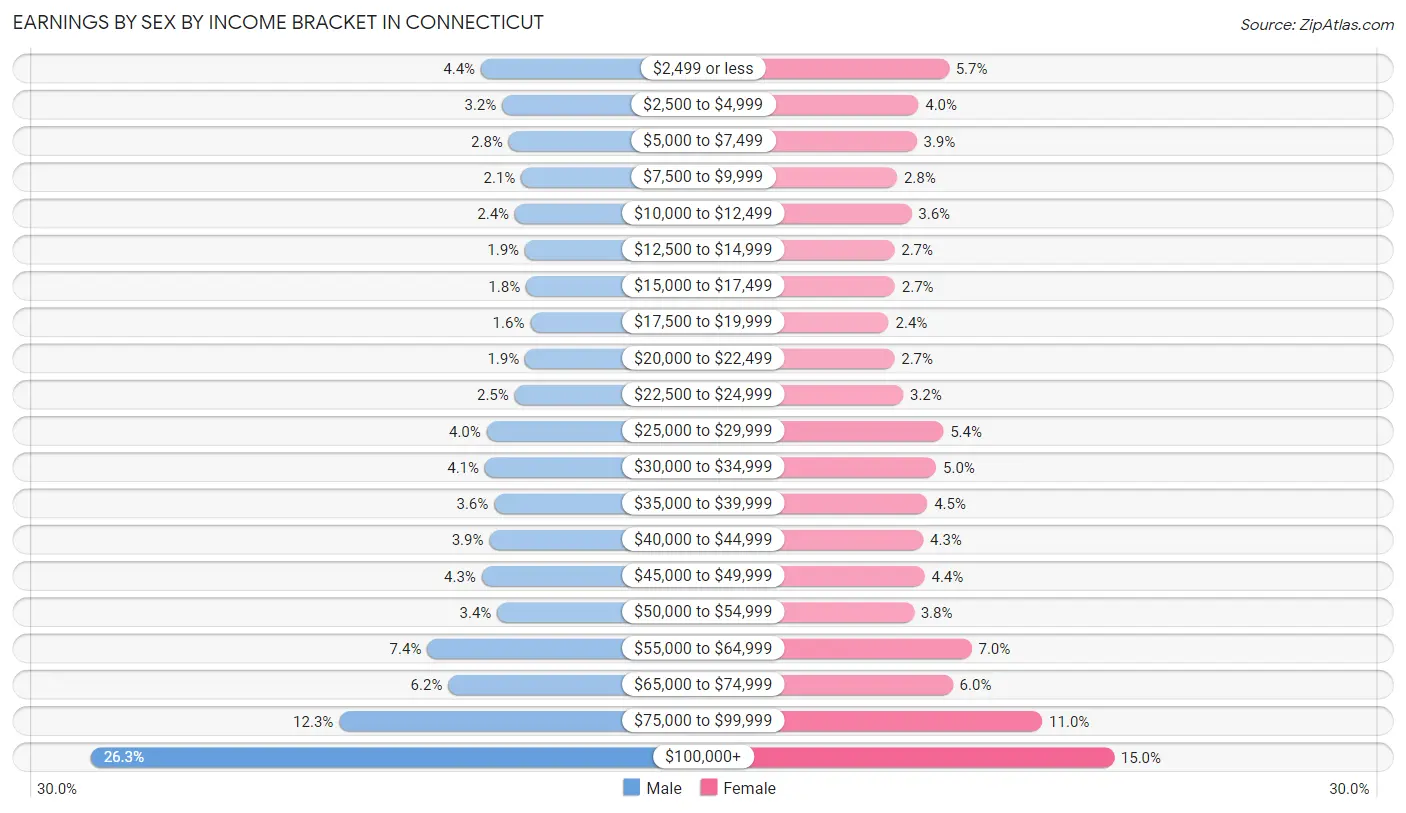
Earnings by Sex by Income Bracket in Connecticut
The most common earnings brackets in Connecticut are $100,000+ for men (275,831 | 26.3%) and $100,000+ for women (147,422 | 15.0%).
| Income | Male | Female |
| $2,499 or less | 45,627 (4.3%) | 56,301 (5.7%) |
| $2,500 to $4,999 | 33,140 (3.2%) | 39,481 (4.0%) |
| $5,000 to $7,499 | 29,294 (2.8%) | 38,496 (3.9%) |
| $7,500 to $9,999 | 21,944 (2.1%) | 27,660 (2.8%) |
| $10,000 to $12,499 | 25,572 (2.4%) | 35,672 (3.6%) |
| $12,500 to $14,999 | 19,723 (1.9%) | 26,204 (2.7%) |
| $15,000 to $17,499 | 19,085 (1.8%) | 26,489 (2.7%) |
| $17,500 to $19,999 | 16,604 (1.6%) | 23,119 (2.4%) |
| $20,000 to $22,499 | 19,664 (1.9%) | 26,175 (2.7%) |
| $22,500 to $24,999 | 25,815 (2.5%) | 31,001 (3.2%) |
| $25,000 to $29,999 | 42,316 (4.0%) | 53,227 (5.4%) |
| $30,000 to $34,999 | 43,336 (4.1%) | 49,327 (5.0%) |
| $35,000 to $39,999 | 37,930 (3.6%) | 44,413 (4.5%) |
| $40,000 to $44,999 | 40,738 (3.9%) | 42,131 (4.3%) |
| $45,000 to $49,999 | 45,257 (4.3%) | 42,865 (4.4%) |
| $50,000 to $54,999 | 36,151 (3.4%) | 36,921 (3.8%) |
| $55,000 to $64,999 | 77,373 (7.4%) | 68,796 (7.0%) |
| $65,000 to $74,999 | 64,987 (6.2%) | 58,375 (5.9%) |
| $75,000 to $99,999 | 129,337 (12.3%) | 107,827 (11.0%) |
| $100,000+ | 275,831 (26.3%) | 147,422 (15.0%) |
| Total | 1,049,724 (100.0%) | 981,902 (100.0%) |
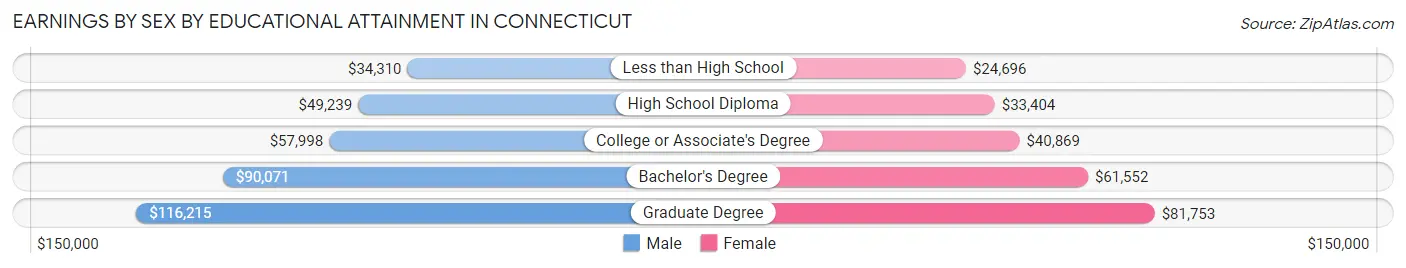
Earnings by Sex by Educational Attainment in Connecticut
Average earnings in Connecticut are $67,647 for men and $49,215 for women, a difference of 27.3%. Men with an educational attainment of graduate degree enjoy the highest average annual earnings of $116,215, while those with less than high school education earn the least with $34,310. Women with an educational attainment of graduate degree earn the most with the average annual earnings of $81,753, while those with less than high school education have the smallest earnings of $24,696.
| Educational Attainment | Male Income | Female Income |
| Less than High School | $34,310 | $24,696 |
| High School Diploma | $49,239 | $33,404 |
| College or Associate's Degree | $57,998 | $40,869 |
| Bachelor's Degree | $90,071 | $61,552 |
| Graduate Degree | $116,215 | $81,753 |
| Total | $67,647 | $49,215 |
Family Income in Connecticut
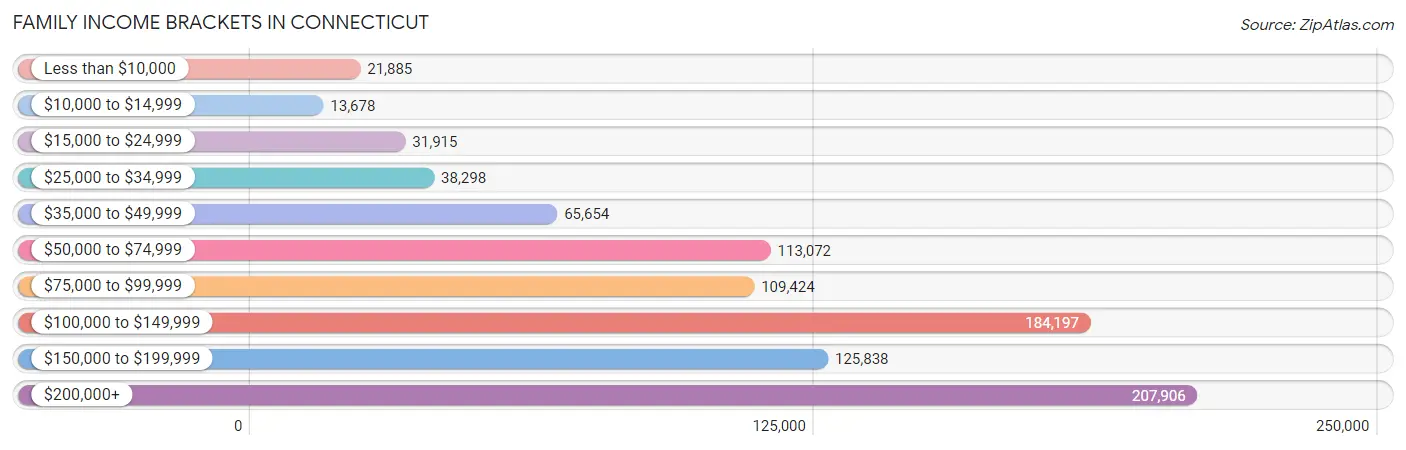
Family Income Brackets in Connecticut
According to the Connecticut family income data, there are 207,906 families falling into the $200,000+ income range, which is the most common income bracket and makes up 22.8% of all families. Conversely, the $10,000 to $14,999 income bracket is the least frequent group with only 13,678 families (1.5%) belonging to this category.
| Income Bracket | # Families | % Families |
| Less than $10,000 | 21,885 | 2.4% |
| $10,000 to $14,999 | 13,678 | 1.5% |
| $15,000 to $24,999 | 31,915 | 3.5% |
| $25,000 to $34,999 | 38,298 | 4.2% |
| $35,000 to $49,999 | 65,654 | 7.2% |
| $50,000 to $74,999 | 113,072 | 12.4% |
| $75,000 to $99,999 | 109,424 | 12.0% |
| $100,000 to $149,999 | 184,197 | 20.2% |
| $150,000 to $199,999 | 125,838 | 13.8% |
| $200,000+ | 207,906 | 22.8% |
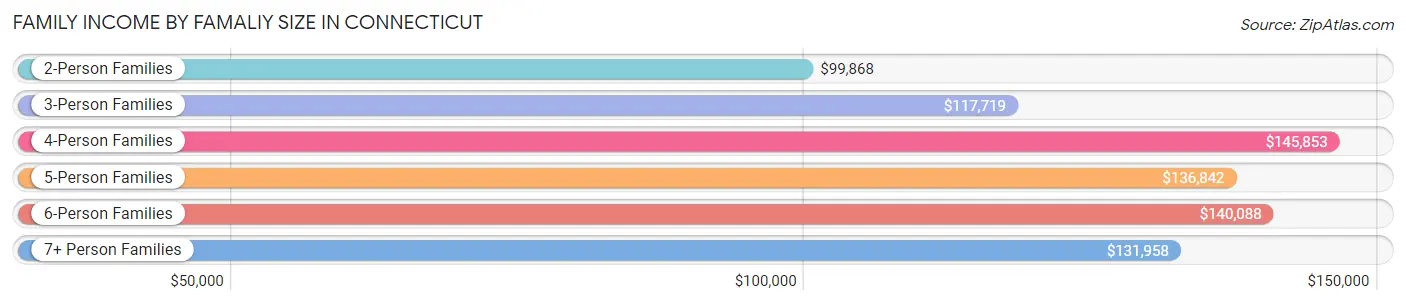
Family Income by Famaliy Size in Connecticut
4-person families (175,174 | 19.2%) account for the highest median family income in Connecticut with $145,853 per family, while 2-person families (419,126 | 46.0%) have the highest median income of $49,934 per family member.
| Income Bracket | # Families | Median Income |
| 2-Person Families | 419,126 (46.0%) | $99,868 |
| 3-Person Families | 221,900 (24.3%) | $117,719 |
| 4-Person Families | 175,174 (19.2%) | $145,853 |
| 5-Person Families | 67,998 (7.5%) | $136,842 |
| 6-Person Families | 19,085 (2.1%) | $140,088 |
| 7+ Person Families | 8,585 (0.9%) | $131,958 |
| Total | 911,868 (100.0%) | $115,539 |
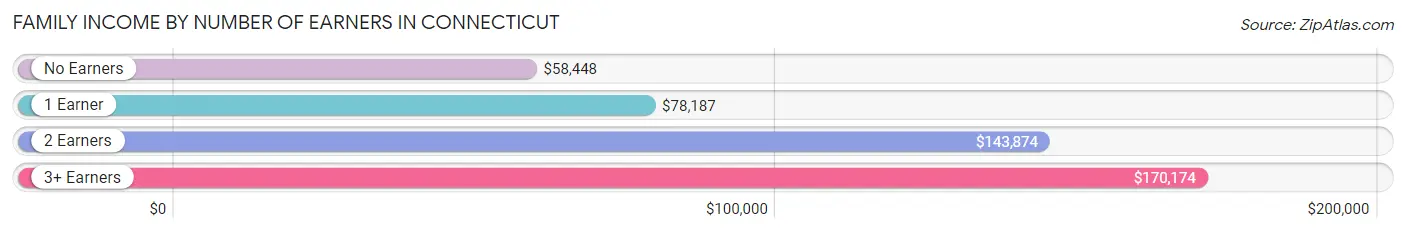
Family Income by Number of Earners in Connecticut
The median family income in Connecticut is $115,539, with families comprising 3+ earners (123,081) having the highest median family income of $170,174, while families with no earners (116,696) have the lowest median family income of $58,448, accounting for 13.5% and 12.8% of families, respectively.
| Number of Earners | # Families | Median Income |
| No Earners | 116,696 (12.8%) | $58,448 |
| 1 Earner | 272,078 (29.8%) | $78,187 |
| 2 Earners | 400,013 (43.9%) | $143,874 |
| 3+ Earners | 123,081 (13.5%) | $170,174 |
| Total | 911,868 (100.0%) | $115,539 |
Household Income in Connecticut
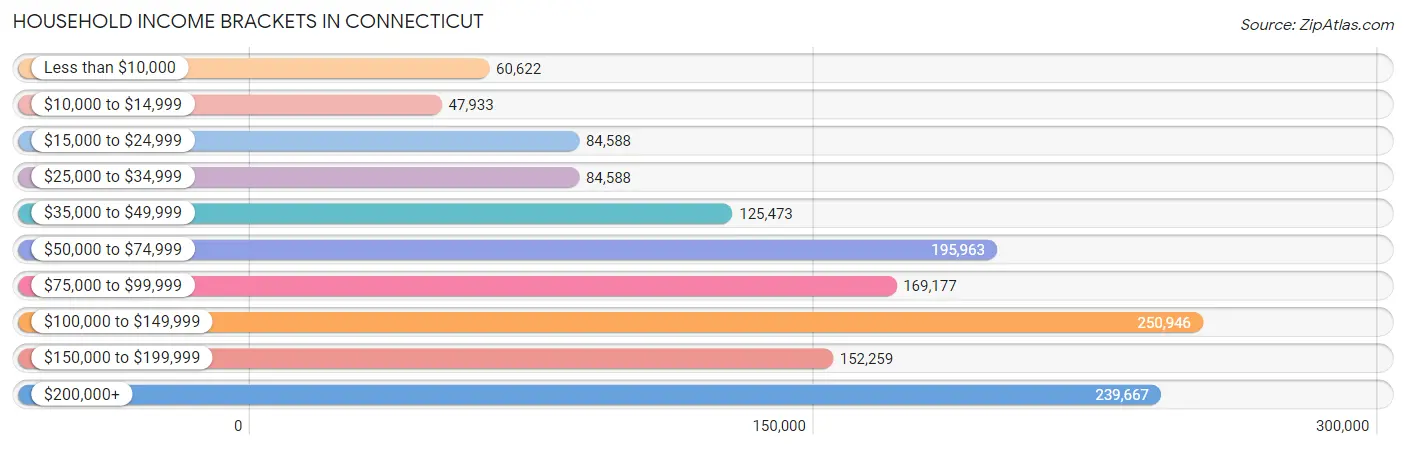
Household Income Brackets in Connecticut
With 250,946 households falling in the category, the $100,000 to $149,999 income range is the most frequent in Connecticut, accounting for 17.8% of all households. In contrast, only 47,933 households (3.4%) fall into the $10,000 to $14,999 income bracket, making it the least populous group.
| Income Bracket | # Households | % Households |
| Less than $10,000 | 60,622 | 4.3% |
| $10,000 to $14,999 | 47,933 | 3.4% |
| $15,000 to $24,999 | 84,588 | 6.0% |
| $25,000 to $34,999 | 84,588 | 6.0% |
| $35,000 to $49,999 | 125,473 | 8.9% |
| $50,000 to $74,999 | 195,963 | 13.9% |
| $75,000 to $99,999 | 169,177 | 12.0% |
| $100,000 to $149,999 | 250,946 | 17.8% |
| $150,000 to $199,999 | 152,259 | 10.8% |
| $200,000+ | 239,667 | 17.0% |
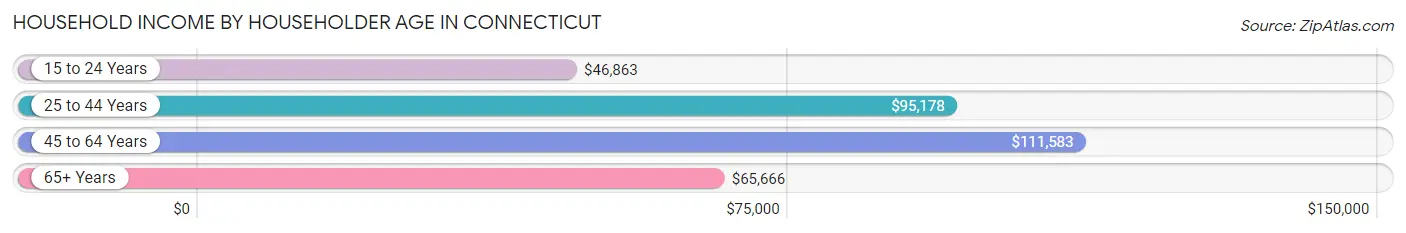
Household Income by Householder Age in Connecticut
The median household income in Connecticut is $90,213, with the highest median household income of $111,583 found in the 45 to 64 years age bracket for the primary householder. A total of 563,753 households (40.0%) fall into this category. Meanwhile, the 15 to 24 years age bracket for the primary householder has the lowest median household income of $46,863, with 35,944 households (2.5%) in this group.
| Income Bracket | # Households | Median Income |
| 15 to 24 Years | 35,944 (2.5%) | $46,863 |
| 25 to 44 Years | 419,774 (29.8%) | $95,178 |
| 45 to 64 Years | 563,753 (40.0%) | $111,583 |
| 65+ Years | 390,336 (27.7%) | $65,666 |
| Total | 1,409,807 (100.0%) | $90,213 |
Poverty in Connecticut
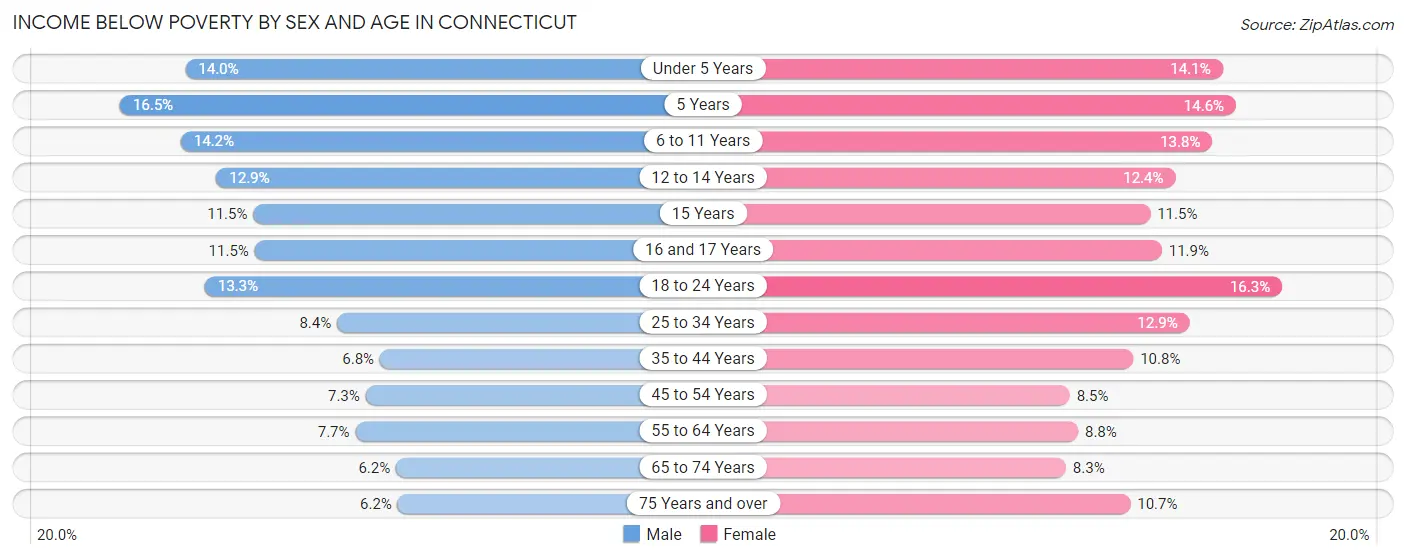
Income Below Poverty by Sex and Age in Connecticut
With 9.1% poverty level for males and 11.1% for females among the residents of Connecticut, 5 year old males and 18 to 24 year old females are the most vulnerable to poverty, with 3,186 males (16.5%) and 22,886 females (16.3%) in their respective age groups living below the poverty level.
| Age Bracket | Male | Female |
| Under 5 Years | 12,893 (14.0%) | 12,422 (14.1%) |
| 5 Years | 3,186 (16.5%) | 2,721 (14.6%) |
| 6 to 11 Years | 17,311 (14.2%) | 16,429 (13.8%) |
| 12 to 14 Years | 8,976 (12.9%) | 7,988 (12.4%) |
| 15 Years | 2,724 (11.5%) | 2,798 (11.5%) |
| 16 and 17 Years | 5,500 (11.5%) | 5,235 (11.9%) |
| 18 to 24 Years | 19,617 (13.3%) | 22,886 (16.3%) |
| 25 to 34 Years | 18,829 (8.4%) | 28,469 (12.9%) |
| 35 to 44 Years | 14,813 (6.8%) | 24,240 (10.8%) |
| 45 to 54 Years | 16,871 (7.3%) | 20,525 (8.5%) |
| 55 to 64 Years | 19,456 (7.7%) | 23,357 (8.8%) |
| 65 to 74 Years | 10,422 (6.2%) | 15,786 (8.3%) |
| 75 Years and over | 6,427 (6.1%) | 15,811 (10.7%) |
| Total | 157,025 (9.1%) | 198,667 (11.1%) |
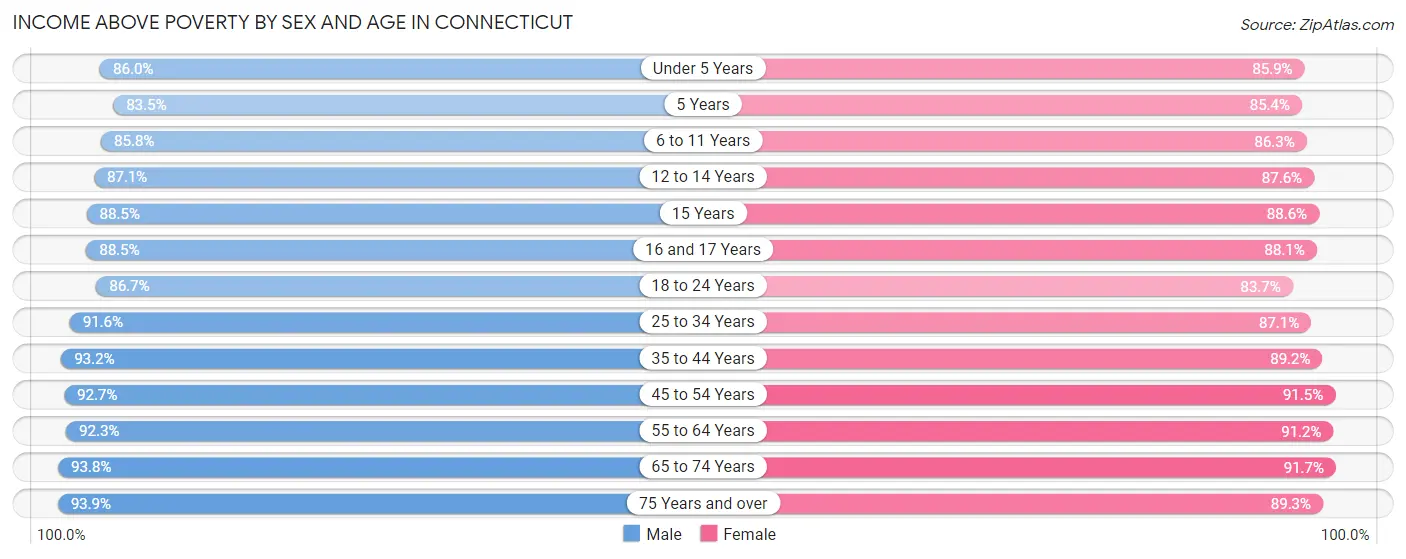
Income Above Poverty by Sex and Age in Connecticut
According to the poverty statistics in Connecticut, males aged 75 years and over and females aged 65 to 74 years are the age groups that are most secure financially, with 93.9% of males and 91.7% of females in these age groups living above the poverty line.
| Age Bracket | Male | Female |
| Under 5 Years | 79,024 (86.0%) | 75,483 (85.9%) |
| 5 Years | 16,174 (83.5%) | 15,884 (85.4%) |
| 6 to 11 Years | 104,589 (85.8%) | 103,013 (86.3%) |
| 12 to 14 Years | 60,736 (87.1%) | 56,540 (87.6%) |
| 15 Years | 20,945 (88.5%) | 21,649 (88.5%) |
| 16 and 17 Years | 42,507 (88.5%) | 38,826 (88.1%) |
| 18 to 24 Years | 127,776 (86.7%) | 117,147 (83.7%) |
| 25 to 34 Years | 205,196 (91.6%) | 192,125 (87.1%) |
| 35 to 44 Years | 202,693 (93.2%) | 199,743 (89.2%) |
| 45 to 54 Years | 213,017 (92.7%) | 222,096 (91.5%) |
| 55 to 64 Years | 232,711 (92.3%) | 242,826 (91.2%) |
| 65 to 74 Years | 157,357 (93.8%) | 173,990 (91.7%) |
| 75 Years and over | 98,048 (93.9%) | 131,776 (89.3%) |
| Total | 1,560,773 (90.9%) | 1,591,098 (88.9%) |
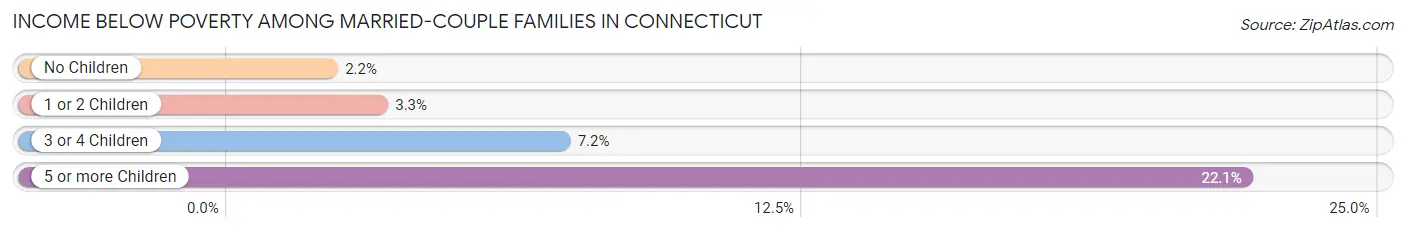
Income Below Poverty Among Married-Couple Families in Connecticut
The poverty statistics for married-couple families in Connecticut show that 2.9% or 19,516 of the total 667,622 families live below the poverty line. Families with 5 or more children have the highest poverty rate of 22.1%, comprising of 423 families. On the other hand, families with no children have the lowest poverty rate of 2.2%, which includes 8,720 families.
| Children | Above Poverty | Below Poverty |
| No Children | 390,438 (97.8%) | 8,720 (2.2%) |
| 1 or 2 Children | 217,235 (96.7%) | 7,335 (3.3%) |
| 3 or 4 Children | 38,942 (92.8%) | 3,038 (7.2%) |
| 5 or more Children | 1,491 (77.9%) | 423 (22.1%) |
| Total | 648,106 (97.1%) | 19,516 (2.9%) |
Income Below Poverty Among Single-Parent Households in Connecticut
According to the poverty data in Connecticut, 10.2% or 6,943 single-father households and 20.4% or 35,967 single-mother households are living below the poverty line. Among single-father households, those with 5 or more children have the highest poverty rate, with 84 households (32.6%) experiencing poverty. Likewise, among single-mother households, those with 5 or more children have the highest poverty rate, with 681 households (73.9%) falling below the poverty line.
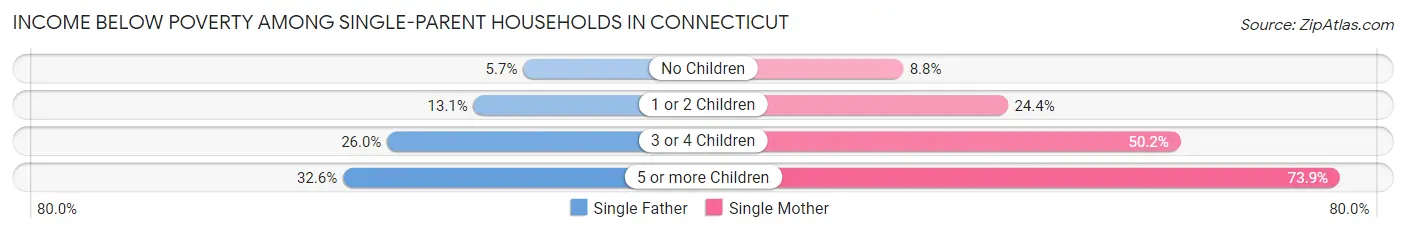
| Children | Single Father | Single Mother |
| No Children | 1,958 (5.7%) | 6,419 (8.8%) |
| 1 or 2 Children | 3,805 (13.1%) | 21,359 (24.4%) |
| 3 or 4 Children | 1,096 (26.0%) | 7,508 (50.2%) |
| 5 or more Children | 84 (32.6%) | 681 (73.9%) |
| Total | 6,943 (10.2%) | 35,967 (20.4%) |
Income Below Poverty Among Married-Couple vs Single-Parent Households in Connecticut
The poverty data for Connecticut shows that 19,516 of the married-couple family households (2.9%) and 42,910 of the single-parent households (17.6%) are living below the poverty level. Within the married-couple family households, those with 5 or more children have the highest poverty rate, with 423 households (22.1%) falling below the poverty line. Among the single-parent households, those with 5 or more children have the highest poverty rate, with 765 household (64.9%) living below poverty.
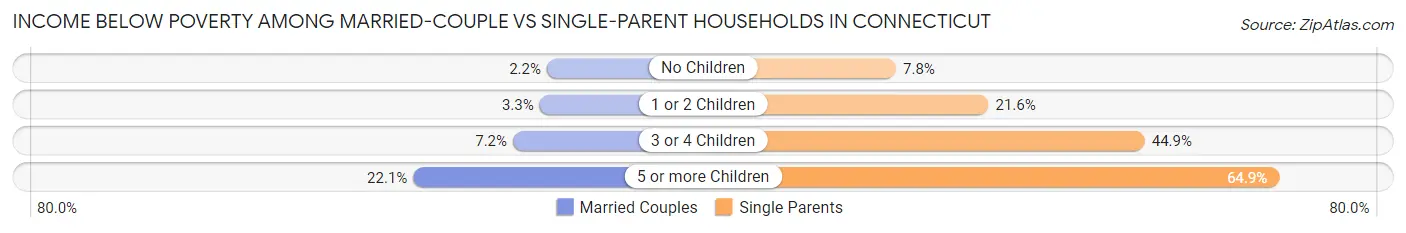
| Children | Married-Couple Families | Single-Parent Households |
| No Children | 8,720 (2.2%) | 8,377 (7.8%) |
| 1 or 2 Children | 7,335 (3.3%) | 25,164 (21.6%) |
| 3 or 4 Children | 3,038 (7.2%) | 8,604 (44.9%) |
| 5 or more Children | 423 (22.1%) | 765 (64.9%) |
| Total | 19,516 (2.9%) | 42,910 (17.6%) |
Largest Zip Codes by Population in Connecticut
The largest zip codes in Connecticut by population are 06902 (73,238), 06010 (61,077), 06511 (55,940), 06516 (55,336), and 06810 (54,957).
1.06902
73,238 (2.03%)
2.06010
61,077 (1.69%)
3.06511
55,940 (1.55%)
4.06516
55,336 (1.53%)
5.06810
54,957 (1.52%)
6.06606
54,125 (1.50%)
7.06457
47,030 (1.30%)
8.06492
44,267 (1.23%)
9.06082
41,346 (1.14%)
10.06484
41,206 (1.14%)
11.06106
38,511 (1.07%)
12.06513
38,217 (1.06%)
13.06360
37,219 (1.03%)
14.06460
37,208 (1.03%)
15.06824
36,969 (1.02%)
16.06611
36,922 (1.02%)
17.06040
36,847 (1.02%)
18.06614
36,184 (1.00%)
19.06450
36,074 (1.00%)
20.06790
35,563 (0.98%)
21.06053
34,405 (0.95%)
22.06489
32,924 (0.91%)
23.06854
32,228 (0.89%)
24.06770
31,741 (0.88%)
25.06051
31,711 (0.88%)
26.06811
31,170 (0.86%)
27.06111
30,458 (0.84%)
28.06066
30,289 (0.84%)
29.06704
30,124 (0.83%)
30.06340
29,672 (0.82%)
Largest Cities by Population in Connecticut
The largest cities in Connecticut by population are Bridgeport (148,470), New Haven (135,736), Stamford (135,413), Hartford (121,057), and Waterbury (114,480).
148,470 (4.11%)
135,736 (3.76%)
3.Stamford
135,413 (3.75%)
4.Hartford
121,057 (3.35%)
114,480 (3.17%)
6.Norwalk
91,050 (2.52%)
7.Danbury
86,456 (2.39%)
74,212 (2.05%)
64,088 (1.77%)
10.Bristol
61,052 (1.69%)
11.Meriden
60,556 (1.68%)
12.West Haven
55,336 (1.53%)
50,942 (1.41%)
50,664 (1.40%)
15.Middletown
48,152 (1.33%)
16.Shelton
41,206 (1.14%)
17.Norwich
40,054 (1.11%)
18.Manchester
37,015 (1.02%)
19.Torrington
35,510 (0.98%)
31,653 (0.88%)
21.Newington
30,458 (0.84%)
22.East Haven
27,871 (0.77%)
23.New London
27,596 (0.76%)
24.Wethersfield
27,192 (0.75%)
25.North Haven
24,179 (0.67%)
26.Ansonia
18,954 (0.52%)
18,738 (0.52%)
28.Willimantic
17,762 (0.49%)
29.Storrs
17,606 (0.49%)
30.Orange
14,231 (0.39%)
Largest Counties by Population in Connecticut
The largest counties in Connecticut by population are Capitol Planning Region (977,165), Western Connecticut Planning Region (620,666), South Central Connecticut Planning Region (571,298), Naugatuck Valley Planning Region (451,887), and Greater Bridgeport Planning Region (326,381).
977,165 (27.06%)
620,666 (17.19%)
571,298 (15.82%)
451,887 (12.51%)
326,381 (9.04%)
280,293 (7.76%)
175,244 (4.85%)
112,696 (3.12%)
95,687 (2.65%)
Race in Connecticut
The most populous races in Connecticut are White / Caucasian (2,522,166 | 69.8%), Hispanic or Latino (627,408 | 17.4%), and Black / African American (385,407 | 10.7%).
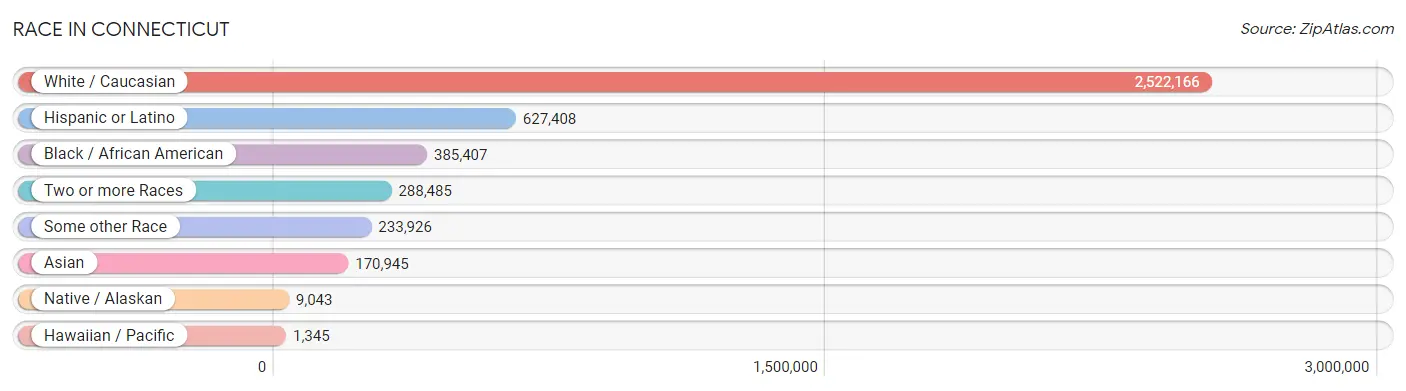
| Race | # Population | % Population |
| Asian | 170,945 | 4.7% |
| Black / African American | 385,407 | 10.7% |
| Hawaiian / Pacific | 1,345 | 0.0% |
| Hispanic or Latino | 627,408 | 17.4% |
| Native / Alaskan | 9,043 | 0.3% |
| White / Caucasian | 2,522,166 | 69.8% |
| Two or more Races | 288,485 | 8.0% |
| Some other Race | 233,926 | 6.5% |
| Total | 3,611,317 | 100.0% |
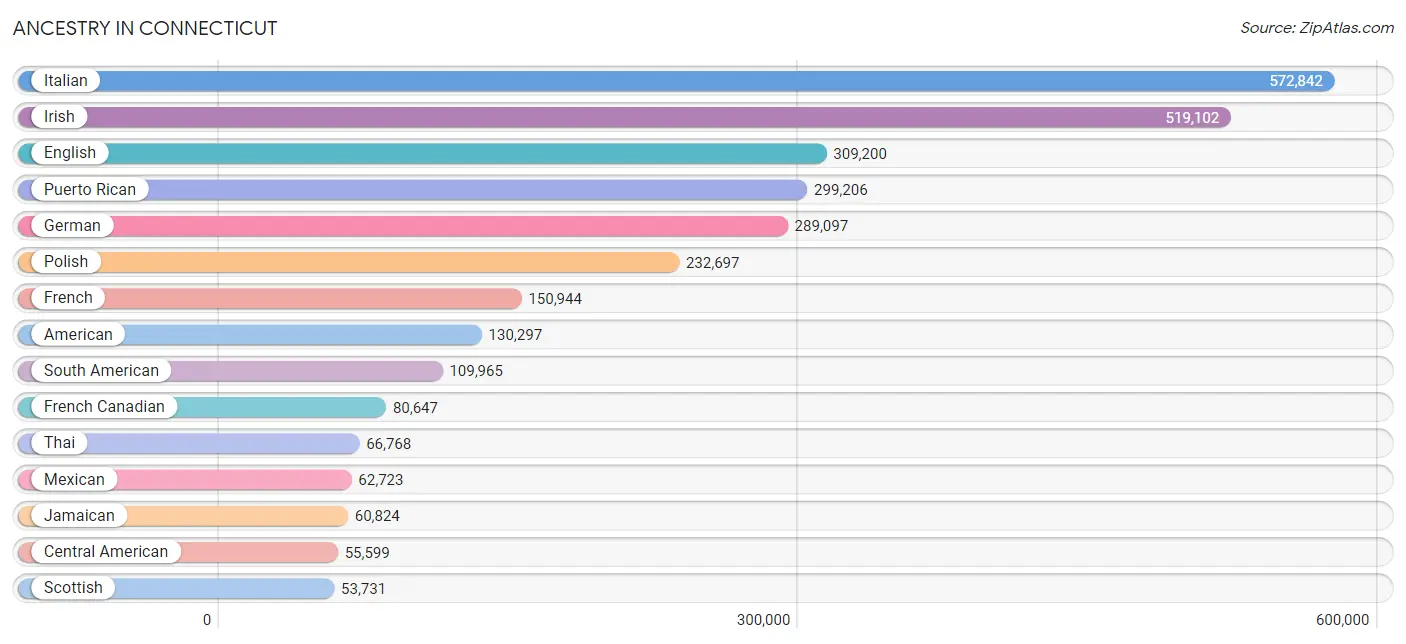
Ancestry in Connecticut
The most populous ancestries reported in Connecticut are Italian (572,842 | 15.9%), Irish (519,102 | 14.4%), English (309,200 | 8.6%), Puerto Rican (299,206 | 8.3%), and German (289,097 | 8.0%), together accounting for 55.1% of all Connecticut residents.
| Ancestry | # Population | % Population |
| Afghan | 2,240 | 0.1% |
| African | 18,417 | 0.5% |
| Alaska Native | 20 | 0.0% |
| Albanian | 11,763 | 0.3% |
| Alsatian | 220 | 0.0% |
| American | 130,297 | 3.6% |
| Apache | 94 | 0.0% |
| Arab | 25,093 | 0.7% |
| Arapaho | 3 | 0.0% |
| Argentinean | 6,250 | 0.2% |
| Armenian | 4,902 | 0.1% |
| Assyrian / Chaldean / Syriac | 394 | 0.0% |
| Australian | 1,398 | 0.0% |
| Austrian | 11,570 | 0.3% |
| Bahamian | 391 | 0.0% |
| Bangladeshi | 81 | 0.0% |
| Barbadian | 1,926 | 0.1% |
| Basque | 172 | 0.0% |
| Belgian | 2,377 | 0.1% |
| Belizean | 418 | 0.0% |
| Bermudan | 124 | 0.0% |
| Bhutanese | 7,350 | 0.2% |
| Blackfeet | 2,277 | 0.1% |
| Bolivian | 1,382 | 0.0% |
| Brazilian | 25,870 | 0.7% |
| British | 17,988 | 0.5% |
| British West Indian | 2,842 | 0.1% |
| Bulgarian | 1,057 | 0.0% |
| Burmese | 15,175 | 0.4% |
| Cajun | 177 | 0.0% |
| Cambodian | 342 | 0.0% |
| Canadian | 13,362 | 0.4% |
| Cape Verdean | 3,427 | 0.1% |
| Carpatho Rusyn | 196 | 0.0% |
| Celtic | 416 | 0.0% |
| Central American | 55,599 | 1.5% |
| Central American Indian | 6,645 | 0.2% |
| Cherokee | 5,045 | 0.1% |
| Cheyenne | 61 | 0.0% |
| Chickasaw | 48 | 0.0% |
| Chilean | 3,559 | 0.1% |
| Chinese | 18 | 0.0% |
| Chippewa | 295 | 0.0% |
| Choctaw | 474 | 0.0% |
| Colombian | 29,094 | 0.8% |
| Comanche | 44 | 0.0% |
| Costa Rican | 4,101 | 0.1% |
| Cree | 174 | 0.0% |
| Creek | 335 | 0.0% |
| Croatian | 3,423 | 0.1% |
| Cuban | 13,553 | 0.4% |
| Cypriot | 198 | 0.0% |
| Czech | 9,904 | 0.3% |
| Czechoslovakian | 4,192 | 0.1% |
| Danish | 9,693 | 0.3% |
| Delaware | 39 | 0.0% |
| Dominican | 53,153 | 1.5% |
| Dutch | 23,014 | 0.6% |
| Dutch West Indian | 125 | 0.0% |
| Eastern European | 20,210 | 0.6% |
| Ecuadorian | 40,028 | 1.1% |
| Egyptian | 2,502 | 0.1% |
| English | 309,200 | 8.6% |
| Estonian | 1,129 | 0.0% |
| Ethiopian | 1,177 | 0.0% |
| European | 37,615 | 1.0% |
| Fijian | 28 | 0.0% |
| Filipino | 2,023 | 0.1% |
| Finnish | 4,924 | 0.1% |
| French | 150,944 | 4.2% |
| French American Indian | 623 | 0.0% |
| French Canadian | 80,647 | 2.2% |
| German | 289,097 | 8.0% |
| German Russian | 23 | 0.0% |
| Ghanaian | 6,225 | 0.2% |
| Greek | 28,877 | 0.8% |
| Guamanian / Chamorro | 496 | 0.0% |
| Guatemalan | 26,702 | 0.7% |
| Guyanese | 4,471 | 0.1% |
| Haitian | 18,950 | 0.5% |
| Hmong | 42 | 0.0% |
| Honduran | 9,943 | 0.3% |
| Hopi | 5 | 0.0% |
| Houma | 11 | 0.0% |
| Hungarian | 31,684 | 0.9% |
| Icelander | 398 | 0.0% |
| Indian (Asian) | 48,522 | 1.3% |
| Indonesian | 512 | 0.0% |
| Inupiat | 57 | 0.0% |
| Iranian | 2,794 | 0.1% |
| Iraqi | 440 | 0.0% |
| Irish | 519,102 | 14.4% |
| Iroquois | 1,012 | 0.0% |
| Israeli | 2,058 | 0.1% |
| Italian | 572,842 | 15.9% |
| Jamaican | 60,824 | 1.7% |
| Japanese | 4,486 | 0.1% |
| Jordanian | 533 | 0.0% |
| Kenyan | 432 | 0.0% |
| Korean | 21,195 | 0.6% |
| Laotian | 1,165 | 0.0% |
| Latvian | 2,258 | 0.1% |
| Lebanese | 9,225 | 0.3% |
| Liberian | 514 | 0.0% |
| Lithuanian | 25,587 | 0.7% |
| Lumbee | 181 | 0.0% |
| Luxembourger | 72 | 0.0% |
| Macedonian | 740 | 0.0% |
| Malaysian | 3,777 | 0.1% |
| Maltese | 252 | 0.0% |
| Mexican | 62,723 | 1.7% |
| Mexican American Indian | 1,482 | 0.0% |
| Mongolian | 527 | 0.0% |
| Moroccan | 2,613 | 0.1% |
| Native Hawaiian | 1,058 | 0.0% |
| Navajo | 485 | 0.0% |
| New Zealander | 206 | 0.0% |
| Nicaraguan | 2,017 | 0.1% |
| Nigerian | 4,308 | 0.1% |
| Northern European | 3,621 | 0.1% |
| Norwegian | 17,130 | 0.5% |
| Okinawan | 36 | 0.0% |
| Osage | 1 | 0.0% |
| Pakistani | 1,927 | 0.1% |
| Palestinian | 1,201 | 0.0% |
| Panamanian | 1,785 | 0.1% |
| Paraguayan | 688 | 0.0% |
| Pennsylvania German | 599 | 0.0% |
| Peruvian | 20,824 | 0.6% |
| Polish | 232,697 | 6.4% |
| Portuguese | 47,065 | 1.3% |
| Potawatomi | 16 | 0.0% |
| Pueblo | 48 | 0.0% |
| Puerto Rican | 299,206 | 8.3% |
| Puget Sound Salish | 47 | 0.0% |
| Romanian | 7,016 | 0.2% |
| Russian | 47,755 | 1.3% |
| Salvadoran | 10,278 | 0.3% |
| Samoan | 646 | 0.0% |
| Scandinavian | 6,068 | 0.2% |
| Scotch-Irish | 15,964 | 0.4% |
| Scottish | 53,731 | 1.5% |
| Seminole | 88 | 0.0% |
| Senegalese | 481 | 0.0% |
| Serbian | 1,412 | 0.0% |
| Sierra Leonean | 92 | 0.0% |
| Sioux | 274 | 0.0% |
| Slavic | 2,023 | 0.1% |
| Slovak | 16,347 | 0.4% |
| Slovene | 1,190 | 0.0% |
| Somali | 406 | 0.0% |
| South African | 1,216 | 0.0% |
| South American | 109,965 | 3.0% |
| South American Indian | 1,248 | 0.0% |
| Soviet Union | 28 | 0.0% |
| Spaniard | 7,907 | 0.2% |
| Spanish | 6,709 | 0.2% |
| Spanish American | 167 | 0.0% |
| Spanish American Indian | 33 | 0.0% |
| Sri Lankan | 12,756 | 0.4% |
| Subsaharan African | 41,619 | 1.1% |
| Sudanese | 557 | 0.0% |
| Swedish | 47,869 | 1.3% |
| Swiss | 7,649 | 0.2% |
| Syrian | 2,606 | 0.1% |
| Thai | 66,768 | 1.8% |
| Tlingit-Haida | 8 | 0.0% |
| Tongan | 102 | 0.0% |
| Trinidadian and Tobagonian | 3,924 | 0.1% |
| Tsimshian | 1 | 0.0% |
| Turkish | 3,855 | 0.1% |
| U.S. Virgin Islander | 333 | 0.0% |
| Ugandan | 514 | 0.0% |
| Ukrainian | 21,175 | 0.6% |
| Uruguayan | 1,725 | 0.1% |
| Venezuelan | 5,029 | 0.1% |
| Vietnamese | 2,512 | 0.1% |
| Welsh | 11,943 | 0.3% |
| West Indian | 5,114 | 0.1% |
| Yaqui | 60 | 0.0% |
| Yugoslavian | 4,434 | 0.1% |
| Zimbabwean | 89 | 0.0% | View All 182 Rows |
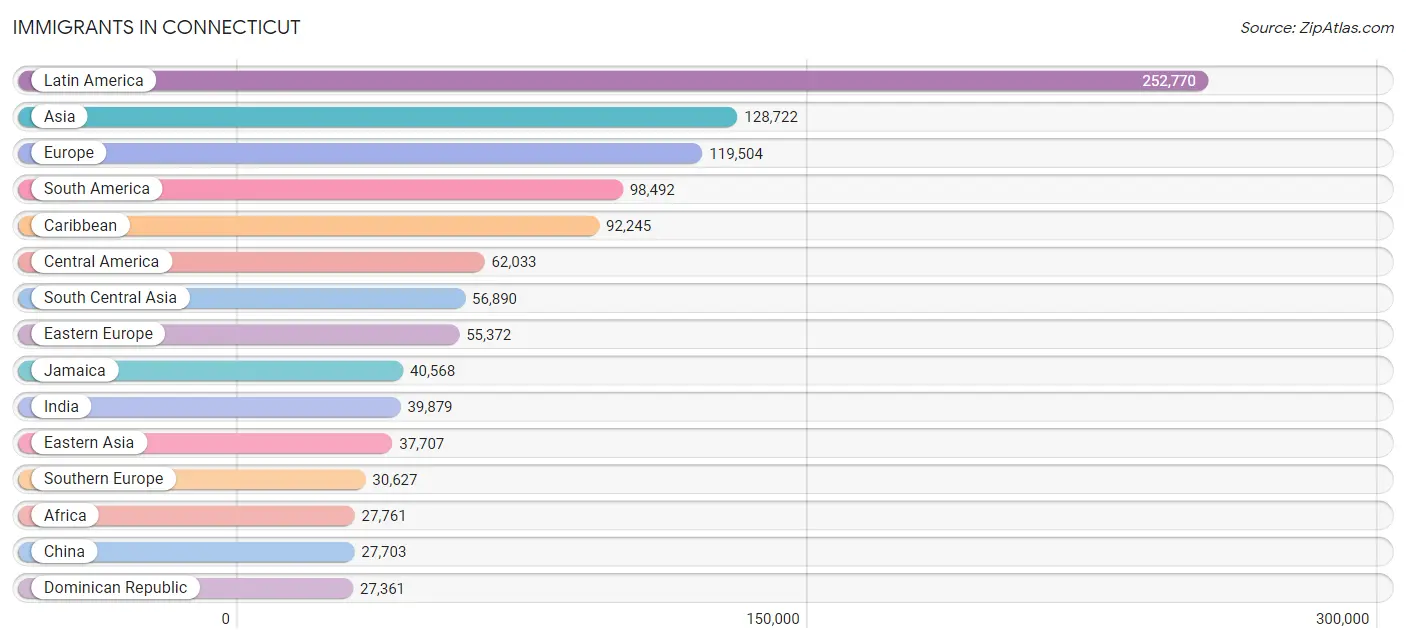
Immigrants in Connecticut
The most numerous immigrant groups reported in Connecticut came from Latin America (252,770 | 7.0%), Asia (128,722 | 3.6%), Europe (119,504 | 3.3%), South America (98,492 | 2.7%), and Caribbean (92,245 | 2.5%), together accounting for 19.1% of all Connecticut residents.
| Immigration Origin | # Population | % Population |
| Afghanistan | 1,946 | 0.1% |
| Africa | 27,761 | 0.8% |
| Albania | 5,447 | 0.2% |
| Argentina | 3,583 | 0.1% |
| Armenia | 96 | 0.0% |
| Asia | 128,722 | 3.6% |
| Australia | 1,126 | 0.0% |
| Austria | 655 | 0.0% |
| Azores | 237 | 0.0% |
| Bahamas | 463 | 0.0% |
| Bangladesh | 3,362 | 0.1% |
| Barbados | 655 | 0.0% |
| Belarus | 807 | 0.0% |
| Belgium | 765 | 0.0% |
| Belize | 274 | 0.0% |
| Bolivia | 603 | 0.0% |
| Bosnia and Herzegovina | 2,749 | 0.1% |
| Brazil | 25,461 | 0.7% |
| Bulgaria | 934 | 0.0% |
| Cabo Verde | 1,253 | 0.0% |
| Cambodia | 1,550 | 0.0% |
| Cameroon | 797 | 0.0% |
| Canada | 12,380 | 0.3% |
| Caribbean | 92,245 | 2.5% |
| Central America | 62,033 | 1.7% |
| Chile | 2,399 | 0.1% |
| China | 27,703 | 0.8% |
| Colombia | 18,124 | 0.5% |
| Congo | 208 | 0.0% |
| Costa Rica | 2,715 | 0.1% |
| Croatia | 439 | 0.0% |
| Cuba | 3,308 | 0.1% |
| Czechoslovakia | 1,208 | 0.0% |
| Denmark | 772 | 0.0% |
| Dominica | 731 | 0.0% |
| Dominican Republic | 27,361 | 0.8% |
| Eastern Africa | 4,016 | 0.1% |
| Eastern Asia | 37,707 | 1.0% |
| Eastern Europe | 55,372 | 1.5% |
| Ecuador | 24,026 | 0.7% |
| Egypt | 1,703 | 0.1% |
| El Salvador | 6,024 | 0.2% |
| England | 6,551 | 0.2% |
| Eritrea | 21 | 0.0% |
| Ethiopia | 956 | 0.0% |
| Europe | 119,504 | 3.3% |
| France | 2,805 | 0.1% |
| Germany | 7,149 | 0.2% |
| Ghana | 5,651 | 0.2% |
| Greece | 4,063 | 0.1% |
| Grenada | 132 | 0.0% |
| Guatemala | 17,617 | 0.5% |
| Guyana | 5,157 | 0.1% |
| Haiti | 12,881 | 0.4% |
| Honduras | 7,220 | 0.2% |
| Hong Kong | 1,172 | 0.0% |
| Hungary | 1,562 | 0.0% |
| India | 39,879 | 1.1% |
| Indonesia | 698 | 0.0% |
| Iran | 1,784 | 0.1% |
| Iraq | 679 | 0.0% |
| Ireland | 3,115 | 0.1% |
| Israel | 1,364 | 0.0% |
| Italy | 15,141 | 0.4% |
| Jamaica | 40,568 | 1.1% |
| Japan | 2,278 | 0.1% |
| Jordan | 743 | 0.0% |
| Kazakhstan | 327 | 0.0% |
| Kenya | 807 | 0.0% |
| Korea | 7,495 | 0.2% |
| Kuwait | 205 | 0.0% |
| Laos | 1,845 | 0.1% |
| Latin America | 252,770 | 7.0% |
| Latvia | 484 | 0.0% |
| Lebanon | 1,272 | 0.0% |
| Liberia | 324 | 0.0% |
| Lithuania | 1,080 | 0.0% |
| Malaysia | 525 | 0.0% |
| Mexico | 25,802 | 0.7% |
| Middle Africa | 3,025 | 0.1% |
| Moldova | 452 | 0.0% |
| Morocco | 1,914 | 0.1% |
| Nepal | 939 | 0.0% |
| Netherlands | 1,130 | 0.0% |
| Nicaragua | 1,663 | 0.1% |
| Nigeria | 3,109 | 0.1% |
| North Macedonia | 1,333 | 0.0% |
| Northern Africa | 5,352 | 0.2% |
| Northern Europe | 20,043 | 0.6% |
| Norway | 330 | 0.0% |
| Oceania | 1,592 | 0.0% |
| Pakistan | 7,003 | 0.2% |
| Panama | 668 | 0.0% |
| Peru | 13,591 | 0.4% |
| Philippines | 10,545 | 0.3% |
| Poland | 21,729 | 0.6% |
| Portugal | 9,214 | 0.3% |
| Romania | 2,255 | 0.1% |
| Russia | 6,448 | 0.2% |
| Saudi Arabia | 835 | 0.0% |
| Scotland | 1,307 | 0.0% |
| Senegal | 207 | 0.0% |
| Serbia | 678 | 0.0% |
| Sierra Leone | 246 | 0.0% |
| Singapore | 270 | 0.0% |
| Somalia | 252 | 0.0% |
| South Africa | 1,972 | 0.1% |
| South America | 98,492 | 2.7% |
| South Central Asia | 56,890 | 1.6% |
| South Eastern Asia | 23,736 | 0.7% |
| Southern Europe | 30,627 | 0.9% |
| Spain | 2,170 | 0.1% |
| Sri Lanka | 1,143 | 0.0% |
| St. Vincent and the Grenadines | 257 | 0.0% |
| Sudan | 769 | 0.0% |
| Sweden | 943 | 0.0% |
| Switzerland | 620 | 0.0% |
| Syria | 1,475 | 0.0% |
| Taiwan | 2,530 | 0.1% |
| Thailand | 1,499 | 0.0% |
| Trinidad and Tobago | 2,944 | 0.1% |
| Turkey | 2,234 | 0.1% |
| Uganda | 585 | 0.0% |
| Ukraine | 5,088 | 0.1% |
| Uruguay | 1,076 | 0.0% |
| Uzbekistan | 258 | 0.0% |
| Venezuela | 3,904 | 0.1% |
| Vietnam | 6,448 | 0.2% |
| West Indies | 811 | 0.0% |
| Western Africa | 12,322 | 0.3% |
| Western Asia | 10,185 | 0.3% |
| Western Europe | 13,161 | 0.4% |
| Yemen | 281 | 0.0% |
| Zaire | 1,660 | 0.1% |
| Zimbabwe | 293 | 0.0% | View All 135 Rows |
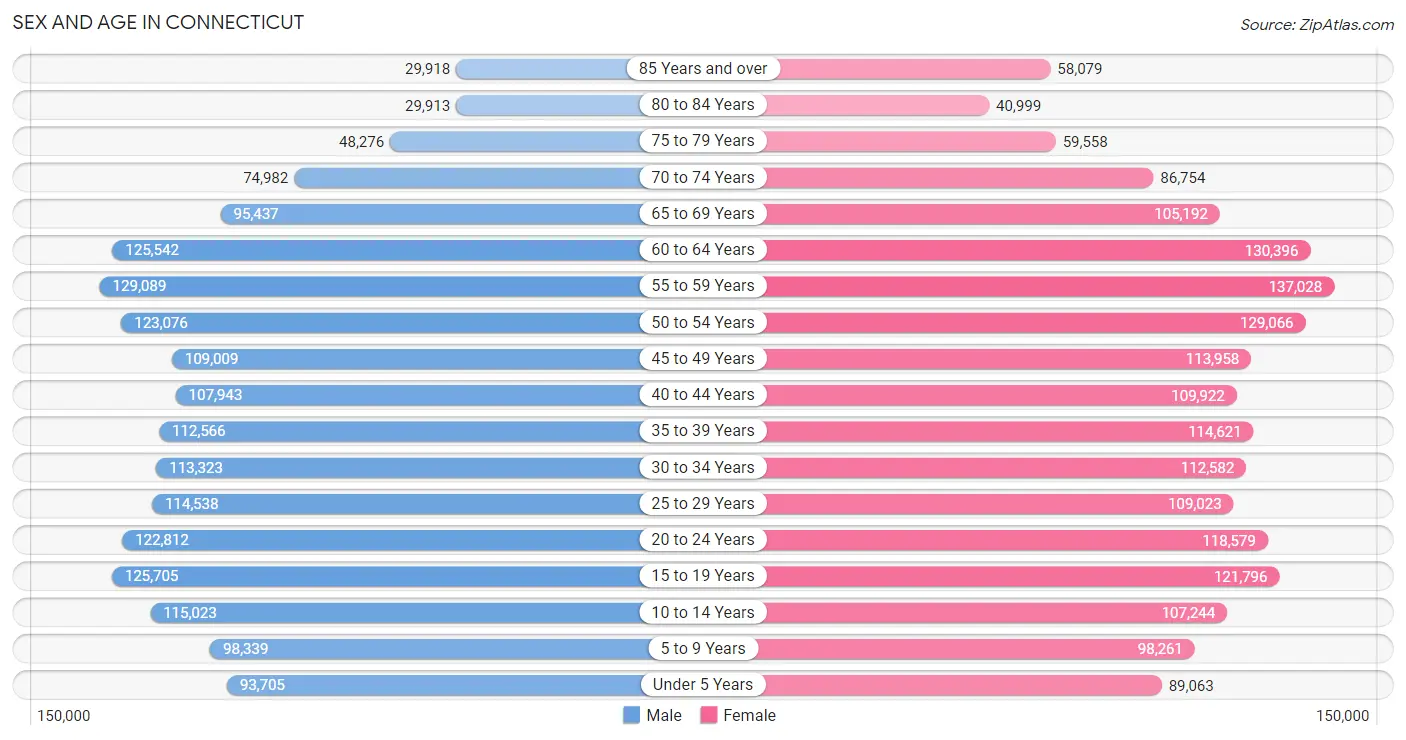
Sex and Age in Connecticut
Sex and Age in Connecticut
The most populous age groups in Connecticut are 55 to 59 Years (129,089 | 7.3%) for men and 55 to 59 Years (137,028 | 7.4%) for women.
| Age Bracket | Male | Female |
| Under 5 Years | 93,705 (5.3%) | 89,063 (4.8%) |
| 5 to 9 Years | 98,339 (5.6%) | 98,261 (5.3%) |
| 10 to 14 Years | 115,023 (6.5%) | 107,244 (5.8%) |
| 15 to 19 Years | 125,705 (7.1%) | 121,796 (6.6%) |
| 20 to 24 Years | 122,812 (6.9%) | 118,579 (6.4%) |
| 25 to 29 Years | 114,538 (6.5%) | 109,023 (5.9%) |
| 30 to 34 Years | 113,323 (6.4%) | 112,582 (6.1%) |
| 35 to 39 Years | 112,566 (6.4%) | 114,621 (6.2%) |
| 40 to 44 Years | 107,943 (6.1%) | 109,922 (6.0%) |
| 45 to 49 Years | 109,009 (6.2%) | 113,958 (6.2%) |
| 50 to 54 Years | 123,076 (7.0%) | 129,066 (7.0%) |
| 55 to 59 Years | 129,089 (7.3%) | 137,028 (7.4%) |
| 60 to 64 Years | 125,542 (7.1%) | 130,396 (7.1%) |
| 65 to 69 Years | 95,437 (5.4%) | 105,192 (5.7%) |
| 70 to 74 Years | 74,982 (4.2%) | 86,754 (4.7%) |
| 75 to 79 Years | 48,276 (2.7%) | 59,558 (3.2%) |
| 80 to 84 Years | 29,913 (1.7%) | 40,999 (2.2%) |
| 85 Years and over | 29,918 (1.7%) | 58,079 (3.2%) |
| Total | 1,769,196 (100.0%) | 1,842,121 (100.0%) |
Families and Households in Connecticut
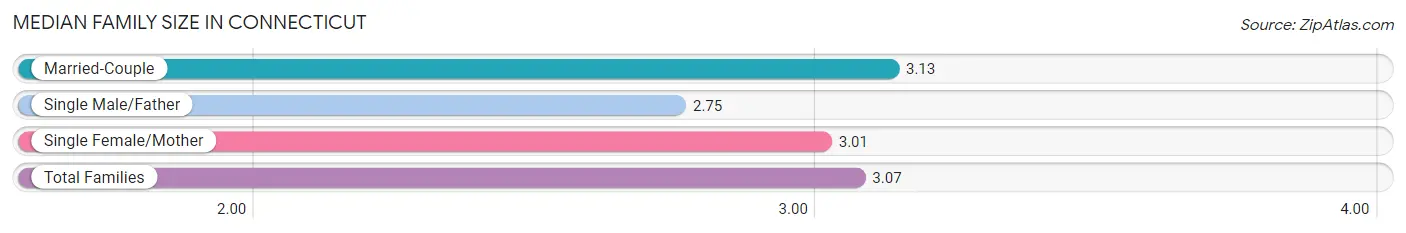
Median Family Size in Connecticut
The median family size in Connecticut is 3.07 persons per family, with married-couple families (667,622 | 73.2%) accounting for the largest median family size of 3.13 persons per family. On the other hand, single male/father families (67,929 | 7.4%) represent the smallest median family size with 2.75 persons per family.
| Family Type | # Families | Family Size |
| Married-Couple | 667,622 (73.2%) | 3.13 |
| Single Male/Father | 67,929 (7.4%) | 2.75 |
| Single Female/Mother | 176,317 (19.3%) | 3.01 |
| Total Families | 911,868 (100.0%) | 3.07 |
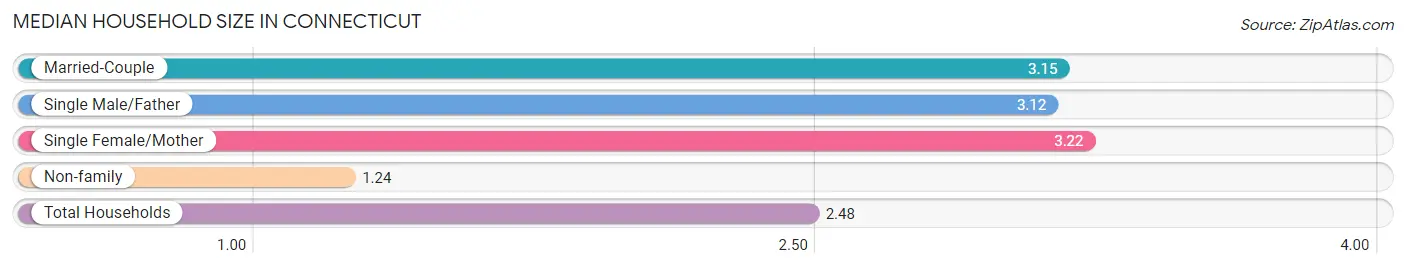
Median Household Size in Connecticut
The median household size in Connecticut is 2.48 persons per household, with single female/mother households (176,317 | 12.5%) accounting for the largest median household size of 3.22 persons per household. non-family households (497,939 | 35.3%) represent the smallest median household size with 1.24 persons per household.
| Household Type | # Households | Household Size |
| Married-Couple | 667,622 (47.4%) | 3.15 |
| Single Male/Father | 67,929 (4.8%) | 3.12 |
| Single Female/Mother | 176,317 (12.5%) | 3.22 |
| Non-family | 497,939 (35.3%) | 1.24 |
| Total Households | 1,409,807 (100.0%) | 2.48 |
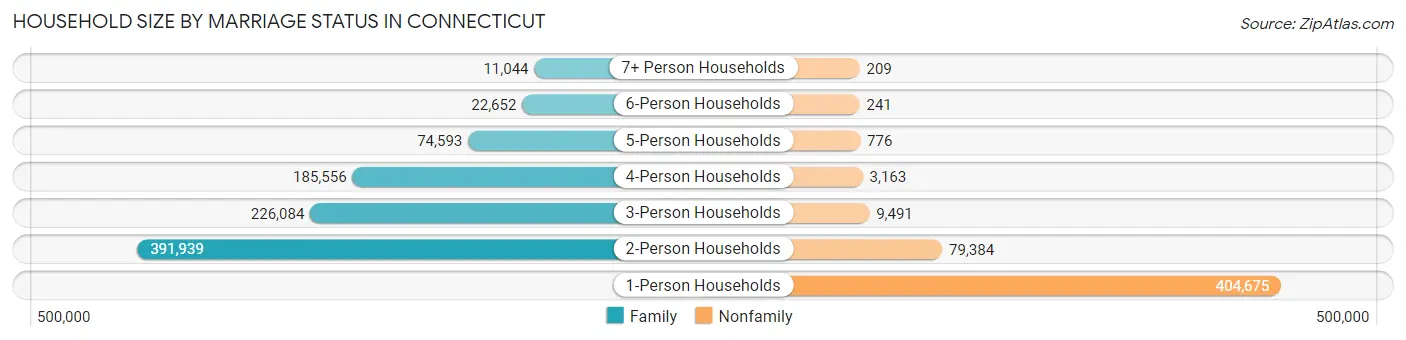
Household Size by Marriage Status in Connecticut
Out of a total of 1,409,807 households in Connecticut, 911,868 (64.7%) are family households, while 497,939 (35.3%) are nonfamily households. The most numerous type of family households are 2-person households, comprising 391,939, and the most common type of nonfamily households are 1-person households, comprising 404,675.
| Household Size | Family Households | Nonfamily Households |
| 1-Person Households | - | 404,675 (28.7%) |
| 2-Person Households | 391,939 (27.8%) | 79,384 (5.6%) |
| 3-Person Households | 226,084 (16.0%) | 9,491 (0.7%) |
| 4-Person Households | 185,556 (13.2%) | 3,163 (0.2%) |
| 5-Person Households | 74,593 (5.3%) | 776 (0.1%) |
| 6-Person Households | 22,652 (1.6%) | 241 (0.0%) |
| 7+ Person Households | 11,044 (0.8%) | 209 (0.0%) |
| Total | 911,868 (64.7%) | 497,939 (35.3%) |
Female Fertility in Connecticut
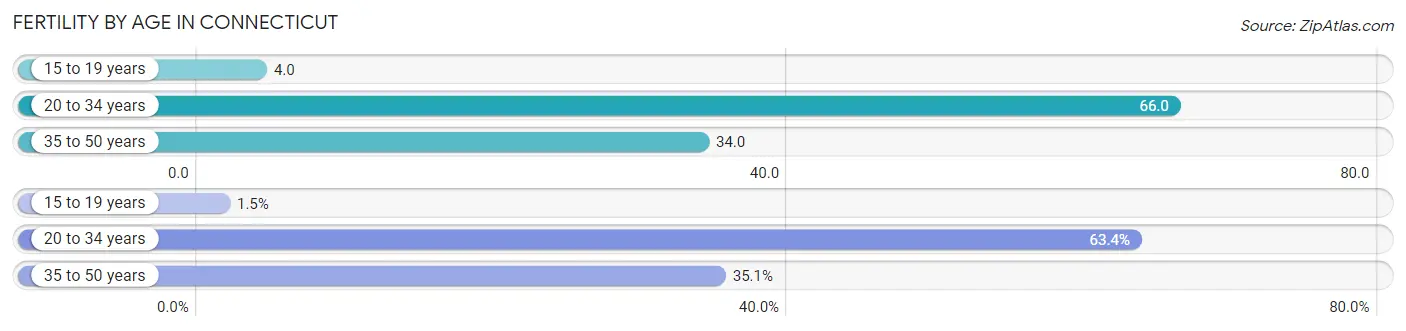
Fertility by Age in Connecticut
Average fertility rate in Connecticut is 43.0 births per 1,000 women. Women in the age bracket of 20 to 34 years have the highest fertility rate with 66.0 births per 1,000 women. Women in the age bracket of 20 to 34 years acount for 63.4% of all women with births.
| Age Bracket | Women with Births | Births / 1,000 Women |
| 15 to 19 years | 528 (1.5%) | 4.0 |
| 20 to 34 years | 22,420 (63.4%) | 66.0 |
| 35 to 50 years | 12,435 (35.1%) | 34.0 |
| Total | 35,383 (100.0%) | 43.0 |
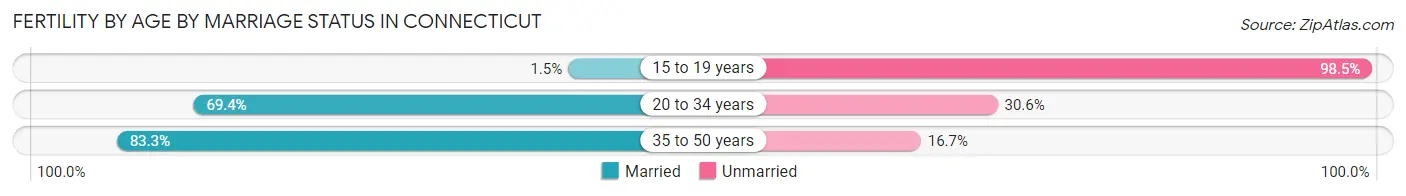
Fertility by Age by Marriage Status in Connecticut
73.3% of women with births (35,383) in Connecticut are married. The highest percentage of unmarried women with births falls into 15 to 19 years age bracket with 98.5% of them unmarried at the time of birth, while the lowest percentage of unmarried women with births belong to 35 to 50 years age bracket with 16.7% of them unmarried.
| Age Bracket | Married | Unmarried |
| 15 to 19 years | 8 (1.5%) | 520 (98.5%) |
| 20 to 34 years | 15,559 (69.4%) | 6,861 (30.6%) |
| 35 to 50 years | 10,358 (83.3%) | 2,077 (16.7%) |
| Total | 25,936 (73.3%) | 9,447 (26.7%) |
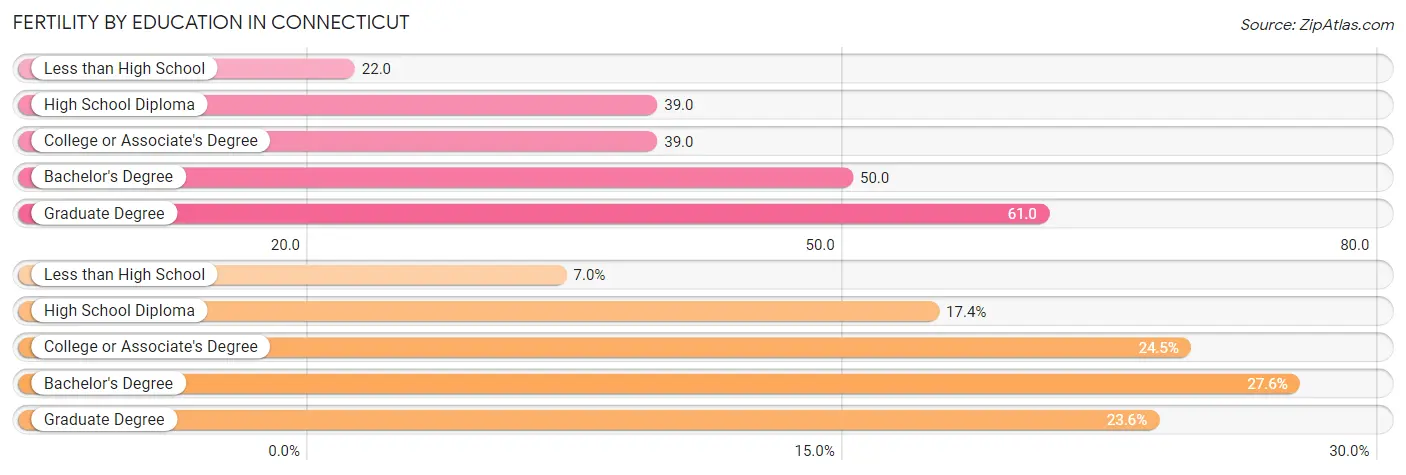
Fertility by Education in Connecticut
Average fertility rate in Connecticut is 43.0 births per 1,000 women. Women with the education attainment of graduate degree have the highest fertility rate of 61.0 births per 1,000 women, while women with the education attainment of less than high school have the lowest fertility at 22.0 births per 1,000 women. Women with the education attainment of bachelor's degree represent 27.6% of all women with births.
| Educational Attainment | Women with Births | Births / 1,000 Women |
| Less than High School | 2,458 (7.0%) | 22.0 |
| High School Diploma | 6,162 (17.4%) | 39.0 |
| College or Associate's Degree | 8,665 (24.5%) | 39.0 |
| Bachelor's Degree | 9,747 (27.6%) | 50.0 |
| Graduate Degree | 8,351 (23.6%) | 61.0 |
| Total | 35,383 (100.0%) | 43.0 |
Fertility by Education by Marriage Status in Connecticut
26.7% of women with births in Connecticut are unmarried. Women with the educational attainment of graduate degree are most likely to be married with 91.7% of them married at childbirth, while women with the educational attainment of less than high school are least likely to be married with 48.5% of them unmarried at childbirth.
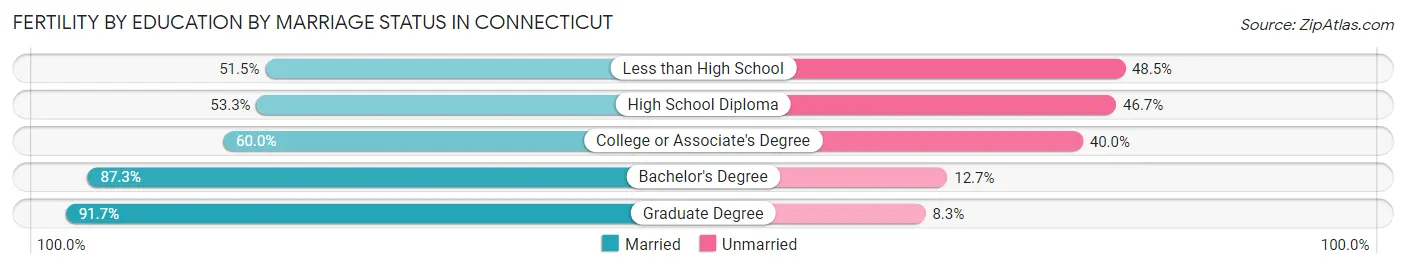
| Educational Attainment | Married | Unmarried |
| Less than High School | 1,266 (51.5%) | 1,192 (48.5%) |
| High School Diploma | 3,284 (53.3%) | 2,878 (46.7%) |
| College or Associate's Degree | 5,199 (60.0%) | 3,466 (40.0%) |
| Bachelor's Degree | 8,509 (87.3%) | 1,238 (12.7%) |
| Graduate Degree | 7,658 (91.7%) | 693 (8.3%) |
| Total | 25,936 (73.3%) | 9,447 (26.7%) |
Employment Characteristics in Connecticut
Employment by Class of Employer in Connecticut
Among the 1,798,193 employed individuals in Connecticut, private company employees (1,198,114 | 66.6%), not-for-profit organizations (187,738 | 10.4%), and local government employees (130,839 | 7.3%) make up the most common classes of employment.
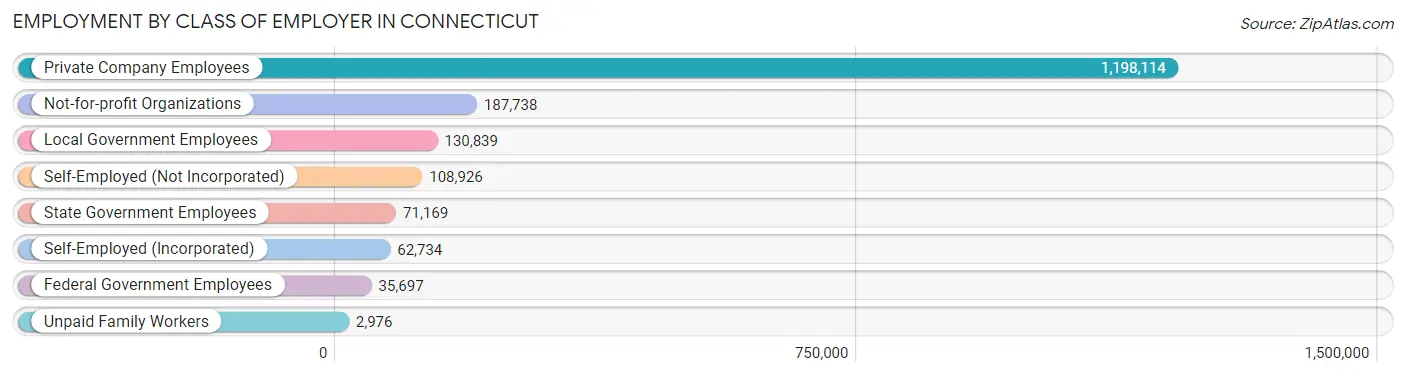
| Employer Class | # Employees | % Employees |
| Private Company Employees | 1,198,114 | 66.6% |
| Self-Employed (Incorporated) | 62,734 | 3.5% |
| Self-Employed (Not Incorporated) | 108,926 | 6.1% |
| Not-for-profit Organizations | 187,738 | 10.4% |
| Local Government Employees | 130,839 | 7.3% |
| State Government Employees | 71,169 | 4.0% |
| Federal Government Employees | 35,697 | 2.0% |
| Unpaid Family Workers | 2,976 | 0.2% |
| Total | 1,798,193 | 100.0% |
Employment Status by Age in Connecticut
According to the labor force statistics for Connecticut, out of the total population over 16 years of age (2,961,491), 66.0% or 1,954,584 individuals are in the labor force, with 5.9% or 115,320 of them unemployed. The age group with the highest labor force participation rate is 30 to 34 years, with 86.7% or 195,860 individuals in the labor force. Within the labor force, the 16 to 19 years age range has the highest percentage of unemployed individuals, with 15.5% or 12,326 of them being unemployed.
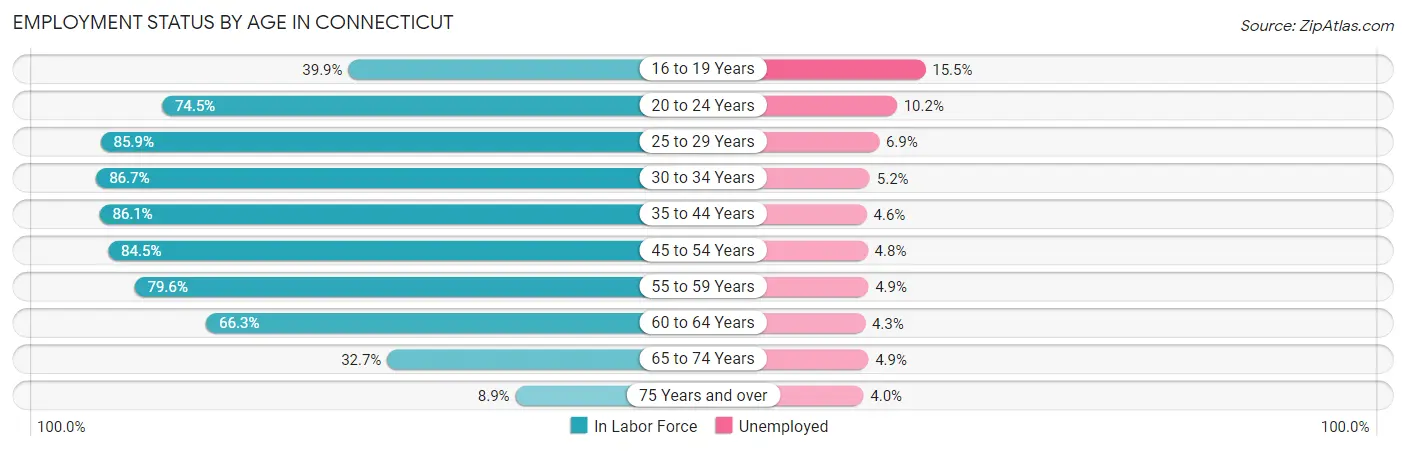
| Age Bracket | In Labor Force | Unemployed |
| 16 to 19 Years | 79,525 (39.9%) | 12,326 (15.5%) |
| 20 to 24 Years | 179,836 (74.5%) | 18,343 (10.2%) |
| 25 to 29 Years | 192,039 (85.9%) | 13,251 (6.9%) |
| 30 to 34 Years | 195,860 (86.7%) | 10,185 (5.2%) |
| 35 to 44 Years | 383,190 (86.1%) | 17,627 (4.6%) |
| 45 to 54 Years | 401,467 (84.5%) | 19,270 (4.8%) |
| 55 to 59 Years | 211,829 (79.6%) | 10,380 (4.9%) |
| 60 to 64 Years | 169,687 (66.3%) | 7,297 (4.3%) |
| 65 to 74 Years | 118,493 (32.7%) | 5,806 (4.9%) |
| 75 Years and over | 23,740 (8.9%) | 950 (4.0%) |
| Total | 1,954,584 (66.0%) | 115,320 (5.9%) |
Employment Status by Educational Attainment in Connecticut
According to labor force statistics for Connecticut, 82.1% of individuals (1,553,071) out of the total population between 25 and 64 years of age (1,891,682) are in the labor force, with 5.0% or 77,654 of them being unemployed. The group with the highest labor force participation rate are those with the educational attainment of bachelor's degree or higher, with 88.2% or 722,401 individuals in the labor force. Within the labor force, individuals with less than high school education have the highest percentage of unemployment, with 10.1% or 9,246 of them being unemployed.
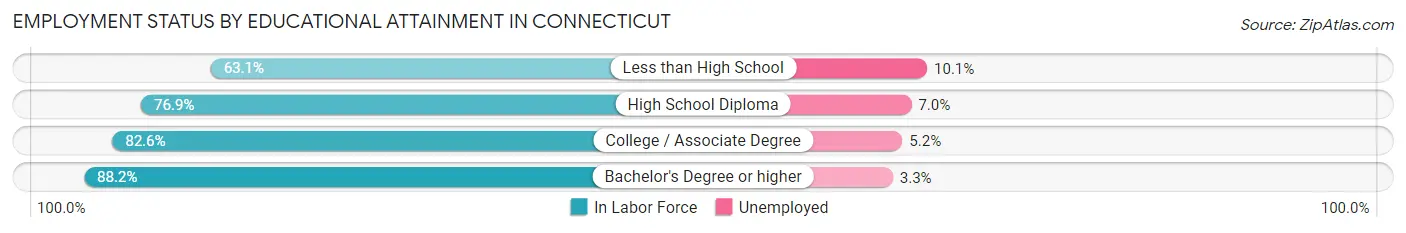
| Educational Attainment | In Labor Force | Unemployed |
| Less than High School | 91,549 (63.1%) | 14,654 (10.1%) |
| High School Diploma | 357,557 (76.9%) | 32,547 (7.0%) |
| College / Associate Degree | 382,094 (82.6%) | 24,054 (5.2%) |
| Bachelor's Degree or higher | 722,401 (88.2%) | 27,029 (3.3%) |
| Total | 1,553,071 (82.1%) | 94,584 (5.0%) |
Employment Occupations by Sex in Connecticut
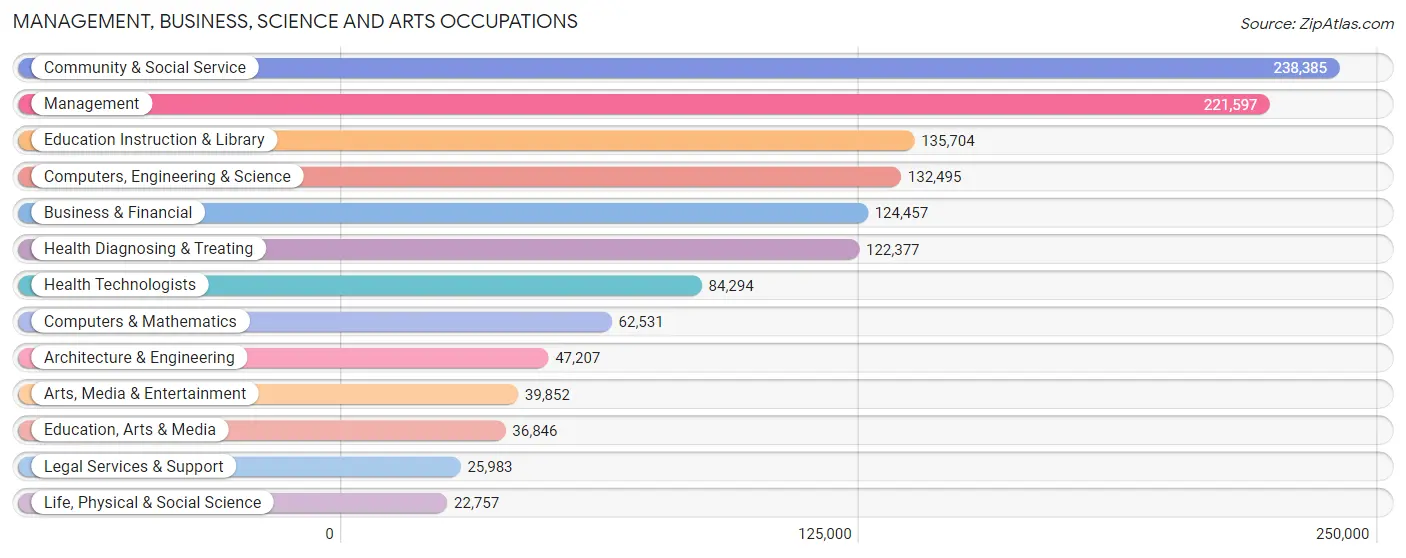
Management, Business, Science and Arts Occupations
The most common Management, Business, Science and Arts occupations in Connecticut are Community & Social Service (238,385 | 13.0%), Management (221,597 | 12.1%), Education Instruction & Library (135,704 | 7.4%), Computers, Engineering & Science (132,495 | 7.2%), and Business & Financial (124,457 | 6.8%).
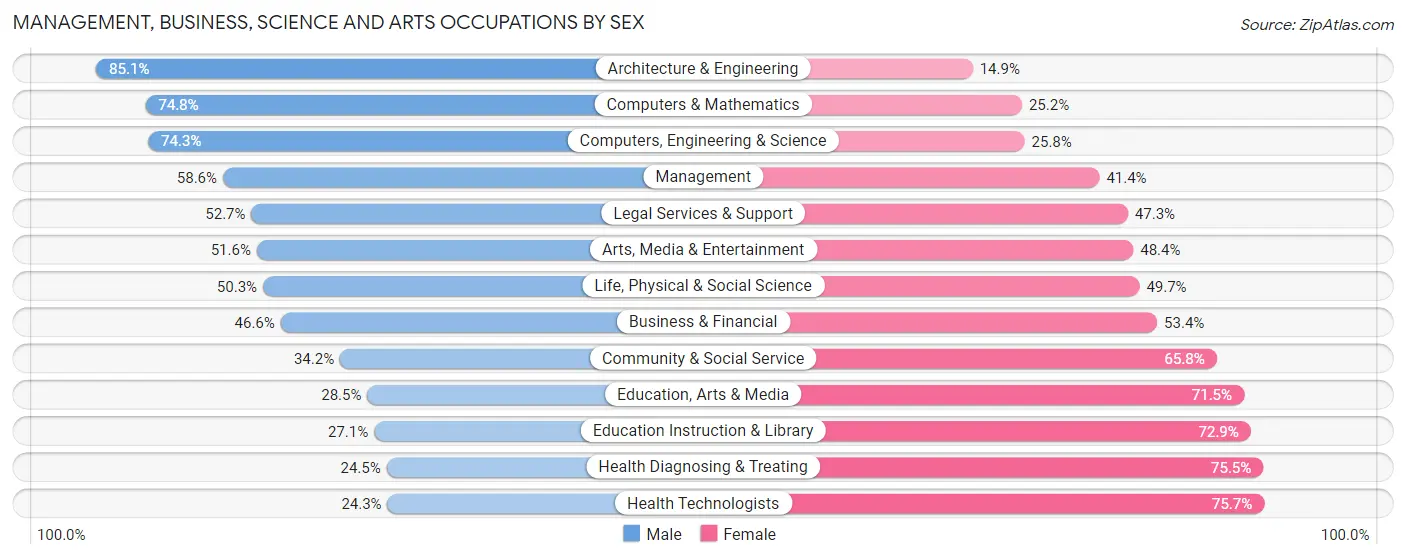
Management, Business, Science and Arts Occupations by Sex
Within the Management, Business, Science and Arts occupations in Connecticut, the most male-oriented occupations are Architecture & Engineering (85.1%), Computers & Mathematics (74.8%), and Computers, Engineering & Science (74.3%), while the most female-oriented occupations are Health Technologists (75.7%), Health Diagnosing & Treating (75.5%), and Education Instruction & Library (72.9%).
| Occupation | Male | Female |
| Management | 129,942 (58.6%) | 91,655 (41.4%) |
| Business & Financial | 58,001 (46.6%) | 66,456 (53.4%) |
| Computers, Engineering & Science | 98,379 (74.3%) | 34,116 (25.8%) |
| Computers & Mathematics | 46,776 (74.8%) | 15,755 (25.2%) |
| Architecture & Engineering | 40,159 (85.1%) | 7,048 (14.9%) |
| Life, Physical & Social Science | 11,444 (50.3%) | 11,313 (49.7%) |
| Community & Social Service | 81,553 (34.2%) | 156,832 (65.8%) |
| Education, Arts & Media | 10,510 (28.5%) | 26,336 (71.5%) |
| Legal Services & Support | 13,692 (52.7%) | 12,291 (47.3%) |
| Education Instruction & Library | 36,796 (27.1%) | 98,908 (72.9%) |
| Arts, Media & Entertainment | 20,555 (51.6%) | 19,297 (48.4%) |
| Health Diagnosing & Treating | 29,988 (24.5%) | 92,389 (75.5%) |
| Health Technologists | 20,492 (24.3%) | 63,802 (75.7%) |
| Total (Category) | 397,863 (47.4%) | 441,448 (52.6%) |
| Total (Overall) | 945,322 (51.6%) | 887,203 (48.4%) |
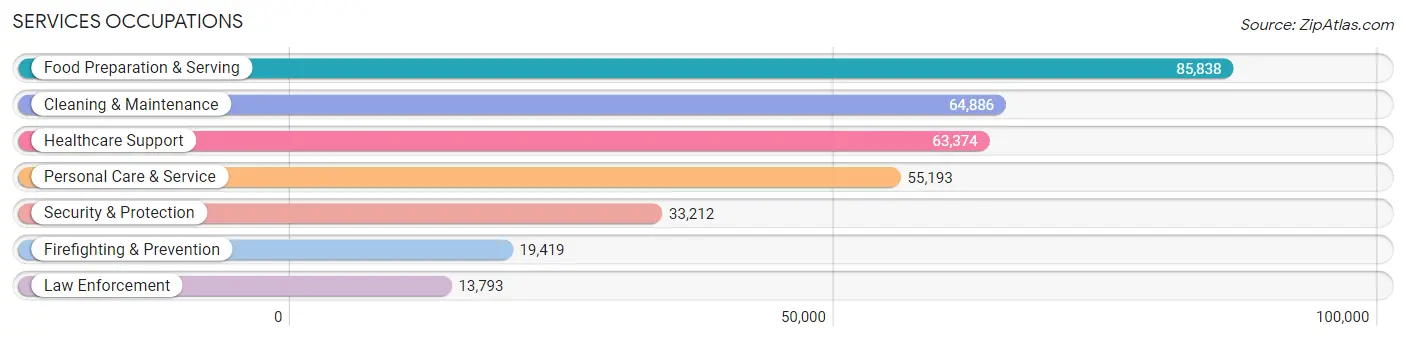
Services Occupations
The most common Services occupations in Connecticut are Food Preparation & Serving (85,838 | 4.7%), Cleaning & Maintenance (64,886 | 3.5%), Healthcare Support (63,374 | 3.5%), Personal Care & Service (55,193 | 3.0%), and Security & Protection (33,212 | 1.8%).
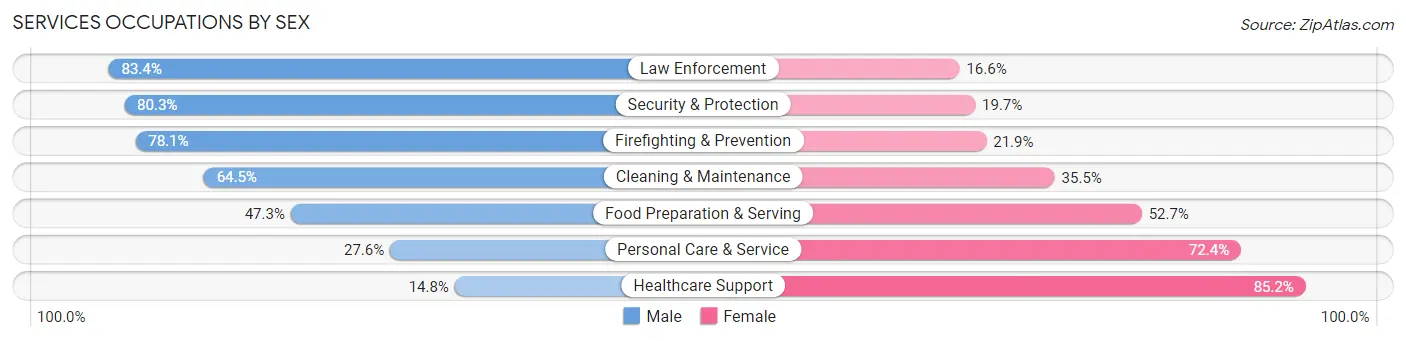
Services Occupations by Sex
Within the Services occupations in Connecticut, the most male-oriented occupations are Law Enforcement (83.4%), Security & Protection (80.3%), and Firefighting & Prevention (78.1%), while the most female-oriented occupations are Healthcare Support (85.2%), Personal Care & Service (72.4%), and Food Preparation & Serving (52.7%).
| Occupation | Male | Female |
| Healthcare Support | 9,396 (14.8%) | 53,978 (85.2%) |
| Security & Protection | 26,662 (80.3%) | 6,550 (19.7%) |
| Firefighting & Prevention | 15,161 (78.1%) | 4,258 (21.9%) |
| Law Enforcement | 11,501 (83.4%) | 2,292 (16.6%) |
| Food Preparation & Serving | 40,599 (47.3%) | 45,239 (52.7%) |
| Cleaning & Maintenance | 41,874 (64.5%) | 23,012 (35.5%) |
| Personal Care & Service | 15,254 (27.6%) | 39,939 (72.4%) |
| Total (Category) | 133,785 (44.2%) | 168,718 (55.8%) |
| Total (Overall) | 945,322 (51.6%) | 887,203 (48.4%) |
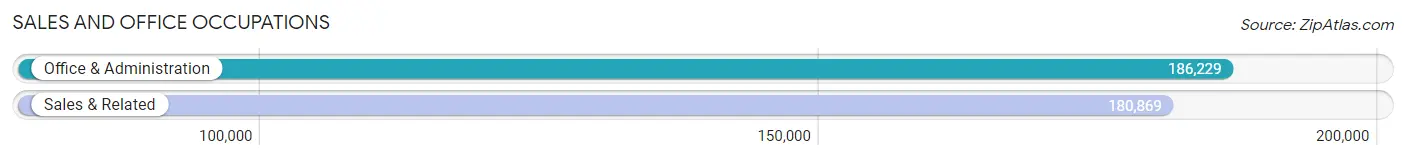
Sales and Office Occupations
The most common Sales and Office occupations in Connecticut are Office & Administration (186,229 | 10.2%), and Sales & Related (180,869 | 9.9%).
Sales and Office Occupations by Sex
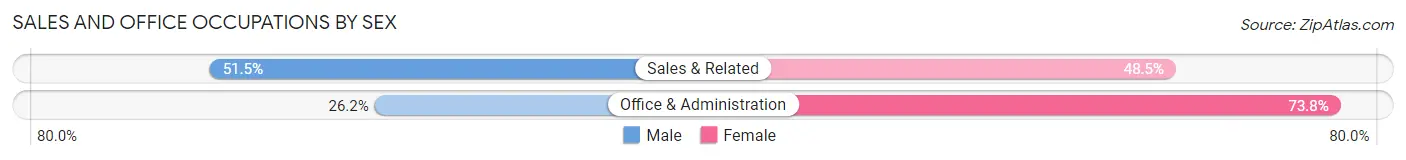
| Occupation | Male | Female |
| Sales & Related | 93,165 (51.5%) | 87,704 (48.5%) |
| Office & Administration | 48,720 (26.2%) | 137,509 (73.8%) |
| Total (Category) | 141,885 (38.7%) | 225,213 (61.4%) |
| Total (Overall) | 945,322 (51.6%) | 887,203 (48.4%) |
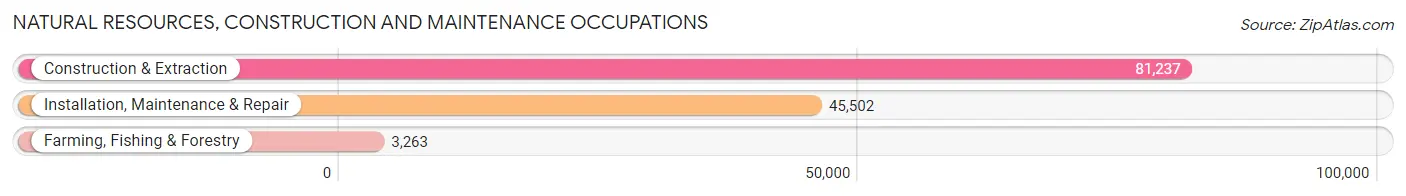
Natural Resources, Construction and Maintenance Occupations
The most common Natural Resources, Construction and Maintenance occupations in Connecticut are Construction & Extraction (81,237 | 4.4%), Installation, Maintenance & Repair (45,502 | 2.5%), and Farming, Fishing & Forestry (3,263 | 0.2%).
Natural Resources, Construction and Maintenance Occupations by Sex
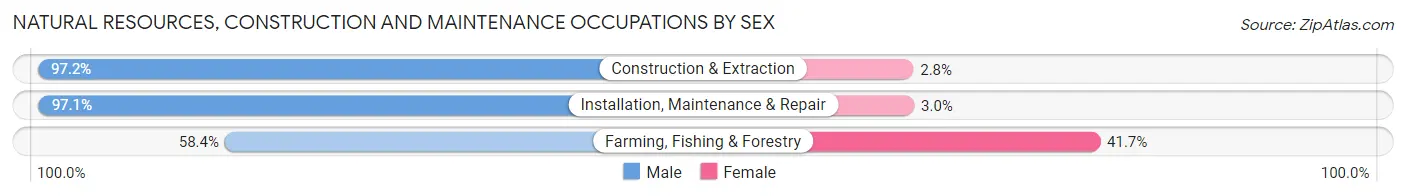
| Occupation | Male | Female |
| Farming, Fishing & Forestry | 1,904 (58.4%) | 1,359 (41.6%) |
| Construction & Extraction | 78,978 (97.2%) | 2,259 (2.8%) |
| Installation, Maintenance & Repair | 44,159 (97.1%) | 1,343 (2.9%) |
| Total (Category) | 125,041 (96.2%) | 4,961 (3.8%) |
| Total (Overall) | 945,322 (51.6%) | 887,203 (48.4%) |
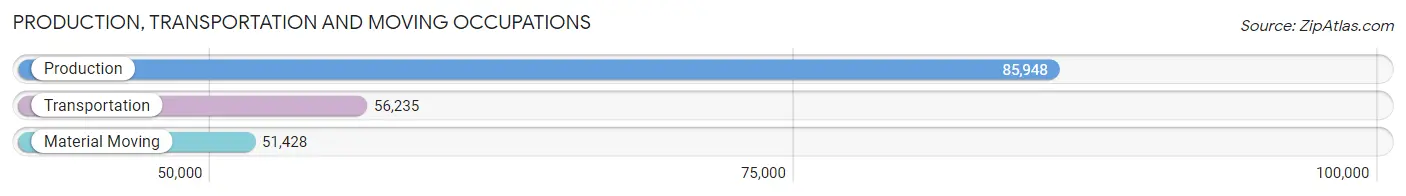
Production, Transportation and Moving Occupations
The most common Production, Transportation and Moving occupations in Connecticut are Production (85,948 | 4.7%), Transportation (56,235 | 3.1%), and Material Moving (51,428 | 2.8%).
Production, Transportation and Moving Occupations by Sex
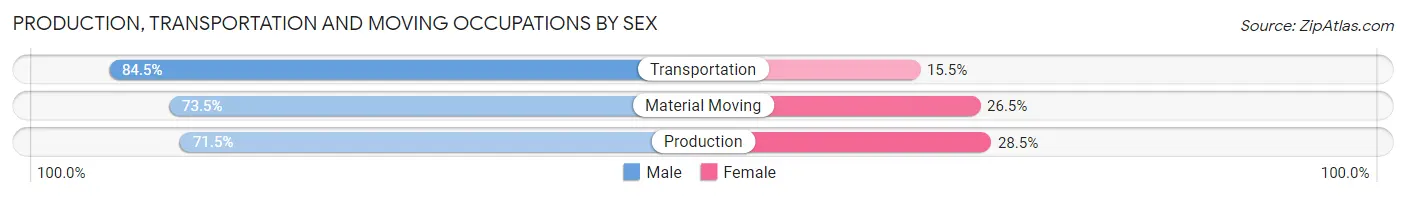
| Occupation | Male | Female |
| Production | 61,436 (71.5%) | 24,512 (28.5%) |
| Transportation | 47,524 (84.5%) | 8,711 (15.5%) |
| Material Moving | 37,788 (73.5%) | 13,640 (26.5%) |
| Total (Category) | 146,748 (75.8%) | 46,863 (24.2%) |
| Total (Overall) | 945,322 (51.6%) | 887,203 (48.4%) |
Employment Industries by Sex in Connecticut
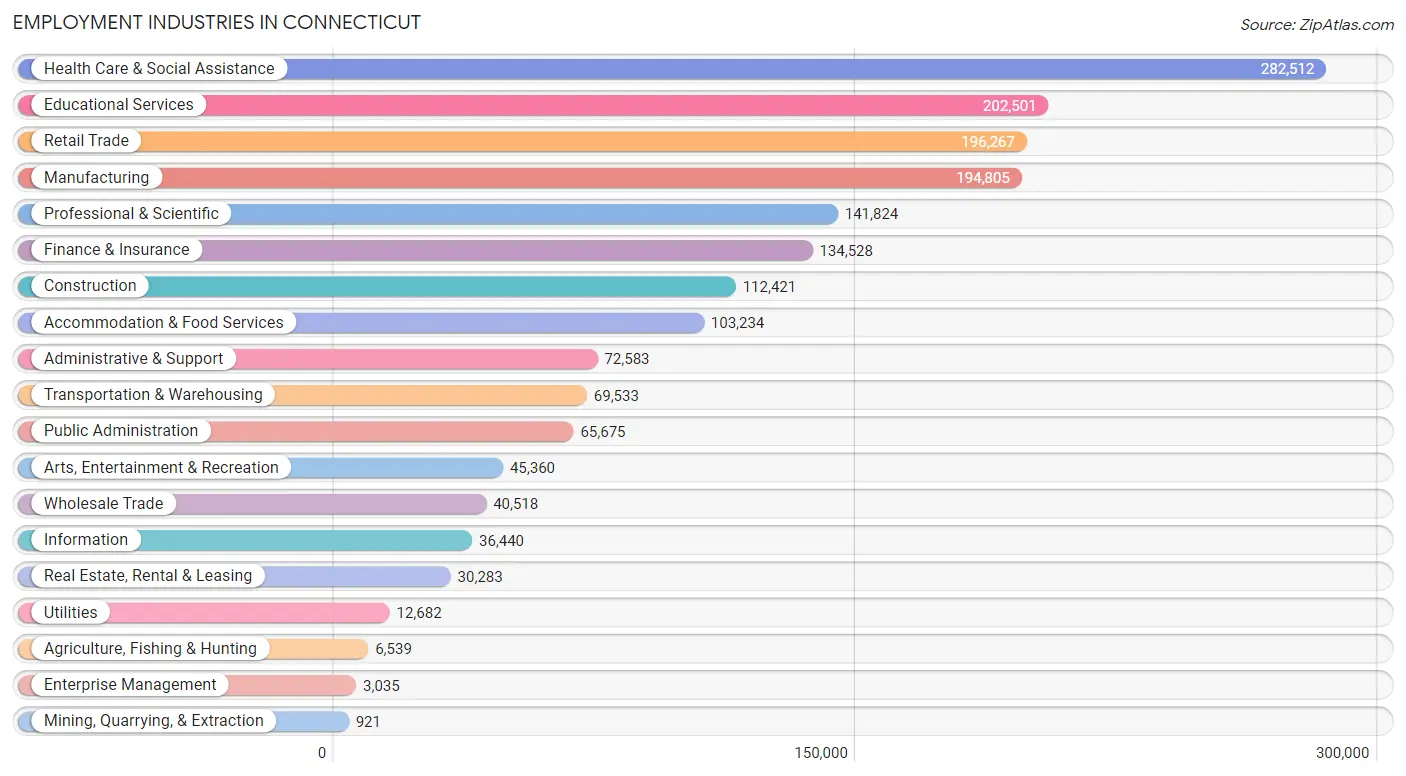
Employment Industries in Connecticut
The major employment industries in Connecticut include Health Care & Social Assistance (282,512 | 15.4%), Educational Services (202,501 | 11.1%), Retail Trade (196,267 | 10.7%), Manufacturing (194,805 | 10.6%), and Professional & Scientific (141,824 | 7.7%).
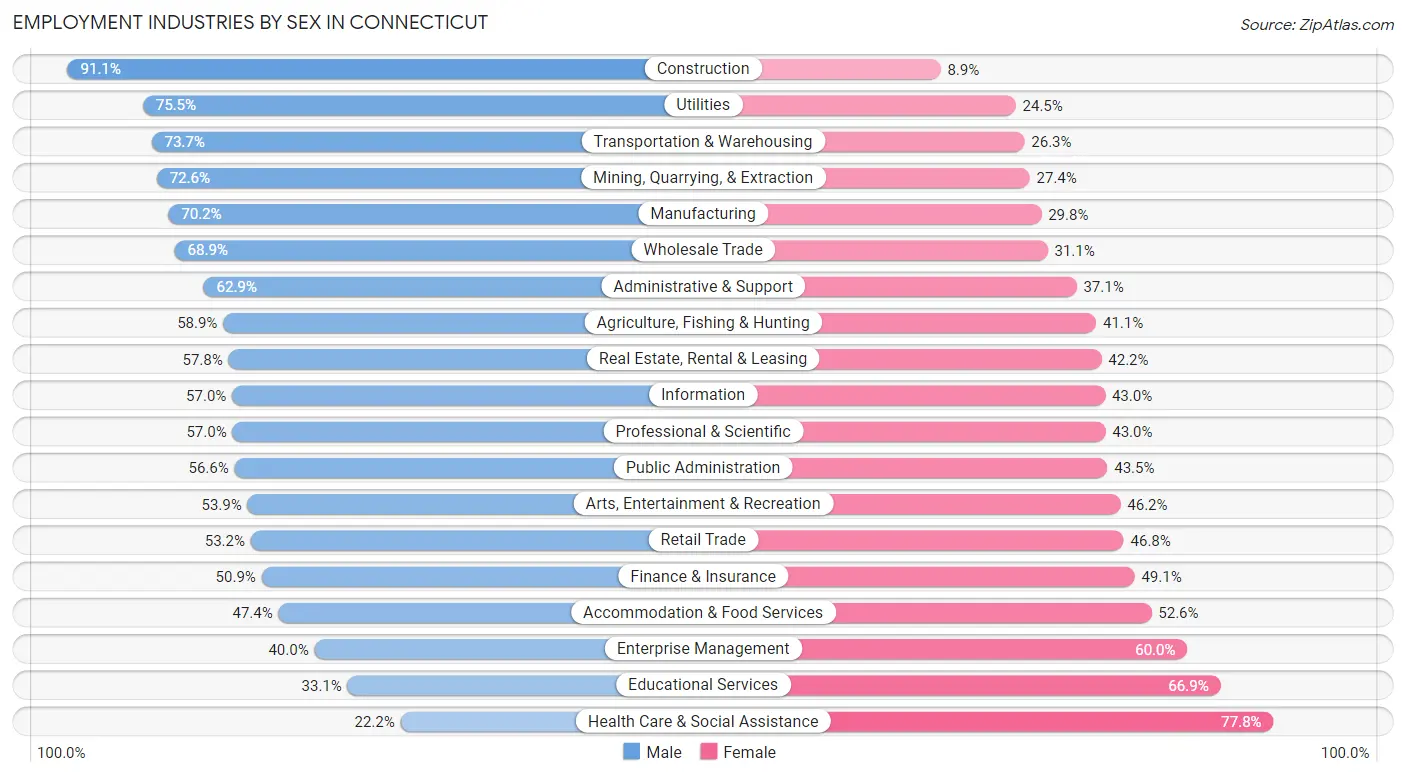
Employment Industries by Sex in Connecticut
The Connecticut industries that see more men than women are Construction (91.1%), Utilities (75.5%), and Transportation & Warehousing (73.7%), whereas the industries that tend to have a higher number of women are Health Care & Social Assistance (77.8%), Educational Services (66.9%), and Enterprise Management (60.0%).
| Industry | Male | Female |
| Agriculture, Fishing & Hunting | 3,851 (58.9%) | 2,688 (41.1%) |
| Mining, Quarrying, & Extraction | 669 (72.6%) | 252 (27.4%) |
| Construction | 102,408 (91.1%) | 10,013 (8.9%) |
| Manufacturing | 136,803 (70.2%) | 58,002 (29.8%) |
| Wholesale Trade | 27,929 (68.9%) | 12,589 (31.1%) |
| Retail Trade | 104,380 (53.2%) | 91,887 (46.8%) |
| Transportation & Warehousing | 51,261 (73.7%) | 18,272 (26.3%) |
| Utilities | 9,579 (75.5%) | 3,103 (24.5%) |
| Information | 20,786 (57.0%) | 15,654 (43.0%) |
| Finance & Insurance | 68,515 (50.9%) | 66,013 (49.1%) |
| Real Estate, Rental & Leasing | 17,502 (57.8%) | 12,781 (42.2%) |
| Professional & Scientific | 80,798 (57.0%) | 61,026 (43.0%) |
| Enterprise Management | 1,214 (40.0%) | 1,821 (60.0%) |
| Administrative & Support | 45,682 (62.9%) | 26,901 (37.1%) |
| Educational Services | 67,103 (33.1%) | 135,398 (66.9%) |
| Health Care & Social Assistance | 62,654 (22.2%) | 219,858 (77.8%) |
| Arts, Entertainment & Recreation | 24,425 (53.8%) | 20,935 (46.2%) |
| Accommodation & Food Services | 48,971 (47.4%) | 54,263 (52.6%) |
| Public Administration | 37,139 (56.6%) | 28,536 (43.4%) |
| Total | 945,322 (51.6%) | 887,203 (48.4%) |
Education in Connecticut
School Enrollment in Connecticut
The most common levels of schooling among the 891,363 students in Connecticut are college / undergraduate (211,086 | 23.7%), high school (193,879 | 21.7%), and middle school (176,254 | 19.8%).
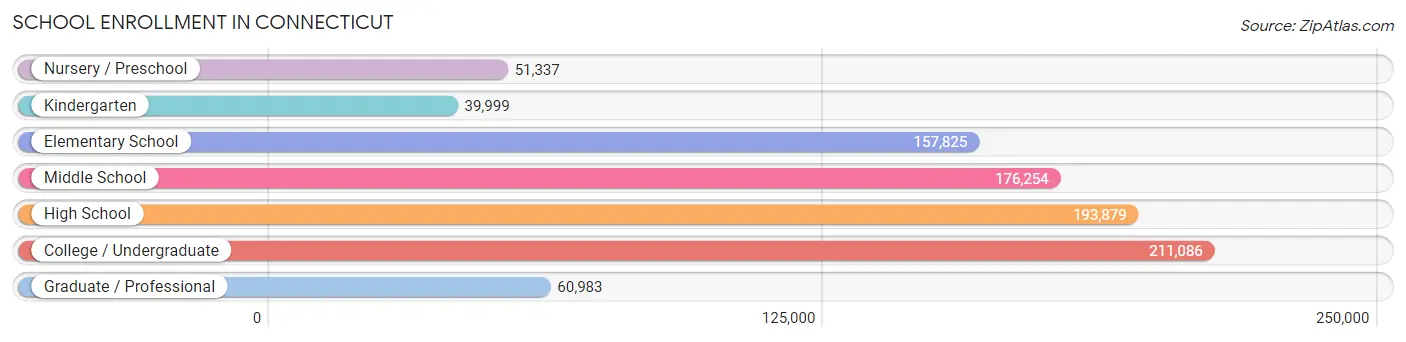
| School Level | # Students | % Students |
| Nursery / Preschool | 51,337 | 5.8% |
| Kindergarten | 39,999 | 4.5% |
| Elementary School | 157,825 | 17.7% |
| Middle School | 176,254 | 19.8% |
| High School | 193,879 | 21.7% |
| College / Undergraduate | 211,086 | 23.7% |
| Graduate / Professional | 60,983 | 6.8% |
| Total | 891,363 | 100.0% |
School Enrollment by Age by Funding Source in Connecticut
Out of a total of 891,363 students who are enrolled in schools in Connecticut, 181,838 (20.4%) attend a private institution, while the remaining 709,525 (79.6%) are enrolled in public schools. The age group of 35 years and over has the highest likelihood of being enrolled in private schools, with 18,344 (40.4% in the age bracket) enrolled. Conversely, the age group of 5 to 9 year old has the lowest likelihood of being enrolled in a private school, with 171,623 (90.8% in the age bracket) attending a public institution.
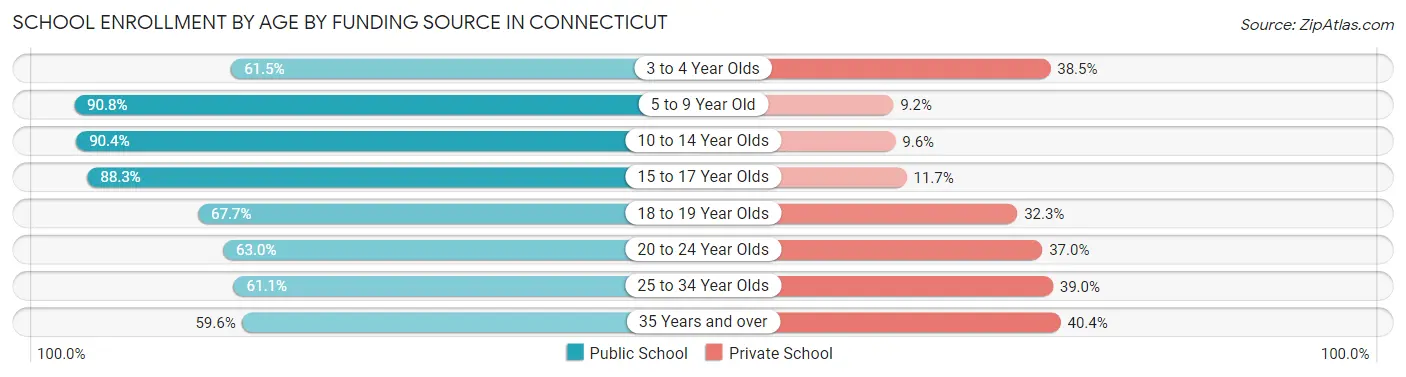
| Age Bracket | Public School | Private School |
| 3 to 4 Year Olds | 28,600 (61.5%) | 17,900 (38.5%) |
| 5 to 9 Year Old | 171,623 (90.8%) | 17,457 (9.2%) |
| 10 to 14 Year Olds | 197,414 (90.4%) | 21,002 (9.6%) |
| 15 to 17 Year Olds | 121,944 (88.3%) | 16,178 (11.7%) |
| 18 to 19 Year Olds | 58,266 (67.7%) | 27,829 (32.3%) |
| 20 to 24 Year Olds | 72,120 (63.0%) | 42,321 (37.0%) |
| 25 to 34 Year Olds | 32,545 (61.1%) | 20,760 (39.0%) |
| 35 Years and over | 27,060 (59.6%) | 18,344 (40.4%) |
| Total | 709,525 (79.6%) | 181,838 (20.4%) |
Educational Attainment by Field of Study in Connecticut
Business (214,102 | 19.0%), social sciences (113,705 | 10.1%), education (107,265 | 9.5%), science & technology (99,041 | 8.8%), and engineering (83,402 | 7.4%) are the most common fields of study among 1,128,925 individuals in Connecticut who have obtained a bachelor's degree or higher.
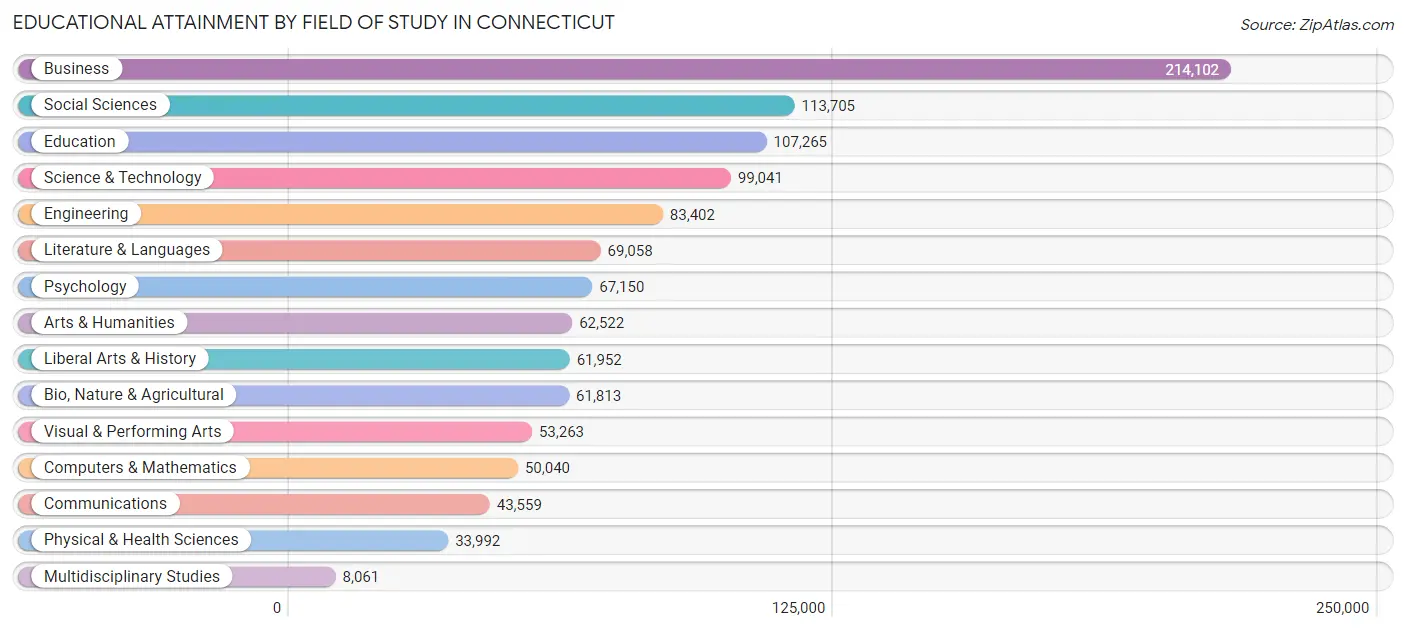
| Field of Study | # Graduates | % Graduates |
| Computers & Mathematics | 50,040 | 4.4% |
| Bio, Nature & Agricultural | 61,813 | 5.5% |
| Physical & Health Sciences | 33,992 | 3.0% |
| Psychology | 67,150 | 5.9% |
| Social Sciences | 113,705 | 10.1% |
| Engineering | 83,402 | 7.4% |
| Multidisciplinary Studies | 8,061 | 0.7% |
| Science & Technology | 99,041 | 8.8% |
| Business | 214,102 | 19.0% |
| Education | 107,265 | 9.5% |
| Literature & Languages | 69,058 | 6.1% |
| Liberal Arts & History | 61,952 | 5.5% |
| Visual & Performing Arts | 53,263 | 4.7% |
| Communications | 43,559 | 3.9% |
| Arts & Humanities | 62,522 | 5.5% |
| Total | 1,128,925 | 100.0% |
Transportation & Commute in Connecticut
Vehicle Availability by Sex in Connecticut
The most prevalent vehicle ownership categories in Connecticut are males with 2 vehicles (401,757, accounting for 43.6%) and females with 2 vehicles (347,396, making up 47.3%).
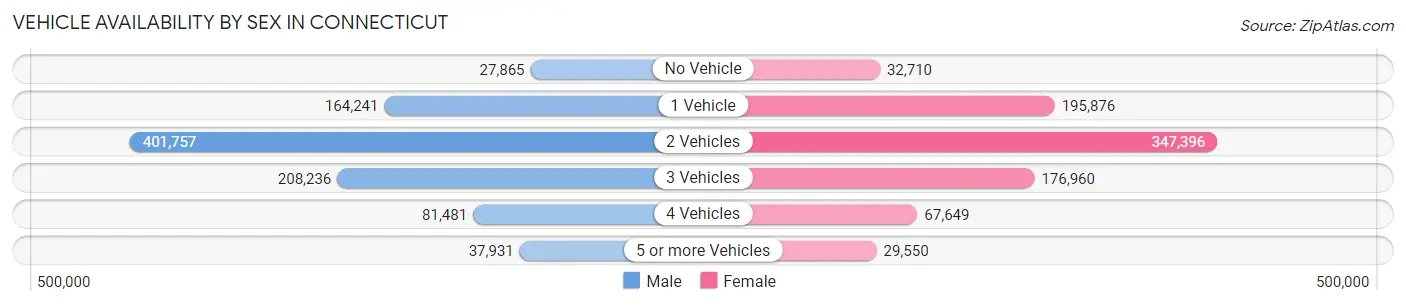
| Vehicles Available | Male | Female |
| No Vehicle | 27,865 (3.0%) | 32,710 (3.8%) |
| 1 Vehicle | 164,241 (17.8%) | 195,876 (23.0%) |
| 2 Vehicles | 401,757 (43.6%) | 347,396 (40.9%) |
| 3 Vehicles | 208,236 (22.6%) | 176,960 (20.8%) |
| 4 Vehicles | 81,481 (8.8%) | 67,649 (8.0%) |
| 5 or more Vehicles | 37,931 (4.1%) | 29,550 (3.5%) |
| Total | 921,511 (100.0%) | 850,141 (100.0%) |
Commute Time in Connecticut
The most frequently occuring commute durations in Connecticut are 15 to 19 minutes (251,906 commuters, 16.0%), 20 to 24 minutes (239,716 commuters, 15.2%), and 10 to 14 minutes (227,647 commuters, 14.5%).
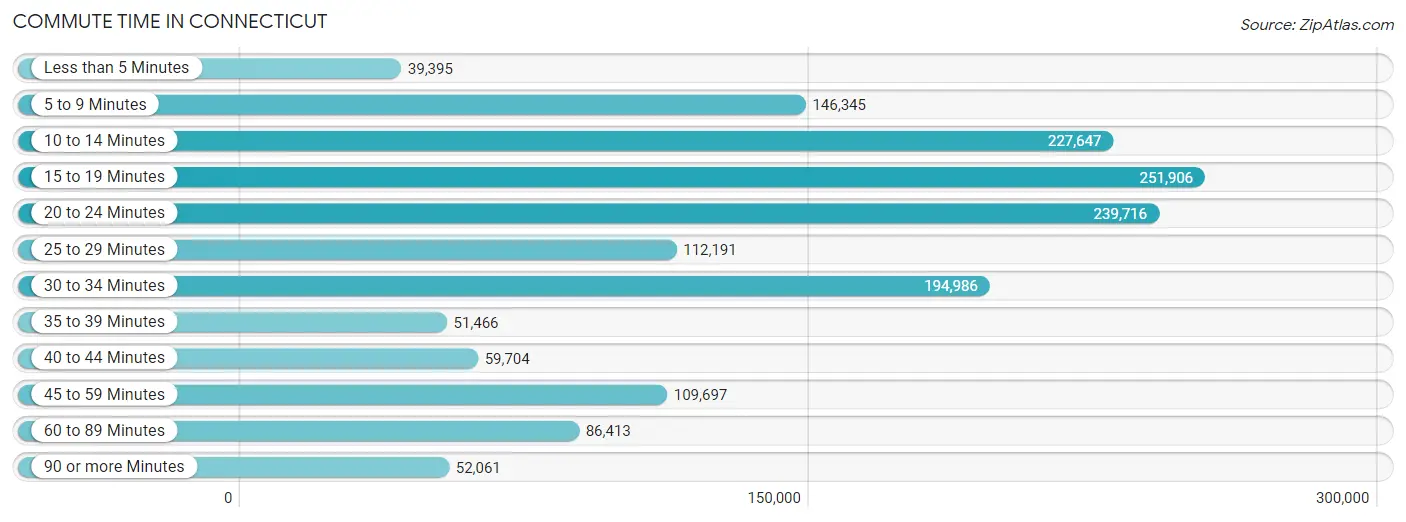
| Commute Time | # Commuters | % Commuters |
| Less than 5 Minutes | 39,395 | 2.5% |
| 5 to 9 Minutes | 146,345 | 9.3% |
| 10 to 14 Minutes | 227,647 | 14.5% |
| 15 to 19 Minutes | 251,906 | 16.0% |
| 20 to 24 Minutes | 239,716 | 15.2% |
| 25 to 29 Minutes | 112,191 | 7.1% |
| 30 to 34 Minutes | 194,986 | 12.4% |
| 35 to 39 Minutes | 51,466 | 3.3% |
| 40 to 44 Minutes | 59,704 | 3.8% |
| 45 to 59 Minutes | 109,697 | 7.0% |
| 60 to 89 Minutes | 86,413 | 5.5% |
| 90 or more Minutes | 52,061 | 3.3% |
Commute Time by Sex in Connecticut
The most common commute times in Connecticut are 15 to 19 minutes (124,074 commuters, 15.1%) for males and 15 to 19 minutes (127,832 commuters, 17.1%) for females.
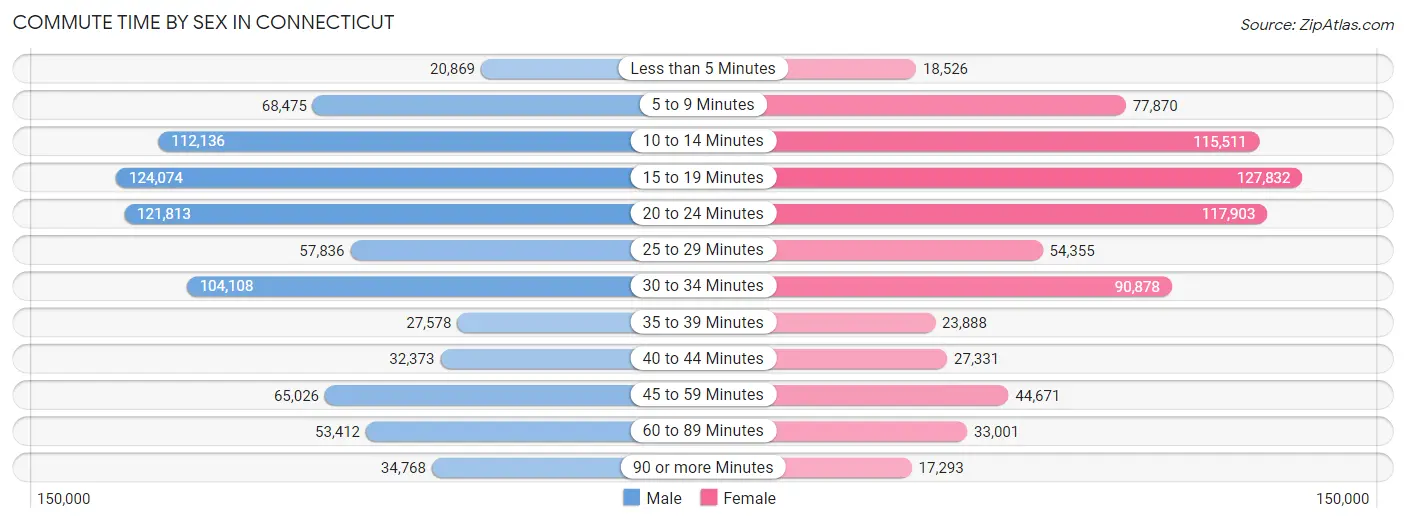
| Commute Time | Male | Female |
| Less than 5 Minutes | 20,869 (2.5%) | 18,526 (2.5%) |
| 5 to 9 Minutes | 68,475 (8.3%) | 77,870 (10.4%) |
| 10 to 14 Minutes | 112,136 (13.6%) | 115,511 (15.4%) |
| 15 to 19 Minutes | 124,074 (15.1%) | 127,832 (17.1%) |
| 20 to 24 Minutes | 121,813 (14.8%) | 117,903 (15.7%) |
| 25 to 29 Minutes | 57,836 (7.0%) | 54,355 (7.3%) |
| 30 to 34 Minutes | 104,108 (12.7%) | 90,878 (12.1%) |
| 35 to 39 Minutes | 27,578 (3.4%) | 23,888 (3.2%) |
| 40 to 44 Minutes | 32,373 (3.9%) | 27,331 (3.6%) |
| 45 to 59 Minutes | 65,026 (7.9%) | 44,671 (6.0%) |
| 60 to 89 Minutes | 53,412 (6.5%) | 33,001 (4.4%) |
| 90 or more Minutes | 34,768 (4.2%) | 17,293 (2.3%) |
Time of Departure to Work by Sex in Connecticut
The most frequent times of departure to work in Connecticut are 7:00 AM to 7:29 AM (116,249, 14.1%) for males and 8:00 AM to 8:29 AM (111,005, 14.8%) for females.
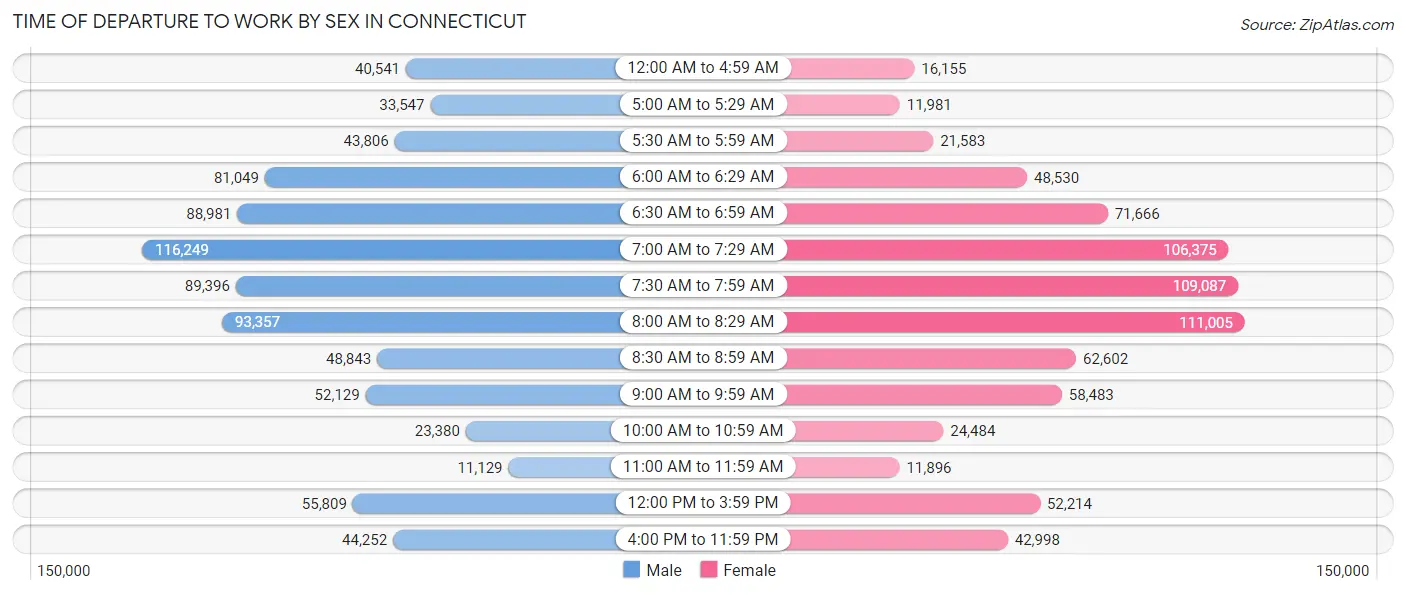
| Time of Departure | Male | Female |
| 12:00 AM to 4:59 AM | 40,541 (4.9%) | 16,155 (2.2%) |
| 5:00 AM to 5:29 AM | 33,547 (4.1%) | 11,981 (1.6%) |
| 5:30 AM to 5:59 AM | 43,806 (5.3%) | 21,583 (2.9%) |
| 6:00 AM to 6:29 AM | 81,049 (9.9%) | 48,530 (6.5%) |
| 6:30 AM to 6:59 AM | 88,981 (10.8%) | 71,666 (9.6%) |
| 7:00 AM to 7:29 AM | 116,249 (14.1%) | 106,375 (14.2%) |
| 7:30 AM to 7:59 AM | 89,396 (10.9%) | 109,087 (14.6%) |
| 8:00 AM to 8:29 AM | 93,357 (11.4%) | 111,005 (14.8%) |
| 8:30 AM to 8:59 AM | 48,843 (5.9%) | 62,602 (8.4%) |
| 9:00 AM to 9:59 AM | 52,129 (6.3%) | 58,483 (7.8%) |
| 10:00 AM to 10:59 AM | 23,380 (2.8%) | 24,484 (3.3%) |
| 11:00 AM to 11:59 AM | 11,129 (1.3%) | 11,896 (1.6%) |
| 12:00 PM to 3:59 PM | 55,809 (6.8%) | 52,214 (7.0%) |
| 4:00 PM to 11:59 PM | 44,252 (5.4%) | 42,998 (5.7%) |
| Total | 822,468 (100.0%) | 749,059 (100.0%) |
Housing Occupancy in Connecticut
Occupancy by Ownership in Connecticut
Of the total 1,409,807 dwellings in Connecticut, owner-occupied units account for 932,588 (66.1%), while renter-occupied units make up 477,219 (33.9%).
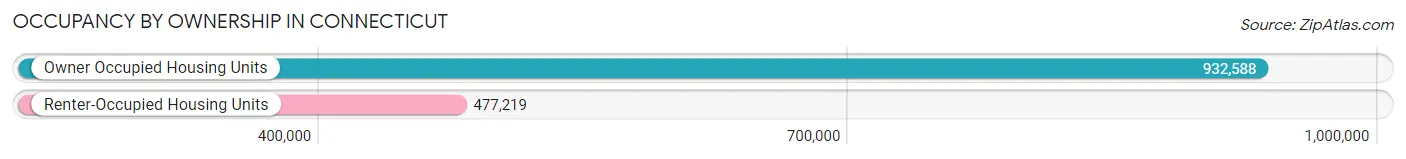
| Occupancy | # Housing Units | % Housing Units |
| Owner Occupied Housing Units | 932,588 | 66.1% |
| Renter-Occupied Housing Units | 477,219 | 33.9% |
| Total Occupied Housing Units | 1,409,807 | 100.0% |
Occupancy by Household Size in Connecticut
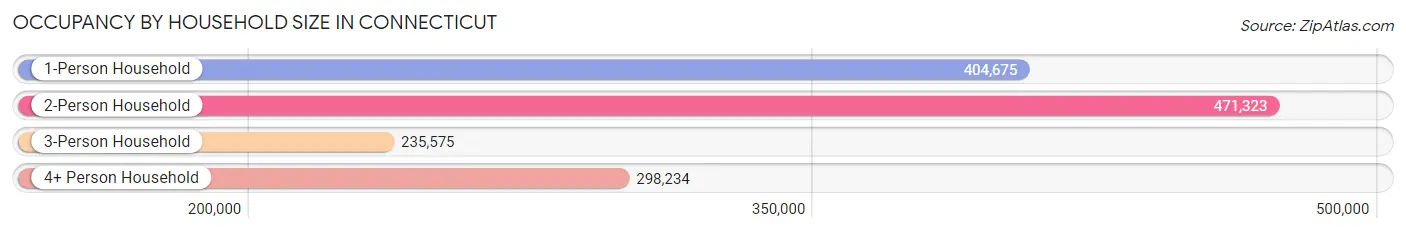
| Household Size | # Housing Units | % Housing Units |
| 1-Person Household | 404,675 | 28.7% |
| 2-Person Household | 471,323 | 33.4% |
| 3-Person Household | 235,575 | 16.7% |
| 4+ Person Household | 298,234 | 21.1% |
| Total Housing Units | 1,409,807 | 100.0% |
Occupancy by Ownership by Household Size in Connecticut
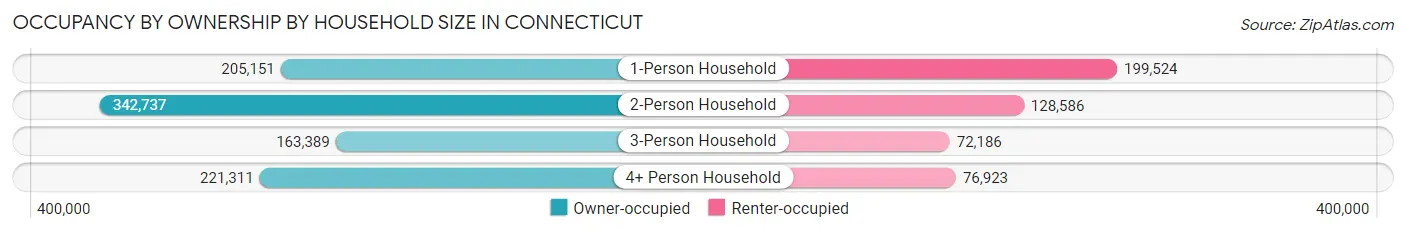
| Household Size | Owner-occupied | Renter-occupied |
| 1-Person Household | 205,151 (50.7%) | 199,524 (49.3%) |
| 2-Person Household | 342,737 (72.7%) | 128,586 (27.3%) |
| 3-Person Household | 163,389 (69.4%) | 72,186 (30.6%) |
| 4+ Person Household | 221,311 (74.2%) | 76,923 (25.8%) |
| Total Housing Units | 932,588 (66.1%) | 477,219 (33.9%) |
Occupancy by Educational Attainment in Connecticut
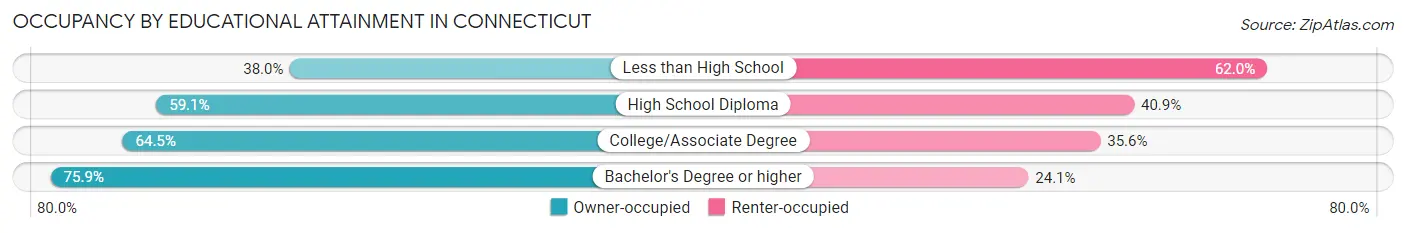
| Household Size | Owner-occupied | Renter-occupied |
| Less than High School | 40,793 (38.0%) | 66,501 (62.0%) |
| High School Diploma | 195,859 (59.1%) | 135,539 (40.9%) |
| College/Associate Degree | 230,191 (64.4%) | 126,949 (35.5%) |
| Bachelor's Degree or higher | 465,745 (75.9%) | 148,230 (24.1%) |
Occupancy by Age of Householder in Connecticut
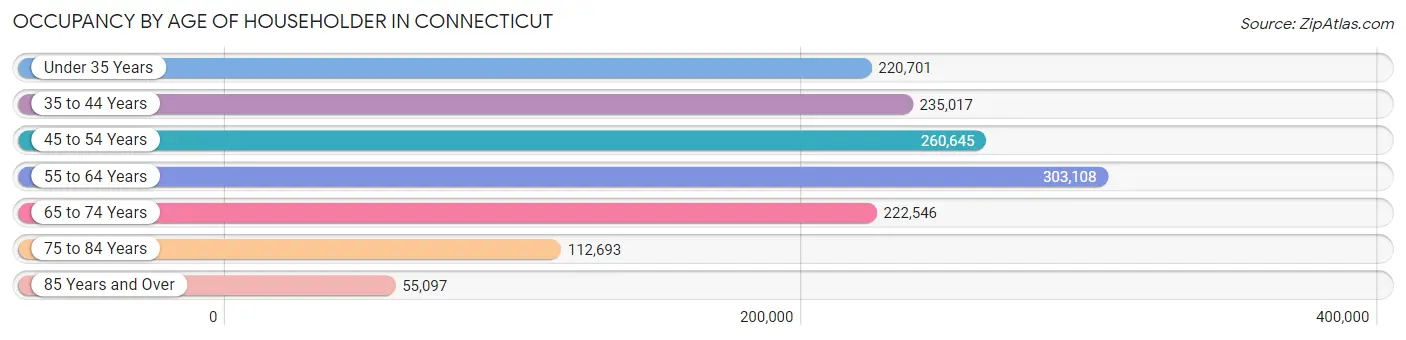
| Age Bracket | # Households | % Households |
| Under 35 Years | 220,701 | 15.7% |
| 35 to 44 Years | 235,017 | 16.7% |
| 45 to 54 Years | 260,645 | 18.5% |
| 55 to 64 Years | 303,108 | 21.5% |
| 65 to 74 Years | 222,546 | 15.8% |
| 75 to 84 Years | 112,693 | 8.0% |
| 85 Years and Over | 55,097 | 3.9% |
| Total | 1,409,807 | 100.0% |
Housing Finances in Connecticut
Median Income by Occupancy in Connecticut
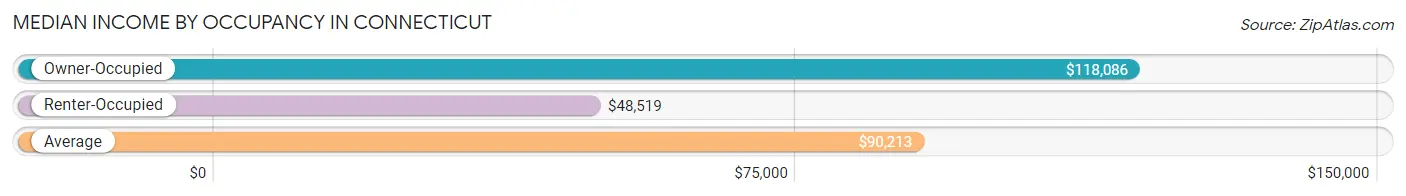
| Occupancy Type | # Households | Median Income |
| Owner-Occupied | 932,588 (66.1%) | $118,086 |
| Renter-Occupied | 477,219 (33.9%) | $48,519 |
| Average | 1,409,807 (100.0%) | $90,213 |
Occupancy by Householder Income Bracket in Connecticut
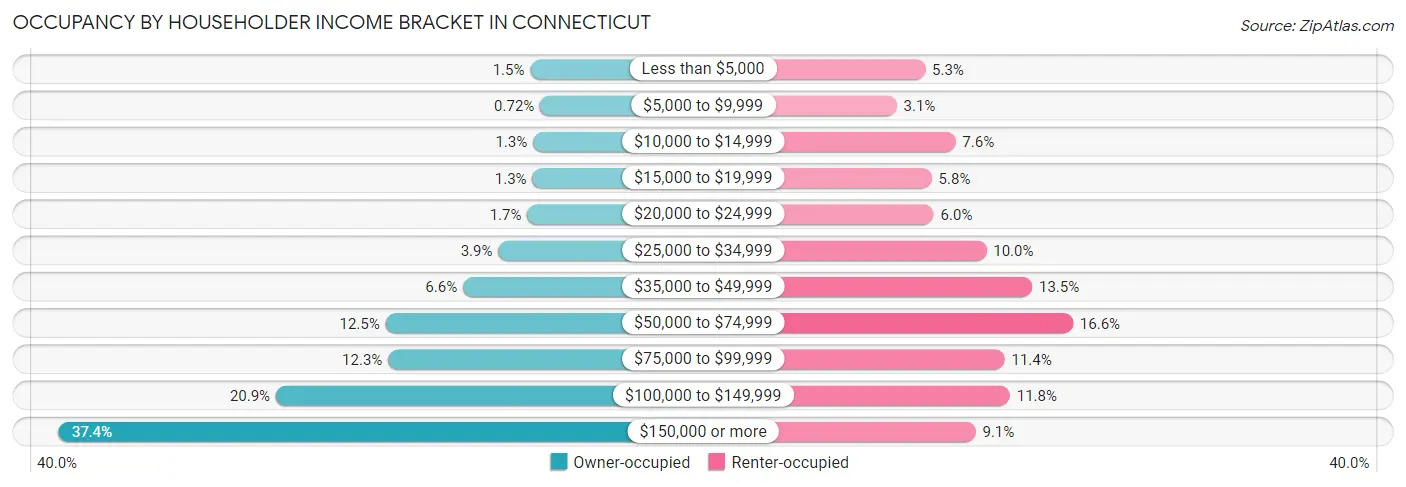
| Income Bracket | Owner-occupied | Renter-occupied |
| Less than $5,000 | 13,723 (1.5%) | 25,292 (5.3%) |
| $5,000 to $9,999 | 6,702 (0.7%) | 14,956 (3.1%) |
| $10,000 to $14,999 | 11,754 (1.3%) | 36,328 (7.6%) |
| $15,000 to $19,999 | 12,173 (1.3%) | 27,673 (5.8%) |
| $20,000 to $24,999 | 15,846 (1.7%) | 28,394 (5.9%) |
| $25,000 to $34,999 | 36,505 (3.9%) | 47,524 (10.0%) |
| $35,000 to $49,999 | 61,534 (6.6%) | 64,197 (13.5%) |
| $50,000 to $74,999 | 116,542 (12.5%) | 79,004 (16.6%) |
| $75,000 to $99,999 | 114,691 (12.3%) | 54,165 (11.4%) |
| $100,000 to $149,999 | 194,437 (20.8%) | 56,080 (11.7%) |
| $150,000 or more | 348,681 (37.4%) | 43,606 (9.1%) |
| Total | 932,588 (100.0%) | 477,219 (100.0%) |
Monthly Housing Cost Tiers in Connecticut

| Monthly Cost | Owner-occupied | Renter-occupied |
| Less than $300 | 5,656 (0.6%) | 18,186 (3.8%) |
| $300 to $499 | 13,303 (1.4%) | 21,025 (4.4%) |
| $500 to $799 | 72,222 (7.7%) | 31,524 (6.6%) |
| $800 to $999 | 77,469 (8.3%) | 37,810 (7.9%) |
| $1,000 to $1,499 | 172,146 (18.5%) | 162,163 (34.0%) |
| $1,500 to $1,999 | 170,456 (18.3%) | 106,201 (22.3%) |
| $2,000 to $2,499 | 145,742 (15.6%) | 44,692 (9.4%) |
| $2,500 to $2,999 | 94,302 (10.1%) | 17,016 (3.6%) |
| $3,000 or more | 181,292 (19.4%) | 20,247 (4.2%) |
| Total | 932,588 (100.0%) | 477,219 (100.0%) |
Physical Housing Characteristics in Connecticut
Housing Structures in Connecticut
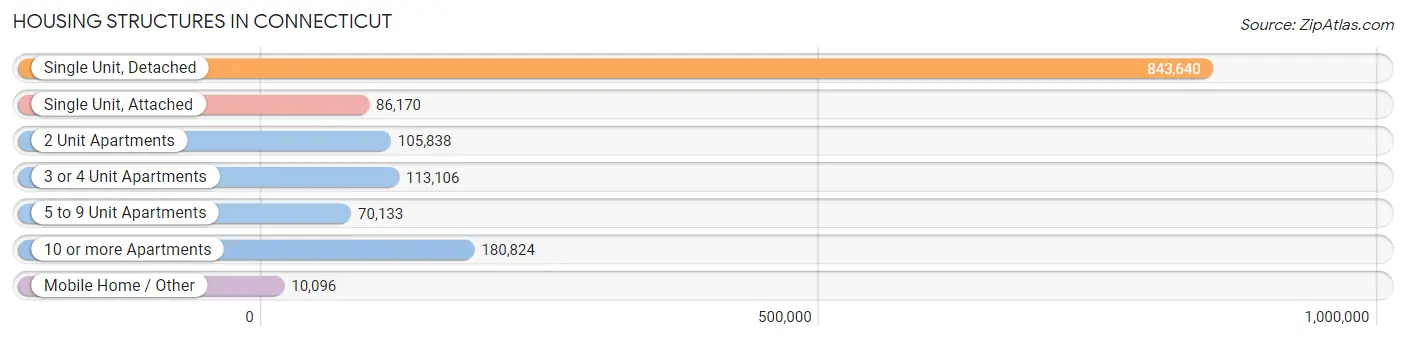
| Structure Type | # Housing Units | % Housing Units |
| Single Unit, Detached | 843,640 | 59.8% |
| Single Unit, Attached | 86,170 | 6.1% |
| 2 Unit Apartments | 105,838 | 7.5% |
| 3 or 4 Unit Apartments | 113,106 | 8.0% |
| 5 to 9 Unit Apartments | 70,133 | 5.0% |
| 10 or more Apartments | 180,824 | 12.8% |
| Mobile Home / Other | 10,096 | 0.7% |
| Total | 1,409,807 | 100.0% |
Housing Structures by Occupancy in Connecticut
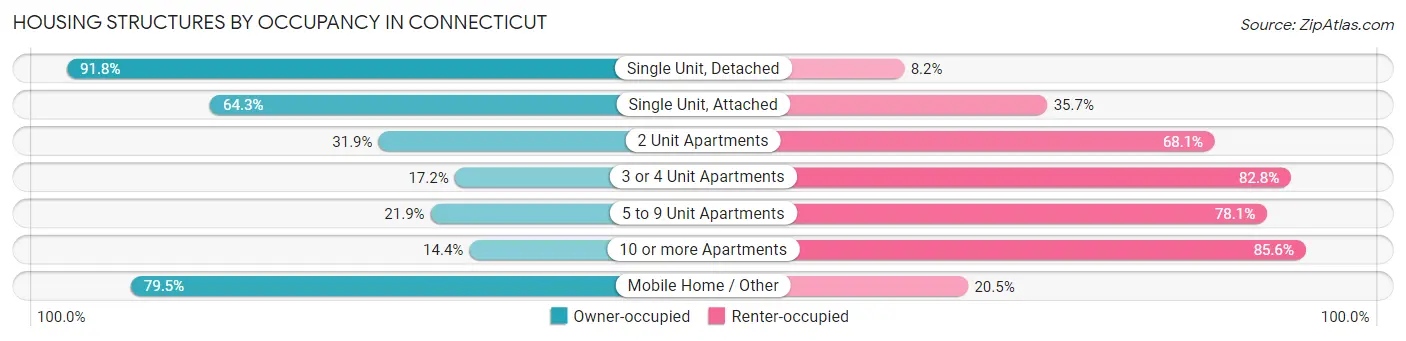
| Structure Type | Owner-occupied | Renter-occupied |
| Single Unit, Detached | 774,546 (91.8%) | 69,094 (8.2%) |
| Single Unit, Attached | 55,378 (64.3%) | 30,792 (35.7%) |
| 2 Unit Apartments | 33,753 (31.9%) | 72,085 (68.1%) |
| 3 or 4 Unit Apartments | 19,493 (17.2%) | 93,613 (82.8%) |
| 5 to 9 Unit Apartments | 15,341 (21.9%) | 54,792 (78.1%) |
| 10 or more Apartments | 26,048 (14.4%) | 154,776 (85.6%) |
| Mobile Home / Other | 8,029 (79.5%) | 2,067 (20.5%) |
| Total | 932,588 (66.1%) | 477,219 (33.9%) |
Housing Structures by Number of Rooms in Connecticut
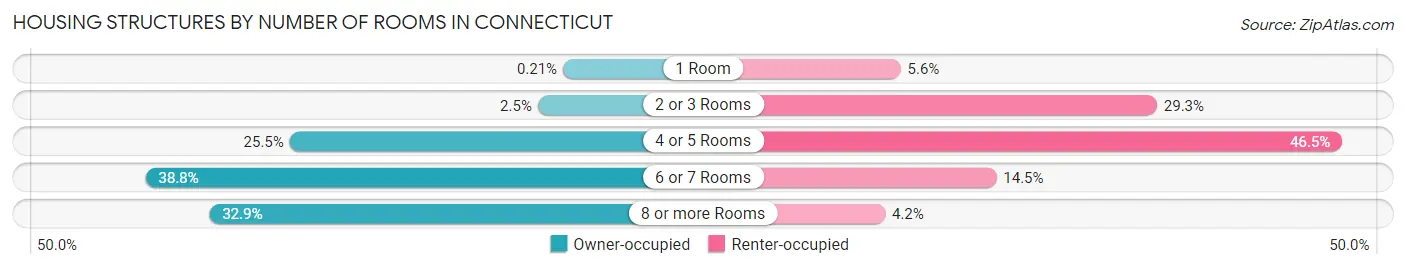
| Number of Rooms | Owner-occupied | Renter-occupied |
| 1 Room | 2,003 (0.2%) | 26,768 (5.6%) |
| 2 or 3 Rooms | 23,668 (2.5%) | 139,881 (29.3%) |
| 4 or 5 Rooms | 237,758 (25.5%) | 221,646 (46.5%) |
| 6 or 7 Rooms | 362,125 (38.8%) | 69,036 (14.5%) |
| 8 or more Rooms | 307,034 (32.9%) | 19,888 (4.2%) |
| Total | 932,588 (100.0%) | 477,219 (100.0%) |
Housing Structure by Heating Type in Connecticut
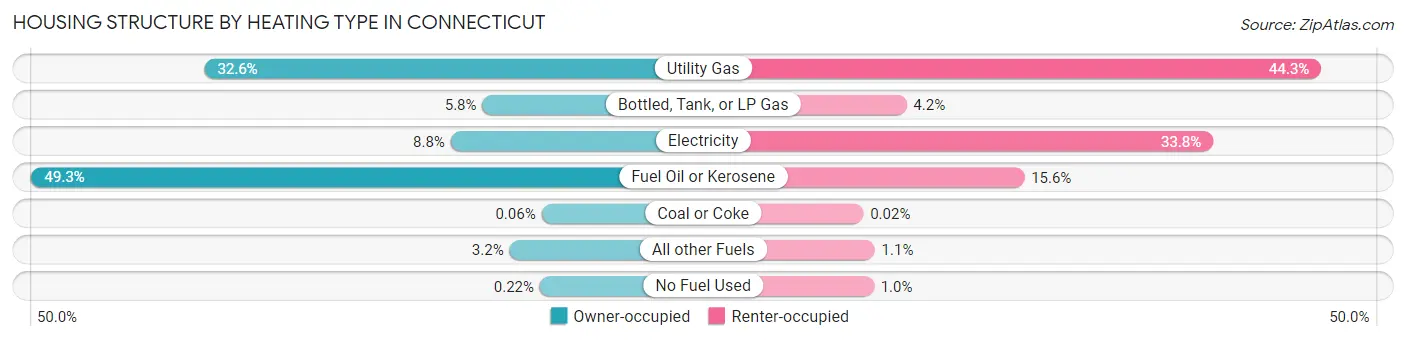
| Heating Type | Owner-occupied | Renter-occupied |
| Utility Gas | 304,250 (32.6%) | 211,196 (44.3%) |
| Bottled, Tank, or LP Gas | 53,772 (5.8%) | 20,002 (4.2%) |
| Electricity | 82,390 (8.8%) | 161,366 (33.8%) |
| Fuel Oil or Kerosene | 460,160 (49.3%) | 74,326 (15.6%) |
| Coal or Coke | 572 (0.1%) | 81 (0.0%) |
| All other Fuels | 29,420 (3.2%) | 5,330 (1.1%) |
| No Fuel Used | 2,024 (0.2%) | 4,918 (1.0%) |
| Total | 932,588 (100.0%) | 477,219 (100.0%) |
Household Vehicle Usage in Connecticut
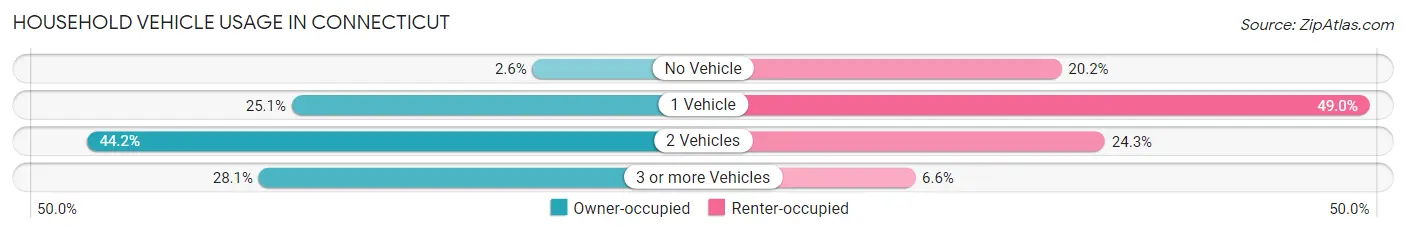
| Vehicles per Household | Owner-occupied | Renter-occupied |
| No Vehicle | 24,059 (2.6%) | 96,430 (20.2%) |
| 1 Vehicle | 233,662 (25.1%) | 233,703 (49.0%) |
| 2 Vehicles | 412,427 (44.2%) | 115,821 (24.3%) |
| 3 or more Vehicles | 262,440 (28.1%) | 31,265 (6.6%) |
| Total | 932,588 (100.0%) | 477,219 (100.0%) |
Real Estate & Mortgages in Connecticut
Real Estate and Mortgage Overview in Connecticut
| Characteristic | Without Mortgage | With Mortgage |
| Housing Units | 314,566 | 618,022 |
| Median Property Value | $312,600 | $329,100 |
| Median Household Income | $88,765 | $262,203 |
| Monthly Housing Costs | $1,018 | $173,385 |
| Real Estate Taxes | $6,286 | $6,247 |
Property Value by Mortgage Status in Connecticut
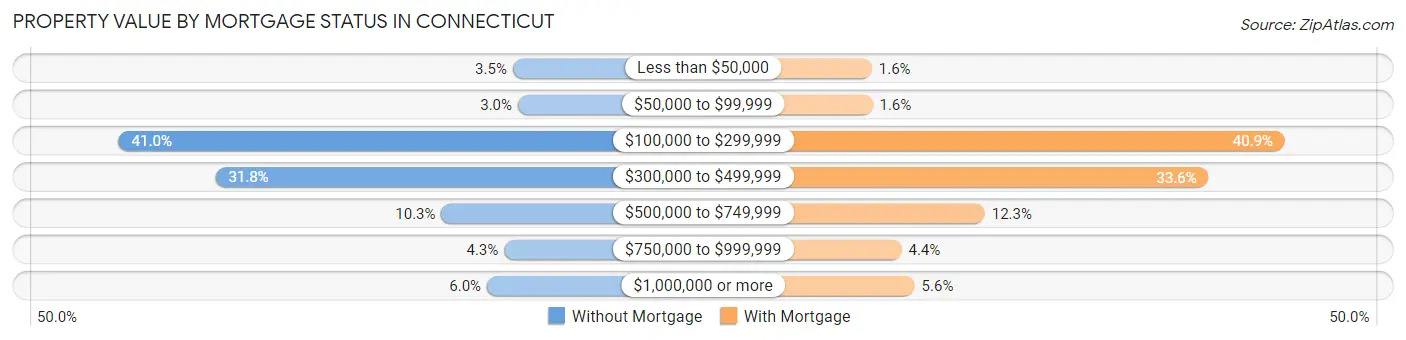
| Property Value | Without Mortgage | With Mortgage |
| Less than $50,000 | 11,045 (3.5%) | 9,601 (1.5%) |
| $50,000 to $99,999 | 9,511 (3.0%) | 9,995 (1.6%) |
| $100,000 to $299,999 | 129,087 (41.0%) | 252,684 (40.9%) |
| $300,000 to $499,999 | 100,095 (31.8%) | 207,781 (33.6%) |
| $500,000 to $749,999 | 32,427 (10.3%) | 76,057 (12.3%) |
| $750,000 to $999,999 | 13,633 (4.3%) | 27,099 (4.4%) |
| $1,000,000 or more | 18,768 (6.0%) | 34,805 (5.6%) |
| Total | 314,566 (100.0%) | 618,022 (100.0%) |
Household Income by Mortgage Status in Connecticut
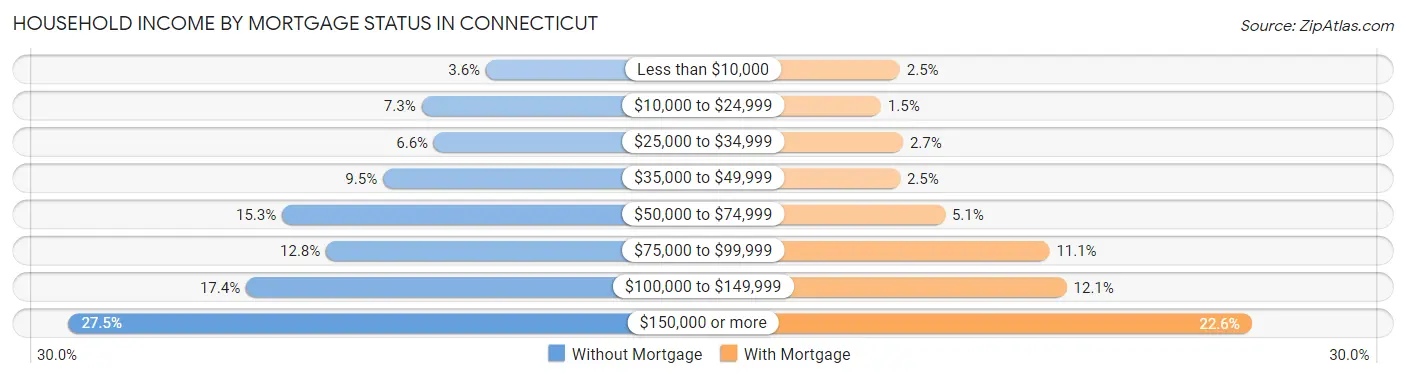
| Household Income | Without Mortgage | With Mortgage |
| Less than $10,000 | 11,439 (3.6%) | 15,632 (2.5%) |
| $10,000 to $24,999 | 23,039 (7.3%) | 8,986 (1.5%) |
| $25,000 to $34,999 | 20,802 (6.6%) | 16,734 (2.7%) |
| $35,000 to $49,999 | 29,943 (9.5%) | 15,703 (2.5%) |
| $50,000 to $74,999 | 48,090 (15.3%) | 31,591 (5.1%) |
| $75,000 to $99,999 | 40,185 (12.8%) | 68,452 (11.1%) |
| $100,000 to $149,999 | 54,590 (17.3%) | 74,506 (12.1%) |
| $150,000 or more | 86,478 (27.5%) | 139,847 (22.6%) |
| Total | 314,566 (100.0%) | 618,022 (100.0%) |
Property Value to Household Income Ratio in Connecticut
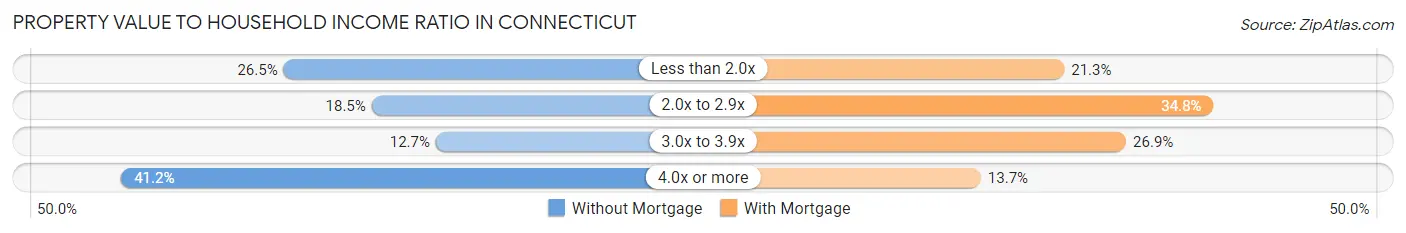
| Value-to-Income Ratio | Without Mortgage | With Mortgage |
| Less than 2.0x | 83,339 (26.5%) | 131,540 (21.3%) |
| 2.0x to 2.9x | 58,173 (18.5%) | 215,222 (34.8%) |
| 3.0x to 3.9x | 39,826 (12.7%) | 166,219 (26.9%) |
| 4.0x or more | 129,664 (41.2%) | 84,737 (13.7%) |
| Total | 314,566 (100.0%) | 618,022 (100.0%) |
Real Estate Taxes by Mortgage Status in Connecticut
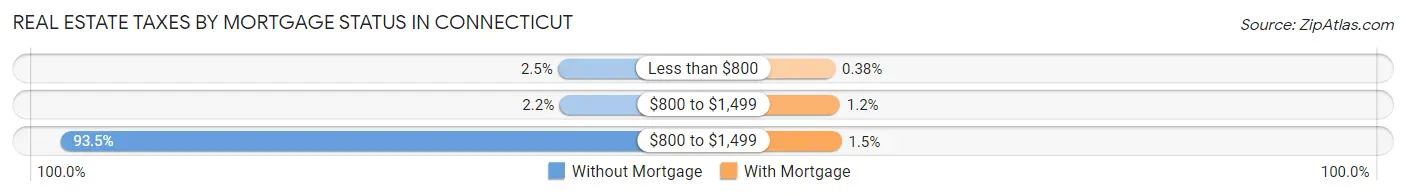
| Property Taxes | Without Mortgage | With Mortgage |
| Less than $800 | 7,807 (2.5%) | 2,320 (0.4%) |
| $800 to $1,499 | 6,941 (2.2%) | 7,686 (1.2%) |
| $800 to $1,499 | 294,057 (93.5%) | 9,541 (1.5%) |
| Total | 314,566 (100.0%) | 618,022 (100.0%) |
Health & Disability in Connecticut
Health Insurance Coverage by Age in Connecticut
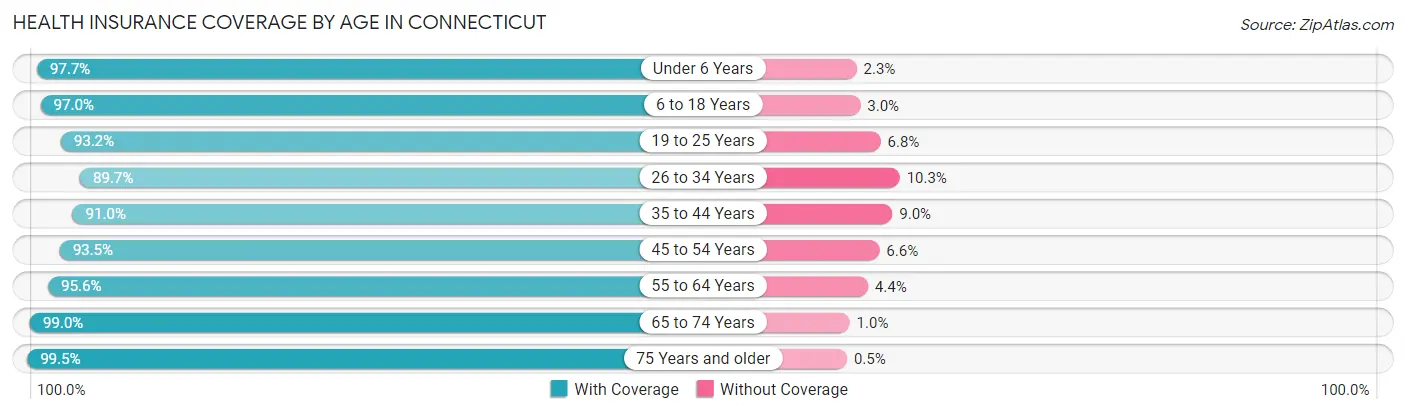
| Age Bracket | With Coverage | Without Coverage |
| Under 6 Years | 215,904 (97.7%) | 5,074 (2.3%) |
| 6 to 18 Years | 556,422 (97.0%) | 17,217 (3.0%) |
| 19 to 25 Years | 310,533 (93.2%) | 22,548 (6.8%) |
| 26 to 34 Years | 357,983 (89.7%) | 41,242 (10.3%) |
| 35 to 44 Years | 400,794 (91.0%) | 39,439 (9.0%) |
| 45 to 54 Years | 441,141 (93.4%) | 30,942 (6.6%) |
| 55 to 64 Years | 495,356 (95.6%) | 22,804 (4.4%) |
| 65 to 74 Years | 353,973 (99.0%) | 3,582 (1.0%) |
| 75 Years and older | 250,798 (99.5%) | 1,264 (0.5%) |
| Total | 3,382,904 (94.8%) | 184,112 (5.2%) |
Health Insurance Coverage by Citizenship Status in Connecticut
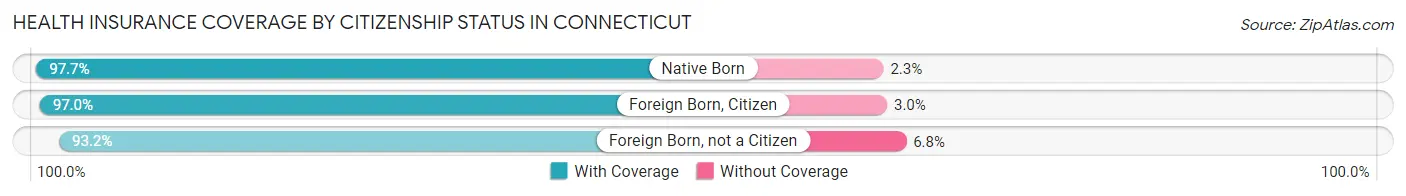
| Citizenship Status | With Coverage | Without Coverage |
| Native Born | 215,904 (97.7%) | 5,074 (2.3%) |
| Foreign Born, Citizen | 556,422 (97.0%) | 17,217 (3.0%) |
| Foreign Born, not a Citizen | 310,533 (93.2%) | 22,548 (6.8%) |
Health Insurance Coverage by Household Income in Connecticut
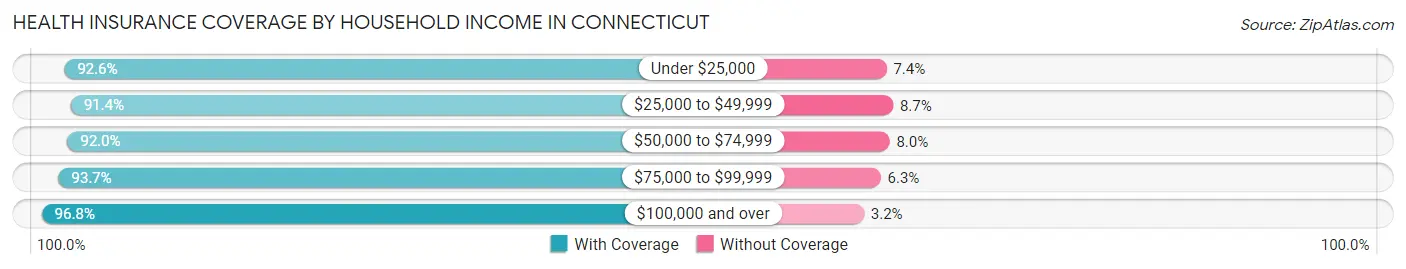
| Household Income | With Coverage | Without Coverage |
| Under $25,000 | 298,956 (92.6%) | 24,005 (7.4%) |
| $25,000 to $49,999 | 378,263 (91.3%) | 35,820 (8.6%) |
| $50,000 to $74,999 | 401,515 (92.0%) | 34,896 (8.0%) |
| $75,000 to $99,999 | 383,163 (93.7%) | 25,909 (6.3%) |
| $100,000 and over | 1,850,402 (96.8%) | 60,900 (3.2%) |
Public vs Private Health Insurance Coverage by Age in Connecticut
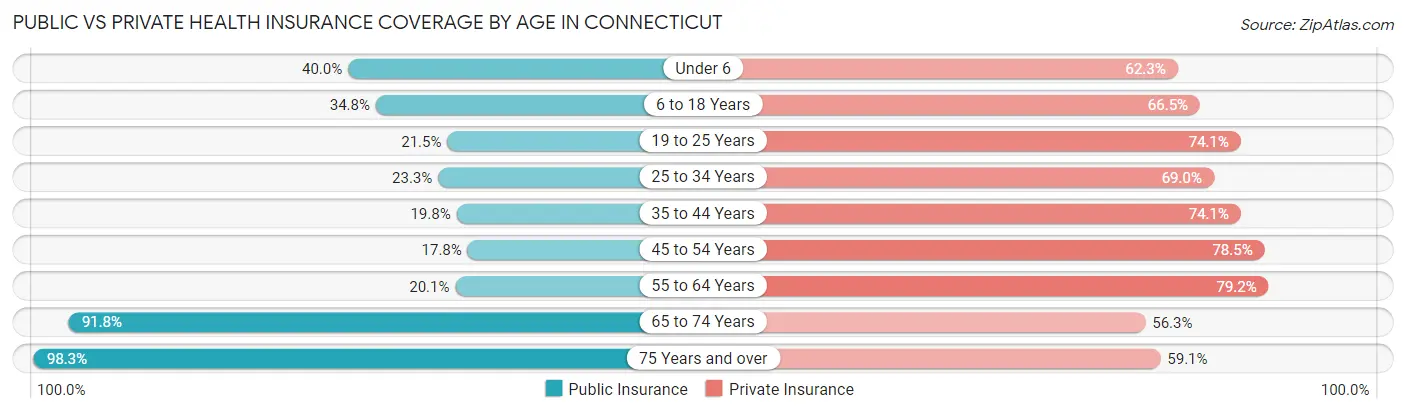
| Age Bracket | Public Insurance | Private Insurance |
| Under 6 | 88,300 (40.0%) | 137,719 (62.3%) |
| 6 to 18 Years | 199,704 (34.8%) | 381,244 (66.5%) |
| 19 to 25 Years | 71,757 (21.5%) | 246,639 (74.1%) |
| 25 to 34 Years | 92,809 (23.3%) | 275,583 (69.0%) |
| 35 to 44 Years | 87,352 (19.8%) | 326,038 (74.1%) |
| 45 to 54 Years | 83,898 (17.8%) | 370,364 (78.4%) |
| 55 to 64 Years | 103,957 (20.1%) | 410,362 (79.2%) |
| 65 to 74 Years | 328,263 (91.8%) | 201,440 (56.3%) |
| 75 Years and over | 247,738 (98.3%) | 149,052 (59.1%) |
| Total | 1,303,778 (36.5%) | 2,498,441 (70.0%) |
Disability Status by Sex by Age in Connecticut
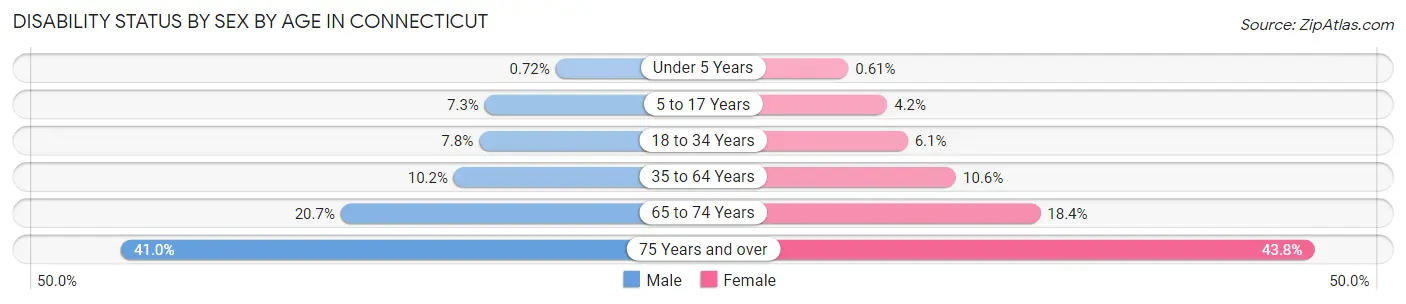
| Age Bracket | Male | Female |
| Under 5 Years | 674 (0.7%) | 547 (0.6%) |
| 5 to 17 Years | 20,821 (7.3%) | 11,592 (4.2%) |
| 18 to 34 Years | 30,798 (7.8%) | 23,931 (6.1%) |
| 35 to 64 Years | 70,945 (10.2%) | 77,763 (10.6%) |
| 65 to 74 Years | 34,660 (20.7%) | 34,981 (18.4%) |
| 75 Years and over | 42,875 (41.0%) | 64,682 (43.8%) |
Disability Class by Sex by Age in Connecticut
Disability Class: Hearing Difficulty
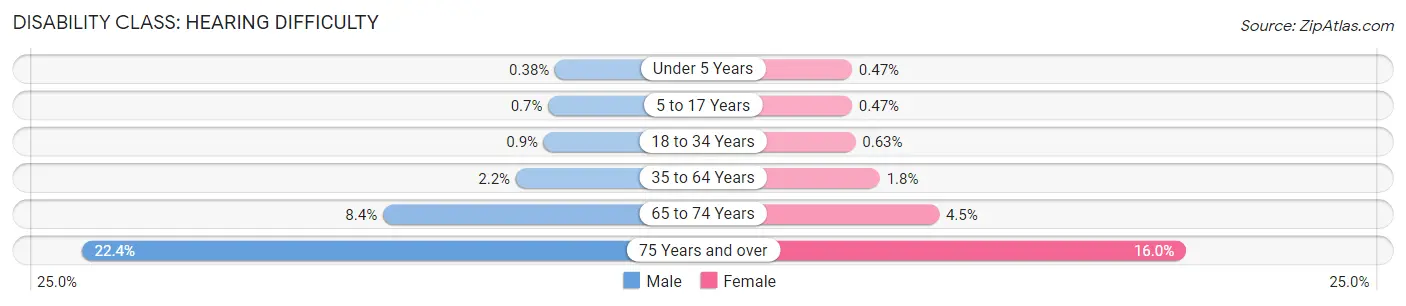
| Age Bracket | Male | Female |
| Under 5 Years | 360 (0.4%) | 423 (0.5%) |
| 5 to 17 Years | 1,995 (0.7%) | 1,281 (0.5%) |
| 18 to 34 Years | 3,556 (0.9%) | 2,446 (0.6%) |
| 35 to 64 Years | 15,378 (2.2%) | 12,927 (1.8%) |
| 65 to 74 Years | 14,042 (8.4%) | 8,566 (4.5%) |
| 75 Years and over | 23,349 (22.4%) | 23,572 (16.0%) |
Disability Class: Vision Difficulty
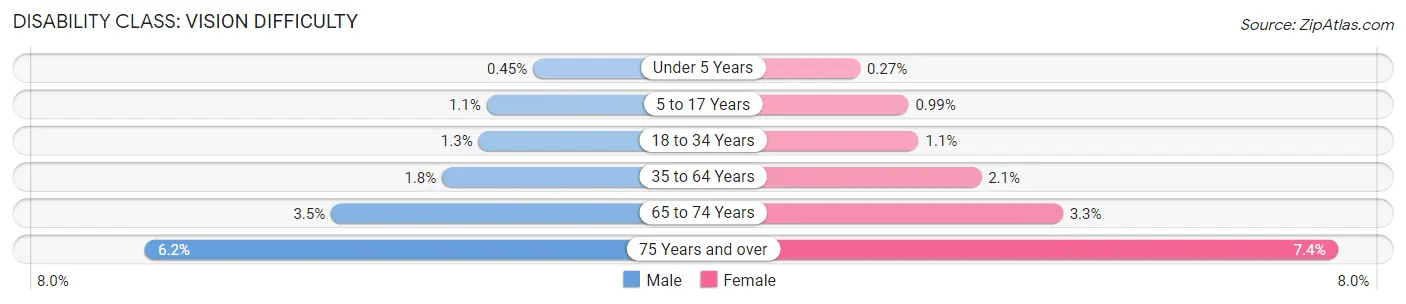
| Age Bracket | Male | Female |
| Under 5 Years | 423 (0.4%) | 240 (0.3%) |
| 5 to 17 Years | 3,241 (1.1%) | 2,719 (1.0%) |
| 18 to 34 Years | 4,964 (1.3%) | 4,474 (1.1%) |
| 35 to 64 Years | 12,544 (1.8%) | 15,165 (2.1%) |
| 65 to 74 Years | 5,795 (3.5%) | 6,232 (3.3%) |
| 75 Years and over | 6,491 (6.2%) | 10,867 (7.4%) |
Disability Class: Cognitive Difficulty
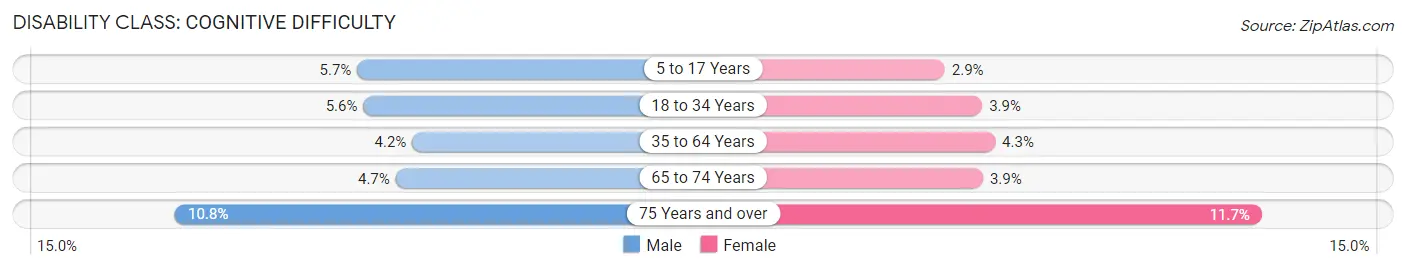
| Age Bracket | Male | Female |
| 5 to 17 Years | 16,368 (5.7%) | 7,870 (2.9%) |
| 18 to 34 Years | 21,917 (5.6%) | 15,306 (3.9%) |
| 35 to 64 Years | 29,409 (4.2%) | 31,296 (4.3%) |
| 65 to 74 Years | 7,829 (4.7%) | 7,463 (3.9%) |
| 75 Years and over | 11,289 (10.8%) | 17,254 (11.7%) |
Disability Class: Ambulatory Difficulty
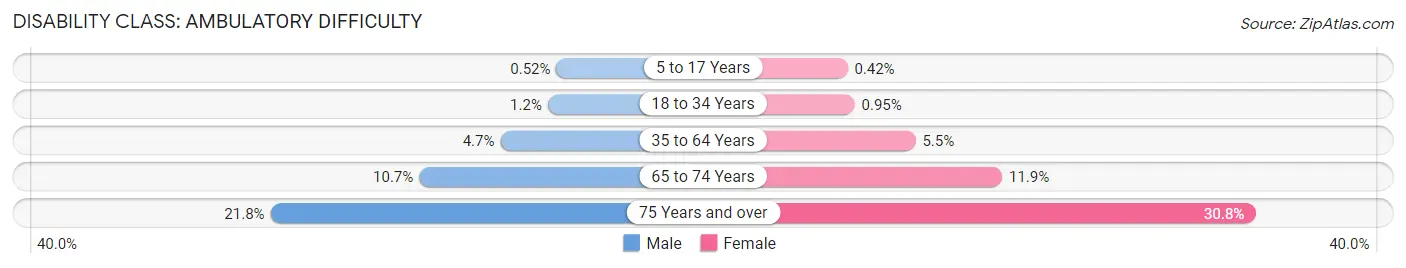
| Age Bracket | Male | Female |
| 5 to 17 Years | 1,484 (0.5%) | 1,159 (0.4%) |
| 18 to 34 Years | 4,558 (1.2%) | 3,716 (0.9%) |
| 35 to 64 Years | 32,673 (4.7%) | 40,089 (5.5%) |
| 65 to 74 Years | 17,967 (10.7%) | 22,592 (11.9%) |
| 75 Years and over | 22,727 (21.7%) | 45,399 (30.8%) |
Disability Class: Self-Care Difficulty
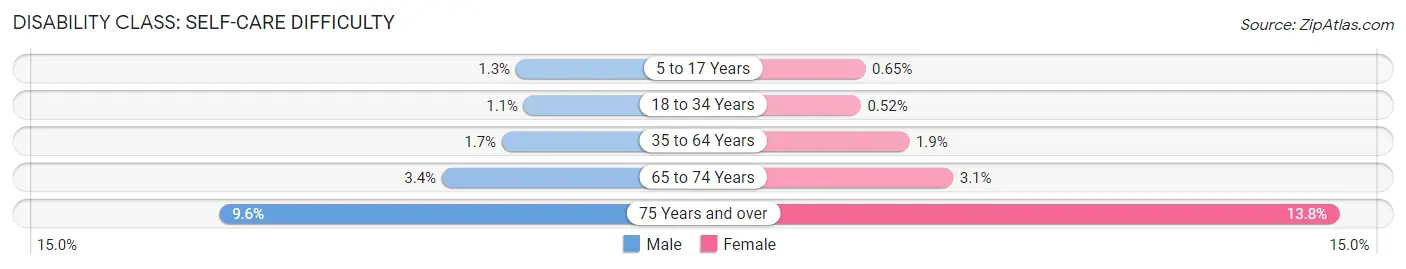
| Age Bracket | Male | Female |
| 5 to 17 Years | 3,772 (1.3%) | 1,780 (0.6%) |
| 18 to 34 Years | 4,344 (1.1%) | 2,033 (0.5%) |
| 35 to 64 Years | 11,897 (1.7%) | 13,711 (1.9%) |
| 65 to 74 Years | 5,663 (3.4%) | 5,857 (3.1%) |
| 75 Years and over | 10,010 (9.6%) | 20,427 (13.8%) |
Technology Access in Connecticut
Computing Device Access in Connecticut
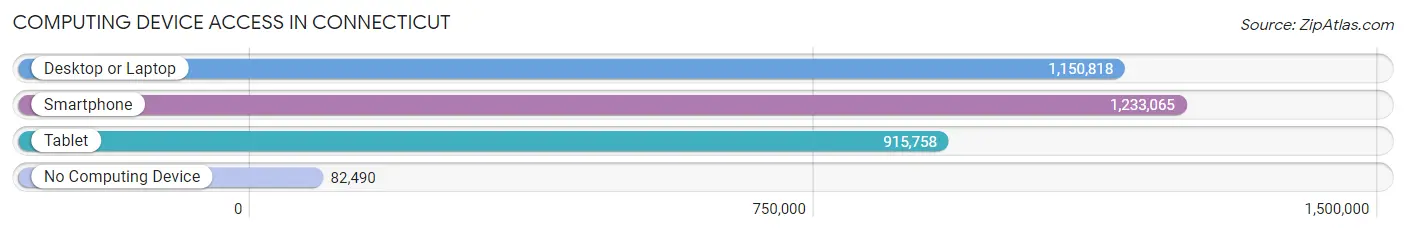
| Device Type | # Households | % Households |
| Desktop or Laptop | 1,150,818 | 81.6% |
| Smartphone | 1,233,065 | 87.5% |
| Tablet | 915,758 | 65.0% |
| No Computing Device | 82,490 | 5.9% |
| Total | 1,409,807 | 100.0% |
Internet Access in Connecticut
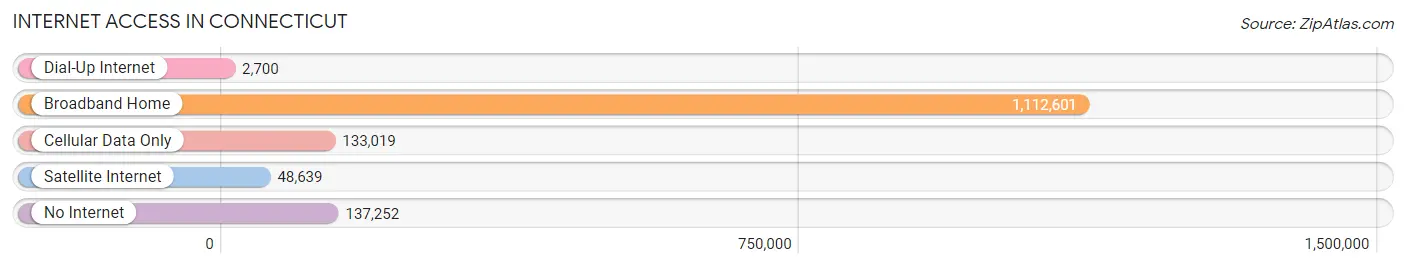
| Internet Type | # Households | % Households |
| Dial-Up Internet | 2,700 | 0.2% |
| Broadband Home | 1,112,601 | 78.9% |
| Cellular Data Only | 133,019 | 9.4% |
| Satellite Internet | 48,639 | 3.5% |
| No Internet | 137,252 | 9.7% |
| Total | 1,409,807 | 100.0% |
Connecticut Summary
Connecticut is a state located in the northeastern region of the United States. It is bordered by Rhode Island to the east, Massachusetts to the north, New York to the west, and Long Island Sound to the south. Connecticut is the third smallest state by area, and the fourth most densely populated state in the country.
History
The area that is now Connecticut was originally inhabited by Native American tribes, including the Mohegan, Pequot, and Niantic. The first European settlers arrived in the area in the 1630s, and the first permanent settlement was established in 1633. The first English settlers were Puritans from Massachusetts, and they established the Connecticut Colony in 1636. The colony was one of the original 13 colonies that formed the United States.
In 1776, Connecticut was one of the first states to ratify the United States Constitution. During the American Revolution, Connecticut was a major supplier of arms and ammunition to the Continental Army. After the war, Connecticut became an important center of manufacturing and trade.
Geography
Connecticut is located in the northeastern region of the United States. It is bordered by Rhode Island to the east, Massachusetts to the north, New York to the west, and Long Island Sound to the south. Connecticut is the third smallest state by area, and the fourth most densely populated state in the country.
The state is divided into five distinct geographic regions: the Connecticut River Valley, the Eastern Highlands, the Western Uplands, the Central Lowlands, and the Coastal Lowlands. The Connecticut River Valley is the most populous region of the state, and is home to the state capital, Hartford. The Eastern Highlands are located in the northeast corner of the state, and are home to the highest point in the state, Mount Frissell. The Western Uplands are located in the northwest corner of the state, and are home to the Taconic Mountains. The Central Lowlands are located in the center of the state, and are home to the Connecticut River. The Coastal Lowlands are located in the southwest corner of the state, and are home to the Long Island Sound.
Economy
Connecticut has a diverse economy that is driven by the service sector, manufacturing, and finance. The state is home to several major corporations, including United Technologies, Aetna, and Cigna. The state is also home to several major universities, including Yale University, the University of Connecticut, and Wesleyan University.
The state’s largest industries are finance, insurance, and real estate. The state is also home to several major defense contractors, including Pratt & Whitney and Sikorsky Aircraft. The state’s agricultural sector is also important, and the state is a major producer of dairy products, eggs, and poultry.
Demographics
As of the 2010 census, the population of Connecticut was 3,574,097. The state is home to a diverse population, with the largest ethnic groups being White (80.2%), Hispanic or Latino (11.7%), and Black or African American (9.2%). The state is also home to a large immigrant population, with the largest groups being from Mexico, India, and China.
The median household income in Connecticut is $71,346, and the median home value is $267,400. The state has a high cost of living, and the poverty rate is 8.9%. The state’s largest cities are Bridgeport, New Haven, Hartford, and Stamford.
Common Questions
When was Connecticut Incorporated?
Connecticut was Incorporated into the Union on Jan 9, 1788.
What is the Total Area of Connecticut?
Total Area of Connecticut is 5,544 Square Miles.
What is the Total Land Area of Connecticut?
Total Land Area of Connecticut is 4,840 Square Miles.
What is the Total Water Area of Connecticut?
Total Water Area of Connecticut is 703 Square Miles.
What is the Average Elevation in Connecticut?
Average Elevation in Connecticut is 500 Feet.
What is the Highest Elevation in Connecticut?
Highest Elevation in Connecticut is 2,380 Feet.
What is the Lowest Elevation in Connecticut?
Lowest Elevation in Connecticut is 0 Feet.
What is the Population Density in Connecticut?
Population Density in Connecticut is 746.1 People per Square Mile.
What is Per Capita Income in Connecticut?
Per Capita income in Connecticut is $52,034.
What is the Median Family Income in Connecticut?
Median Family Income in Connecticut is $115,539.
What is the Median Household income in Connecticut?
Median Household Income in Connecticut is $90,213.
What is Income or Wage Gap in Connecticut?
Income or Wage Gap in Connecticut is 27.8%.
Women in Connecticut earn 72.2 cents for every dollar earned by a man.
What is Family Income Deficit in Connecticut?
Family Income Deficit in Connecticut is $10,900.
Families that are below poverty line in Connecticut earn $10,900 less on average than the poverty threshold level.
What is Inequality or Gini Index in Connecticut?
Inequality or Gini Index in Connecticut is 0.50.
What is the Total Population of Connecticut?
Total Population of Connecticut is 3,611,317.
What is the Total Male Population of Connecticut?
Total Male Population of Connecticut is 1,769,196.
What is the Total Female Population of Connecticut?
Total Female Population of Connecticut is 1,842,121.
What is the Ratio of Males per 100 Females in Connecticut?
There are 96.04 Males per 100 Females in Connecticut.
What is the Ratio of Females per 100 Males in Connecticut?
There are 104.12 Females per 100 Males in Connecticut.
What is the Median Population Age in Connecticut?
Median Population Age in Connecticut is 40.9 Years.
What is the Average Family Size in Connecticut
Average Family Size in Connecticut is 3.1 People.
What is the Average Household Size in Connecticut
Average Household Size in Connecticut is 2.5 People.
How Large is the Labor Force in Connecticut?
There are 1,954,584 People in the Labor Forcein in Connecticut.
What is the Percentage of People in the Labor Force in Connecticut?
66.0% of People are in the Labor Force in Connecticut.
What is the Unemployment Rate in Connecticut?
Unemployment Rate in Connecticut is 5.9%.