York County, SC Map & Demographics
York County Overview
$41,486
PER CAPITA INCOME
$102,752
AVG FAMILY INCOME
$80,158
AVG HOUSEHOLD INCOME
30.3%
WAGE / INCOME GAP [ % ]
69.7¢/ $1
WAGE / INCOME GAP [ $ ]
$10,592
FAMILY INCOME DEFICIT
0.44
INEQUALITY / GINI INDEX
282,987
TOTAL POPULATION
137,720
MALE POPULATION
145,267
FEMALE POPULATION
94.80
MALES / 100 FEMALES
105.48
FEMALES / 100 MALES
39.2
MEDIAN AGE
3.0
AVG FAMILY SIZE
2.6
AVG HOUSEHOLD SIZE
149,336
LABOR FORCE [ PEOPLE ]
66.9%
PERCENT IN LABOR FORCE
4.7%
UNEMPLOYMENT RATE
Income in York County
Income Overview in York County
Per Capita Income in York County is $41,486, while median incomes of families and households are $102,752 and $80,158 respectively.
| Characteristic | Number | Measure |
| Per Capita Income | 282,987 | $41,486 |
| Median Family Income | 76,392 | $102,752 |
| Mean Family Income | 76,392 | $125,263 |
| Median Household Income | 109,013 | $80,158 |
| Mean Household Income | 109,013 | $105,610 |
| Income Deficit | 76,392 | $10,592 |
| Wage / Income Gap (%) | 282,987 | 30.33% |
| Wage / Income Gap ($) | 282,987 | 69.67¢ per $1 |
| Gini / Inequality Index | 282,987 | 0.44 |
Earnings by Sex in York County
Average Earnings in York County are $44,778, $53,402 for men and $37,206 for women, a difference of 30.3%.
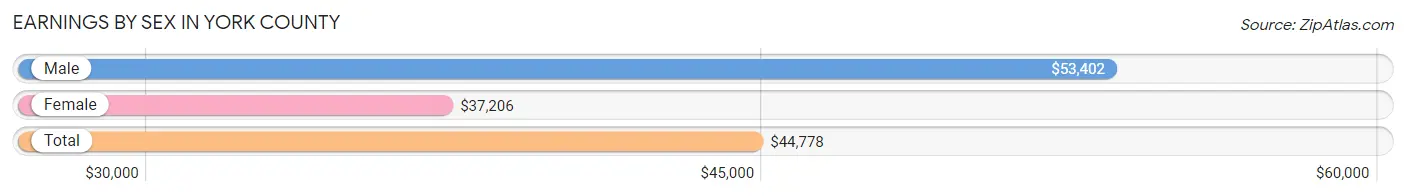
| Sex | Number | Average Earnings |
| Male | 81,256 (52.0%) | $53,402 |
| Female | 74,892 (48.0%) | $37,206 |
| Total | 156,148 (100.0%) | $44,778 |
Earnings by Sex by Income Bracket in York County
The most common earnings brackets in York County are $100,000+ for men (19,220 | 23.6%) and $100,000+ for women (6,957 | 9.3%).
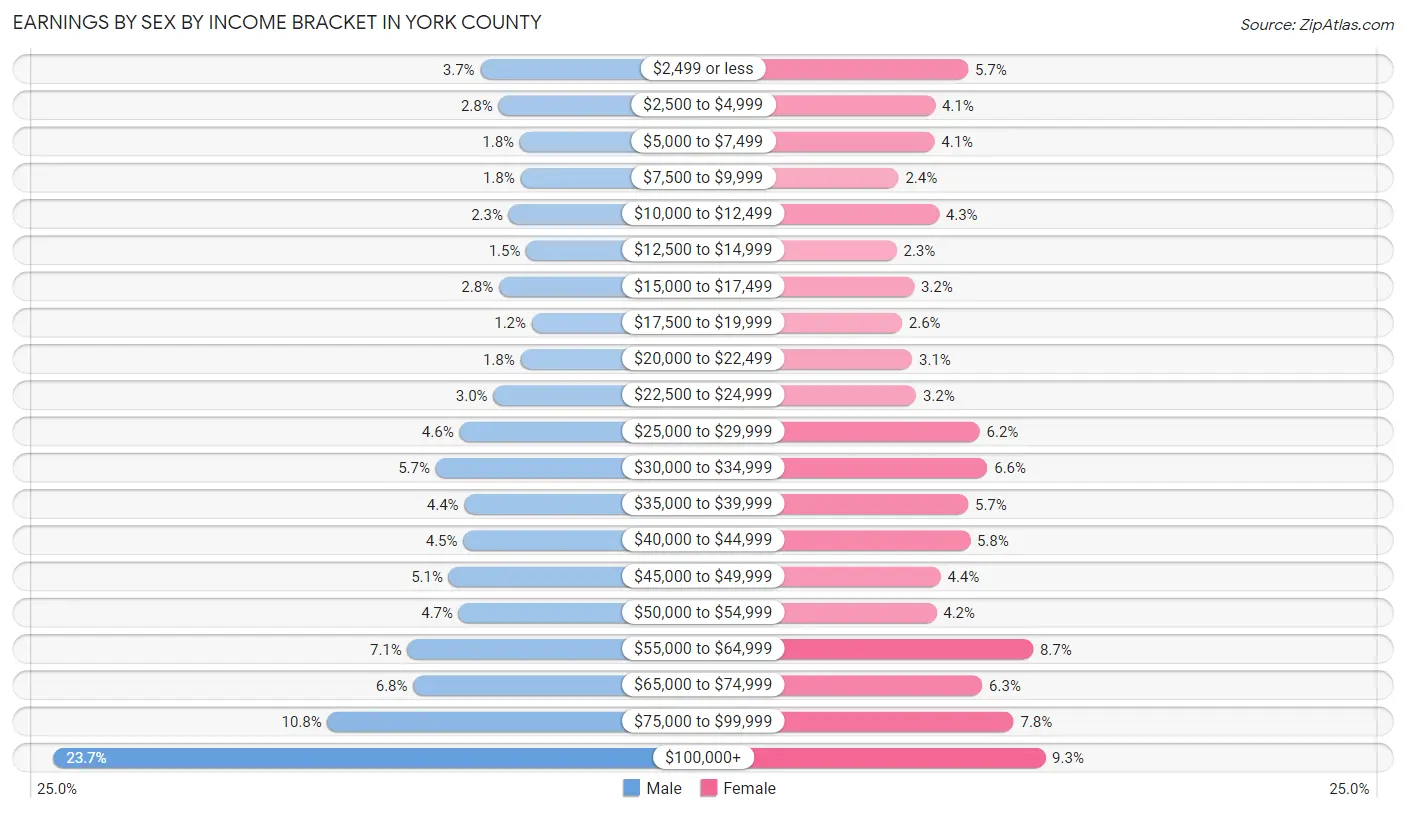
| Income | Male | Female |
| $2,499 or less | 2,964 (3.6%) | 4,254 (5.7%) |
| $2,500 to $4,999 | 2,276 (2.8%) | 3,095 (4.1%) |
| $5,000 to $7,499 | 1,462 (1.8%) | 3,074 (4.1%) |
| $7,500 to $9,999 | 1,442 (1.8%) | 1,809 (2.4%) |
| $10,000 to $12,499 | 1,884 (2.3%) | 3,229 (4.3%) |
| $12,500 to $14,999 | 1,216 (1.5%) | 1,744 (2.3%) |
| $15,000 to $17,499 | 2,260 (2.8%) | 2,359 (3.2%) |
| $17,500 to $19,999 | 1,005 (1.2%) | 1,929 (2.6%) |
| $20,000 to $22,499 | 1,437 (1.8%) | 2,294 (3.1%) |
| $22,500 to $24,999 | 2,474 (3.0%) | 2,423 (3.2%) |
| $25,000 to $29,999 | 3,760 (4.6%) | 4,661 (6.2%) |
| $30,000 to $34,999 | 4,665 (5.7%) | 4,925 (6.6%) |
| $35,000 to $39,999 | 3,577 (4.4%) | 4,255 (5.7%) |
| $40,000 to $44,999 | 3,617 (4.4%) | 4,324 (5.8%) |
| $45,000 to $49,999 | 4,171 (5.1%) | 3,290 (4.4%) |
| $50,000 to $54,999 | 3,786 (4.7%) | 3,141 (4.2%) |
| $55,000 to $64,999 | 5,737 (7.1%) | 6,533 (8.7%) |
| $65,000 to $74,999 | 5,516 (6.8%) | 4,747 (6.3%) |
| $75,000 to $99,999 | 8,787 (10.8%) | 5,849 (7.8%) |
| $100,000+ | 19,220 (23.6%) | 6,957 (9.3%) |
| Total | 81,256 (100.0%) | 74,892 (100.0%) |
Earnings by Sex by Educational Attainment in York County
Average earnings in York County are $61,418 for men and $42,486 for women, a difference of 30.8%. Men with an educational attainment of graduate degree enjoy the highest average annual earnings of $116,364, while those with less than high school education earn the least with $37,433. Women with an educational attainment of graduate degree earn the most with the average annual earnings of $64,384, while those with less than high school education have the smallest earnings of $21,715.
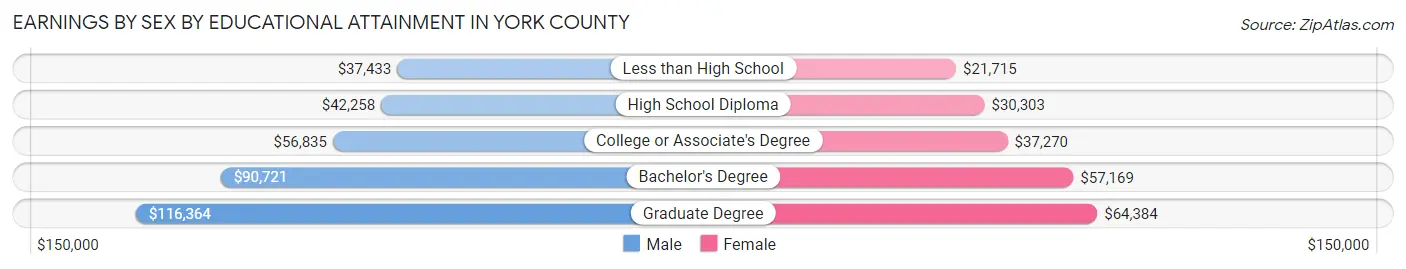
| Educational Attainment | Male Income | Female Income |
| Less than High School | $37,433 | $21,715 |
| High School Diploma | $42,258 | $30,303 |
| College or Associate's Degree | $56,835 | $37,270 |
| Bachelor's Degree | $90,721 | $57,169 |
| Graduate Degree | $116,364 | $64,384 |
| Total | $61,418 | $42,486 |
Family Income in York County
Family Income Brackets in York County
According to the York County family income data, there are 18,258 families falling into the $100,000 to $149,999 income range, which is the most common income bracket and makes up 23.9% of all families. Conversely, the $10,000 to $14,999 income bracket is the least frequent group with only 840 families (1.1%) belonging to this category.
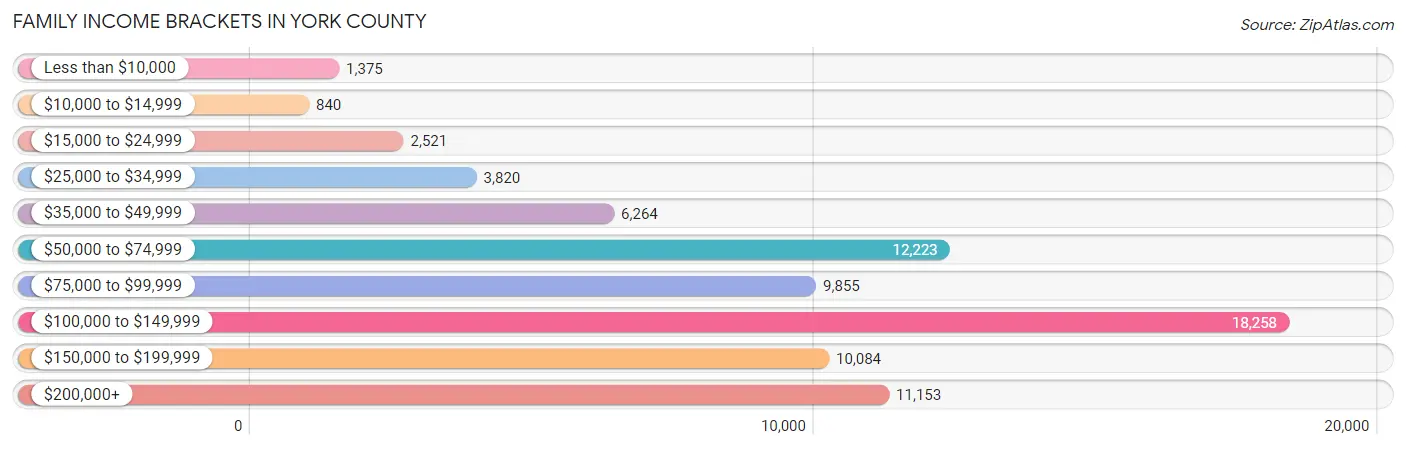
| Income Bracket | # Families | % Families |
| Less than $10,000 | 1,375 | 1.8% |
| $10,000 to $14,999 | 840 | 1.1% |
| $15,000 to $24,999 | 2,521 | 3.3% |
| $25,000 to $34,999 | 3,820 | 5.0% |
| $35,000 to $49,999 | 6,264 | 8.2% |
| $50,000 to $74,999 | 12,223 | 16.0% |
| $75,000 to $99,999 | 9,855 | 12.9% |
| $100,000 to $149,999 | 18,258 | 23.9% |
| $150,000 to $199,999 | 10,084 | 13.2% |
| $200,000+ | 11,153 | 14.6% |
Family Income by Famaliy Size in York County
6-person families (1,614 | 2.1%) account for the highest median family income in York County with $132,877 per family, while 2-person families (35,612 | 46.6%) have the highest median income of $42,816 per family member.
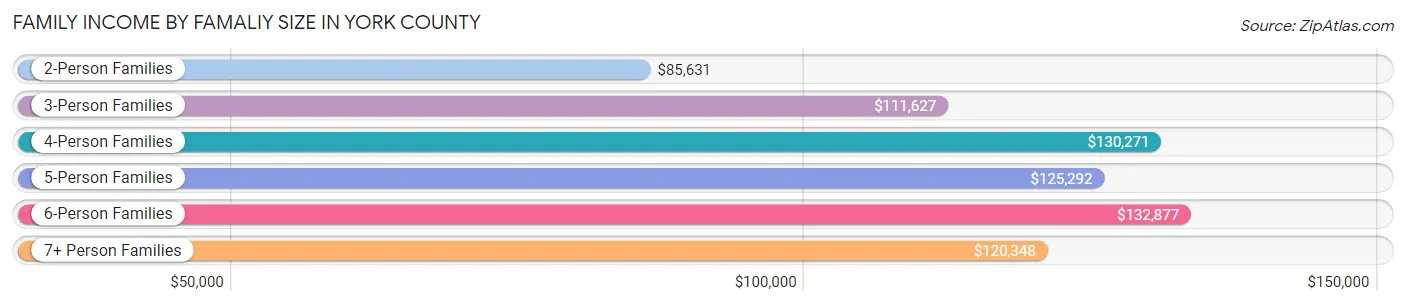
| Income Bracket | # Families | Median Income |
| 2-Person Families | 35,612 (46.6%) | $85,631 |
| 3-Person Families | 16,580 (21.7%) | $111,627 |
| 4-Person Families | 16,048 (21.0%) | $130,271 |
| 5-Person Families | 5,897 (7.7%) | $125,292 |
| 6-Person Families | 1,614 (2.1%) | $132,877 |
| 7+ Person Families | 641 (0.8%) | $120,348 |
| Total | 76,392 (100.0%) | $102,752 |
Family Income by Number of Earners in York County
The median family income in York County is $102,752, with families comprising 3+ earners (8,828) having the highest median family income of $151,534, while families with no earners (9,879) have the lowest median family income of $61,524, accounting for 11.6% and 12.9% of families, respectively.
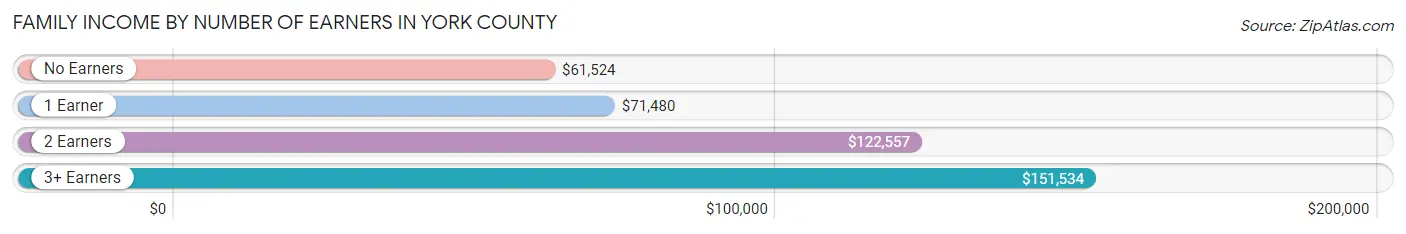
| Number of Earners | # Families | Median Income |
| No Earners | 9,879 (12.9%) | $61,524 |
| 1 Earner | 24,032 (31.5%) | $71,480 |
| 2 Earners | 33,653 (44.1%) | $122,557 |
| 3+ Earners | 8,828 (11.6%) | $151,534 |
| Total | 76,392 (100.0%) | $102,752 |
Household Income in York County
Household Income Brackets in York County
With 20,930 households falling in the category, the $100,000 to $149,999 income range is the most frequent in York County, accounting for 19.2% of all households. In contrast, only 3,052 households (2.8%) fall into the $10,000 to $14,999 income bracket, making it the least populous group.
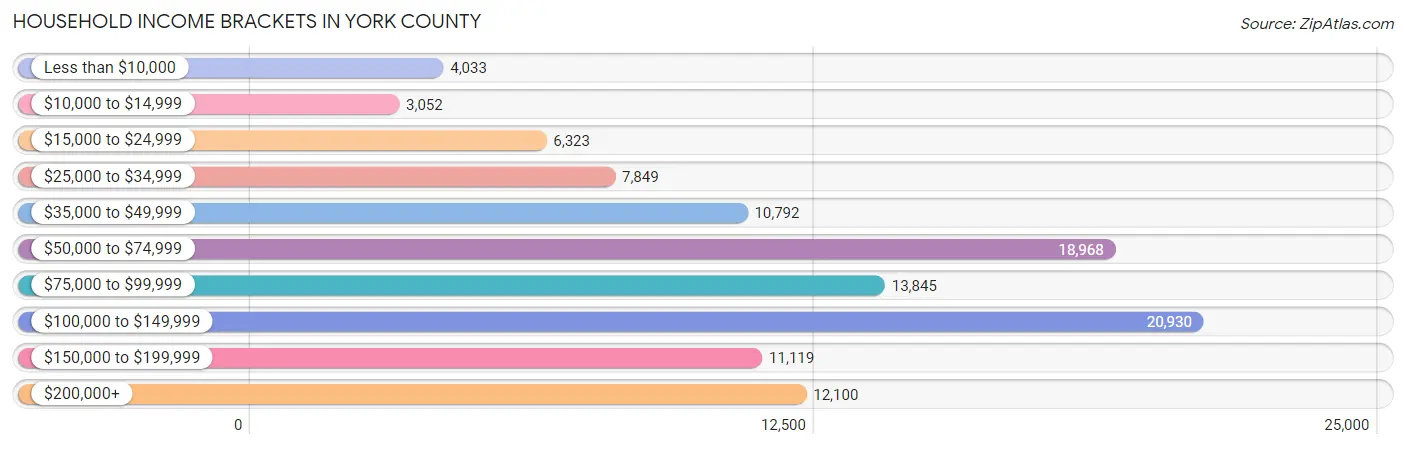
| Income Bracket | # Households | % Households |
| Less than $10,000 | 4,033 | 3.7% |
| $10,000 to $14,999 | 3,052 | 2.8% |
| $15,000 to $24,999 | 6,323 | 5.8% |
| $25,000 to $34,999 | 7,849 | 7.2% |
| $35,000 to $49,999 | 10,792 | 9.9% |
| $50,000 to $74,999 | 18,968 | 17.4% |
| $75,000 to $99,999 | 13,845 | 12.7% |
| $100,000 to $149,999 | 20,930 | 19.2% |
| $150,000 to $199,999 | 11,119 | 10.2% |
| $200,000+ | 12,100 | 11.1% |
Household Income by Householder Age in York County
The median household income in York County is $80,158, with the highest median household income of $93,476 found in the 45 to 64 years age bracket for the primary householder. A total of 42,985 households (39.4%) fall into this category. Meanwhile, the 15 to 24 years age bracket for the primary householder has the lowest median household income of $47,287, with 3,513 households (3.2%) in this group.
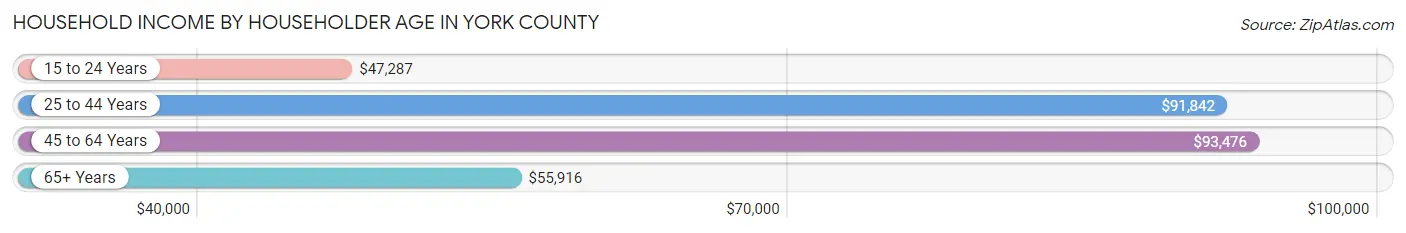
| Income Bracket | # Households | Median Income |
| 15 to 24 Years | 3,513 (3.2%) | $47,287 |
| 25 to 44 Years | 36,742 (33.7%) | $91,842 |
| 45 to 64 Years | 42,985 (39.4%) | $93,476 |
| 65+ Years | 25,773 (23.6%) | $55,916 |
| Total | 109,013 (100.0%) | $80,158 |
Poverty in York County
Income Below Poverty by Sex and Age in York County
With 7.0% poverty level for males and 9.8% for females among the residents of York County, 5 year old males and 18 to 24 year old females are the most vulnerable to poverty, with 300 males (19.9%) and 2,268 females (21.2%) in their respective age groups living below the poverty level.
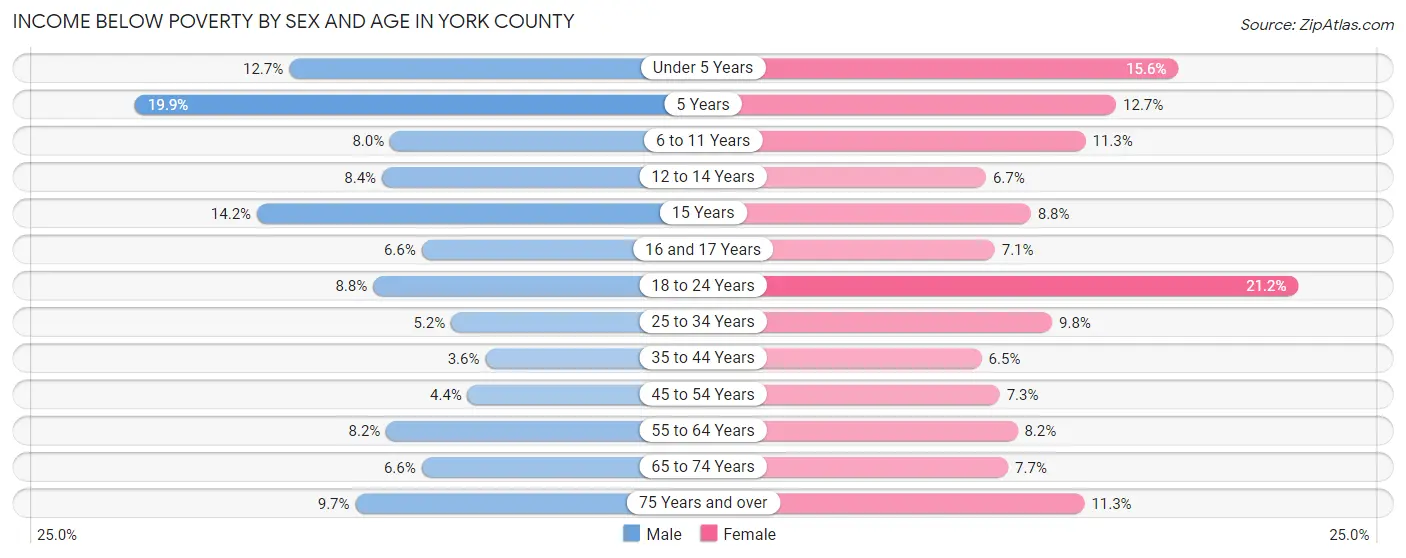
| Age Bracket | Male | Female |
| Under 5 Years | 1,012 (12.7%) | 1,190 (15.6%) |
| 5 Years | 300 (19.9%) | 258 (12.7%) |
| 6 to 11 Years | 977 (8.0%) | 1,273 (11.3%) |
| 12 to 14 Years | 513 (8.4%) | 383 (6.7%) |
| 15 Years | 284 (14.2%) | 203 (8.8%) |
| 16 and 17 Years | 266 (6.6%) | 248 (7.1%) |
| 18 to 24 Years | 962 (8.8%) | 2,268 (21.2%) |
| 25 to 34 Years | 852 (5.2%) | 1,731 (9.8%) |
| 35 to 44 Years | 709 (3.6%) | 1,339 (6.5%) |
| 45 to 54 Years | 866 (4.4%) | 1,462 (7.3%) |
| 55 to 64 Years | 1,429 (8.2%) | 1,489 (8.2%) |
| 65 to 74 Years | 788 (6.6%) | 1,091 (7.7%) |
| 75 Years and over | 615 (9.7%) | 966 (11.3%) |
| Total | 9,573 (7.0%) | 13,901 (9.8%) |
Income Above Poverty by Sex and Age in York County
According to the poverty statistics in York County, males aged 35 to 44 years and females aged 35 to 44 years are the age groups that are most secure financially, with 96.4% of males and 93.5% of females in these age groups living above the poverty line.
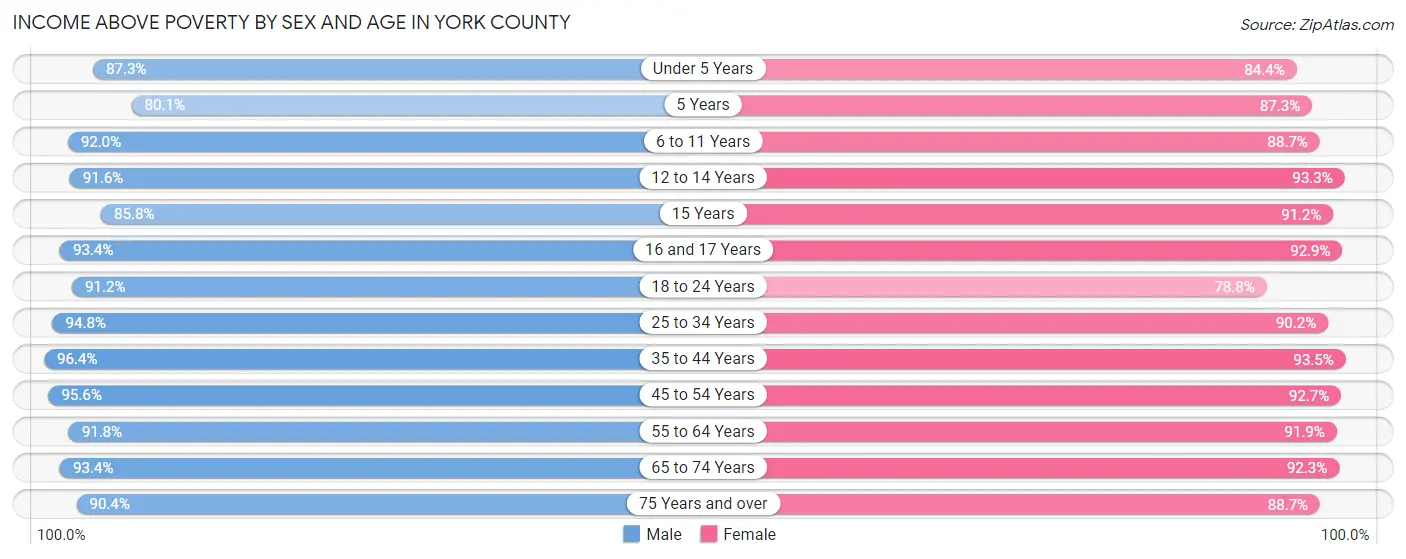
| Age Bracket | Male | Female |
| Under 5 Years | 6,938 (87.3%) | 6,433 (84.4%) |
| 5 Years | 1,209 (80.1%) | 1,768 (87.3%) |
| 6 to 11 Years | 11,178 (92.0%) | 9,979 (88.7%) |
| 12 to 14 Years | 5,579 (91.6%) | 5,343 (93.3%) |
| 15 Years | 1,713 (85.8%) | 2,112 (91.2%) |
| 16 and 17 Years | 3,779 (93.4%) | 3,244 (92.9%) |
| 18 to 24 Years | 9,930 (91.2%) | 8,438 (78.8%) |
| 25 to 34 Years | 15,492 (94.8%) | 16,002 (90.2%) |
| 35 to 44 Years | 18,879 (96.4%) | 19,280 (93.5%) |
| 45 to 54 Years | 18,657 (95.6%) | 18,472 (92.7%) |
| 55 to 64 Years | 15,962 (91.8%) | 16,787 (91.8%) |
| 65 to 74 Years | 11,182 (93.4%) | 13,049 (92.3%) |
| 75 Years and over | 5,757 (90.3%) | 7,610 (88.7%) |
| Total | 126,255 (92.9%) | 128,517 (90.2%) |
Income Below Poverty Among Married-Couple Families in York County
The poverty statistics for married-couple families in York County show that 2.1% or 1,190 of the total 57,527 families live below the poverty line. Families with 3 or 4 children have the highest poverty rate of 3.4%, comprising of 147 families. On the other hand, families with 5 or more children have the lowest poverty rate of 0.0%, which includes 0 families.
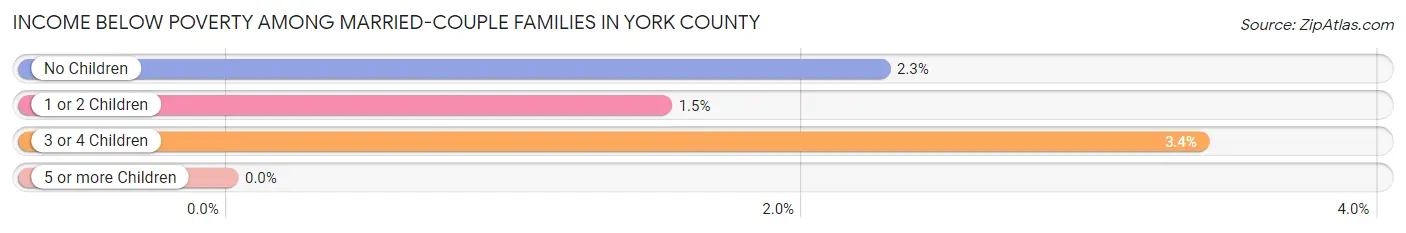
| Children | Above Poverty | Below Poverty |
| No Children | 31,063 (97.7%) | 723 (2.3%) |
| 1 or 2 Children | 20,819 (98.5%) | 320 (1.5%) |
| 3 or 4 Children | 4,201 (96.6%) | 147 (3.4%) |
| 5 or more Children | 254 (100.0%) | 0 (0.0%) |
| Total | 56,337 (97.9%) | 1,190 (2.1%) |
Income Below Poverty Among Single-Parent Households in York County
According to the poverty data in York County, 11.6% or 588 single-father households and 17.0% or 2,352 single-mother households are living below the poverty line. Among single-father households, those with 5 or more children have the highest poverty rate, with 4 households (25.0%) experiencing poverty. Likewise, among single-mother households, those with 5 or more children have the highest poverty rate, with 76 households (71.7%) falling below the poverty line.
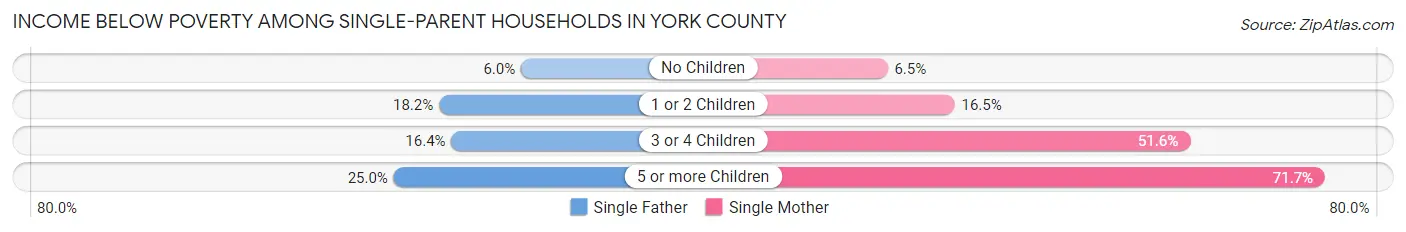
| Children | Single Father | Single Mother |
| No Children | 162 (6.0%) | 312 (6.5%) |
| 1 or 2 Children | 361 (18.2%) | 1,243 (16.5%) |
| 3 or 4 Children | 61 (16.4%) | 721 (51.6%) |
| 5 or more Children | 4 (25.0%) | 76 (71.7%) |
| Total | 588 (11.6%) | 2,352 (17.0%) |
Income Below Poverty Among Married-Couple vs Single-Parent Households in York County
The poverty data for York County shows that 1,190 of the married-couple family households (2.1%) and 2,940 of the single-parent households (15.6%) are living below the poverty level. Within the married-couple family households, those with 3 or 4 children have the highest poverty rate, with 147 households (3.4%) falling below the poverty line. Among the single-parent households, those with 5 or more children have the highest poverty rate, with 80 household (65.6%) living below poverty.
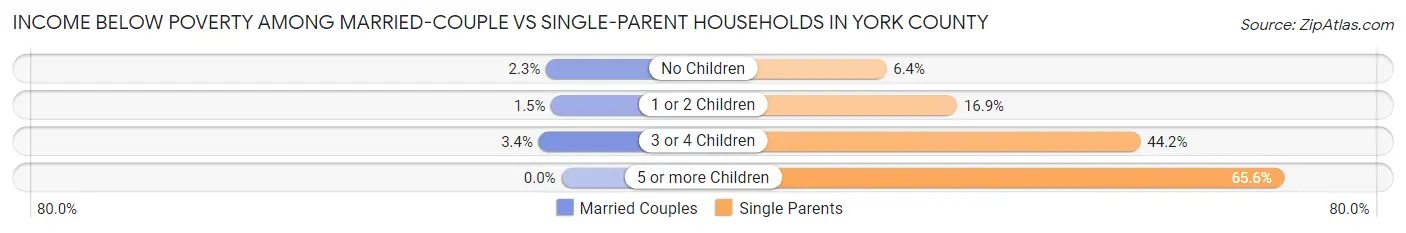
| Children | Married-Couple Families | Single-Parent Households |
| No Children | 723 (2.3%) | 474 (6.4%) |
| 1 or 2 Children | 320 (1.5%) | 1,604 (16.9%) |
| 3 or 4 Children | 147 (3.4%) | 782 (44.2%) |
| 5 or more Children | 0 (0.0%) | 80 (65.6%) |
| Total | 1,190 (2.1%) | 2,940 (15.6%) |
Race in York County
The most populous races in York County are White / Caucasian (200,943 | 71.0%), Black / African American (53,485 | 18.9%), and Hispanic or Latino (17,821 | 6.3%).
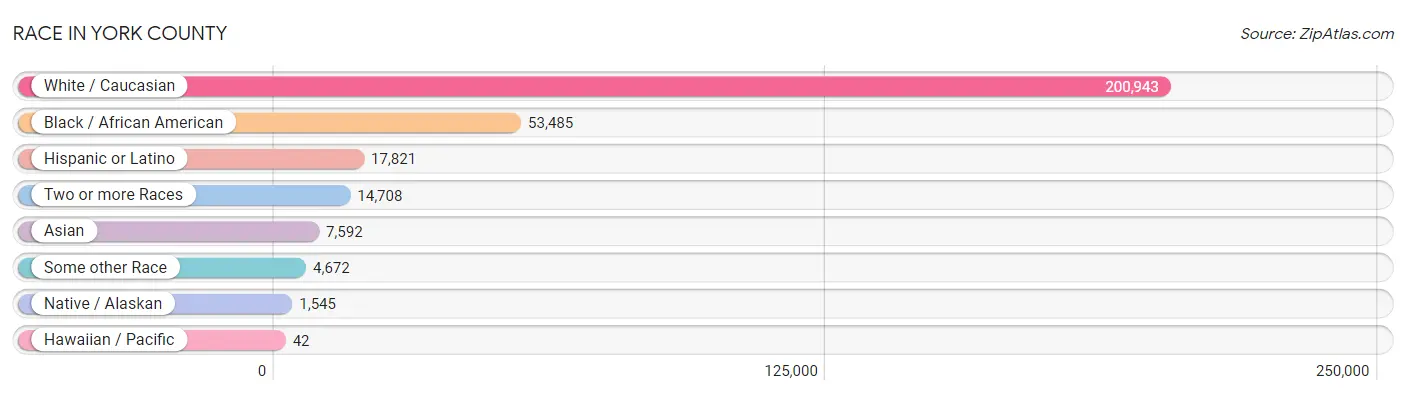
| Race | # Population | % Population |
| Asian | 7,592 | 2.7% |
| Black / African American | 53,485 | 18.9% |
| Hawaiian / Pacific | 42 | 0.0% |
| Hispanic or Latino | 17,821 | 6.3% |
| Native / Alaskan | 1,545 | 0.5% |
| White / Caucasian | 200,943 | 71.0% |
| Two or more Races | 14,708 | 5.2% |
| Some other Race | 4,672 | 1.7% |
| Total | 282,987 | 100.0% |
Ancestry in York County
The most populous ancestries reported in York County are German (34,468 | 12.2%), American (32,970 | 11.7%), English (31,445 | 11.1%), Irish (31,441 | 11.1%), and Italian (13,044 | 4.6%), together accounting for 50.7% of all York County residents.
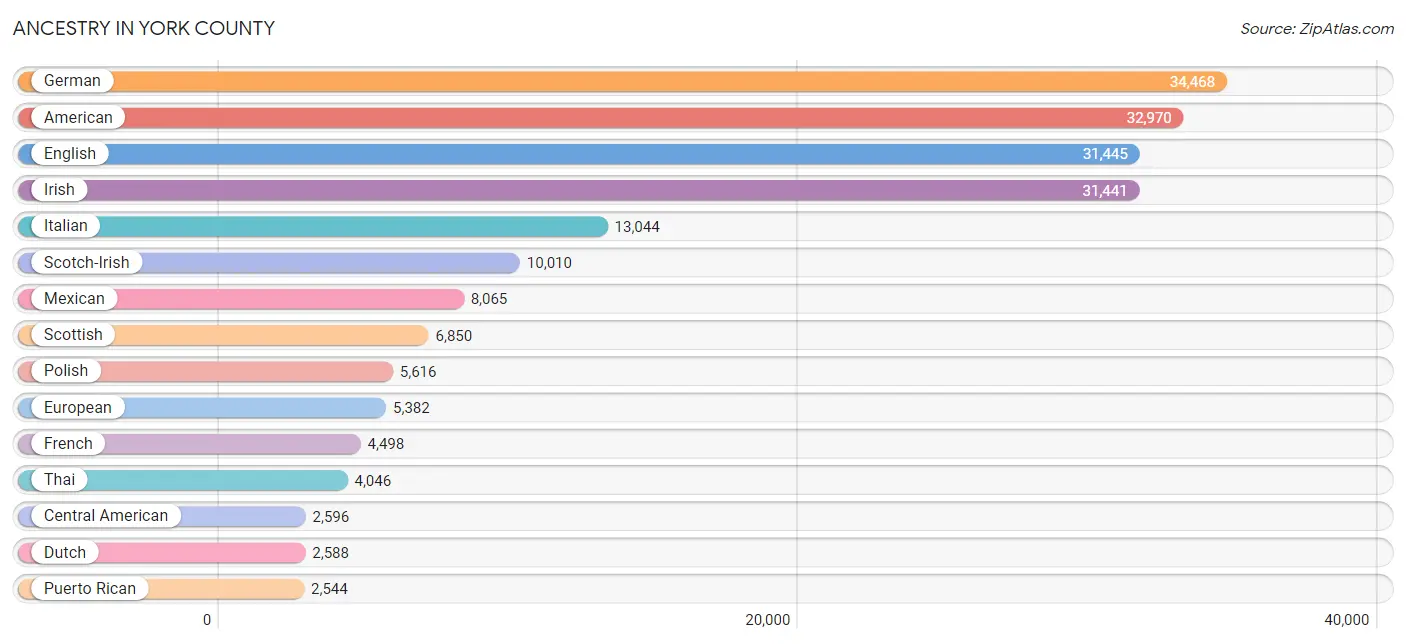
| Ancestry | # Population | % Population |
| African | 1,118 | 0.4% |
| Albanian | 78 | 0.0% |
| Aleut | 18 | 0.0% |
| American | 32,970 | 11.7% |
| Apache | 12 | 0.0% |
| Arab | 771 | 0.3% |
| Argentinean | 112 | 0.0% |
| Armenian | 38 | 0.0% |
| Assyrian / Chaldean / Syriac | 12 | 0.0% |
| Australian | 70 | 0.0% |
| Austrian | 377 | 0.1% |
| Bahamian | 21 | 0.0% |
| Bangladeshi | 109 | 0.0% |
| Basque | 19 | 0.0% |
| Belgian | 229 | 0.1% |
| Bhutanese | 448 | 0.2% |
| Blackfeet | 92 | 0.0% |
| Bolivian | 29 | 0.0% |
| Brazilian | 369 | 0.1% |
| British | 1,508 | 0.5% |
| British West Indian | 59 | 0.0% |
| Bulgarian | 29 | 0.0% |
| Burmese | 520 | 0.2% |
| Cajun | 19 | 0.0% |
| Cambodian | 55 | 0.0% |
| Canadian | 524 | 0.2% |
| Central American | 2,596 | 0.9% |
| Cherokee | 1,058 | 0.4% |
| Chickasaw | 4 | 0.0% |
| Chilean | 33 | 0.0% |
| Choctaw | 61 | 0.0% |
| Colombian | 327 | 0.1% |
| Costa Rican | 248 | 0.1% |
| Croatian | 201 | 0.1% |
| Crow | 13 | 0.0% |
| Cuban | 1,189 | 0.4% |
| Cypriot | 28 | 0.0% |
| Czech | 461 | 0.2% |
| Czechoslovakian | 212 | 0.1% |
| Danish | 834 | 0.3% |
| Dominican | 329 | 0.1% |
| Dutch | 2,588 | 0.9% |
| Dutch West Indian | 10 | 0.0% |
| Eastern European | 305 | 0.1% |
| Ecuadorian | 713 | 0.3% |
| Egyptian | 47 | 0.0% |
| English | 31,445 | 11.1% |
| Ethiopian | 15 | 0.0% |
| European | 5,382 | 1.9% |
| Fijian | 10 | 0.0% |
| Filipino | 59 | 0.0% |
| Finnish | 311 | 0.1% |
| French | 4,498 | 1.6% |
| French Canadian | 1,386 | 0.5% |
| German | 34,468 | 12.2% |
| German Russian | 13 | 0.0% |
| Ghanaian | 56 | 0.0% |
| Greek | 1,360 | 0.5% |
| Guamanian / Chamorro | 92 | 0.0% |
| Guatemalan | 119 | 0.0% |
| Guyanese | 22 | 0.0% |
| Haitian | 571 | 0.2% |
| Honduran | 977 | 0.4% |
| Hopi | 12 | 0.0% |
| Hungarian | 790 | 0.3% |
| Icelander | 32 | 0.0% |
| Indian (Asian) | 887 | 0.3% |
| Indonesian | 20 | 0.0% |
| Iranian | 115 | 0.0% |
| Irish | 31,441 | 11.1% |
| Iroquois | 58 | 0.0% |
| Israeli | 31 | 0.0% |
| Italian | 13,044 | 4.6% |
| Jamaican | 834 | 0.3% |
| Japanese | 389 | 0.1% |
| Jordanian | 25 | 0.0% |
| Kiowa | 3 | 0.0% |
| Korean | 1,516 | 0.5% |
| Latvian | 17 | 0.0% |
| Lebanese | 336 | 0.1% |
| Liberian | 14 | 0.0% |
| Lithuanian | 231 | 0.1% |
| Lumbee | 145 | 0.1% |
| Malaysian | 76 | 0.0% |
| Mexican | 8,065 | 2.9% |
| Mexican American Indian | 32 | 0.0% |
| Native Hawaiian | 110 | 0.0% |
| Navajo | 15 | 0.0% |
| New Zealander | 37 | 0.0% |
| Nicaraguan | 166 | 0.1% |
| Nigerian | 241 | 0.1% |
| Northern European | 428 | 0.2% |
| Norwegian | 1,037 | 0.4% |
| Paiute | 22 | 0.0% |
| Pakistani | 167 | 0.1% |
| Palestinian | 32 | 0.0% |
| Panamanian | 127 | 0.0% |
| Pennsylvania German | 29 | 0.0% |
| Peruvian | 310 | 0.1% |
| Polish | 5,616 | 2.0% |
| Portuguese | 942 | 0.3% |
| Puerto Rican | 2,544 | 0.9% |
| Romanian | 197 | 0.1% |
| Russian | 1,468 | 0.5% |
| Salvadoran | 959 | 0.3% |
| Samoan | 74 | 0.0% |
| Scandinavian | 515 | 0.2% |
| Scotch-Irish | 10,010 | 3.5% |
| Scottish | 6,850 | 2.4% |
| Seminole | 91 | 0.0% |
| Serbian | 49 | 0.0% |
| Slavic | 253 | 0.1% |
| Slovak | 475 | 0.2% |
| Slovene | 171 | 0.1% |
| South African | 50 | 0.0% |
| South American | 1,940 | 0.7% |
| South American Indian | 80 | 0.0% |
| Spaniard | 90 | 0.0% |
| Spanish | 542 | 0.2% |
| Sri Lankan | 1,056 | 0.4% |
| Subsaharan African | 1,552 | 0.5% |
| Sudanese | 58 | 0.0% |
| Swedish | 1,967 | 0.7% |
| Swiss | 640 | 0.2% |
| Syrian | 71 | 0.0% |
| Thai | 4,046 | 1.4% |
| Tohono O'Odham | 15 | 0.0% |
| Trinidadian and Tobagonian | 12 | 0.0% |
| Turkish | 172 | 0.1% |
| U.S. Virgin Islander | 31 | 0.0% |
| Ukrainian | 870 | 0.3% |
| Uruguayan | 52 | 0.0% |
| Venezuelan | 364 | 0.1% |
| Welsh | 1,845 | 0.6% |
| West Indian | 80 | 0.0% |
| Yugoslavian | 264 | 0.1% | View All 136 Rows |
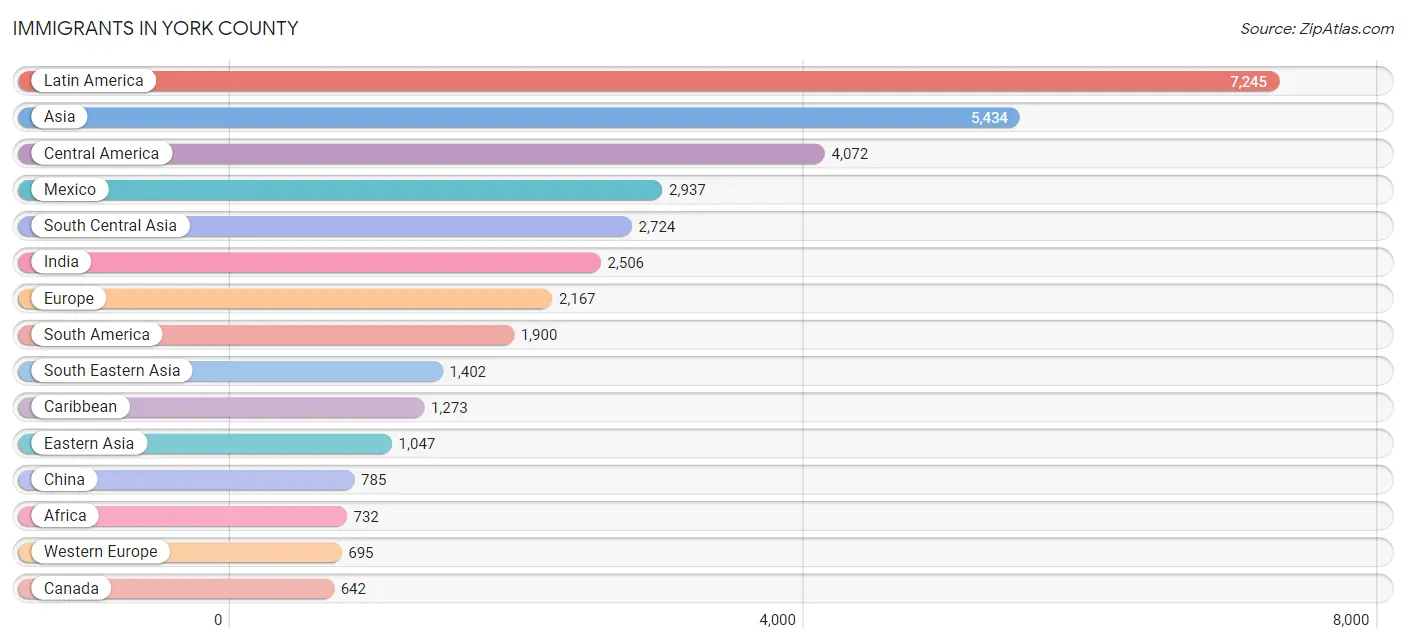
Immigrants in York County
The most numerous immigrant groups reported in York County came from Latin America (7,245 | 2.6%), Asia (5,434 | 1.9%), Central America (4,072 | 1.4%), Mexico (2,937 | 1.0%), and South Central Asia (2,724 | 1.0%), together accounting for 7.9% of all York County residents.
| Immigration Origin | # Population | % Population |
| Africa | 732 | 0.3% |
| Argentina | 43 | 0.0% |
| Asia | 5,434 | 1.9% |
| Australia | 28 | 0.0% |
| Austria | 5 | 0.0% |
| Azores | 14 | 0.0% |
| Bahamas | 36 | 0.0% |
| Belgium | 40 | 0.0% |
| Bosnia and Herzegovina | 7 | 0.0% |
| Brazil | 498 | 0.2% |
| Bulgaria | 29 | 0.0% |
| Cambodia | 161 | 0.1% |
| Canada | 642 | 0.2% |
| Caribbean | 1,273 | 0.4% |
| Central America | 4,072 | 1.4% |
| Chile | 33 | 0.0% |
| China | 785 | 0.3% |
| Colombia | 233 | 0.1% |
| Costa Rica | 147 | 0.1% |
| Cuba | 352 | 0.1% |
| Czechoslovakia | 16 | 0.0% |
| Dominican Republic | 165 | 0.1% |
| Eastern Africa | 326 | 0.1% |
| Eastern Asia | 1,047 | 0.4% |
| Eastern Europe | 601 | 0.2% |
| Ecuador | 572 | 0.2% |
| Egypt | 7 | 0.0% |
| El Salvador | 392 | 0.1% |
| England | 250 | 0.1% |
| Ethiopia | 22 | 0.0% |
| Europe | 2,167 | 0.8% |
| France | 144 | 0.1% |
| Germany | 471 | 0.2% |
| Ghana | 27 | 0.0% |
| Greece | 86 | 0.0% |
| Guatemala | 33 | 0.0% |
| Guyana | 140 | 0.1% |
| Haiti | 58 | 0.0% |
| Honduras | 461 | 0.2% |
| Hong Kong | 123 | 0.0% |
| Hungary | 33 | 0.0% |
| India | 2,506 | 0.9% |
| Indonesia | 21 | 0.0% |
| Iran | 21 | 0.0% |
| Ireland | 17 | 0.0% |
| Israel | 37 | 0.0% |
| Italy | 84 | 0.0% |
| Jamaica | 628 | 0.2% |
| Japan | 102 | 0.0% |
| Jordan | 44 | 0.0% |
| Kazakhstan | 24 | 0.0% |
| Kenya | 115 | 0.0% |
| Korea | 105 | 0.0% |
| Kuwait | 70 | 0.0% |
| Laos | 54 | 0.0% |
| Latin America | 7,245 | 2.6% |
| Lebanon | 18 | 0.0% |
| Mexico | 2,937 | 1.0% |
| Micronesia | 2 | 0.0% |
| Moldova | 15 | 0.0% |
| Morocco | 20 | 0.0% |
| Nepal | 110 | 0.0% |
| Netherlands | 22 | 0.0% |
| Nicaragua | 87 | 0.0% |
| Nigeria | 248 | 0.1% |
| Northern Africa | 39 | 0.0% |
| Northern Europe | 630 | 0.2% |
| Oceania | 67 | 0.0% |
| Pakistan | 4 | 0.0% |
| Panama | 15 | 0.0% |
| Peru | 141 | 0.1% |
| Philippines | 621 | 0.2% |
| Poland | 112 | 0.0% |
| Portugal | 49 | 0.0% |
| Romania | 78 | 0.0% |
| Russia | 170 | 0.1% |
| Saudi Arabia | 7 | 0.0% |
| Scotland | 65 | 0.0% |
| South Africa | 59 | 0.0% |
| South America | 1,900 | 0.7% |
| South Central Asia | 2,724 | 1.0% |
| South Eastern Asia | 1,402 | 0.5% |
| Southern Europe | 241 | 0.1% |
| Spain | 22 | 0.0% |
| Sweden | 64 | 0.0% |
| Switzerland | 13 | 0.0% |
| Taiwan | 61 | 0.0% |
| Thailand | 60 | 0.0% |
| Trinidad and Tobago | 34 | 0.0% |
| Uganda | 137 | 0.1% |
| Ukraine | 88 | 0.0% |
| Uzbekistan | 59 | 0.0% |
| Venezuela | 229 | 0.1% |
| Vietnam | 485 | 0.2% |
| Western Africa | 275 | 0.1% |
| Western Asia | 261 | 0.1% |
| Western Europe | 695 | 0.3% | View All 97 Rows |
Sex and Age in York County
Sex and Age in York County
The most populous age groups in York County are 40 to 44 Years (10,797 | 7.8%) for men and 40 to 44 Years (10,565 | 7.3%) for women.
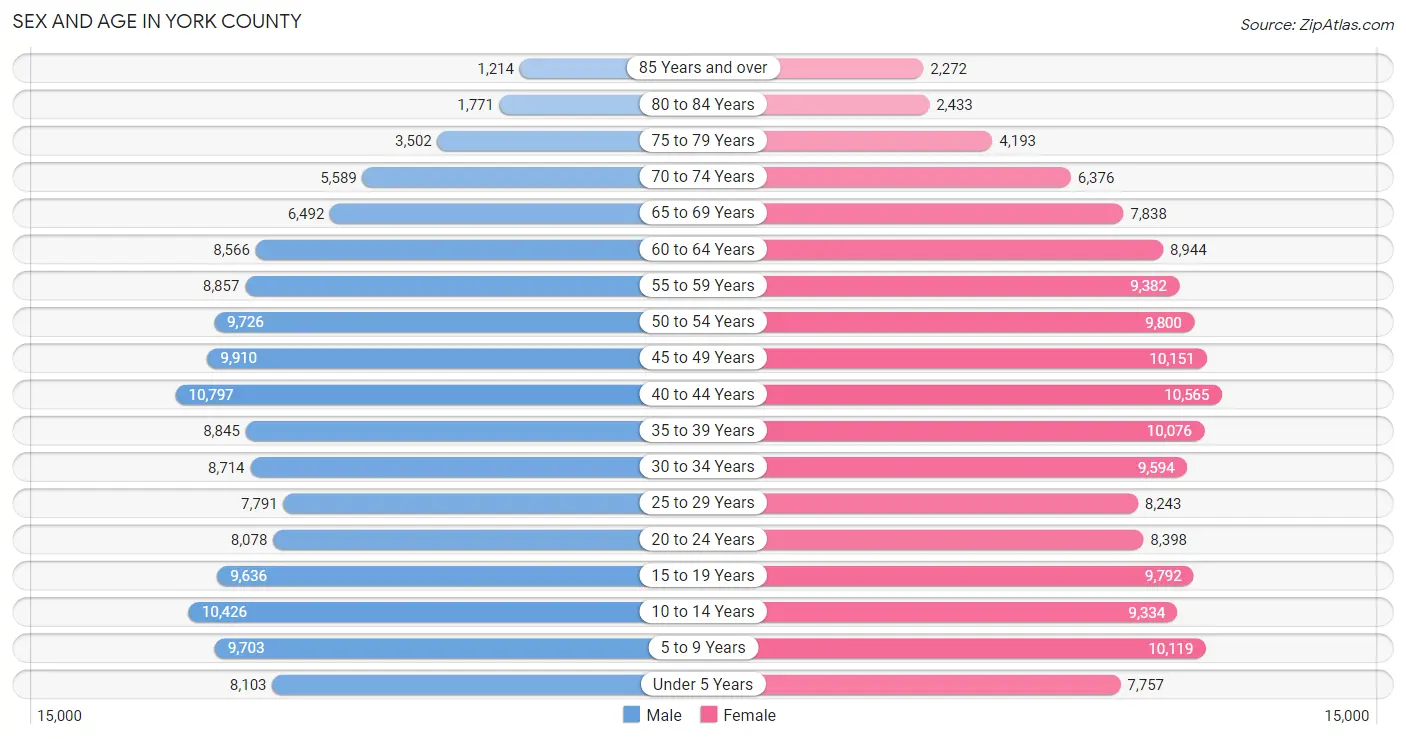
| Age Bracket | Male | Female |
| Under 5 Years | 8,103 (5.9%) | 7,757 (5.3%) |
| 5 to 9 Years | 9,703 (7.0%) | 10,119 (7.0%) |
| 10 to 14 Years | 10,426 (7.6%) | 9,334 (6.4%) |
| 15 to 19 Years | 9,636 (7.0%) | 9,792 (6.7%) |
| 20 to 24 Years | 8,078 (5.9%) | 8,398 (5.8%) |
| 25 to 29 Years | 7,791 (5.7%) | 8,243 (5.7%) |
| 30 to 34 Years | 8,714 (6.3%) | 9,594 (6.6%) |
| 35 to 39 Years | 8,845 (6.4%) | 10,076 (6.9%) |
| 40 to 44 Years | 10,797 (7.8%) | 10,565 (7.3%) |
| 45 to 49 Years | 9,910 (7.2%) | 10,151 (7.0%) |
| 50 to 54 Years | 9,726 (7.1%) | 9,800 (6.8%) |
| 55 to 59 Years | 8,857 (6.4%) | 9,382 (6.5%) |
| 60 to 64 Years | 8,566 (6.2%) | 8,944 (6.2%) |
| 65 to 69 Years | 6,492 (4.7%) | 7,838 (5.4%) |
| 70 to 74 Years | 5,589 (4.1%) | 6,376 (4.4%) |
| 75 to 79 Years | 3,502 (2.5%) | 4,193 (2.9%) |
| 80 to 84 Years | 1,771 (1.3%) | 2,433 (1.7%) |
| 85 Years and over | 1,214 (0.9%) | 2,272 (1.6%) |
| Total | 137,720 (100.0%) | 145,267 (100.0%) |
Families and Households in York County
Median Family Size in York County
The median family size in York County is 3.05 persons per family, with married-couple families (57,527 | 75.3%) accounting for the largest median family size of 3.11 persons per family. On the other hand, single male/father families (5,059 | 6.6%) represent the smallest median family size with 2.53 persons per family.
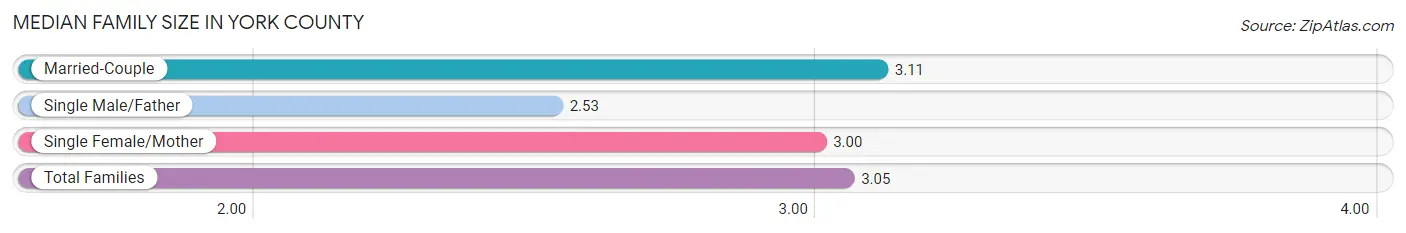
| Family Type | # Families | Family Size |
| Married-Couple | 57,527 (75.3%) | 3.11 |
| Single Male/Father | 5,059 (6.6%) | 2.53 |
| Single Female/Mother | 13,806 (18.1%) | 3.00 |
| Total Families | 76,392 (100.0%) | 3.05 |
Median Household Size in York County
The median household size in York County is 2.56 persons per household, with single female/mother households (13,806 | 12.7%) accounting for the largest median household size of 3.18 persons per household. non-family households (32,621 | 29.9%) represent the smallest median household size with 1.24 persons per household.
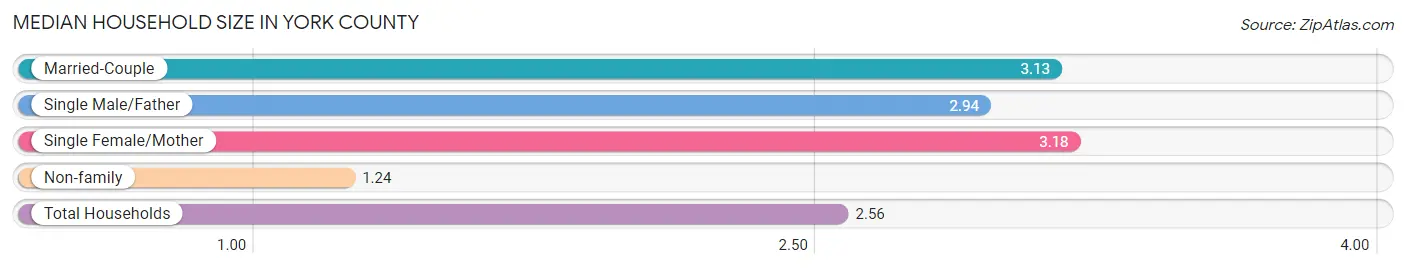
| Household Type | # Households | Household Size |
| Married-Couple | 57,527 (52.8%) | 3.13 |
| Single Male/Father | 5,059 (4.6%) | 2.94 |
| Single Female/Mother | 13,806 (12.7%) | 3.18 |
| Non-family | 32,621 (29.9%) | 1.24 |
| Total Households | 109,013 (100.0%) | 2.56 |
Household Size by Marriage Status in York County
Out of a total of 109,013 households in York County, 76,392 (70.1%) are family households, while 32,621 (29.9%) are nonfamily households. The most numerous type of family households are 2-person households, comprising 33,563, and the most common type of nonfamily households are 1-person households, comprising 26,634.
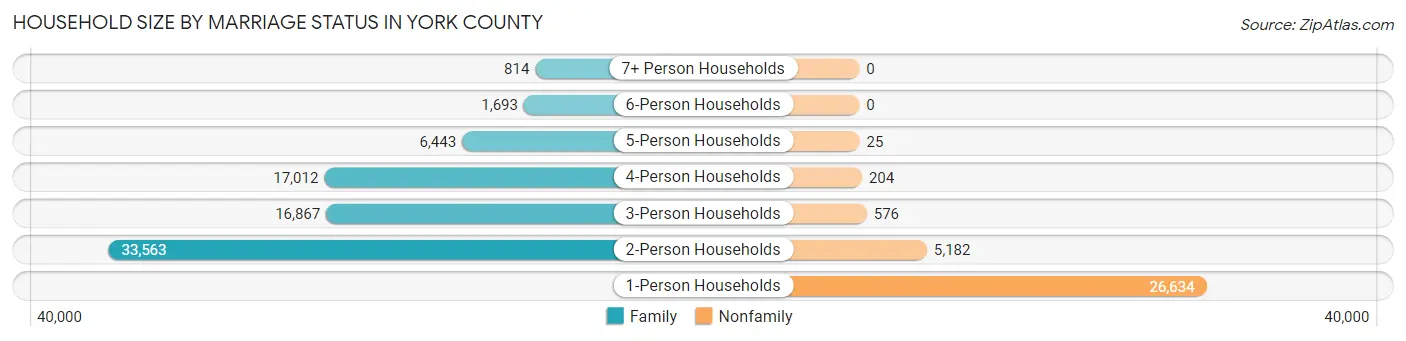
| Household Size | Family Households | Nonfamily Households |
| 1-Person Households | - | 26,634 (24.4%) |
| 2-Person Households | 33,563 (30.8%) | 5,182 (4.8%) |
| 3-Person Households | 16,867 (15.5%) | 576 (0.5%) |
| 4-Person Households | 17,012 (15.6%) | 204 (0.2%) |
| 5-Person Households | 6,443 (5.9%) | 25 (0.0%) |
| 6-Person Households | 1,693 (1.5%) | 0 (0.0%) |
| 7+ Person Households | 814 (0.7%) | 0 (0.0%) |
| Total | 76,392 (70.1%) | 32,621 (29.9%) |
Female Fertility in York County
Fertility by Age in York County
Average fertility rate in York County is 45.0 births per 1,000 women. Women in the age bracket of 20 to 34 years have the highest fertility rate with 88.0 births per 1,000 women. Women in the age bracket of 20 to 34 years acount for 74.3% of all women with births.
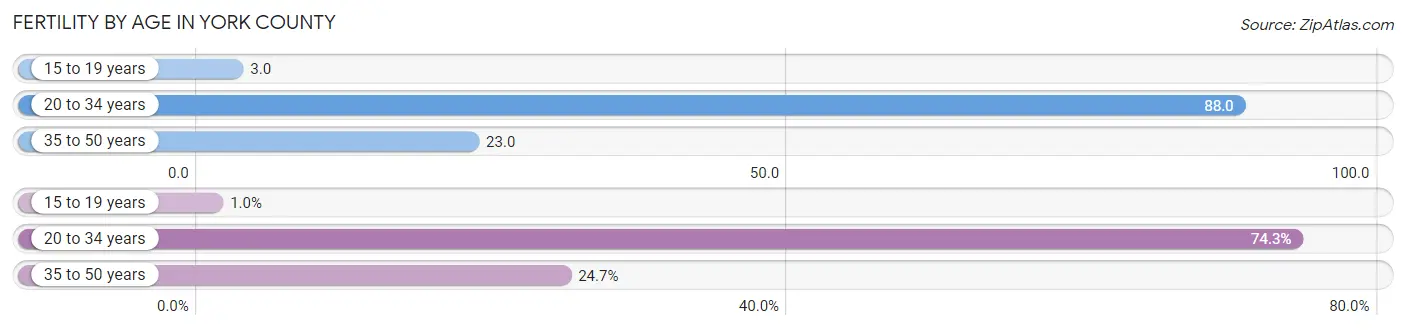
| Age Bracket | Women with Births | Births / 1,000 Women |
| 15 to 19 years | 32 (1.0%) | 3.0 |
| 20 to 34 years | 2,310 (74.3%) | 88.0 |
| 35 to 50 years | 766 (24.6%) | 23.0 |
| Total | 3,108 (100.0%) | 45.0 |
Fertility by Age by Marriage Status in York County
75.4% of women with births (3,108) in York County are married. The highest percentage of unmarried women with births falls into 15 to 19 years age bracket with 100.0% of them unmarried at the time of birth, while the lowest percentage of unmarried women with births belong to 35 to 50 years age bracket with 5.3% of them unmarried.
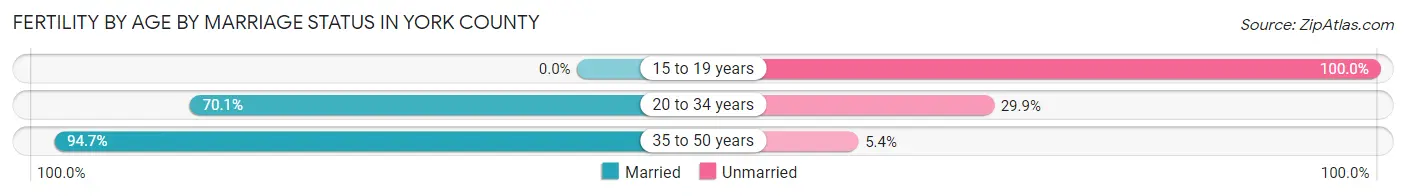
| Age Bracket | Married | Unmarried |
| 15 to 19 years | 0 (0.0%) | 32 (100.0%) |
| 20 to 34 years | 1,619 (70.1%) | 691 (29.9%) |
| 35 to 50 years | 725 (94.7%) | 41 (5.3%) |
| Total | 2,343 (75.4%) | 765 (24.6%) |
Fertility by Education in York County
Average fertility rate in York County is 45.0 births per 1,000 women. Women with the education attainment of graduate degree have the highest fertility rate of 79.0 births per 1,000 women, while women with the education attainment of less than high school have the lowest fertility at 12.0 births per 1,000 women. Women with the education attainment of bachelor's degree represent 29.0% of all women with births.
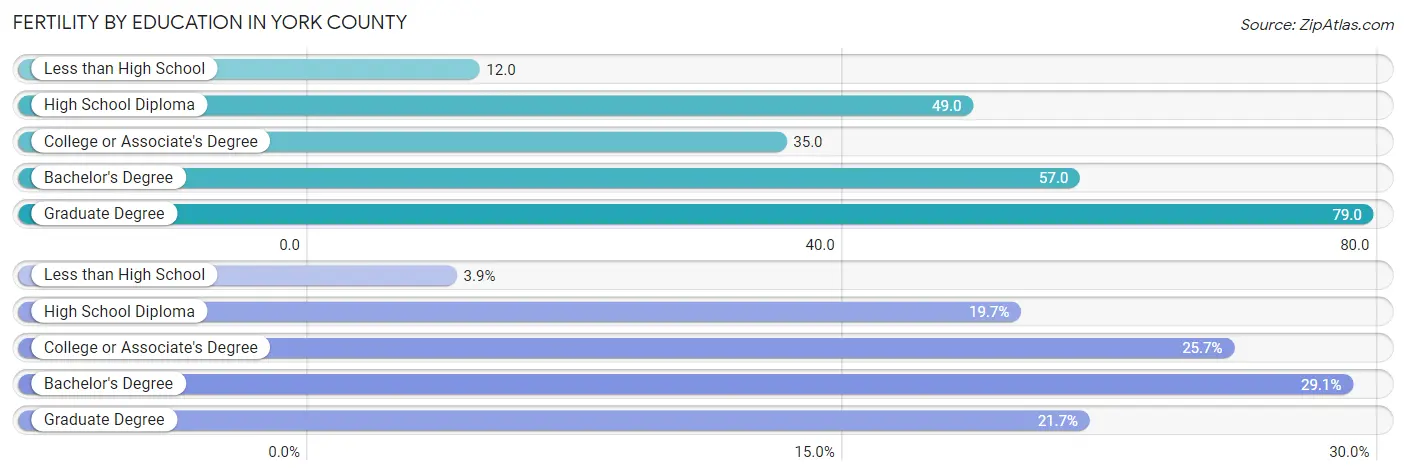
| Educational Attainment | Women with Births | Births / 1,000 Women |
| Less than High School | 120 (3.9%) | 12.0 |
| High School Diploma | 613 (19.7%) | 49.0 |
| College or Associate's Degree | 799 (25.7%) | 35.0 |
| Bachelor's Degree | 903 (29.0%) | 57.0 |
| Graduate Degree | 673 (21.6%) | 79.0 |
| Total | 3,108 (100.0%) | 45.0 |
Fertility by Education by Marriage Status in York County
24.6% of women with births in York County are unmarried. Women with the educational attainment of graduate degree are most likely to be married with 95.1% of them married at childbirth, while women with the educational attainment of less than high school are least likely to be married with 93.3% of them unmarried at childbirth.
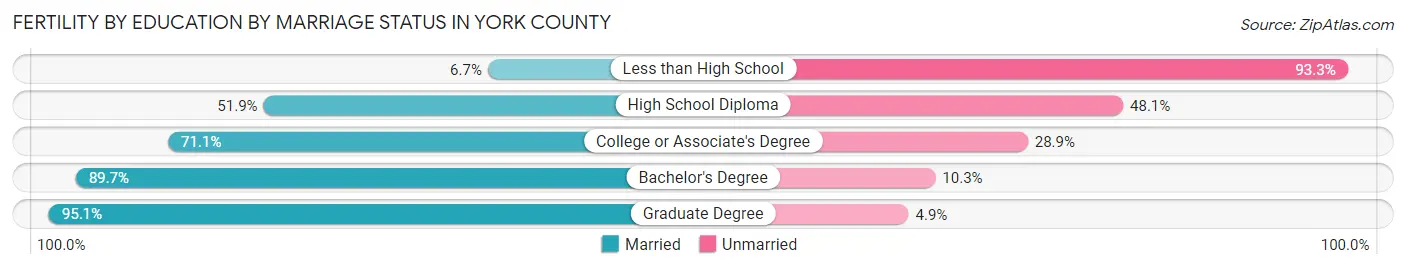
| Educational Attainment | Married | Unmarried |
| Less than High School | 8 (6.7%) | 112 (93.3%) |
| High School Diploma | 318 (51.9%) | 295 (48.1%) |
| College or Associate's Degree | 568 (71.1%) | 231 (28.9%) |
| Bachelor's Degree | 810 (89.7%) | 93 (10.3%) |
| Graduate Degree | 640 (95.1%) | 33 (4.9%) |
| Total | 2,343 (75.4%) | 765 (24.6%) |
Employment Characteristics in York County
Employment by Class of Employer in York County
Among the 139,955 employed individuals in York County, private company employees (103,786 | 74.2%), not-for-profit organizations (8,252 | 5.9%), and local government employees (8,050 | 5.8%) make up the most common classes of employment.
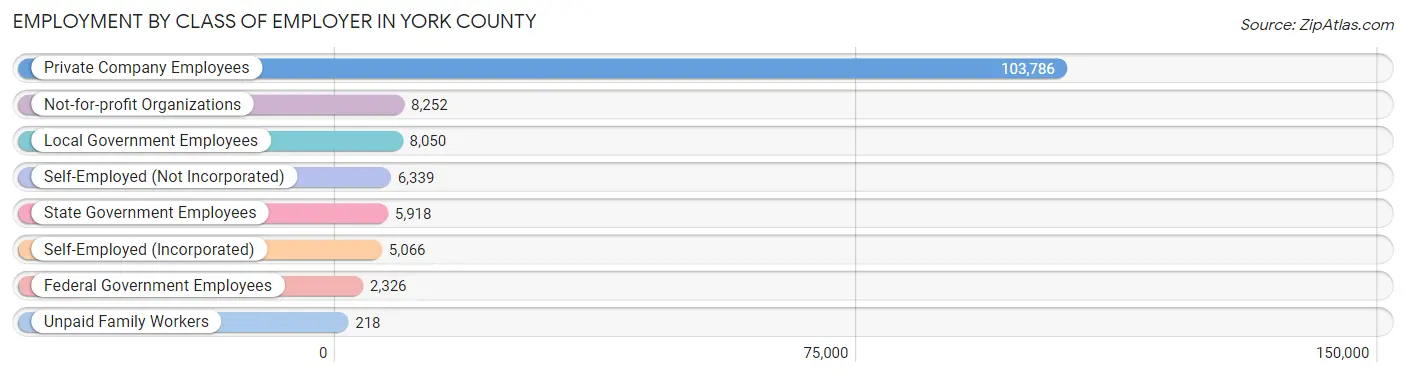
| Employer Class | # Employees | % Employees |
| Private Company Employees | 103,786 | 74.2% |
| Self-Employed (Incorporated) | 5,066 | 3.6% |
| Self-Employed (Not Incorporated) | 6,339 | 4.5% |
| Not-for-profit Organizations | 8,252 | 5.9% |
| Local Government Employees | 8,050 | 5.8% |
| State Government Employees | 5,918 | 4.2% |
| Federal Government Employees | 2,326 | 1.7% |
| Unpaid Family Workers | 218 | 0.2% |
| Total | 139,955 | 100.0% |
Employment Status by Age in York County
According to the labor force statistics for York County, out of the total population over 16 years of age (223,222), 66.9% or 149,336 individuals are in the labor force, with 4.7% or 7,019 of them unemployed. The age group with the highest labor force participation rate is 35 to 44 years, with 85.5% or 34,442 individuals in the labor force. Within the labor force, the 16 to 19 years age range has the highest percentage of unemployed individuals, with 19.5% or 1,361 of them being unemployed.
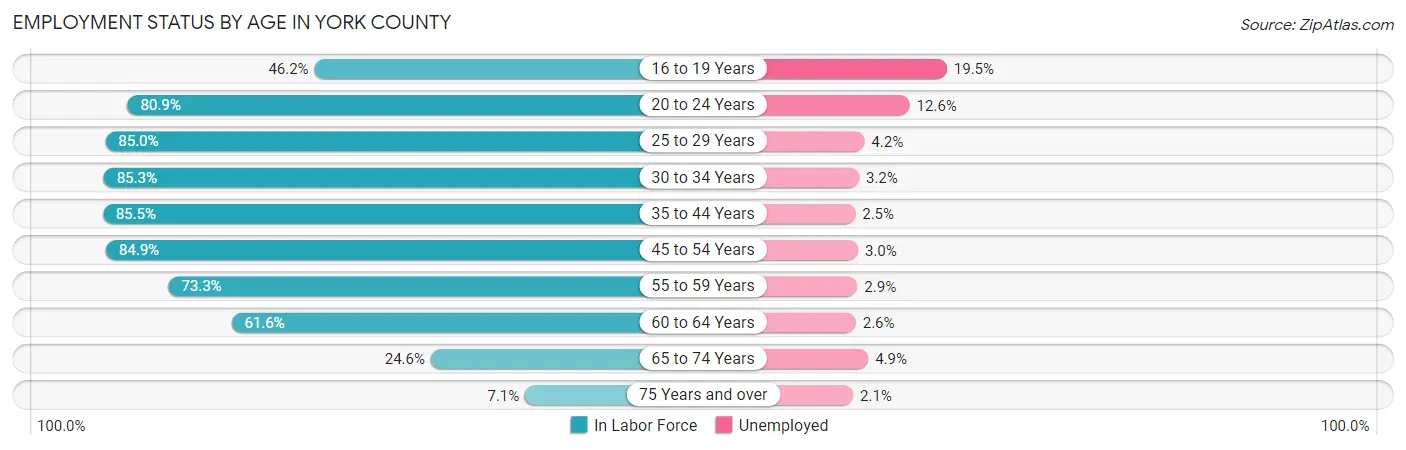
| Age Bracket | In Labor Force | Unemployed |
| 16 to 19 Years | 6,979 (46.2%) | 1,361 (19.5%) |
| 20 to 24 Years | 13,329 (80.9%) | 1,679 (12.6%) |
| 25 to 29 Years | 13,629 (85.0%) | 572 (4.2%) |
| 30 to 34 Years | 15,617 (85.3%) | 500 (3.2%) |
| 35 to 44 Years | 34,442 (85.5%) | 861 (2.5%) |
| 45 to 54 Years | 33,609 (84.9%) | 1,008 (3.0%) |
| 55 to 59 Years | 13,369 (73.3%) | 388 (2.9%) |
| 60 to 64 Years | 10,786 (61.6%) | 280 (2.6%) |
| 65 to 74 Years | 6,469 (24.6%) | 317 (4.9%) |
| 75 Years and over | 1,092 (7.1%) | 23 (2.1%) |
| Total | 149,336 (66.9%) | 7,019 (4.7%) |
Employment Status by Educational Attainment in York County
According to labor force statistics for York County, 81.0% of individuals (121,468) out of the total population between 25 and 64 years of age (149,961) are in the labor force, with 3.0% or 3,644 of them being unemployed. The group with the highest labor force participation rate are those with the educational attainment of bachelor's degree or higher, with 87.2% or 50,872 individuals in the labor force. Within the labor force, individuals with less than high school education have the highest percentage of unemployment, with 5.3% or 322 of them being unemployed.
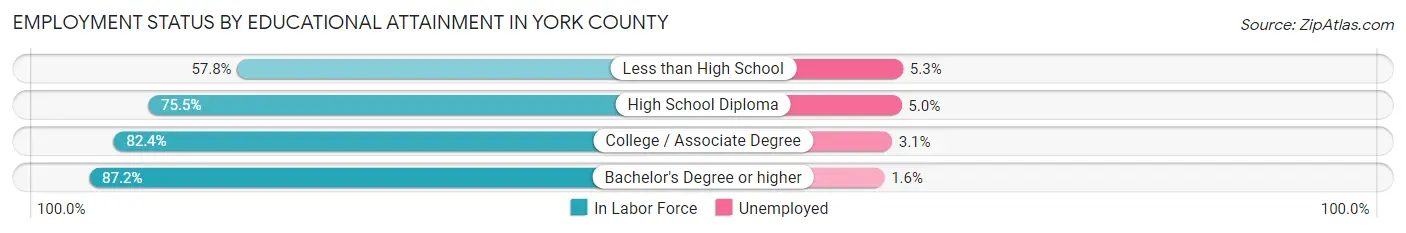
| Educational Attainment | In Labor Force | Unemployed |
| Less than High School | 6,083 (57.8%) | 558 (5.3%) |
| High School Diploma | 25,317 (75.5%) | 1,677 (5.0%) |
| College / Associate Degree | 39,193 (82.4%) | 1,474 (3.1%) |
| Bachelor's Degree or higher | 50,872 (87.2%) | 933 (1.6%) |
| Total | 121,468 (81.0%) | 4,499 (3.0%) |
Employment Occupations by Sex in York County
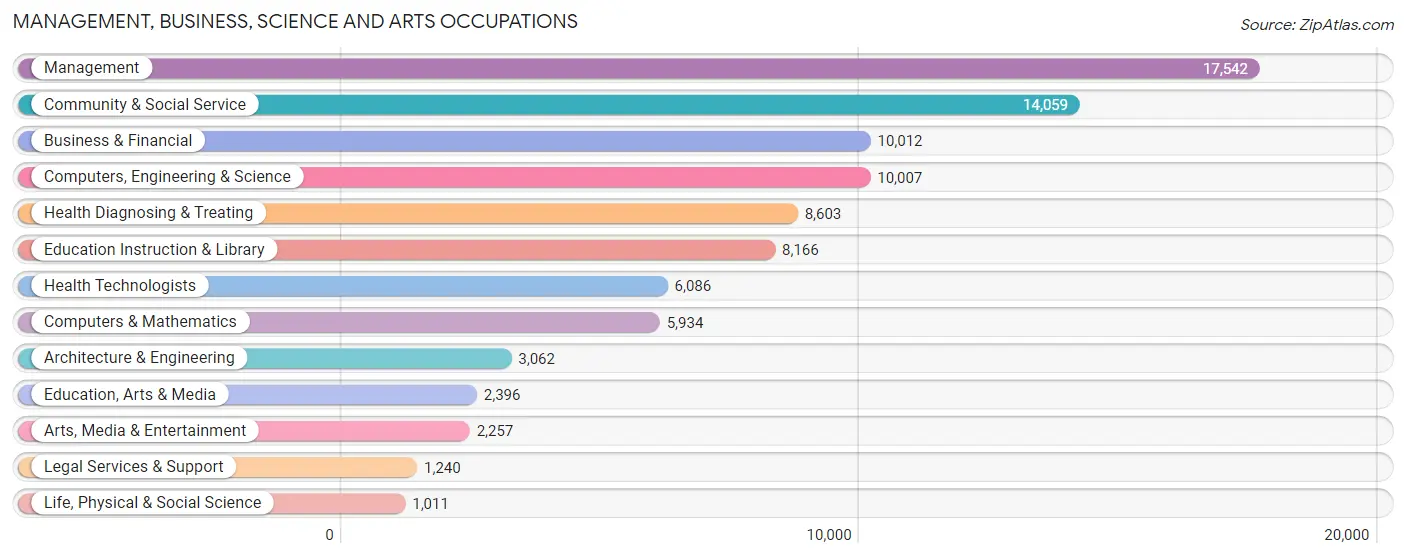
Management, Business, Science and Arts Occupations
The most common Management, Business, Science and Arts occupations in York County are Management (17,542 | 12.4%), Community & Social Service (14,059 | 9.9%), Business & Financial (10,012 | 7.1%), Computers, Engineering & Science (10,007 | 7.1%), and Health Diagnosing & Treating (8,603 | 6.1%).
Management, Business, Science and Arts Occupations by Sex
Within the Management, Business, Science and Arts occupations in York County, the most male-oriented occupations are Architecture & Engineering (87.0%), Computers, Engineering & Science (78.8%), and Computers & Mathematics (76.7%), while the most female-oriented occupations are Health Technologists (78.4%), Education Instruction & Library (78.0%), and Health Diagnosing & Treating (75.7%).
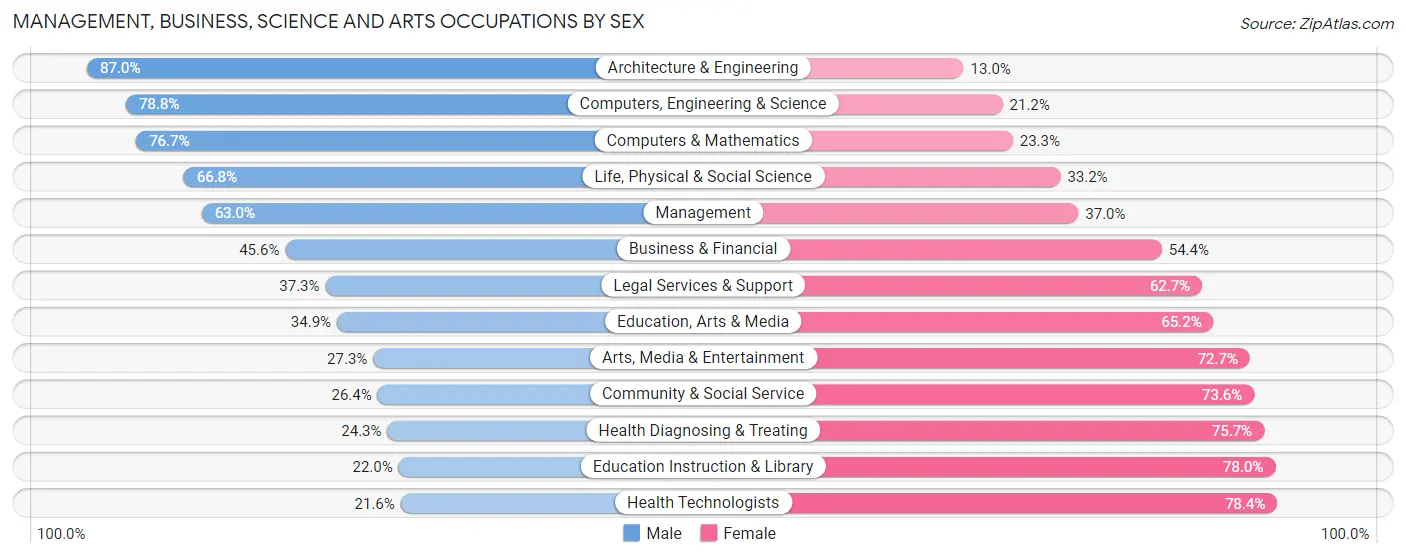
| Occupation | Male | Female |
| Management | 11,058 (63.0%) | 6,484 (37.0%) |
| Business & Financial | 4,568 (45.6%) | 5,444 (54.4%) |
| Computers, Engineering & Science | 7,890 (78.8%) | 2,117 (21.2%) |
| Computers & Mathematics | 4,552 (76.7%) | 1,382 (23.3%) |
| Architecture & Engineering | 2,663 (87.0%) | 399 (13.0%) |
| Life, Physical & Social Science | 675 (66.8%) | 336 (33.2%) |
| Community & Social Service | 3,709 (26.4%) | 10,350 (73.6%) |
| Education, Arts & Media | 835 (34.8%) | 1,561 (65.1%) |
| Legal Services & Support | 462 (37.3%) | 778 (62.7%) |
| Education Instruction & Library | 1,796 (22.0%) | 6,370 (78.0%) |
| Arts, Media & Entertainment | 616 (27.3%) | 1,641 (72.7%) |
| Health Diagnosing & Treating | 2,093 (24.3%) | 6,510 (75.7%) |
| Health Technologists | 1,312 (21.6%) | 4,774 (78.4%) |
| Total (Category) | 29,318 (48.7%) | 30,905 (51.3%) |
| Total (Overall) | 74,388 (52.4%) | 67,437 (47.5%) |
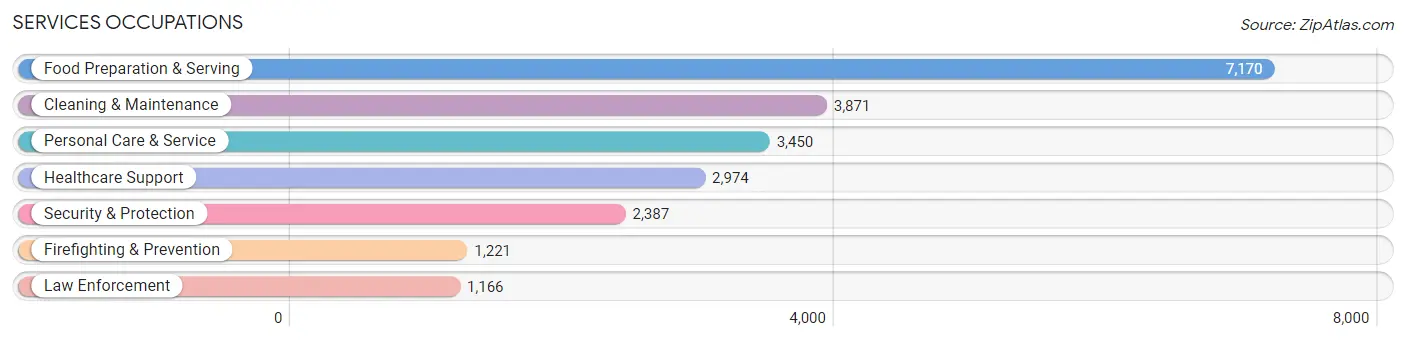
Services Occupations
The most common Services occupations in York County are Food Preparation & Serving (7,170 | 5.1%), Cleaning & Maintenance (3,871 | 2.7%), Personal Care & Service (3,450 | 2.4%), Healthcare Support (2,974 | 2.1%), and Security & Protection (2,387 | 1.7%).
Services Occupations by Sex
Within the Services occupations in York County, the most male-oriented occupations are Firefighting & Prevention (84.5%), Security & Protection (83.0%), and Law Enforcement (81.5%), while the most female-oriented occupations are Healthcare Support (90.1%), Personal Care & Service (76.6%), and Food Preparation & Serving (61.3%).
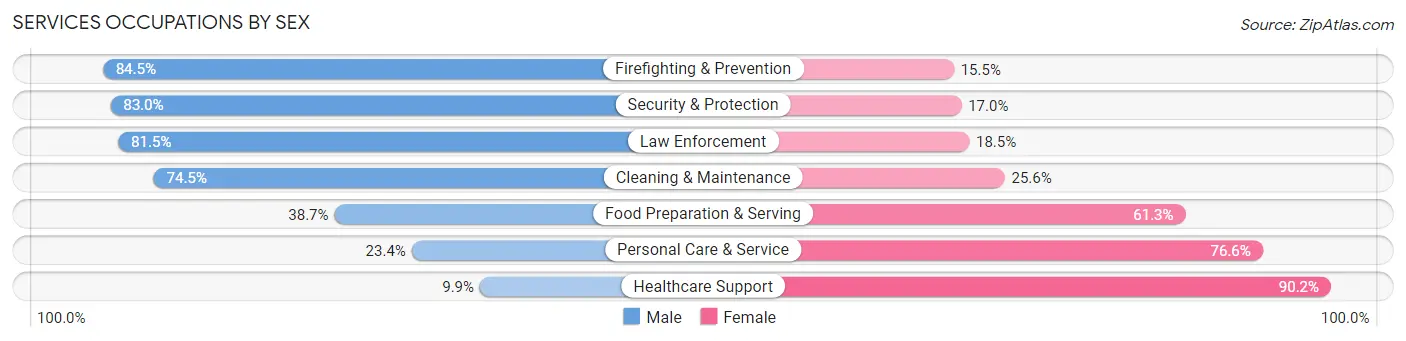
| Occupation | Male | Female |
| Healthcare Support | 293 (9.9%) | 2,681 (90.1%) |
| Security & Protection | 1,982 (83.0%) | 405 (17.0%) |
| Firefighting & Prevention | 1,032 (84.5%) | 189 (15.5%) |
| Law Enforcement | 950 (81.5%) | 216 (18.5%) |
| Food Preparation & Serving | 2,772 (38.7%) | 4,398 (61.3%) |
| Cleaning & Maintenance | 2,882 (74.5%) | 989 (25.6%) |
| Personal Care & Service | 806 (23.4%) | 2,644 (76.6%) |
| Total (Category) | 8,735 (44.0%) | 11,117 (56.0%) |
| Total (Overall) | 74,388 (52.4%) | 67,437 (47.5%) |
Sales and Office Occupations
The most common Sales and Office occupations in York County are Office & Administration (16,241 | 11.5%), and Sales & Related (13,479 | 9.5%).

Sales and Office Occupations by Sex
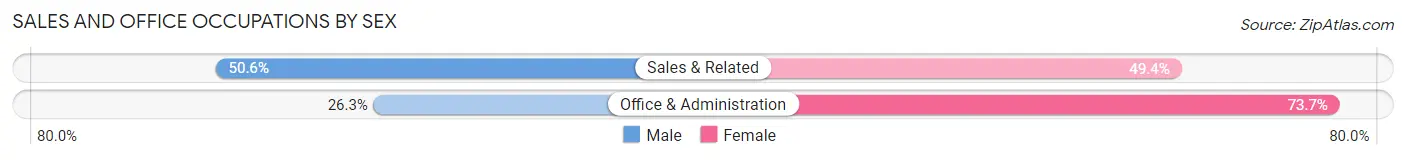
| Occupation | Male | Female |
| Sales & Related | 6,822 (50.6%) | 6,657 (49.4%) |
| Office & Administration | 4,269 (26.3%) | 11,972 (73.7%) |
| Total (Category) | 11,091 (37.3%) | 18,629 (62.7%) |
| Total (Overall) | 74,388 (52.4%) | 67,437 (47.5%) |
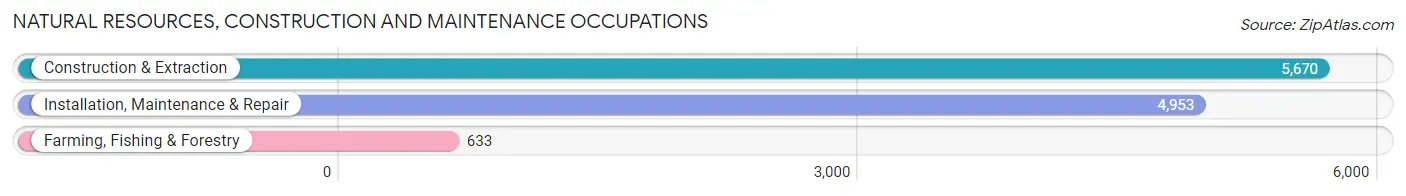
Natural Resources, Construction and Maintenance Occupations
The most common Natural Resources, Construction and Maintenance occupations in York County are Construction & Extraction (5,670 | 4.0%), Installation, Maintenance & Repair (4,953 | 3.5%), and Farming, Fishing & Forestry (633 | 0.4%).
Natural Resources, Construction and Maintenance Occupations by Sex
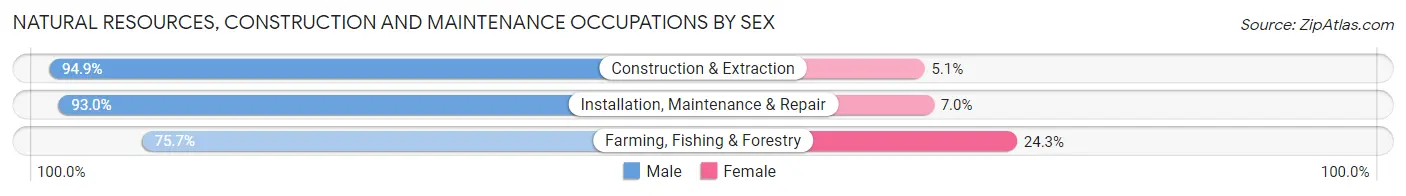
| Occupation | Male | Female |
| Farming, Fishing & Forestry | 479 (75.7%) | 154 (24.3%) |
| Construction & Extraction | 5,380 (94.9%) | 290 (5.1%) |
| Installation, Maintenance & Repair | 4,605 (93.0%) | 348 (7.0%) |
| Total (Category) | 10,464 (93.0%) | 792 (7.0%) |
| Total (Overall) | 74,388 (52.4%) | 67,437 (47.5%) |
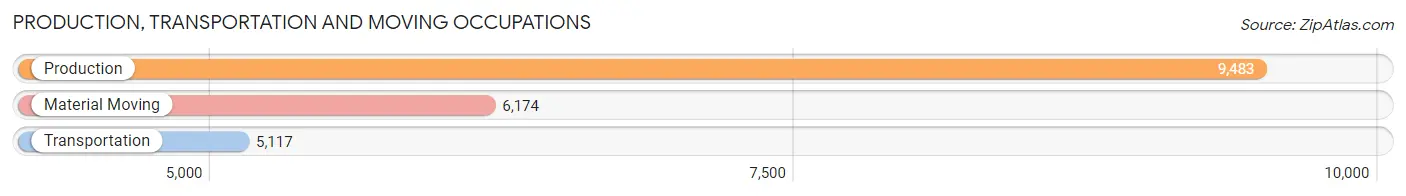
Production, Transportation and Moving Occupations
The most common Production, Transportation and Moving occupations in York County are Production (9,483 | 6.7%), Material Moving (6,174 | 4.3%), and Transportation (5,117 | 3.6%).
Production, Transportation and Moving Occupations by Sex
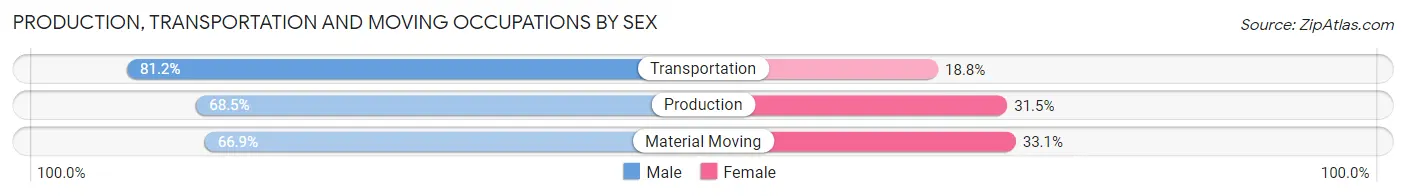
| Occupation | Male | Female |
| Production | 6,494 (68.5%) | 2,989 (31.5%) |
| Transportation | 4,154 (81.2%) | 963 (18.8%) |
| Material Moving | 4,132 (66.9%) | 2,042 (33.1%) |
| Total (Category) | 14,780 (71.2%) | 5,994 (28.8%) |
| Total (Overall) | 74,388 (52.4%) | 67,437 (47.5%) |
Employment Industries by Sex in York County
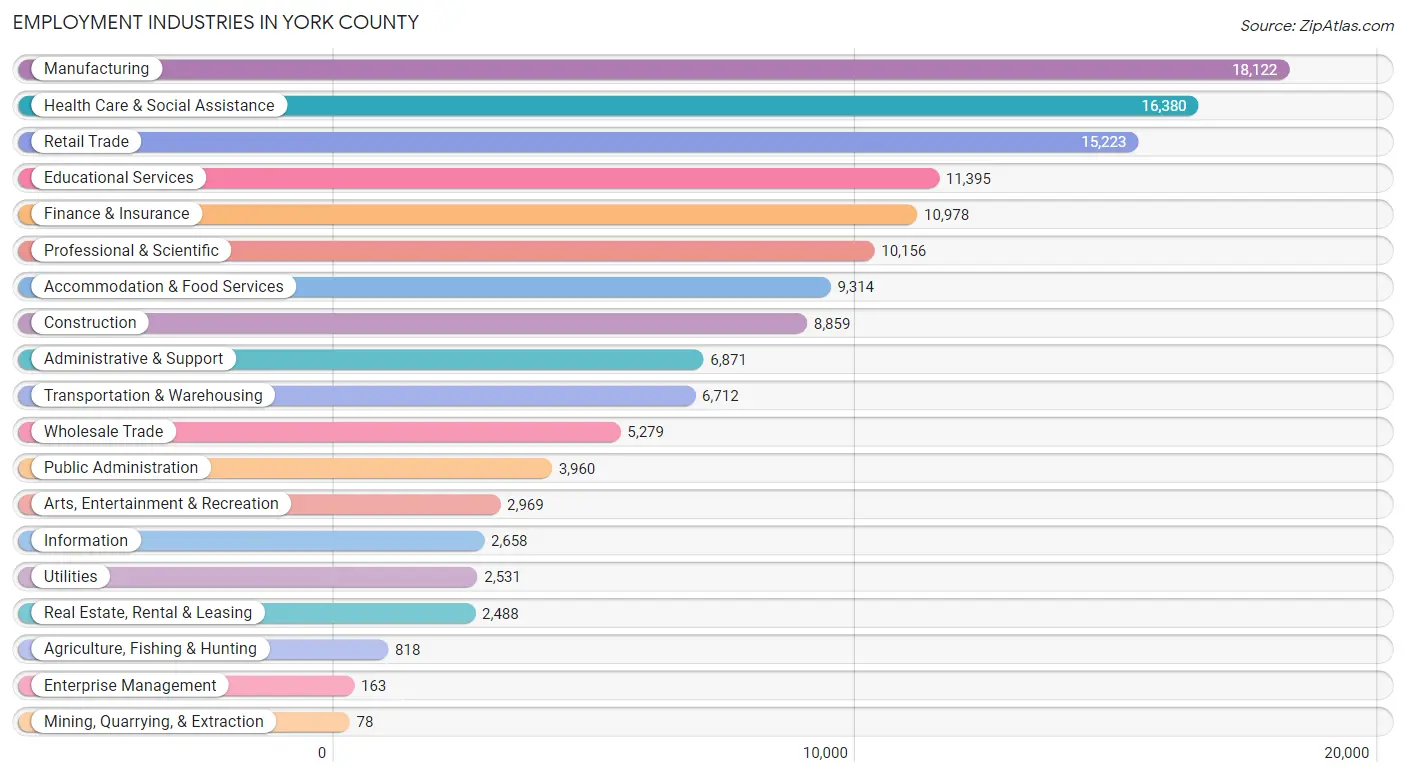
Employment Industries in York County
The major employment industries in York County include Manufacturing (18,122 | 12.8%), Health Care & Social Assistance (16,380 | 11.6%), Retail Trade (15,223 | 10.7%), Educational Services (11,395 | 8.0%), and Finance & Insurance (10,978 | 7.7%).
Employment Industries by Sex in York County
The York County industries that see more men than women are Construction (86.2%), Utilities (81.4%), and Agriculture, Fishing & Hunting (78.0%), whereas the industries that tend to have a higher number of women are Health Care & Social Assistance (79.8%), Educational Services (73.0%), and Accommodation & Food Services (58.1%).
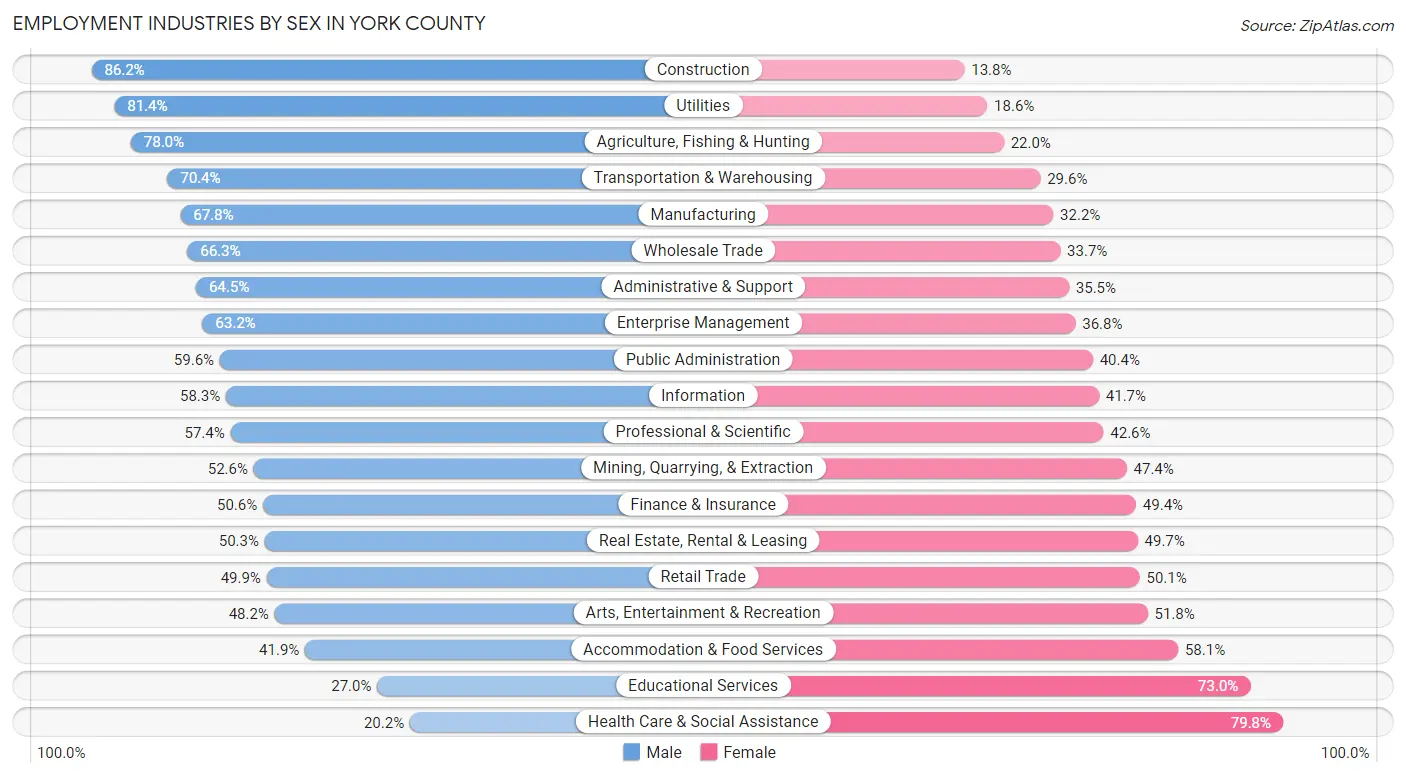
| Industry | Male | Female |
| Agriculture, Fishing & Hunting | 638 (78.0%) | 180 (22.0%) |
| Mining, Quarrying, & Extraction | 41 (52.6%) | 37 (47.4%) |
| Construction | 7,633 (86.2%) | 1,226 (13.8%) |
| Manufacturing | 12,280 (67.8%) | 5,842 (32.2%) |
| Wholesale Trade | 3,501 (66.3%) | 1,778 (33.7%) |
| Retail Trade | 7,595 (49.9%) | 7,628 (50.1%) |
| Transportation & Warehousing | 4,728 (70.4%) | 1,984 (29.6%) |
| Utilities | 2,061 (81.4%) | 470 (18.6%) |
| Information | 1,550 (58.3%) | 1,108 (41.7%) |
| Finance & Insurance | 5,559 (50.6%) | 5,419 (49.4%) |
| Real Estate, Rental & Leasing | 1,251 (50.3%) | 1,237 (49.7%) |
| Professional & Scientific | 5,827 (57.4%) | 4,329 (42.6%) |
| Enterprise Management | 103 (63.2%) | 60 (36.8%) |
| Administrative & Support | 4,433 (64.5%) | 2,438 (35.5%) |
| Educational Services | 3,077 (27.0%) | 8,318 (73.0%) |
| Health Care & Social Assistance | 3,314 (20.2%) | 13,066 (79.8%) |
| Arts, Entertainment & Recreation | 1,432 (48.2%) | 1,537 (51.8%) |
| Accommodation & Food Services | 3,905 (41.9%) | 5,409 (58.1%) |
| Public Administration | 2,359 (59.6%) | 1,601 (40.4%) |
| Total | 74,388 (52.4%) | 67,437 (47.5%) |
Education in York County
School Enrollment in York County
The most common levels of schooling among the 68,449 students in York County are elementary school (15,938 | 23.3%), high school (15,674 | 22.9%), and middle school (15,539 | 22.7%).
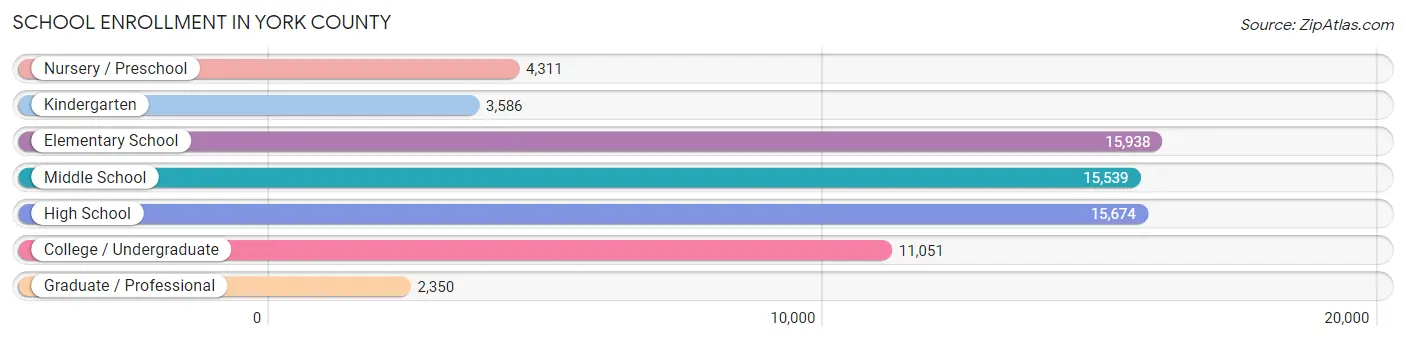
| School Level | # Students | % Students |
| Nursery / Preschool | 4,311 | 6.3% |
| Kindergarten | 3,586 | 5.2% |
| Elementary School | 15,938 | 23.3% |
| Middle School | 15,539 | 22.7% |
| High School | 15,674 | 22.9% |
| College / Undergraduate | 11,051 | 16.1% |
| Graduate / Professional | 2,350 | 3.4% |
| Total | 68,449 | 100.0% |
School Enrollment by Age by Funding Source in York County
Out of a total of 68,449 students who are enrolled in schools in York County, 8,009 (11.7%) attend a private institution, while the remaining 60,440 (88.3%) are enrolled in public schools. The age group of 3 to 4 year olds has the highest likelihood of being enrolled in private schools, with 1,410 (40.4% in the age bracket) enrolled. Conversely, the age group of 18 to 19 year olds has the lowest likelihood of being enrolled in a private school, with 4,780 (94.7% in the age bracket) attending a public institution.
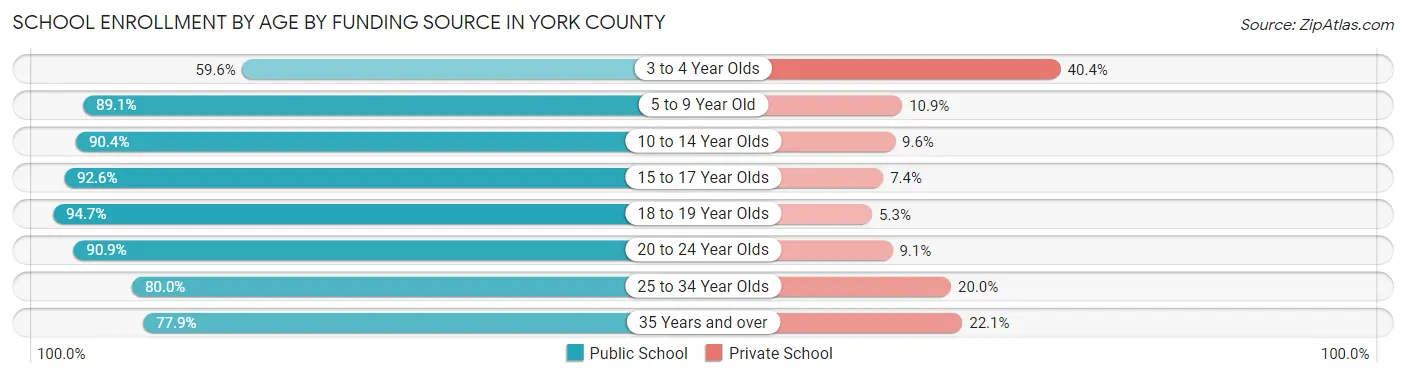
| Age Bracket | Public School | Private School |
| 3 to 4 Year Olds | 2,078 (59.6%) | 1,410 (40.4%) |
| 5 to 9 Year Old | 16,585 (89.1%) | 2,029 (10.9%) |
| 10 to 14 Year Olds | 17,461 (90.4%) | 1,849 (9.6%) |
| 15 to 17 Year Olds | 10,797 (92.6%) | 858 (7.4%) |
| 18 to 19 Year Olds | 4,780 (94.7%) | 268 (5.3%) |
| 20 to 24 Year Olds | 4,512 (90.9%) | 451 (9.1%) |
| 25 to 34 Year Olds | 2,004 (80.0%) | 501 (20.0%) |
| 35 Years and over | 2,233 (77.9%) | 633 (22.1%) |
| Total | 60,440 (88.3%) | 8,009 (11.7%) |
Educational Attainment by Field of Study in York County
Business (19,892 | 26.3%), education (8,529 | 11.3%), science & technology (7,031 | 9.3%), engineering (5,510 | 7.3%), and arts & humanities (4,716 | 6.2%) are the most common fields of study among 75,526 individuals in York County who have obtained a bachelor's degree or higher.
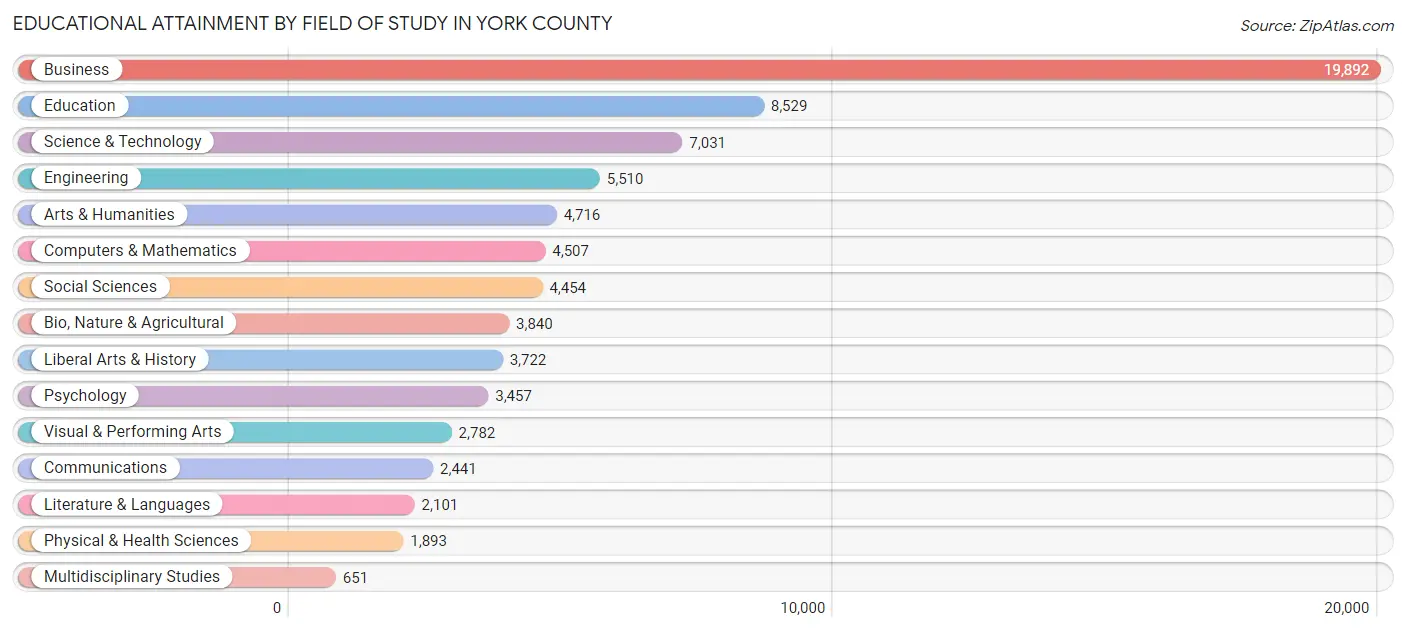
| Field of Study | # Graduates | % Graduates |
| Computers & Mathematics | 4,507 | 6.0% |
| Bio, Nature & Agricultural | 3,840 | 5.1% |
| Physical & Health Sciences | 1,893 | 2.5% |
| Psychology | 3,457 | 4.6% |
| Social Sciences | 4,454 | 5.9% |
| Engineering | 5,510 | 7.3% |
| Multidisciplinary Studies | 651 | 0.9% |
| Science & Technology | 7,031 | 9.3% |
| Business | 19,892 | 26.3% |
| Education | 8,529 | 11.3% |
| Literature & Languages | 2,101 | 2.8% |
| Liberal Arts & History | 3,722 | 4.9% |
| Visual & Performing Arts | 2,782 | 3.7% |
| Communications | 2,441 | 3.2% |
| Arts & Humanities | 4,716 | 6.2% |
| Total | 75,526 | 100.0% |
Transportation & Commute in York County
Vehicle Availability by Sex in York County
The most prevalent vehicle ownership categories in York County are males with 2 vehicles (32,246, accounting for 43.7%) and females with 2 vehicles (25,852, making up 49.5%).
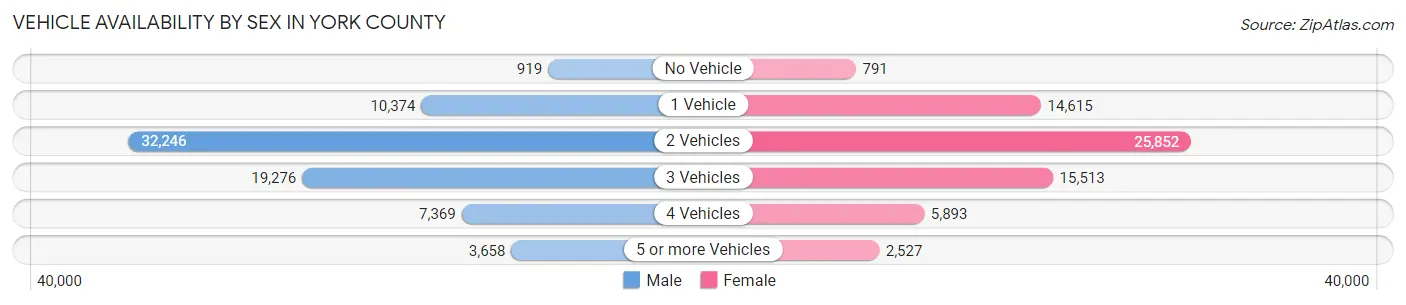
| Vehicles Available | Male | Female |
| No Vehicle | 919 (1.2%) | 791 (1.2%) |
| 1 Vehicle | 10,374 (14.1%) | 14,615 (22.4%) |
| 2 Vehicles | 32,246 (43.7%) | 25,852 (39.7%) |
| 3 Vehicles | 19,276 (26.1%) | 15,513 (23.8%) |
| 4 Vehicles | 7,369 (10.0%) | 5,893 (9.0%) |
| 5 or more Vehicles | 3,658 (5.0%) | 2,527 (3.9%) |
| Total | 73,842 (100.0%) | 65,191 (100.0%) |
Commute Time in York County
The most frequently occuring commute durations in York County are 15 to 19 minutes (18,130 commuters, 14.9%), 30 to 34 minutes (17,137 commuters, 14.1%), and 20 to 24 minutes (16,765 commuters, 13.8%).
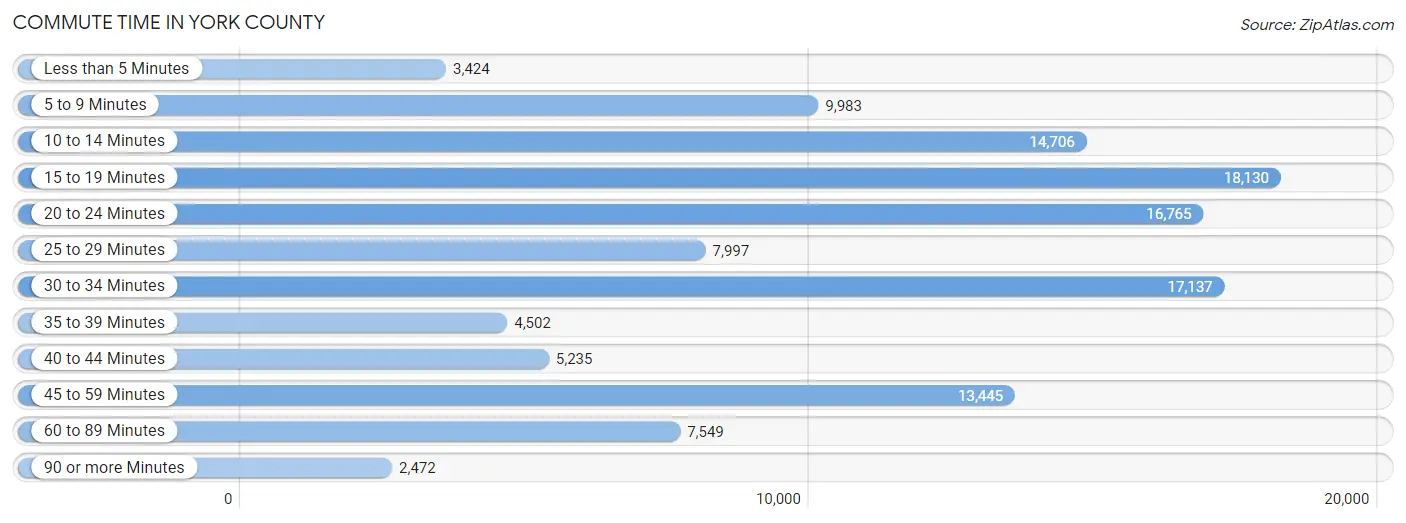
| Commute Time | # Commuters | % Commuters |
| Less than 5 Minutes | 3,424 | 2.8% |
| 5 to 9 Minutes | 9,983 | 8.2% |
| 10 to 14 Minutes | 14,706 | 12.1% |
| 15 to 19 Minutes | 18,130 | 14.9% |
| 20 to 24 Minutes | 16,765 | 13.8% |
| 25 to 29 Minutes | 7,997 | 6.6% |
| 30 to 34 Minutes | 17,137 | 14.1% |
| 35 to 39 Minutes | 4,502 | 3.7% |
| 40 to 44 Minutes | 5,235 | 4.3% |
| 45 to 59 Minutes | 13,445 | 11.1% |
| 60 to 89 Minutes | 7,549 | 6.2% |
| 90 or more Minutes | 2,472 | 2.0% |
Commute Time by Sex in York County
The most common commute times in York County are 20 to 24 minutes (9,639 commuters, 15.0%) for males and 15 to 19 minutes (9,228 commuters, 16.2%) for females.
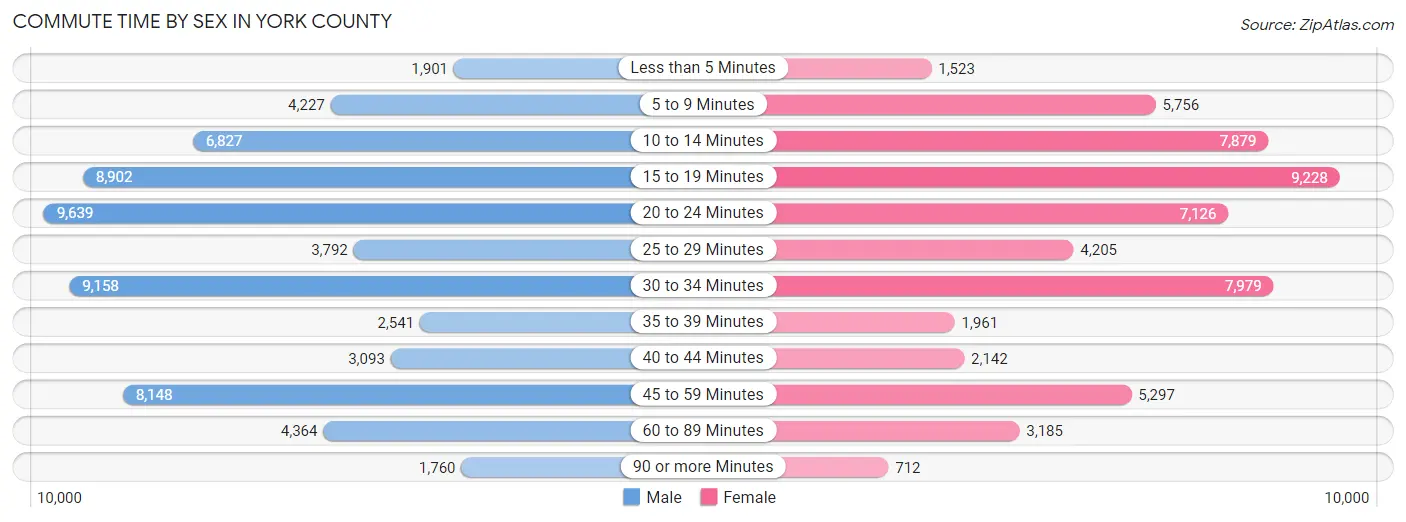
| Commute Time | Male | Female |
| Less than 5 Minutes | 1,901 (2.9%) | 1,523 (2.7%) |
| 5 to 9 Minutes | 4,227 (6.6%) | 5,756 (10.1%) |
| 10 to 14 Minutes | 6,827 (10.6%) | 7,879 (13.8%) |
| 15 to 19 Minutes | 8,902 (13.8%) | 9,228 (16.2%) |
| 20 to 24 Minutes | 9,639 (15.0%) | 7,126 (12.5%) |
| 25 to 29 Minutes | 3,792 (5.9%) | 4,205 (7.4%) |
| 30 to 34 Minutes | 9,158 (14.2%) | 7,979 (14.0%) |
| 35 to 39 Minutes | 2,541 (4.0%) | 1,961 (3.4%) |
| 40 to 44 Minutes | 3,093 (4.8%) | 2,142 (3.8%) |
| 45 to 59 Minutes | 8,148 (12.7%) | 5,297 (9.3%) |
| 60 to 89 Minutes | 4,364 (6.8%) | 3,185 (5.6%) |
| 90 or more Minutes | 1,760 (2.7%) | 712 (1.3%) |
Time of Departure to Work by Sex in York County
The most frequent times of departure to work in York County are 7:00 AM to 7:29 AM (9,230, 14.3%) for males and 7:00 AM to 7:29 AM (8,702, 15.3%) for females.
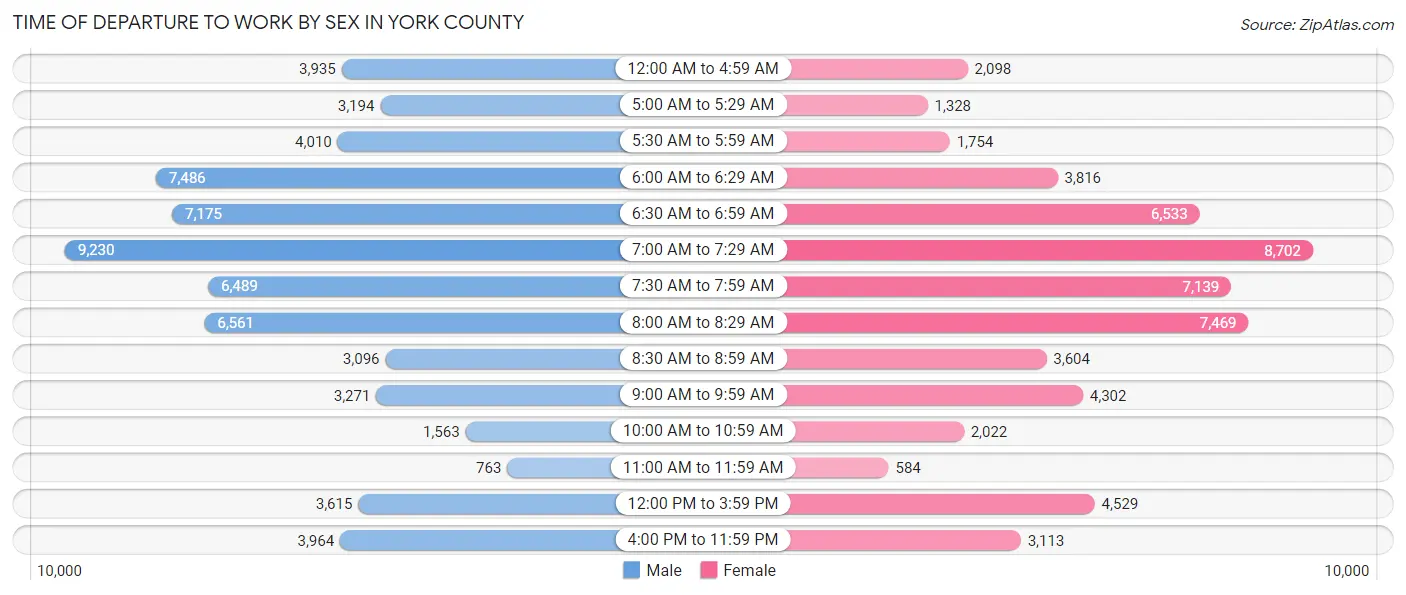
| Time of Departure | Male | Female |
| 12:00 AM to 4:59 AM | 3,935 (6.1%) | 2,098 (3.7%) |
| 5:00 AM to 5:29 AM | 3,194 (5.0%) | 1,328 (2.3%) |
| 5:30 AM to 5:59 AM | 4,010 (6.2%) | 1,754 (3.1%) |
| 6:00 AM to 6:29 AM | 7,486 (11.6%) | 3,816 (6.7%) |
| 6:30 AM to 6:59 AM | 7,175 (11.2%) | 6,533 (11.5%) |
| 7:00 AM to 7:29 AM | 9,230 (14.3%) | 8,702 (15.3%) |
| 7:30 AM to 7:59 AM | 6,489 (10.1%) | 7,139 (12.5%) |
| 8:00 AM to 8:29 AM | 6,561 (10.2%) | 7,469 (13.1%) |
| 8:30 AM to 8:59 AM | 3,096 (4.8%) | 3,604 (6.3%) |
| 9:00 AM to 9:59 AM | 3,271 (5.1%) | 4,302 (7.5%) |
| 10:00 AM to 10:59 AM | 1,563 (2.4%) | 2,022 (3.5%) |
| 11:00 AM to 11:59 AM | 763 (1.2%) | 584 (1.0%) |
| 12:00 PM to 3:59 PM | 3,615 (5.6%) | 4,529 (8.0%) |
| 4:00 PM to 11:59 PM | 3,964 (6.2%) | 3,113 (5.5%) |
| Total | 64,352 (100.0%) | 56,993 (100.0%) |
Housing Occupancy in York County
Occupancy by Ownership in York County
Of the total 109,013 dwellings in York County, owner-occupied units account for 79,206 (72.7%), while renter-occupied units make up 29,807 (27.3%).
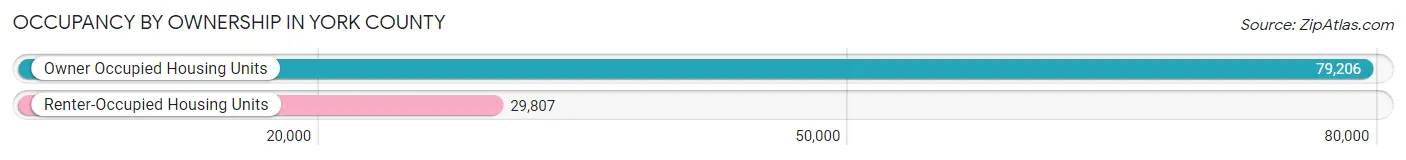
| Occupancy | # Housing Units | % Housing Units |
| Owner Occupied Housing Units | 79,206 | 72.7% |
| Renter-Occupied Housing Units | 29,807 | 27.3% |
| Total Occupied Housing Units | 109,013 | 100.0% |
Occupancy by Household Size in York County
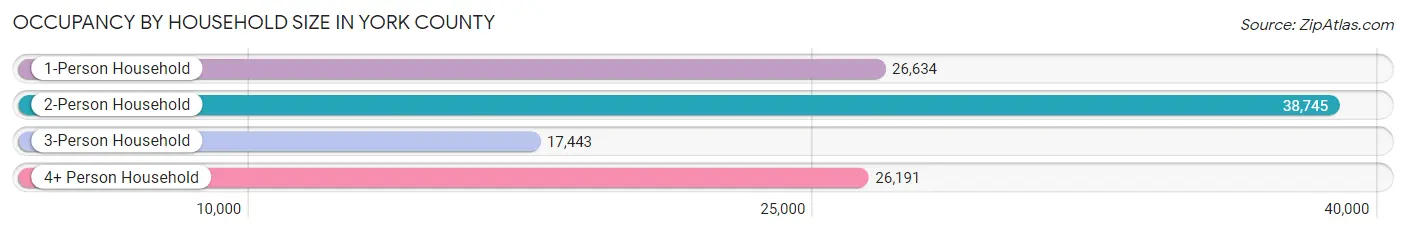
| Household Size | # Housing Units | % Housing Units |
| 1-Person Household | 26,634 | 24.4% |
| 2-Person Household | 38,745 | 35.5% |
| 3-Person Household | 17,443 | 16.0% |
| 4+ Person Household | 26,191 | 24.0% |
| Total Housing Units | 109,013 | 100.0% |
Occupancy by Ownership by Household Size in York County
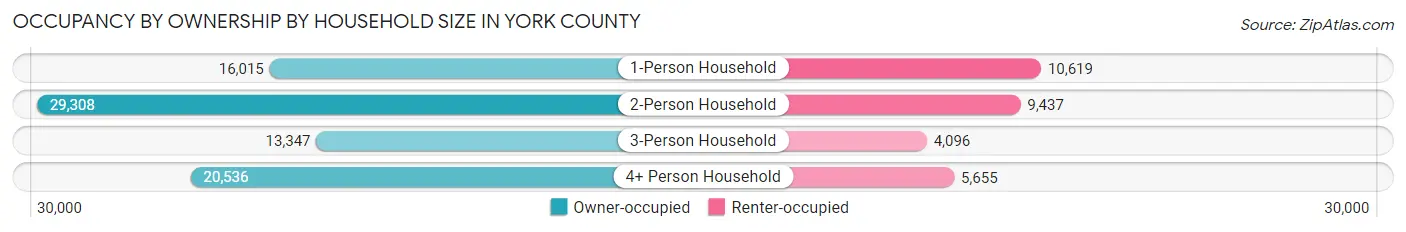
| Household Size | Owner-occupied | Renter-occupied |
| 1-Person Household | 16,015 (60.1%) | 10,619 (39.9%) |
| 2-Person Household | 29,308 (75.6%) | 9,437 (24.4%) |
| 3-Person Household | 13,347 (76.5%) | 4,096 (23.5%) |
| 4+ Person Household | 20,536 (78.4%) | 5,655 (21.6%) |
| Total Housing Units | 79,206 (72.7%) | 29,807 (27.3%) |
Occupancy by Educational Attainment in York County
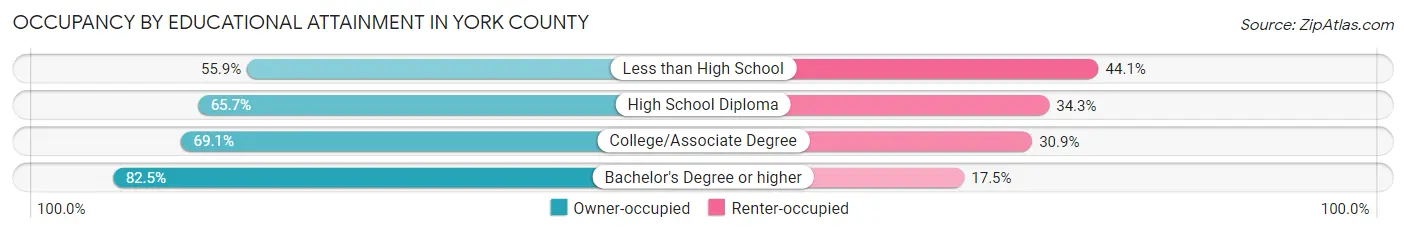
| Household Size | Owner-occupied | Renter-occupied |
| Less than High School | 3,953 (55.9%) | 3,120 (44.1%) |
| High School Diploma | 15,771 (65.7%) | 8,246 (34.3%) |
| College/Associate Degree | 24,728 (69.1%) | 11,077 (30.9%) |
| Bachelor's Degree or higher | 34,754 (82.5%) | 7,364 (17.5%) |
Occupancy by Age of Householder in York County
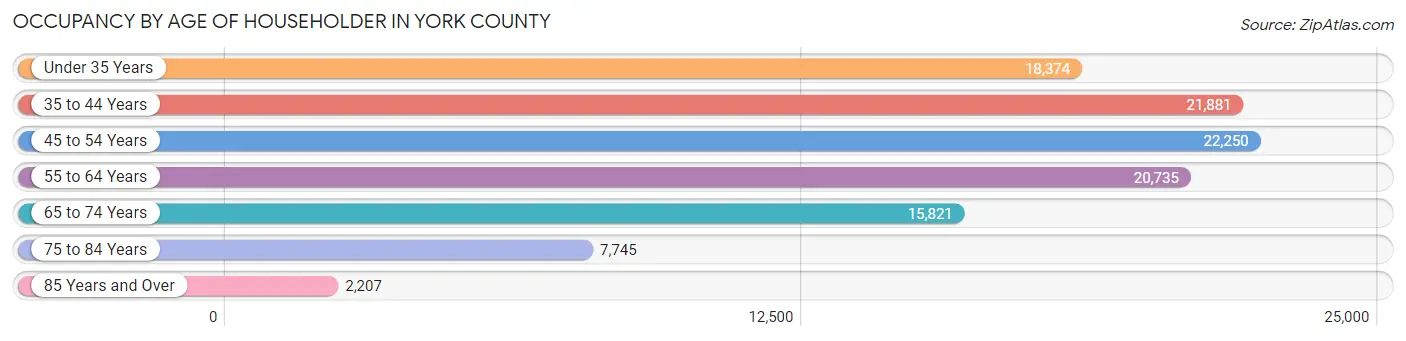
| Age Bracket | # Households | % Households |
| Under 35 Years | 18,374 | 16.9% |
| 35 to 44 Years | 21,881 | 20.1% |
| 45 to 54 Years | 22,250 | 20.4% |
| 55 to 64 Years | 20,735 | 19.0% |
| 65 to 74 Years | 15,821 | 14.5% |
| 75 to 84 Years | 7,745 | 7.1% |
| 85 Years and Over | 2,207 | 2.0% |
| Total | 109,013 | 100.0% |
Housing Finances in York County
Median Income by Occupancy in York County
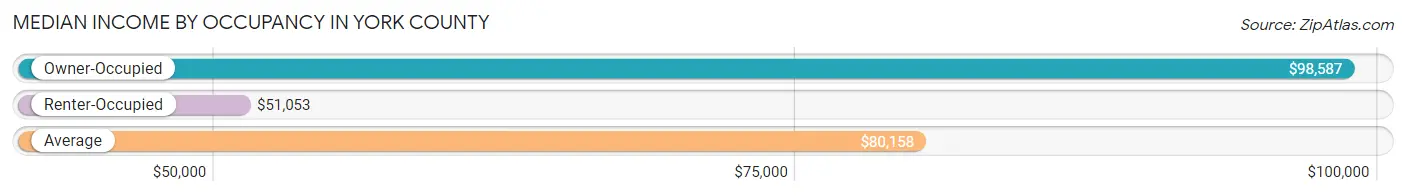
| Occupancy Type | # Households | Median Income |
| Owner-Occupied | 79,206 (72.7%) | $98,587 |
| Renter-Occupied | 29,807 (27.3%) | $51,053 |
| Average | 109,013 (100.0%) | $80,158 |
Occupancy by Householder Income Bracket in York County
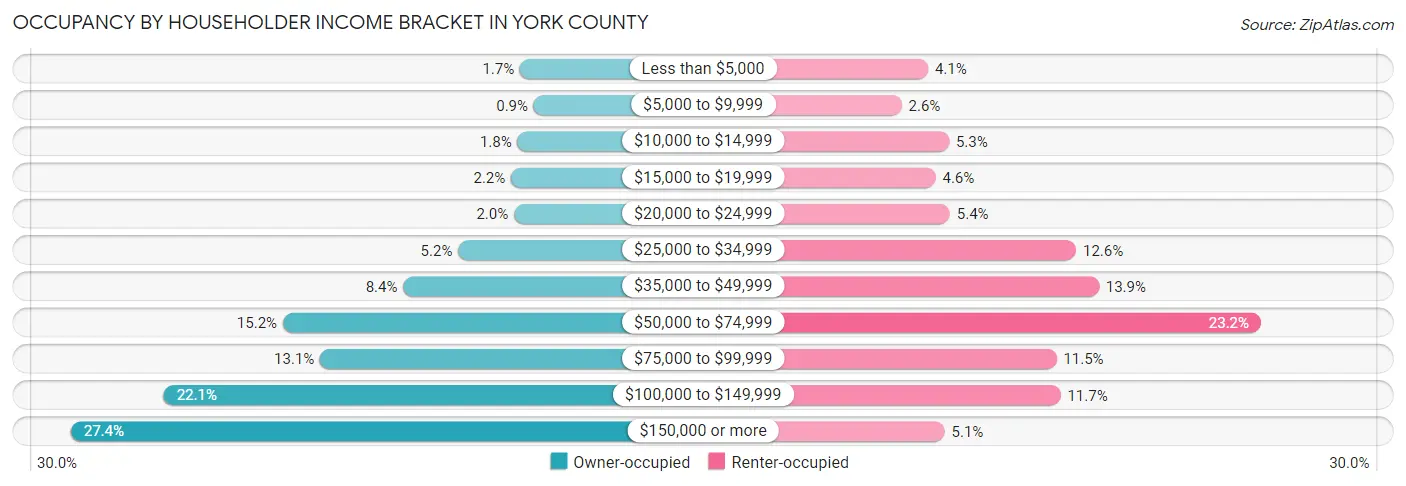
| Income Bracket | Owner-occupied | Renter-occupied |
| Less than $5,000 | 1,341 (1.7%) | 1,234 (4.1%) |
| $5,000 to $9,999 | 716 (0.9%) | 784 (2.6%) |
| $10,000 to $14,999 | 1,452 (1.8%) | 1,592 (5.3%) |
| $15,000 to $19,999 | 1,743 (2.2%) | 1,361 (4.6%) |
| $20,000 to $24,999 | 1,606 (2.0%) | 1,606 (5.4%) |
| $25,000 to $34,999 | 4,138 (5.2%) | 3,755 (12.6%) |
| $35,000 to $49,999 | 6,619 (8.4%) | 4,142 (13.9%) |
| $50,000 to $74,999 | 12,074 (15.2%) | 6,904 (23.2%) |
| $75,000 to $99,999 | 10,381 (13.1%) | 3,421 (11.5%) |
| $100,000 to $149,999 | 17,467 (22.1%) | 3,490 (11.7%) |
| $150,000 or more | 21,669 (27.4%) | 1,518 (5.1%) |
| Total | 79,206 (100.0%) | 29,807 (100.0%) |
Monthly Housing Cost Tiers in York County
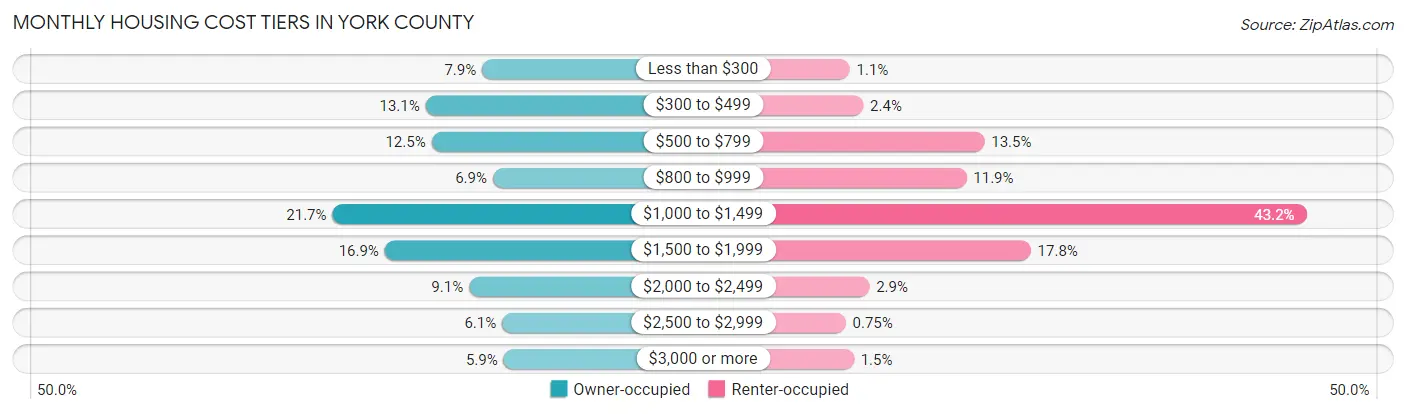
| Monthly Cost | Owner-occupied | Renter-occupied |
| Less than $300 | 6,248 (7.9%) | 334 (1.1%) |
| $300 to $499 | 10,367 (13.1%) | 707 (2.4%) |
| $500 to $799 | 9,936 (12.5%) | 4,029 (13.5%) |
| $800 to $999 | 5,465 (6.9%) | 3,538 (11.9%) |
| $1,000 to $1,499 | 17,167 (21.7%) | 12,867 (43.2%) |
| $1,500 to $1,999 | 13,346 (16.9%) | 5,303 (17.8%) |
| $2,000 to $2,499 | 7,203 (9.1%) | 872 (2.9%) |
| $2,500 to $2,999 | 4,794 (6.0%) | 223 (0.7%) |
| $3,000 or more | 4,680 (5.9%) | 446 (1.5%) |
| Total | 79,206 (100.0%) | 29,807 (100.0%) |
Physical Housing Characteristics in York County
Housing Structures in York County
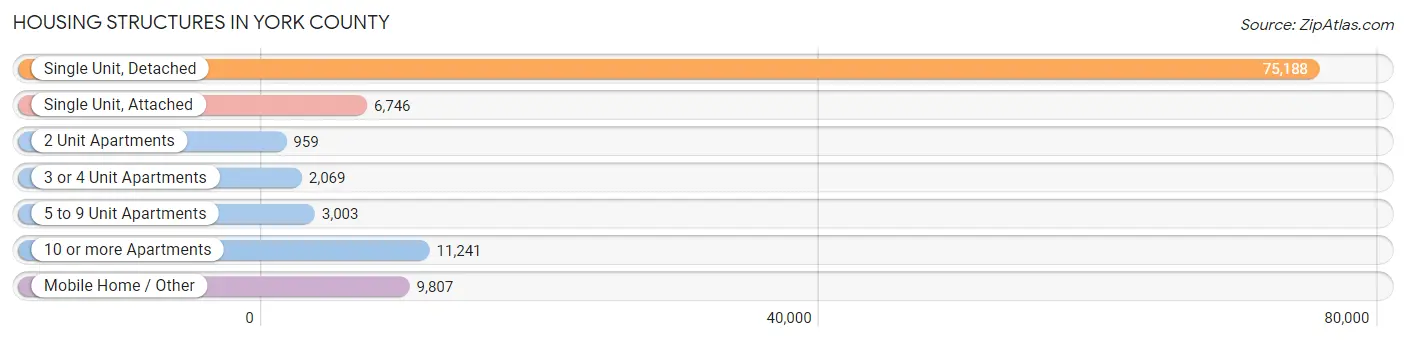
| Structure Type | # Housing Units | % Housing Units |
| Single Unit, Detached | 75,188 | 69.0% |
| Single Unit, Attached | 6,746 | 6.2% |
| 2 Unit Apartments | 959 | 0.9% |
| 3 or 4 Unit Apartments | 2,069 | 1.9% |
| 5 to 9 Unit Apartments | 3,003 | 2.8% |
| 10 or more Apartments | 11,241 | 10.3% |
| Mobile Home / Other | 9,807 | 9.0% |
| Total | 109,013 | 100.0% |
Housing Structures by Occupancy in York County
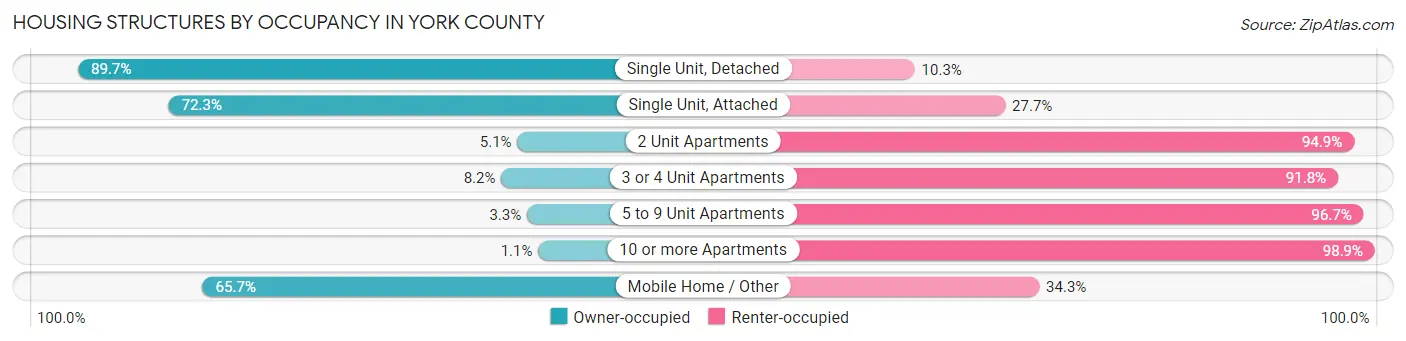
| Structure Type | Owner-occupied | Renter-occupied |
| Single Unit, Detached | 67,443 (89.7%) | 7,745 (10.3%) |
| Single Unit, Attached | 4,876 (72.3%) | 1,870 (27.7%) |
| 2 Unit Apartments | 49 (5.1%) | 910 (94.9%) |
| 3 or 4 Unit Apartments | 170 (8.2%) | 1,899 (91.8%) |
| 5 to 9 Unit Apartments | 98 (3.3%) | 2,905 (96.7%) |
| 10 or more Apartments | 124 (1.1%) | 11,117 (98.9%) |
| Mobile Home / Other | 6,446 (65.7%) | 3,361 (34.3%) |
| Total | 79,206 (72.7%) | 29,807 (27.3%) |
Housing Structures by Number of Rooms in York County
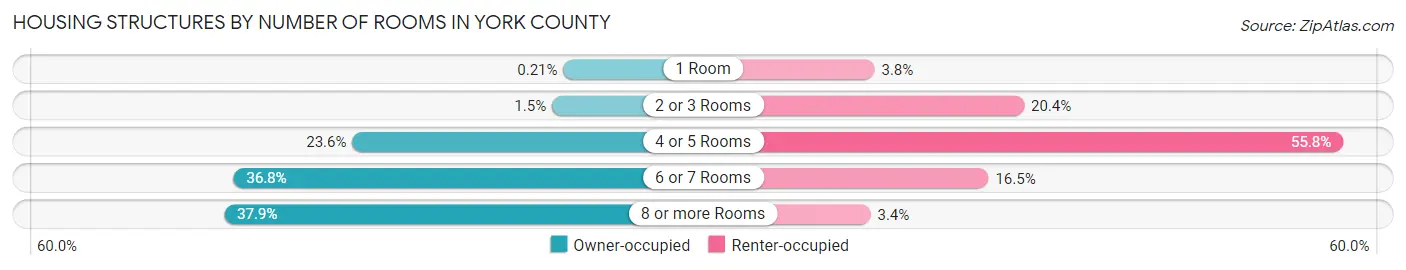
| Number of Rooms | Owner-occupied | Renter-occupied |
| 1 Room | 167 (0.2%) | 1,145 (3.8%) |
| 2 or 3 Rooms | 1,166 (1.5%) | 6,089 (20.4%) |
| 4 or 5 Rooms | 18,714 (23.6%) | 16,644 (55.8%) |
| 6 or 7 Rooms | 29,174 (36.8%) | 4,916 (16.5%) |
| 8 or more Rooms | 29,985 (37.9%) | 1,013 (3.4%) |
| Total | 79,206 (100.0%) | 29,807 (100.0%) |
Housing Structure by Heating Type in York County
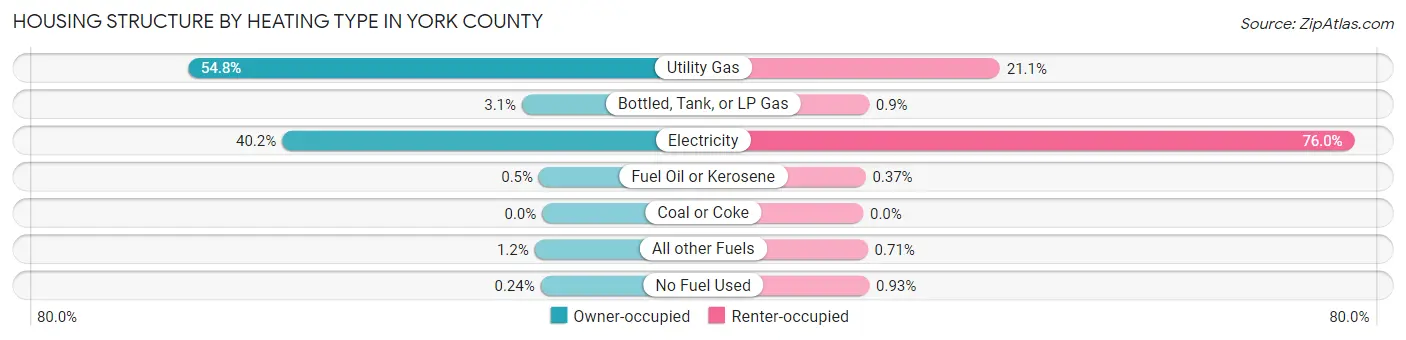
| Heating Type | Owner-occupied | Renter-occupied |
| Utility Gas | 43,367 (54.7%) | 6,300 (21.1%) |
| Bottled, Tank, or LP Gas | 2,483 (3.1%) | 268 (0.9%) |
| Electricity | 31,839 (40.2%) | 22,642 (76.0%) |
| Fuel Oil or Kerosene | 394 (0.5%) | 110 (0.4%) |
| Coal or Coke | 0 (0.0%) | 0 (0.0%) |
| All other Fuels | 930 (1.2%) | 211 (0.7%) |
| No Fuel Used | 193 (0.2%) | 276 (0.9%) |
| Total | 79,206 (100.0%) | 29,807 (100.0%) |
Household Vehicle Usage in York County
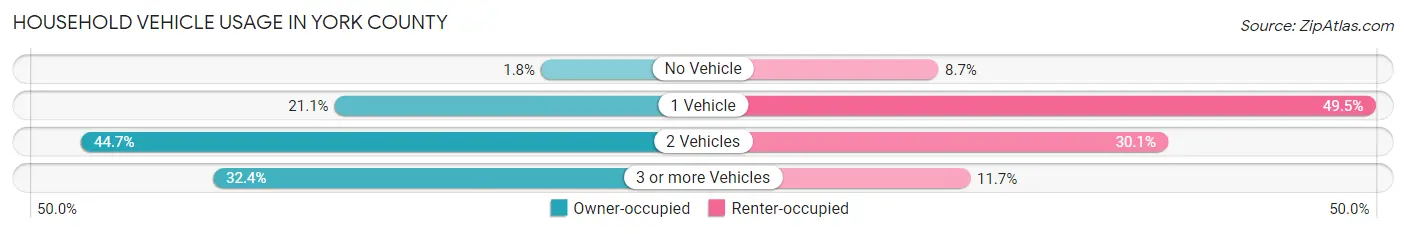
| Vehicles per Household | Owner-occupied | Renter-occupied |
| No Vehicle | 1,431 (1.8%) | 2,592 (8.7%) |
| 1 Vehicle | 16,695 (21.1%) | 14,752 (49.5%) |
| 2 Vehicles | 35,417 (44.7%) | 8,982 (30.1%) |
| 3 or more Vehicles | 25,663 (32.4%) | 3,481 (11.7%) |
| Total | 79,206 (100.0%) | 29,807 (100.0%) |
Real Estate & Mortgages in York County
Real Estate and Mortgage Overview in York County
| Characteristic | Without Mortgage | With Mortgage |
| Housing Units | 25,018 | 54,188 |
| Median Property Value | $224,000 | $314,300 |
| Median Household Income | $61,343 | $18,030 |
| Monthly Housing Costs | $412 | $4,671 |
| Real Estate Taxes | $1,103 | $1,312 |
Property Value by Mortgage Status in York County
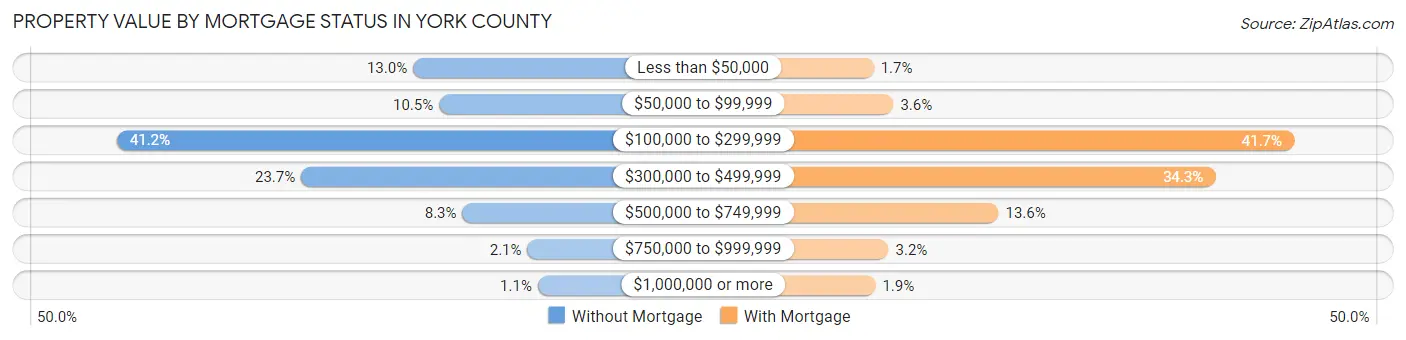
| Property Value | Without Mortgage | With Mortgage |
| Less than $50,000 | 3,255 (13.0%) | 935 (1.7%) |
| $50,000 to $99,999 | 2,635 (10.5%) | 1,957 (3.6%) |
| $100,000 to $299,999 | 10,313 (41.2%) | 22,616 (41.7%) |
| $300,000 to $499,999 | 5,922 (23.7%) | 18,560 (34.3%) |
| $500,000 to $749,999 | 2,079 (8.3%) | 7,381 (13.6%) |
| $750,000 to $999,999 | 531 (2.1%) | 1,707 (3.2%) |
| $1,000,000 or more | 283 (1.1%) | 1,032 (1.9%) |
| Total | 25,018 (100.0%) | 54,188 (100.0%) |
Household Income by Mortgage Status in York County
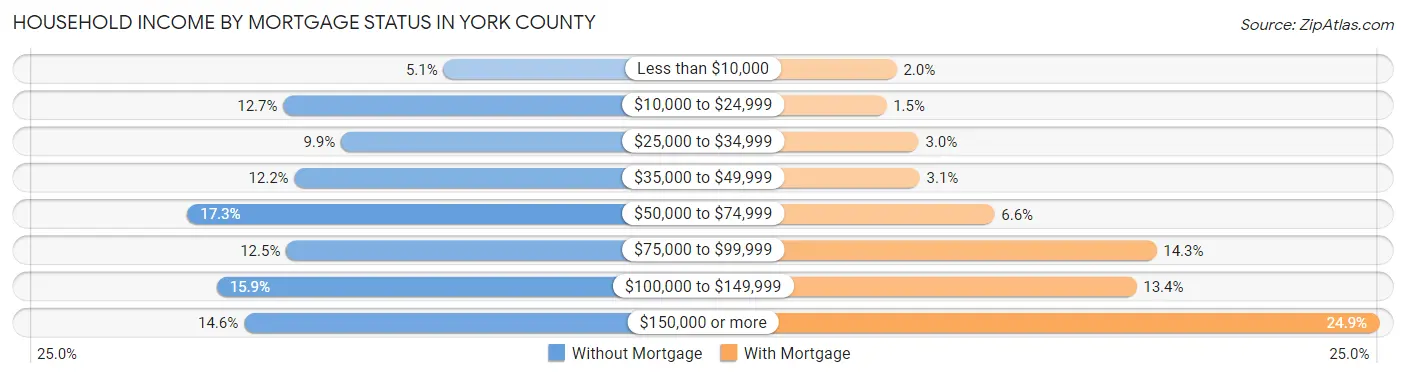
| Household Income | Without Mortgage | With Mortgage |
| Less than $10,000 | 1,264 (5.1%) | 1,058 (1.9%) |
| $10,000 to $24,999 | 3,173 (12.7%) | 793 (1.5%) |
| $25,000 to $34,999 | 2,485 (9.9%) | 1,628 (3.0%) |
| $35,000 to $49,999 | 3,039 (12.1%) | 1,653 (3.0%) |
| $50,000 to $74,999 | 4,316 (17.2%) | 3,580 (6.6%) |
| $75,000 to $99,999 | 3,137 (12.5%) | 7,758 (14.3%) |
| $100,000 to $149,999 | 3,965 (15.9%) | 7,244 (13.4%) |
| $150,000 or more | 3,639 (14.5%) | 13,502 (24.9%) |
| Total | 25,018 (100.0%) | 54,188 (100.0%) |
Property Value to Household Income Ratio in York County
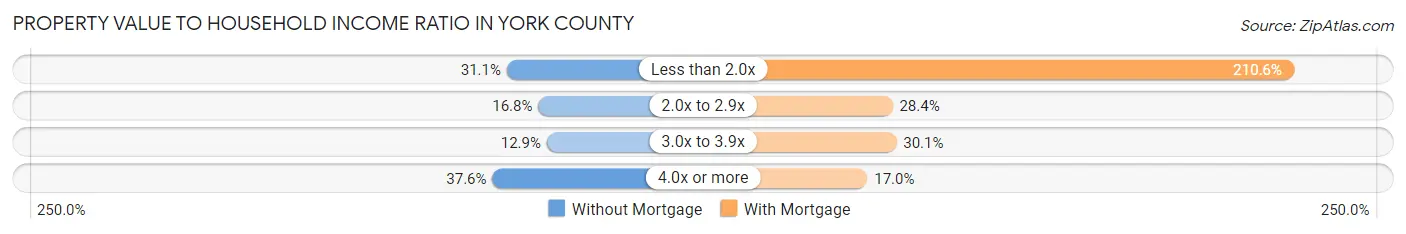
| Value-to-Income Ratio | Without Mortgage | With Mortgage |
| Less than 2.0x | 7,775 (31.1%) | 114,123 (210.6%) |
| 2.0x to 2.9x | 4,198 (16.8%) | 15,393 (28.4%) |
| 3.0x to 3.9x | 3,230 (12.9%) | 16,329 (30.1%) |
| 4.0x or more | 9,410 (37.6%) | 9,208 (17.0%) |
| Total | 25,018 (100.0%) | 54,188 (100.0%) |
Real Estate Taxes by Mortgage Status in York County
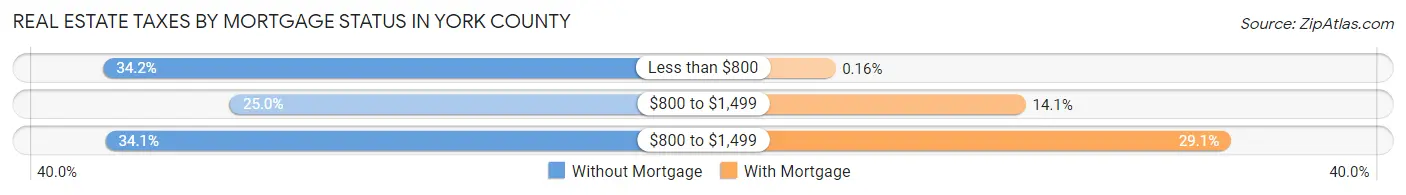
| Property Taxes | Without Mortgage | With Mortgage |
| Less than $800 | 8,566 (34.2%) | 84 (0.2%) |
| $800 to $1,499 | 6,252 (25.0%) | 7,623 (14.1%) |
| $800 to $1,499 | 8,525 (34.1%) | 15,754 (29.1%) |
| Total | 25,018 (100.0%) | 54,188 (100.0%) |
Health & Disability in York County
Health Insurance Coverage by Age in York County
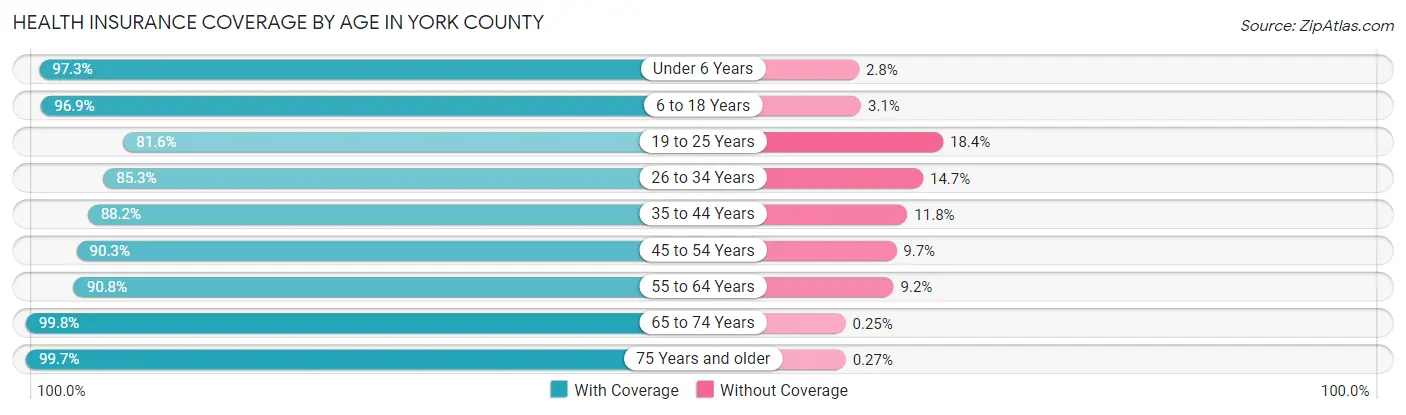
| Age Bracket | With Coverage | Without Coverage |
| Under 6 Years | 18,988 (97.3%) | 536 (2.8%) |
| 6 to 18 Years | 50,007 (96.9%) | 1,615 (3.1%) |
| 19 to 25 Years | 18,711 (81.6%) | 4,224 (18.4%) |
| 26 to 34 Years | 26,234 (85.3%) | 4,518 (14.7%) |
| 35 to 44 Years | 35,425 (88.2%) | 4,724 (11.8%) |
| 45 to 54 Years | 35,556 (90.3%) | 3,824 (9.7%) |
| 55 to 64 Years | 32,390 (90.8%) | 3,277 (9.2%) |
| 65 to 74 Years | 26,045 (99.8%) | 65 (0.3%) |
| 75 Years and older | 14,907 (99.7%) | 41 (0.3%) |
| Total | 258,263 (91.9%) | 22,824 (8.1%) |
Health Insurance Coverage by Citizenship Status in York County
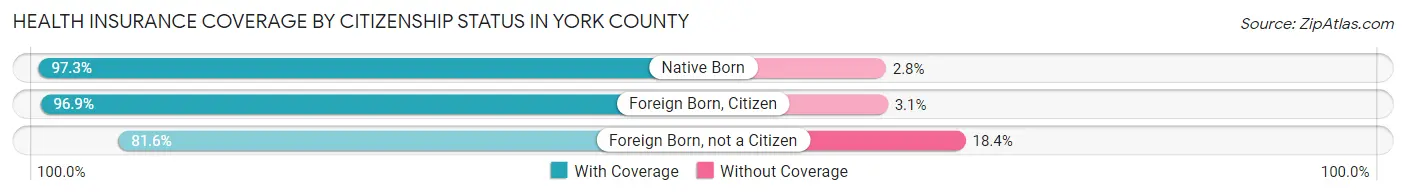
| Citizenship Status | With Coverage | Without Coverage |
| Native Born | 18,988 (97.3%) | 536 (2.8%) |
| Foreign Born, Citizen | 50,007 (96.9%) | 1,615 (3.1%) |
| Foreign Born, not a Citizen | 18,711 (81.6%) | 4,224 (18.4%) |
Health Insurance Coverage by Household Income in York County
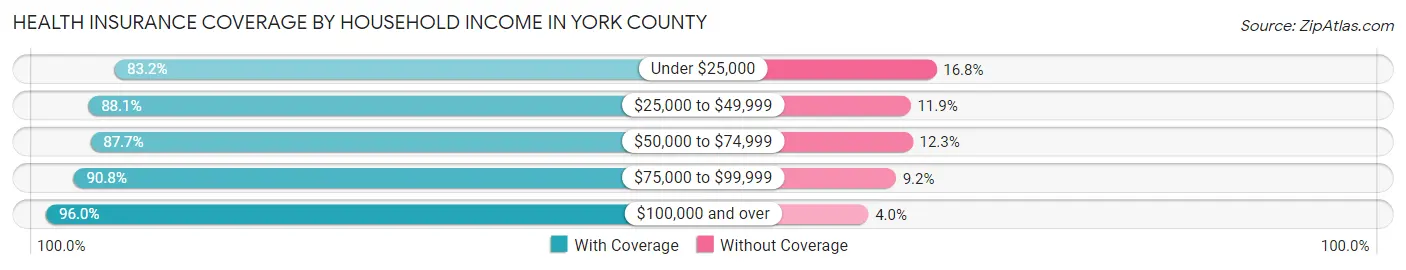
| Household Income | With Coverage | Without Coverage |
| Under $25,000 | 18,459 (83.2%) | 3,718 (16.8%) |
| $25,000 to $49,999 | 32,901 (88.1%) | 4,456 (11.9%) |
| $50,000 to $74,999 | 38,661 (87.7%) | 5,428 (12.3%) |
| $75,000 to $99,999 | 34,558 (90.8%) | 3,487 (9.2%) |
| $100,000 and over | 131,268 (96.0%) | 5,503 (4.0%) |
Public vs Private Health Insurance Coverage by Age in York County
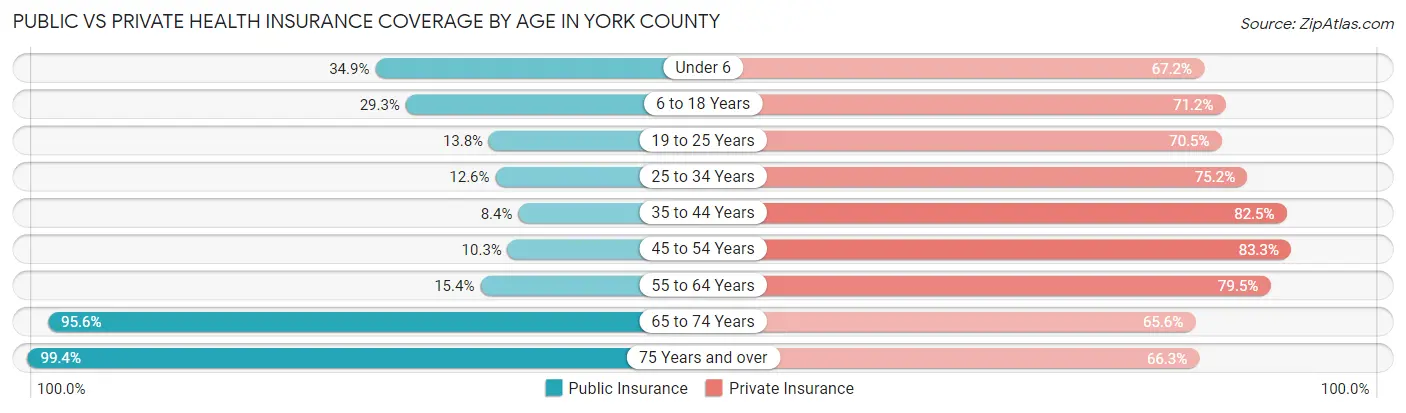
| Age Bracket | Public Insurance | Private Insurance |
| Under 6 | 6,818 (34.9%) | 13,120 (67.2%) |
| 6 to 18 Years | 15,105 (29.3%) | 36,739 (71.2%) |
| 19 to 25 Years | 3,167 (13.8%) | 16,157 (70.5%) |
| 25 to 34 Years | 3,880 (12.6%) | 23,126 (75.2%) |
| 35 to 44 Years | 3,356 (8.4%) | 33,127 (82.5%) |
| 45 to 54 Years | 4,070 (10.3%) | 32,817 (83.3%) |
| 55 to 64 Years | 5,503 (15.4%) | 28,357 (79.5%) |
| 65 to 74 Years | 24,970 (95.6%) | 17,117 (65.6%) |
| 75 Years and over | 14,864 (99.4%) | 9,911 (66.3%) |
| Total | 81,733 (29.1%) | 210,471 (74.9%) |
Disability Status by Sex by Age in York County
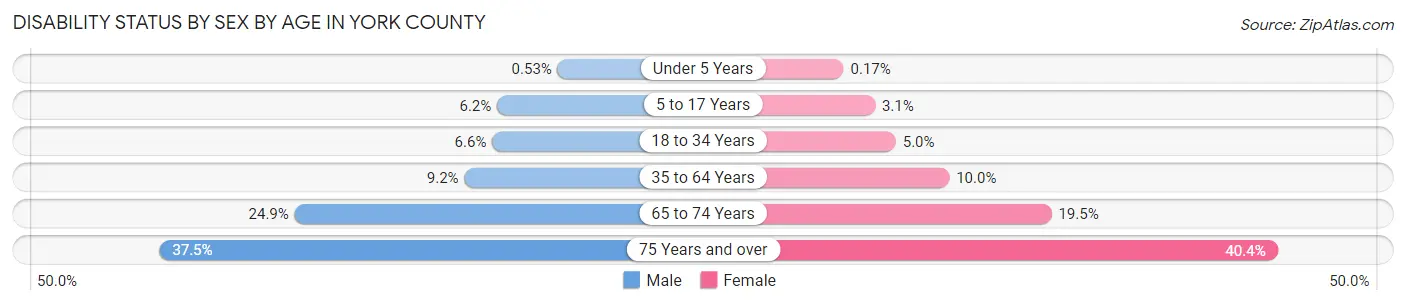
| Age Bracket | Male | Female |
| Under 5 Years | 43 (0.5%) | 13 (0.2%) |
| 5 to 17 Years | 1,607 (6.1%) | 779 (3.1%) |
| 18 to 34 Years | 1,814 (6.6%) | 1,507 (5.0%) |
| 35 to 64 Years | 5,176 (9.2%) | 5,867 (10.0%) |
| 65 to 74 Years | 2,985 (24.9%) | 2,752 (19.5%) |
| 75 Years and over | 2,389 (37.5%) | 3,467 (40.4%) |
Disability Class by Sex by Age in York County
Disability Class: Hearing Difficulty
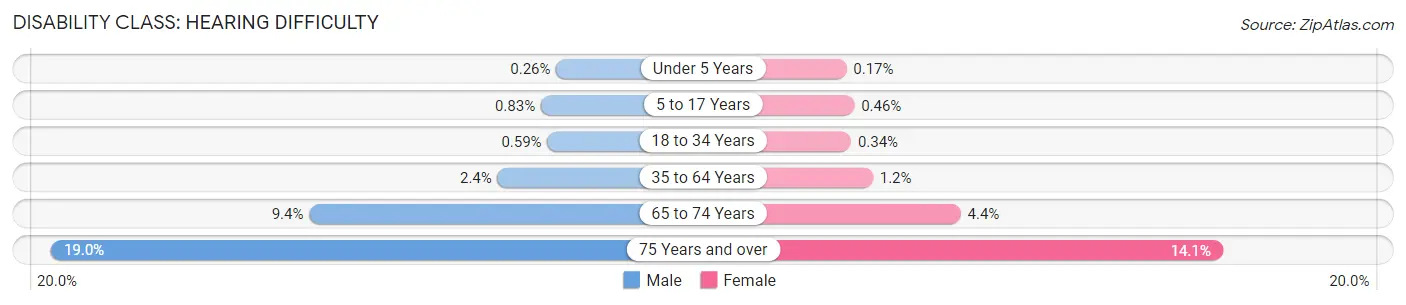
| Age Bracket | Male | Female |
| Under 5 Years | 21 (0.3%) | 13 (0.2%) |
| 5 to 17 Years | 217 (0.8%) | 116 (0.5%) |
| 18 to 34 Years | 162 (0.6%) | 103 (0.3%) |
| 35 to 64 Years | 1,373 (2.4%) | 675 (1.1%) |
| 65 to 74 Years | 1,129 (9.4%) | 623 (4.4%) |
| 75 Years and over | 1,212 (19.0%) | 1,213 (14.1%) |
Disability Class: Vision Difficulty
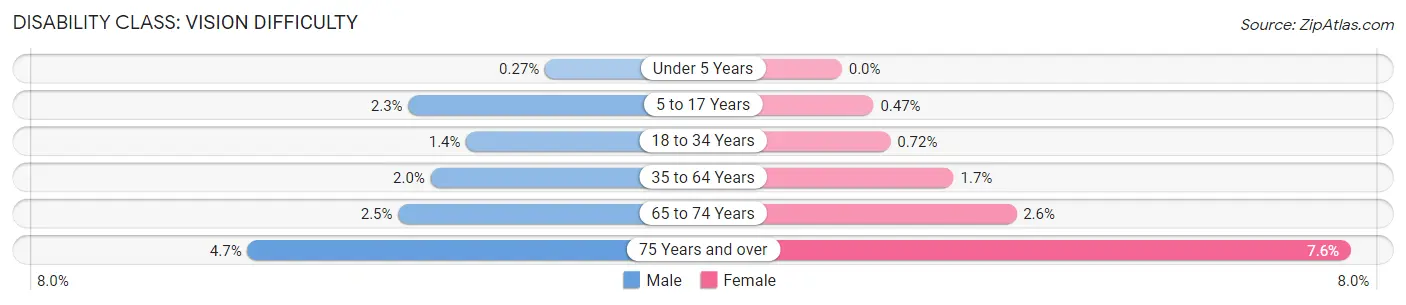
| Age Bracket | Male | Female |
| Under 5 Years | 22 (0.3%) | 0 (0.0%) |
| 5 to 17 Years | 602 (2.3%) | 119 (0.5%) |
| 18 to 34 Years | 396 (1.4%) | 217 (0.7%) |
| 35 to 64 Years | 1,109 (2.0%) | 976 (1.7%) |
| 65 to 74 Years | 293 (2.5%) | 366 (2.6%) |
| 75 Years and over | 299 (4.7%) | 648 (7.6%) |
Disability Class: Cognitive Difficulty
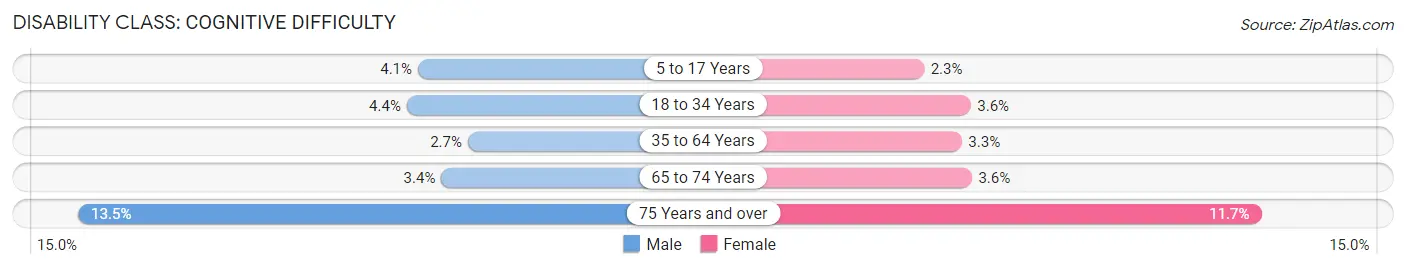
| Age Bracket | Male | Female |
| 5 to 17 Years | 1,059 (4.1%) | 575 (2.3%) |
| 18 to 34 Years | 1,198 (4.4%) | 1,079 (3.6%) |
| 35 to 64 Years | 1,497 (2.7%) | 1,959 (3.3%) |
| 65 to 74 Years | 407 (3.4%) | 510 (3.6%) |
| 75 Years and over | 861 (13.5%) | 1,002 (11.7%) |
Disability Class: Ambulatory Difficulty
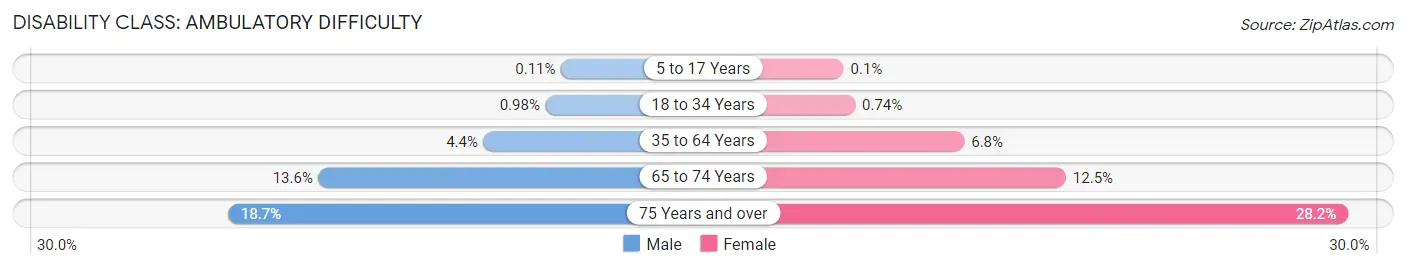
| Age Bracket | Male | Female |
| 5 to 17 Years | 28 (0.1%) | 26 (0.1%) |
| 18 to 34 Years | 269 (1.0%) | 224 (0.7%) |
| 35 to 64 Years | 2,495 (4.4%) | 4,013 (6.8%) |
| 65 to 74 Years | 1,630 (13.6%) | 1,765 (12.5%) |
| 75 Years and over | 1,190 (18.7%) | 2,418 (28.2%) |
Disability Class: Self-Care Difficulty
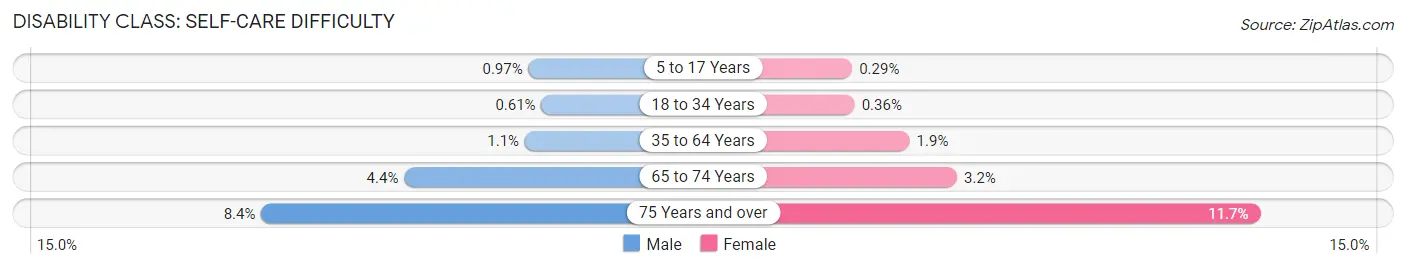
| Age Bracket | Male | Female |
| 5 to 17 Years | 254 (1.0%) | 74 (0.3%) |
| 18 to 34 Years | 167 (0.6%) | 108 (0.4%) |
| 35 to 64 Years | 605 (1.1%) | 1,114 (1.9%) |
| 65 to 74 Years | 530 (4.4%) | 454 (3.2%) |
| 75 Years and over | 536 (8.4%) | 999 (11.7%) |
Technology Access in York County
Computing Device Access in York County
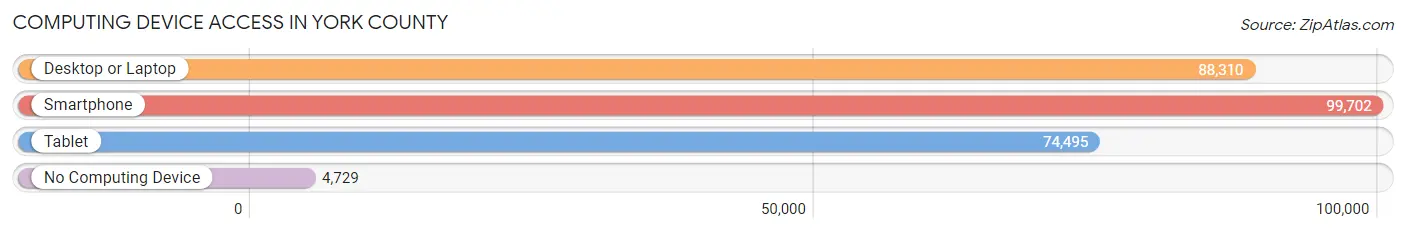
| Device Type | # Households | % Households |
| Desktop or Laptop | 88,310 | 81.0% |
| Smartphone | 99,702 | 91.5% |
| Tablet | 74,495 | 68.3% |
| No Computing Device | 4,729 | 4.3% |
| Total | 109,013 | 100.0% |
Internet Access in York County
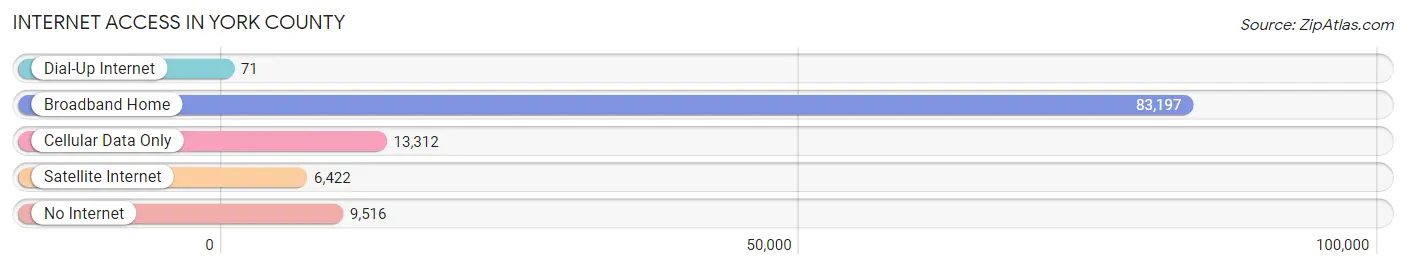
| Internet Type | # Households | % Households |
| Dial-Up Internet | 71 | 0.1% |
| Broadband Home | 83,197 | 76.3% |
| Cellular Data Only | 13,312 | 12.2% |
| Satellite Internet | 6,422 | 5.9% |
| No Internet | 9,516 | 8.7% |
| Total | 109,013 | 100.0% |
York County Summary
York County, South Carolina is located in the north-central part of the state, and is part of the Charlotte metropolitan area. It is bordered by Lancaster County to the north, Chester County to the east, Union County to the south, and Mecklenburg County to the west. The county seat is York, and the largest city is Rock Hill.
History
York County was established in 1785, and was named for the city of York in England. The county was originally part of the Catawba Nation, and was later part of the Cherokee Nation. The first European settlers arrived in the area in the late 1700s, and the county was officially established in 1785.
During the American Revolution, the county was the site of several battles, including the Battle of Huck’s Defeat in 1780. After the war, the county grew rapidly, and by the mid-1800s, it was one of the most prosperous counties in the state.
In the late 1800s, the county was the site of several major textile mills, and the economy was largely based on agriculture and manufacturing. The county also became a major center for education, with several colleges and universities being established in the area.
Geography
York County covers an area of 545 square miles, and is located in the Piedmont region of South Carolina. The terrain is mostly rolling hills, with the Catawba River running through the county. The county is home to several state parks, including Kings Mountain State Park and Landsford Canal State Park.
The climate of York County is humid subtropical, with hot, humid summers and mild winters. The average annual temperature is around 64°F, and the average annual precipitation is around 45 inches.
Economy
The economy of York County is largely based on manufacturing, agriculture, and tourism. The county is home to several major manufacturing companies, including 3M, Continental Tire, and Rockwell Automation. The county is also home to several large agricultural operations, including poultry, beef, and dairy farms.
Tourism is also an important part of the economy, with several popular attractions, including Carowinds amusement park, the Catawba Cultural Center, and the Kings Mountain National Military Park.
Demographics
As of the 2010 census, York County had a population of 226,073. The racial makeup of the county was 79.2% White, 16.2% African American, 0.7% Native American, 1.7% Asian, 0.2% Pacific Islander, and 1.9% from other races. Hispanic or Latino of any race were 4.2% of the population.
The median household income in York County was $50,837, and the median family income was $60,945. The per capita income was $25,945. About 8.7% of the population was below the poverty line.
York County is served by several school districts, including the York County School District, the Clover School District, and the Rock Hill School District. The county is also home to several colleges and universities, including Winthrop University, York Technical College, and Clinton Junior College.
Common Questions
What is Per Capita Income in York County?
Per Capita income in York County is $41,486.
What is the Median Family Income in York County?
Median Family Income in York County is $102,752.
What is the Median Household income in York County?
Median Household Income in York County is $80,158.
What is Income or Wage Gap in York County?
Income or Wage Gap in York County is 30.3%.
Women in York County earn 69.7 cents for every dollar earned by a man.
What is Family Income Deficit in York County?
Family Income Deficit in York County is $10,592.
Families that are below poverty line in York County earn $10,592 less on average than the poverty threshold level.
What is Inequality or Gini Index in York County?
Inequality or Gini Index in York County is 0.44.
What is the Total Population of York County?
Total Population of York County is 282,987.
What is the Total Male Population of York County?
Total Male Population of York County is 137,720.
What is the Total Female Population of York County?
Total Female Population of York County is 145,267.
What is the Ratio of Males per 100 Females in York County?
There are 94.80 Males per 100 Females in York County.
What is the Ratio of Females per 100 Males in York County?
There are 105.48 Females per 100 Males in York County.
What is the Median Population Age in York County?
Median Population Age in York County is 39.2 Years.
What is the Average Family Size in York County
Average Family Size in York County is 3.0 People.
What is the Average Household Size in York County
Average Household Size in York County is 2.6 People.
How Large is the Labor Force in York County?
There are 149,336 People in the Labor Forcein in York County.
What is the Percentage of People in the Labor Force in York County?
66.9% of People are in the Labor Force in York County.
What is the Unemployment Rate in York County?
Unemployment Rate in York County is 4.7%.