Cities with the Most Immigrants from Philippines in the United States
RELATED REPORTS & OPTIONS
Philippines
United States
Compare Cities
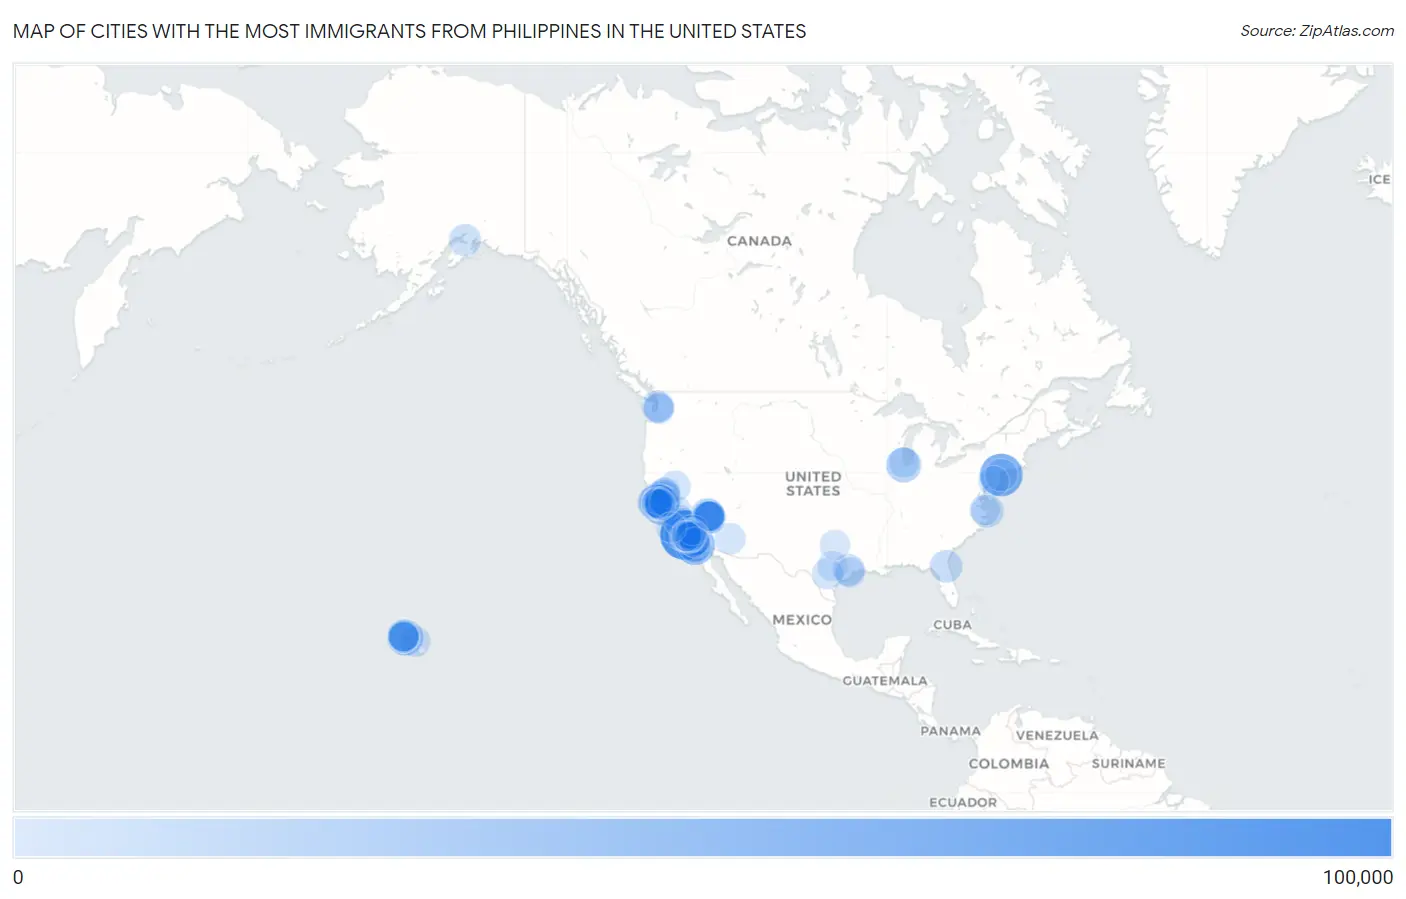
Map of Cities with the Most Immigrants from Philippines in the United States
0
100,000
Cities with the Most Immigrants from Philippines in the United States
| City | Philippines | vs State | vs National | |
| 1. | Los Angeles | 88,766 | 818,297(10.85%)#1 | 1,985,710(4.47%)#1 |
| 2. | New York | 57,191 | 91,070(62.80%)#1 | 1,985,710(2.88%)#2 |
| 3. | San Diego | 43,910 | 818,297(5.37%)#2 | 1,985,710(2.21%)#3 |
| 4. | San Jose | 32,743 | 818,297(4.00%)#3 | 1,985,710(1.65%)#4 |
| 5. | Urban Honolulu | 28,269 | 115,679(24.44%)#1 | 1,985,710(1.42%)#5 |
| 6. | Chicago | 22,260 | 93,003(23.93%)#1 | 1,985,710(1.12%)#6 |
| 7. | San Francisco | 22,080 | 818,297(2.70%)#4 | 1,985,710(1.11%)#7 |
| 8. | Daly City | 21,000 | 818,297(2.57%)#5 | 1,985,710(1.06%)#8 |
| 9. | Enterprise | 17,033 | 91,628(18.59%)#1 | 1,985,710(0.86%)#9 |
| 10. | Chula Vista | 16,887 | 818,297(2.06%)#6 | 1,985,710(0.85%)#10 |
| 11. | Las Vegas | 16,753 | 91,628(18.28%)#2 | 1,985,710(0.84%)#11 |
| 12. | Vallejo | 14,455 | 818,297(1.77%)#7 | 1,985,710(0.73%)#12 |
| 13. | Long Beach | 14,147 | 818,297(1.73%)#8 | 1,985,710(0.71%)#13 |
| 14. | Waipahu | 13,554 | 115,679(11.72%)#2 | 1,985,710(0.68%)#14 |
| 15. | Carson | 13,430 | 818,297(1.64%)#9 | 1,985,710(0.68%)#15 |
| 16. | Virginia Beach | 12,567 | 52,629(23.88%)#1 | 1,985,710(0.63%)#16 |
| 17. | Stockton | 12,447 | 818,297(1.52%)#10 | 1,985,710(0.63%)#17 |
| 18. | Hayward | 12,442 | 818,297(1.52%)#11 | 1,985,710(0.63%)#18 |
| 19. | Jacksonville | 12,129 | 84,403(14.37%)#1 | 1,985,710(0.61%)#19 |
| 20. | Jersey City | 11,091 | 85,934(12.91%)#1 | 1,985,710(0.56%)#20 |
| 21. | Spring Valley | 10,075 | 91,628(11.00%)#3 | 1,985,710(0.51%)#21 |
| 22. | Anaheim | 9,783 | 818,297(1.20%)#12 | 1,985,710(0.49%)#22 |
| 23. | Anchorage | 9,474 | 19,195(49.36%)#1 | 1,985,710(0.48%)#23 |
| 24. | Elk Grove | 9,085 | 818,297(1.11%)#13 | 1,985,710(0.46%)#24 |
| 25. | Paradise | 8,935 | 91,628(9.75%)#4 | 1,985,710(0.45%)#25 |
| 26. | Sacramento | 8,668 | 818,297(1.06%)#14 | 1,985,710(0.44%)#26 |
| 27. | Henderson | 8,649 | 91,628(9.44%)#5 | 1,985,710(0.44%)#27 |
| 28. | Houston | 8,616 | 103,148(8.35%)#1 | 1,985,710(0.43%)#28 |
| 29. | Seattle | 8,608 | 71,661(12.01%)#1 | 1,985,710(0.43%)#29 |
| 30. | Union City | 8,543 | 818,297(1.04%)#15 | 1,985,710(0.43%)#30 |
| 31. | North Las Vegas | 8,359 | 91,628(9.12%)#6 | 1,985,710(0.42%)#31 |
| 32. | South San Francisco | 8,130 | 818,297(0.99%)#16 | 1,985,710(0.41%)#32 |
| 33. | Fremont | 7,955 | 818,297(0.97%)#17 | 1,985,710(0.40%)#33 |
| 34. | Glendale | 7,610 | 818,297(0.93%)#18 | 1,985,710(0.38%)#34 |
| 35. | Fairfield | 7,158 | 818,297(0.87%)#19 | 1,985,710(0.36%)#35 |
| 36. | Santa Clarita | 6,870 | 818,297(0.84%)#20 | 1,985,710(0.35%)#36 |
| 37. | National City | 6,715 | 818,297(0.82%)#21 | 1,985,710(0.34%)#37 |
| 38. | Kahului | 6,586 | 115,679(5.69%)#3 | 1,985,710(0.33%)#38 |
| 39. | Phoenix | 6,461 | 30,378(21.27%)#1 | 1,985,710(0.33%)#39 |
| 40. | San Leandro | 6,296 | 818,297(0.77%)#22 | 1,985,710(0.32%)#40 |
| 41. | West Covina | 6,267 | 818,297(0.77%)#23 | 1,985,710(0.32%)#41 |
| 42. | Milpitas | 6,193 | 818,297(0.76%)#24 | 1,985,710(0.31%)#42 |
| 43. | Oxnard | 6,130 | 818,297(0.75%)#25 | 1,985,710(0.31%)#43 |
| 44. | Bakersfield | 5,986 | 818,297(0.73%)#26 | 1,985,710(0.30%)#44 |
| 45. | Reno | 5,939 | 91,628(6.48%)#7 | 1,985,710(0.30%)#45 |
| 46. | Fresno | 5,318 | 818,297(0.65%)#27 | 1,985,710(0.27%)#46 |
| 47. | San Antonio | 5,308 | 103,148(5.15%)#2 | 1,985,710(0.27%)#47 |
| 48. | Sunrise Manor | 5,217 | 91,628(5.69%)#8 | 1,985,710(0.26%)#48 |
| 49. | Pittsburg | 5,204 | 818,297(0.64%)#28 | 1,985,710(0.26%)#49 |
| 50. | Antioch | 5,004 | 818,297(0.61%)#29 | 1,985,710(0.25%)#50 |
| 51. | Concord | 4,842 | 818,297(0.59%)#30 | 1,985,710(0.24%)#51 |
| 52. | Irvine | 4,839 | 818,297(0.59%)#31 | 1,985,710(0.24%)#52 |
| 53. | Lakewood | 4,640 | 818,297(0.57%)#32 | 1,985,710(0.23%)#53 |
| 54. | Sunnyvale | 4,596 | 818,297(0.56%)#33 | 1,985,710(0.23%)#54 |
| 55. | Cerritos | 4,572 | 818,297(0.56%)#34 | 1,985,710(0.23%)#55 |
| 56. | Philadelphia | 4,462 | 21,039(21.21%)#1 | 1,985,710(0.22%)#56 |
| 57. | Buena Park | 4,394 | 818,297(0.54%)#35 | 1,985,710(0.22%)#57 |
| 58. | Kent | 4,370 | 71,661(6.10%)#2 | 1,985,710(0.22%)#58 |
| 59. | Norwalk | 4,355 | 818,297(0.53%)#36 | 1,985,710(0.22%)#59 |
| 60. | Ewa Gentry | 4,307 | 115,679(3.72%)#4 | 1,985,710(0.22%)#60 |
| 61. | Oakland | 4,306 | 818,297(0.53%)#37 | 1,985,710(0.22%)#61 |
| 62. | Santa Clara | 4,282 | 818,297(0.52%)#38 | 1,985,710(0.22%)#62 |
| 63. | Delano | 4,182 | 818,297(0.51%)#39 | 1,985,710(0.21%)#63 |
| 64. | Roseville | 4,147 | 818,297(0.51%)#40 | 1,985,710(0.21%)#64 |
| 65. | Ewa Beach | 4,133 | 115,679(3.57%)#5 | 1,985,710(0.21%)#65 |
| 66. | Fontana | 3,906 | 818,297(0.48%)#41 | 1,985,710(0.20%)#66 |
| 67. | Skokie | 3,716 | 93,003(4.00%)#2 | 1,985,710(0.19%)#67 |
| 68. | Riverside | 3,693 | 818,297(0.45%)#42 | 1,985,710(0.19%)#68 |
| 69. | Temecula | 3,651 | 818,297(0.45%)#43 | 1,985,710(0.18%)#69 |
| 70. | Oceanside | 3,588 | 818,297(0.44%)#44 | 1,985,710(0.18%)#70 |
| 71. | Pearl City | 3,555 | 115,679(3.07%)#6 | 1,985,710(0.18%)#71 |
| 72. | Norfolk | 3,541 | 52,629(6.73%)#2 | 1,985,710(0.18%)#72 |
| 73. | Bergenfield Borough | 3,416 | 85,934(3.98%)#2 | 1,985,710(0.17%)#73 |
| 74. | Torrance | 3,380 | 818,297(0.41%)#45 | 1,985,710(0.17%)#74 |
| 75. | Bellflower | 3,250 | 818,297(0.40%)#46 | 1,985,710(0.16%)#75 |
| 76. | Austin | 3,205 | 103,148(3.11%)#3 | 1,985,710(0.16%)#76 |
| 77. | American Canyon | 3,203 | 818,297(0.39%)#47 | 1,985,710(0.16%)#77 |
| 78. | Chino Hills | 3,199 | 818,297(0.39%)#48 | 1,985,710(0.16%)#78 |
| 79. | Pearland | 3,166 | 103,148(3.07%)#4 | 1,985,710(0.16%)#79 |
| 80. | Tracy | 3,102 | 818,297(0.38%)#49 | 1,985,710(0.16%)#80 |
| 81. | Rancho Cucamonga | 3,088 | 818,297(0.38%)#50 | 1,985,710(0.16%)#81 |
| 82. | Moreno Valley | 3,062 | 818,297(0.37%)#51 | 1,985,710(0.15%)#82 |
| 83. | Royal Kunia | 3,061 | 115,679(2.65%)#7 | 1,985,710(0.15%)#83 |
| 84. | Fort Worth | 3,040 | 103,148(2.95%)#5 | 1,985,710(0.15%)#84 |
| 85. | San Bruno | 3,025 | 818,297(0.37%)#52 | 1,985,710(0.15%)#85 |
| 86. | Pasadena | 3,019 | 818,297(0.37%)#53 | 1,985,710(0.15%)#86 |
| 87. | Ontario | 3,017 | 818,297(0.37%)#54 | 1,985,710(0.15%)#87 |
| 88. | San Mateo | 2,995 | 818,297(0.37%)#55 | 1,985,710(0.15%)#88 |
| 89. | Alameda | 2,984 | 818,297(0.36%)#56 | 1,985,710(0.15%)#89 |
| 90. | Manteca | 2,962 | 818,297(0.36%)#57 | 1,985,710(0.15%)#90 |
| 91. | Orange | 2,858 | 818,297(0.35%)#58 | 1,985,710(0.14%)#91 |
| 92. | Corona | 2,846 | 818,297(0.35%)#59 | 1,985,710(0.14%)#92 |
| 93. | Whitney | 2,815 | 91,628(3.07%)#9 | 1,985,710(0.14%)#93 |
| 94. | Renton | 2,814 | 71,661(3.93%)#3 | 1,985,710(0.14%)#94 |
| 95. | Garden Grove | 2,812 | 818,297(0.34%)#60 | 1,985,710(0.14%)#95 |
| 96. | Victorville | 2,720 | 818,297(0.33%)#61 | 1,985,710(0.14%)#96 |
| 97. | Newark | 2,709 | 818,297(0.33%)#62 | 1,985,710(0.14%)#97 |
| 98. | Escondido | 2,675 | 818,297(0.33%)#63 | 1,985,710(0.13%)#98 |
| 99. | Santa Maria | 2,675 | 818,297(0.33%)#64 | 1,985,710(0.13%)#99 |
| 100. | West Carson | 2,658 | 818,297(0.32%)#65 | 1,985,710(0.13%)#100 |
Common Questions
What are the Top 10 Cities with the Most Immigrants from Philippines in the United States?
Top 10 Cities with the Most Immigrants from Philippines in the United States are:
#1
88,766
#2
57,191
#3
43,910
#4
32,743
#5
28,269
#6
22,260
#7
22,080
#8
21,000
#9
17,033
#10
16,887
What city has the Most Immigrants from Philippines in the United States?
Los Angeles has the Most Immigrants from Philippines in the United States with 88,766.
What is the Total Immigrants from Philippines in the United States?
Total Immigrants from Philippines in the United States is 1,985,710.