Spartanburg, SC Map & Demographics
Spartanburg Map
Spartanburg Overview
$30,719
PER CAPITA INCOME
$57,381
AVG FAMILY INCOME
$49,140
AVG HOUSEHOLD INCOME
29.5%
WAGE / INCOME GAP [ % ]
70.5¢/ $1
WAGE / INCOME GAP [ $ ]
$12,081
FAMILY INCOME DEFICIT
0.51
INEQUALITY / GINI INDEX
38,301
TOTAL POPULATION
17,349
MALE POPULATION
20,952
FEMALE POPULATION
82.80
MALES / 100 FEMALES
120.77
FEMALES / 100 MALES
35.5
MEDIAN AGE
3.0
AVG FAMILY SIZE
2.3
AVG HOUSEHOLD SIZE
17,849
LABOR FORCE [ PEOPLE ]
58.9%
PERCENT IN LABOR FORCE
7.5%
UNEMPLOYMENT RATE
Spartanburg Area Codes
Income in Spartanburg
Income Overview in Spartanburg
Per Capita Income in Spartanburg is $30,719, while median incomes of families and households are $57,381 and $49,140 respectively.
| Characteristic | Number | Measure |
| Per Capita Income | 38,301 | $30,719 |
| Median Family Income | 8,962 | $57,381 |
| Mean Family Income | 8,962 | $84,456 |
| Median Household Income | 15,587 | $49,140 |
| Mean Household Income | 15,587 | $71,156 |
| Income Deficit | 8,962 | $12,081 |
| Wage / Income Gap (%) | 38,301 | 29.51% |
| Wage / Income Gap ($) | 38,301 | 70.49¢ per $1 |
| Gini / Inequality Index | 38,301 | 0.51 |
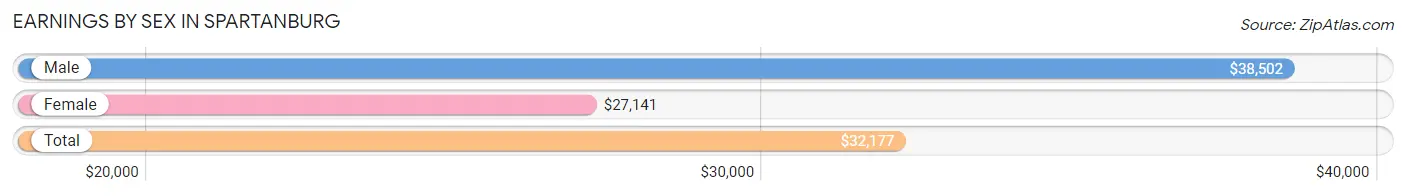
Earnings by Sex in Spartanburg
Average Earnings in Spartanburg are $32,177, $38,502 for men and $27,141 for women, a difference of 29.5%.
| Sex | Number | Average Earnings |
| Male | 9,218 (47.9%) | $38,502 |
| Female | 10,029 (52.1%) | $27,141 |
| Total | 19,247 (100.0%) | $32,177 |
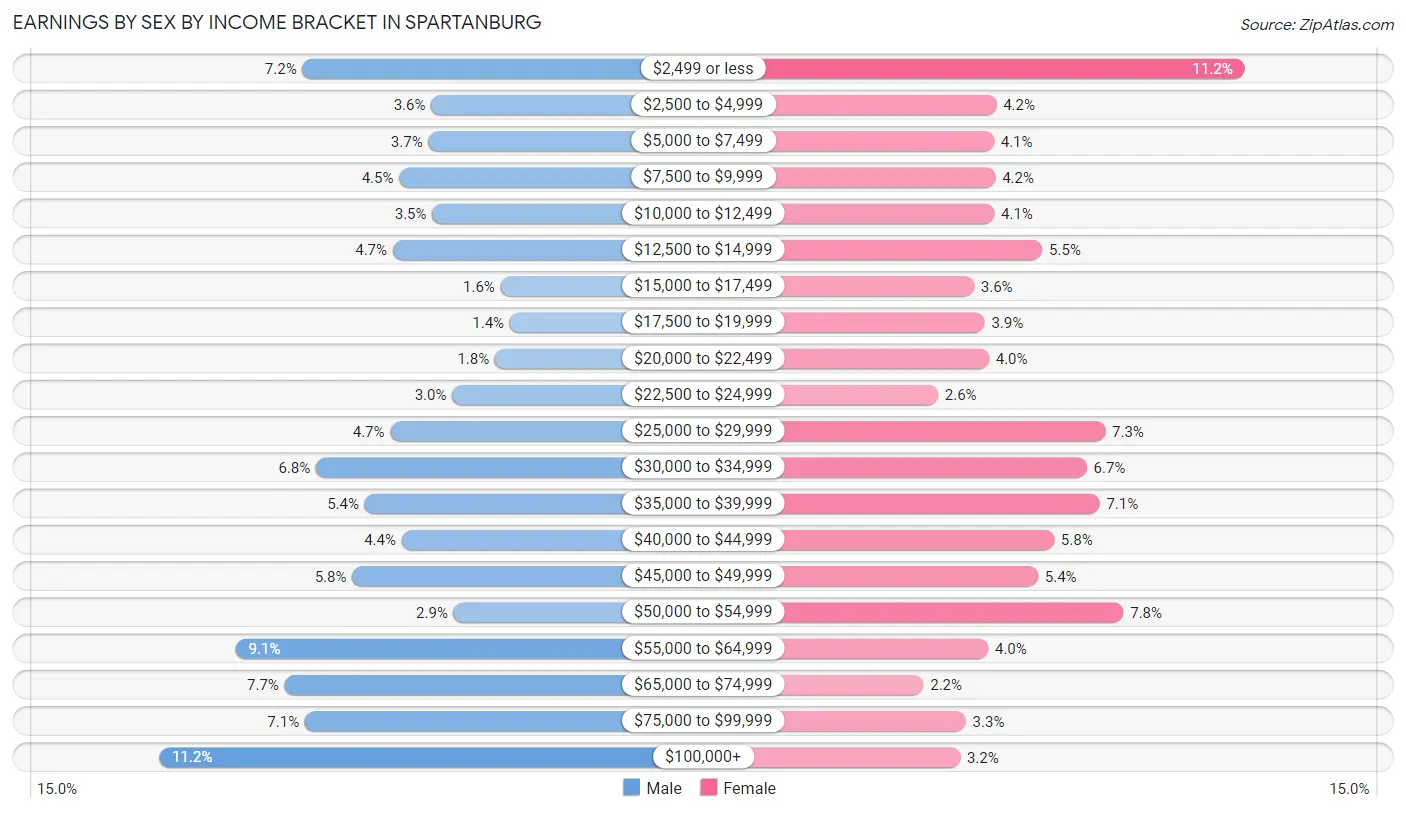
Earnings by Sex by Income Bracket in Spartanburg
The most common earnings brackets in Spartanburg are $100,000+ for men (1,034 | 11.2%) and $2,499 or less for women (1,121 | 11.2%).
| Income | Male | Female |
| $2,499 or less | 663 (7.2%) | 1,121 (11.2%) |
| $2,500 to $4,999 | 329 (3.6%) | 421 (4.2%) |
| $5,000 to $7,499 | 336 (3.6%) | 414 (4.1%) |
| $7,500 to $9,999 | 412 (4.5%) | 418 (4.2%) |
| $10,000 to $12,499 | 326 (3.5%) | 415 (4.1%) |
| $12,500 to $14,999 | 429 (4.6%) | 551 (5.5%) |
| $15,000 to $17,499 | 149 (1.6%) | 358 (3.6%) |
| $17,500 to $19,999 | 125 (1.4%) | 388 (3.9%) |
| $20,000 to $22,499 | 164 (1.8%) | 400 (4.0%) |
| $22,500 to $24,999 | 275 (3.0%) | 257 (2.6%) |
| $25,000 to $29,999 | 435 (4.7%) | 728 (7.3%) |
| $30,000 to $34,999 | 628 (6.8%) | 676 (6.7%) |
| $35,000 to $39,999 | 501 (5.4%) | 712 (7.1%) |
| $40,000 to $44,999 | 406 (4.4%) | 584 (5.8%) |
| $45,000 to $49,999 | 534 (5.8%) | 539 (5.4%) |
| $50,000 to $54,999 | 271 (2.9%) | 779 (7.8%) |
| $55,000 to $64,999 | 836 (9.1%) | 398 (4.0%) |
| $65,000 to $74,999 | 709 (7.7%) | 216 (2.1%) |
| $75,000 to $99,999 | 656 (7.1%) | 335 (3.3%) |
| $100,000+ | 1,034 (11.2%) | 319 (3.2%) |
| Total | 9,218 (100.0%) | 10,029 (100.0%) |
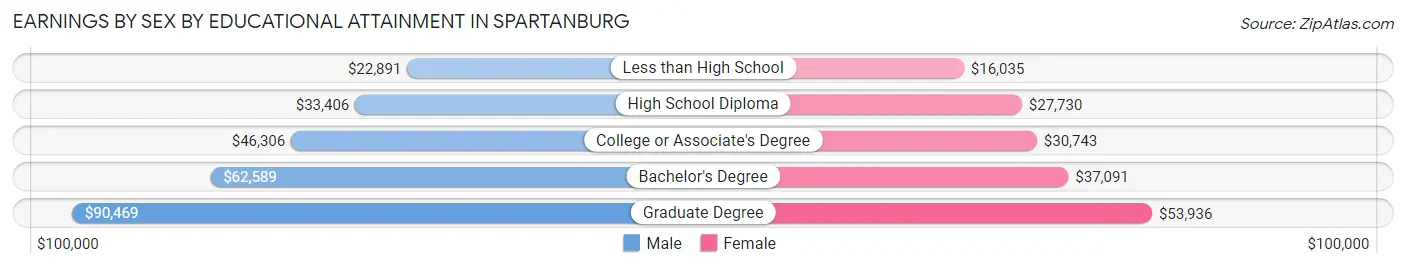
Earnings by Sex by Educational Attainment in Spartanburg
Average earnings in Spartanburg are $45,982 for men and $33,441 for women, a difference of 27.3%. Men with an educational attainment of graduate degree enjoy the highest average annual earnings of $90,469, while those with less than high school education earn the least with $22,891. Women with an educational attainment of graduate degree earn the most with the average annual earnings of $53,936, while those with less than high school education have the smallest earnings of $16,035.
| Educational Attainment | Male Income | Female Income |
| Less than High School | $22,891 | $16,035 |
| High School Diploma | $33,406 | $27,730 |
| College or Associate's Degree | $46,306 | $30,743 |
| Bachelor's Degree | $62,589 | $37,091 |
| Graduate Degree | $90,469 | $53,936 |
| Total | $45,982 | $33,441 |
Family Income in Spartanburg
Family Income Brackets in Spartanburg
According to the Spartanburg family income data, there are 1,470 families falling into the $50,000 to $74,999 income range, which is the most common income bracket and makes up 16.4% of all families. Conversely, the $10,000 to $14,999 income bracket is the least frequent group with only 538 families (6.0%) belonging to this category.
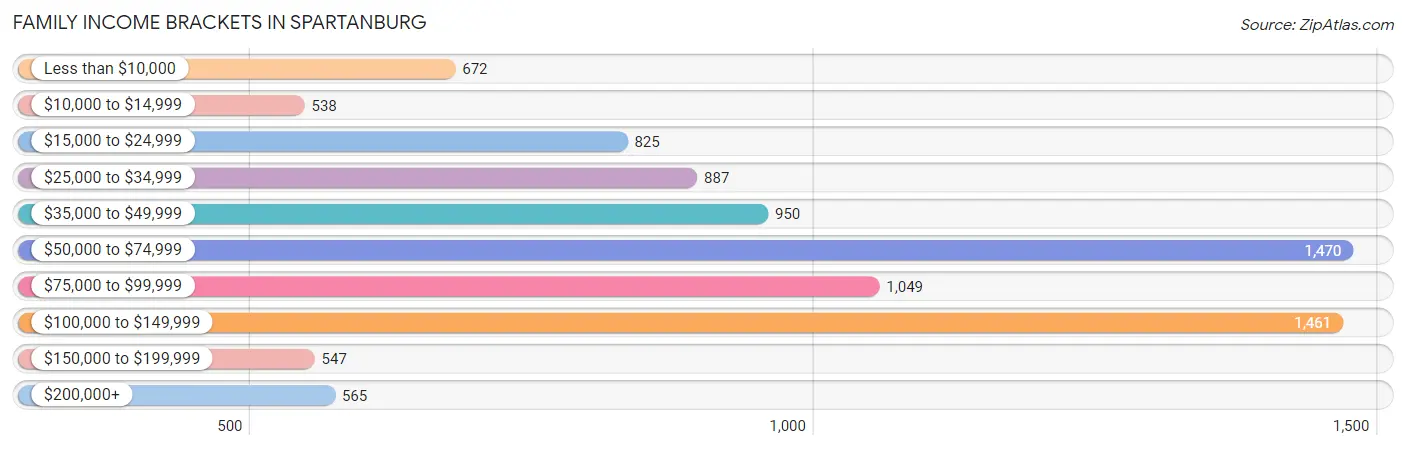
| Income Bracket | # Families | % Families |
| Less than $10,000 | 672 | 7.5% |
| $10,000 to $14,999 | 538 | 6.0% |
| $15,000 to $24,999 | 825 | 9.2% |
| $25,000 to $34,999 | 887 | 9.9% |
| $35,000 to $49,999 | 950 | 10.6% |
| $50,000 to $74,999 | 1,470 | 16.4% |
| $75,000 to $99,999 | 1,049 | 11.7% |
| $100,000 to $149,999 | 1,461 | 16.3% |
| $150,000 to $199,999 | 547 | 6.1% |
| $200,000+ | 565 | 6.3% |
Family Income by Famaliy Size in Spartanburg
3-person families (2,351 | 26.2%) account for the highest median family income in Spartanburg with $60,458 per family, while 2-person families (4,461 | 49.8%) have the highest median income of $30,186 per family member.
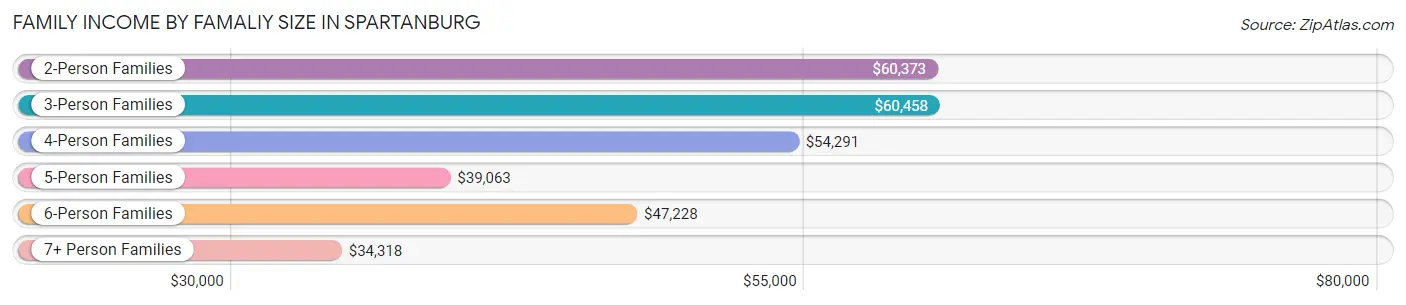
| Income Bracket | # Families | Median Income |
| 2-Person Families | 4,461 (49.8%) | $60,373 |
| 3-Person Families | 2,351 (26.2%) | $60,458 |
| 4-Person Families | 1,313 (14.6%) | $54,291 |
| 5-Person Families | 608 (6.8%) | $39,063 |
| 6-Person Families | 187 (2.1%) | $47,228 |
| 7+ Person Families | 42 (0.5%) | $34,318 |
| Total | 8,962 (100.0%) | $57,381 |
Family Income by Number of Earners in Spartanburg
The median family income in Spartanburg is $57,381, with families comprising 3+ earners (393) having the highest median family income of $112,639, while families with no earners (1,504) have the lowest median family income of $34,718, accounting for 4.4% and 16.8% of families, respectively.
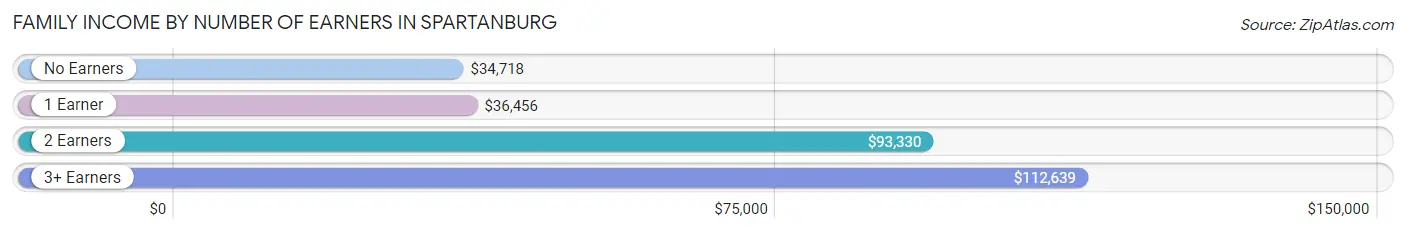
| Number of Earners | # Families | Median Income |
| No Earners | 1,504 (16.8%) | $34,718 |
| 1 Earner | 3,736 (41.7%) | $36,456 |
| 2 Earners | 3,329 (37.1%) | $93,330 |
| 3+ Earners | 393 (4.4%) | $112,639 |
| Total | 8,962 (100.0%) | $57,381 |
Household Income in Spartanburg
Household Income Brackets in Spartanburg
With 2,743 households falling in the category, the $50,000 to $74,999 income range is the most frequent in Spartanburg, accounting for 17.6% of all households. In contrast, only 608 households (3.9%) fall into the $150,000 to $199,999 income bracket, making it the least populous group.
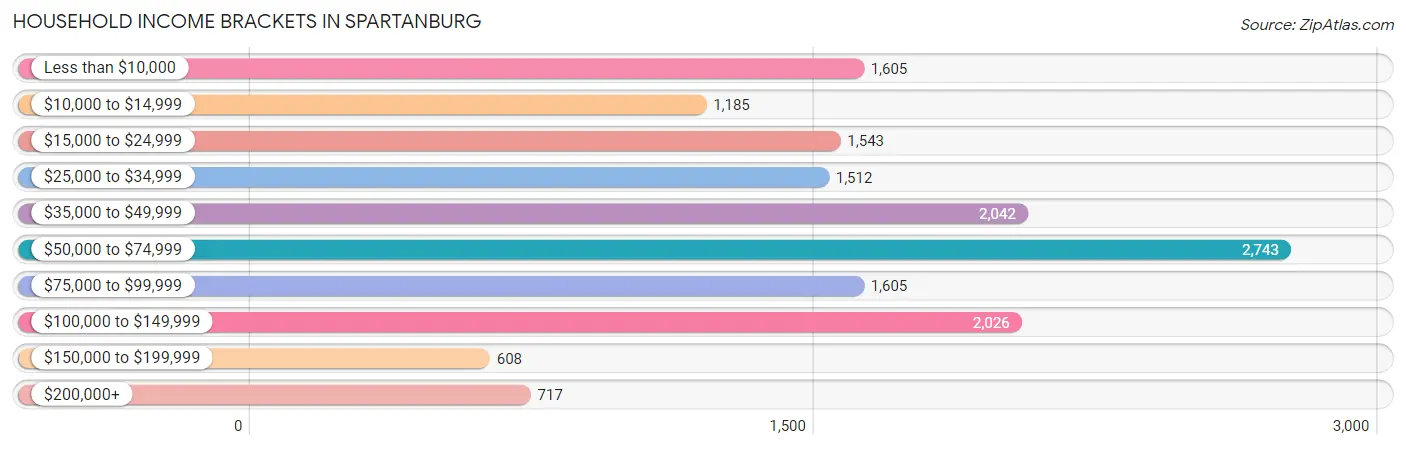
| Income Bracket | # Households | % Households |
| Less than $10,000 | 1,605 | 10.3% |
| $10,000 to $14,999 | 1,185 | 7.6% |
| $15,000 to $24,999 | 1,543 | 9.9% |
| $25,000 to $34,999 | 1,512 | 9.7% |
| $35,000 to $49,999 | 2,042 | 13.1% |
| $50,000 to $74,999 | 2,743 | 17.6% |
| $75,000 to $99,999 | 1,605 | 10.3% |
| $100,000 to $149,999 | 2,026 | 13.0% |
| $150,000 to $199,999 | 608 | 3.9% |
| $200,000+ | 717 | 4.6% |
Household Income by Householder Age in Spartanburg
The median household income in Spartanburg is $49,140, with the highest median household income of $51,946 found in the 45 to 64 years age bracket for the primary householder. A total of 4,686 households (30.1%) fall into this category. Meanwhile, the 15 to 24 years age bracket for the primary householder has the lowest median household income of $31,875, with 856 households (5.5%) in this group.
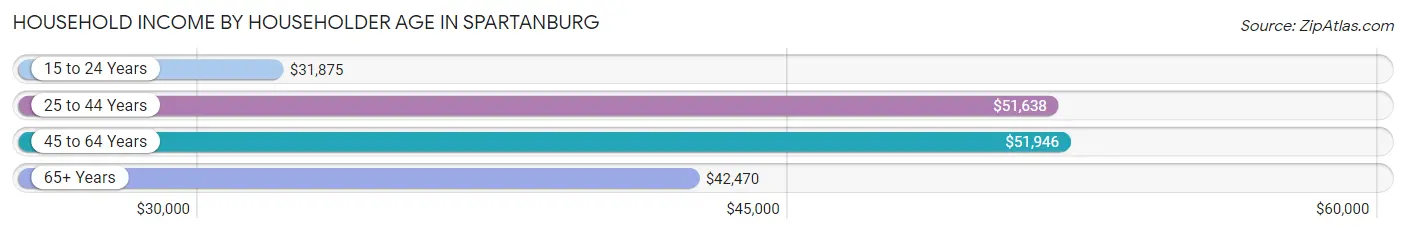
| Income Bracket | # Households | Median Income |
| 15 to 24 Years | 856 (5.5%) | $31,875 |
| 25 to 44 Years | 5,530 (35.5%) | $51,638 |
| 45 to 64 Years | 4,686 (30.1%) | $51,946 |
| 65+ Years | 4,515 (29.0%) | $42,470 |
| Total | 15,587 (100.0%) | $49,140 |
Poverty in Spartanburg
Income Below Poverty by Sex and Age in Spartanburg
With 26.6% poverty level for males and 24.9% for females among the residents of Spartanburg, 5 year old males and 6 to 11 year old females are the most vulnerable to poverty, with 150 males (59.1%) and 593 females (47.5%) in their respective age groups living below the poverty level.
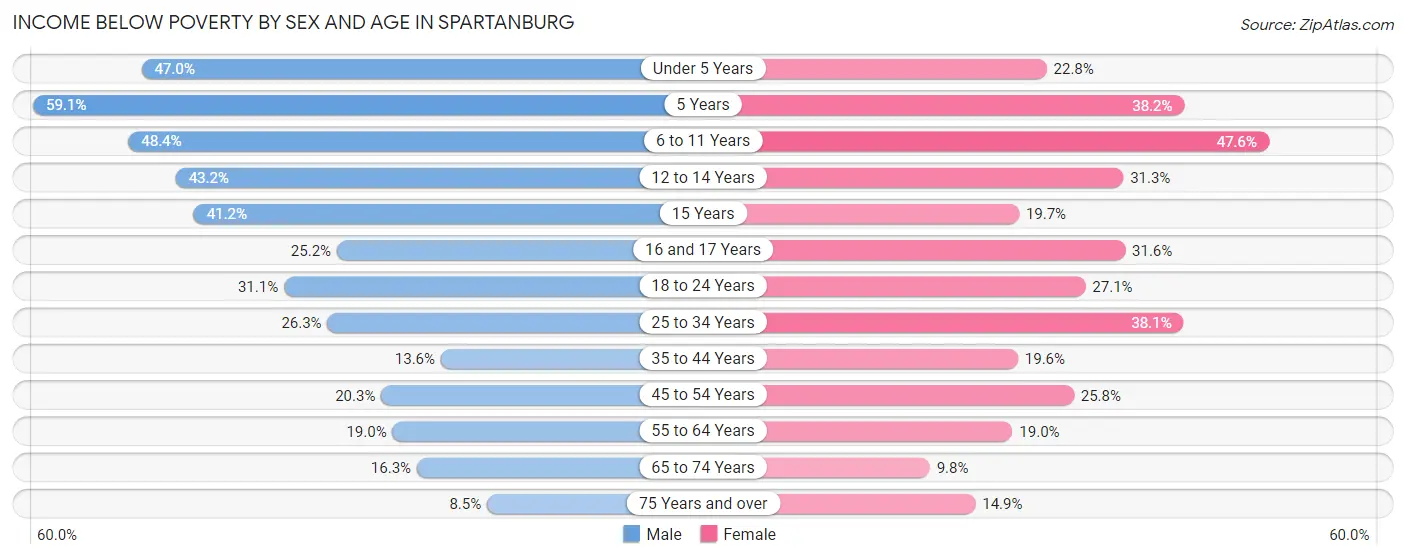
| Age Bracket | Male | Female |
| Under 5 Years | 676 (47.0%) | 315 (22.8%) |
| 5 Years | 150 (59.1%) | 95 (38.2%) |
| 6 to 11 Years | 653 (48.4%) | 593 (47.5%) |
| 12 to 14 Years | 278 (43.2%) | 251 (31.3%) |
| 15 Years | 128 (41.2%) | 44 (19.7%) |
| 16 and 17 Years | 86 (25.2%) | 171 (31.6%) |
| 18 to 24 Years | 405 (31.1%) | 372 (27.1%) |
| 25 to 34 Years | 642 (26.3%) | 1,113 (38.1%) |
| 35 to 44 Years | 289 (13.6%) | 503 (19.6%) |
| 45 to 54 Years | 321 (20.3%) | 378 (25.8%) |
| 55 to 64 Years | 384 (19.0%) | 552 (19.0%) |
| 65 to 74 Years | 269 (16.3%) | 188 (9.8%) |
| 75 Years and over | 82 (8.5%) | 284 (14.9%) |
| Total | 4,363 (26.6%) | 4,859 (24.9%) |
Income Above Poverty by Sex and Age in Spartanburg
According to the poverty statistics in Spartanburg, males aged 75 years and over and females aged 65 to 74 years are the age groups that are most secure financially, with 91.5% of males and 90.2% of females in these age groups living above the poverty line.
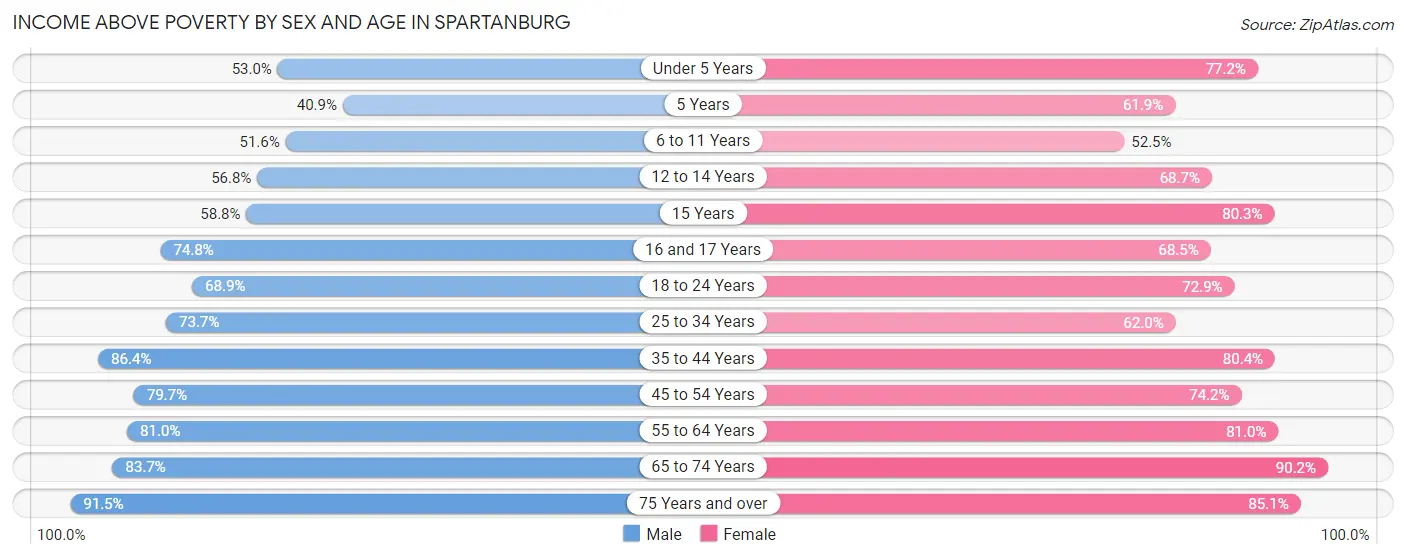
| Age Bracket | Male | Female |
| Under 5 Years | 763 (53.0%) | 1,066 (77.2%) |
| 5 Years | 104 (40.9%) | 154 (61.9%) |
| 6 to 11 Years | 695 (51.6%) | 654 (52.4%) |
| 12 to 14 Years | 366 (56.8%) | 550 (68.7%) |
| 15 Years | 183 (58.8%) | 179 (80.3%) |
| 16 and 17 Years | 255 (74.8%) | 371 (68.4%) |
| 18 to 24 Years | 897 (68.9%) | 999 (72.9%) |
| 25 to 34 Years | 1,802 (73.7%) | 1,812 (62.0%) |
| 35 to 44 Years | 1,830 (86.4%) | 2,062 (80.4%) |
| 45 to 54 Years | 1,262 (79.7%) | 1,085 (74.2%) |
| 55 to 64 Years | 1,634 (81.0%) | 2,354 (81.0%) |
| 65 to 74 Years | 1,380 (83.7%) | 1,732 (90.2%) |
| 75 Years and over | 883 (91.5%) | 1,626 (85.1%) |
| Total | 12,054 (73.4%) | 14,644 (75.1%) |
Income Below Poverty Among Married-Couple Families in Spartanburg
The poverty statistics for married-couple families in Spartanburg show that 8.3% or 405 of the total 4,884 families live below the poverty line. Families with 3 or 4 children have the highest poverty rate of 22.3%, comprising of 75 families. On the other hand, families with 5 or more children have the lowest poverty rate of 0.0%, which includes 0 families.
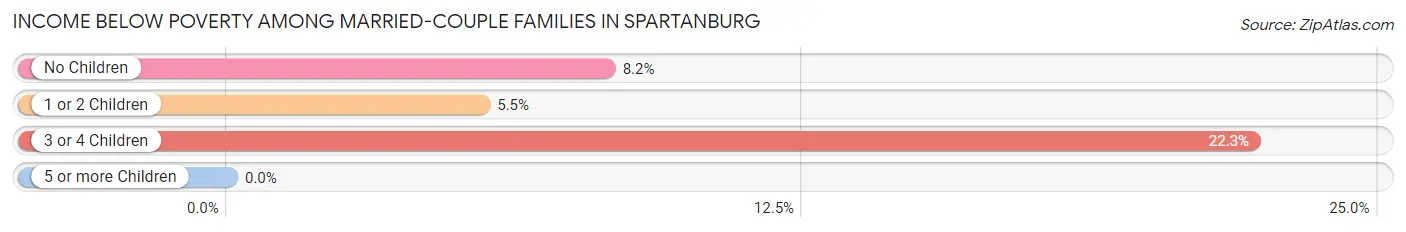
| Children | Above Poverty | Below Poverty |
| No Children | 2,713 (91.8%) | 243 (8.2%) |
| 1 or 2 Children | 1,499 (94.5%) | 87 (5.5%) |
| 3 or 4 Children | 262 (77.7%) | 75 (22.3%) |
| 5 or more Children | 5 (100.0%) | 0 (0.0%) |
| Total | 4,479 (91.7%) | 405 (8.3%) |
Income Below Poverty Among Single-Parent Households in Spartanburg
According to the poverty data in Spartanburg, 29.5% or 172 single-father households and 39.8% or 1,390 single-mother households are living below the poverty line. Among single-father households, those with 3 or 4 children have the highest poverty rate, with 41 households (82.0%) experiencing poverty. Likewise, among single-mother households, those with 5 or more children have the highest poverty rate, with 45 households (91.8%) falling below the poverty line.
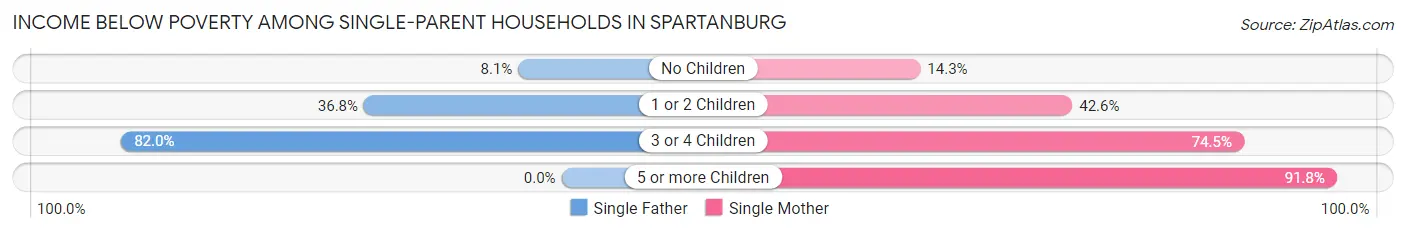
| Children | Single Father | Single Mother |
| No Children | 18 (8.1%) | 155 (14.3%) |
| 1 or 2 Children | 113 (36.8%) | 760 (42.6%) |
| 3 or 4 Children | 41 (82.0%) | 430 (74.5%) |
| 5 or more Children | 0 (0.0%) | 45 (91.8%) |
| Total | 172 (29.5%) | 1,390 (39.8%) |
Income Below Poverty Among Married-Couple vs Single-Parent Households in Spartanburg
The poverty data for Spartanburg shows that 405 of the married-couple family households (8.3%) and 1,562 of the single-parent households (38.3%) are living below the poverty level. Within the married-couple family households, those with 3 or 4 children have the highest poverty rate, with 75 households (22.3%) falling below the poverty line. Among the single-parent households, those with 5 or more children have the highest poverty rate, with 45 household (88.2%) living below poverty.
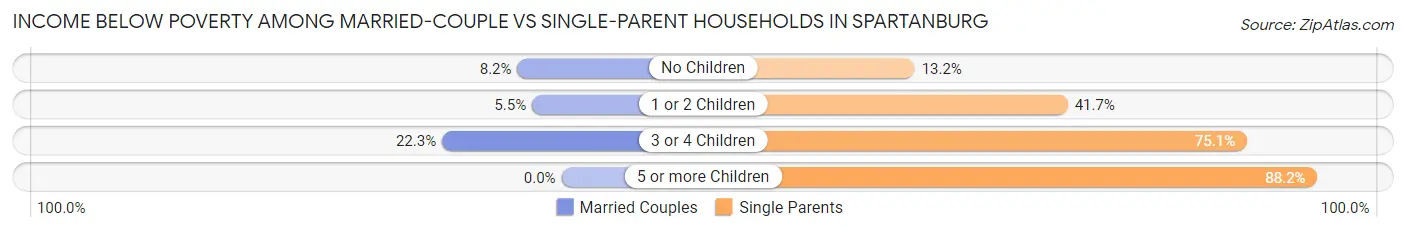
| Children | Married-Couple Families | Single-Parent Households |
| No Children | 243 (8.2%) | 173 (13.2%) |
| 1 or 2 Children | 87 (5.5%) | 873 (41.7%) |
| 3 or 4 Children | 75 (22.3%) | 471 (75.1%) |
| 5 or more Children | 0 (0.0%) | 45 (88.2%) |
| Total | 405 (8.3%) | 1,562 (38.3%) |
Race in Spartanburg
The most populous races in Spartanburg are White / Caucasian (18,081 | 47.2%), Black / African American (17,217 | 45.0%), and Hispanic or Latino (1,945 | 5.1%).
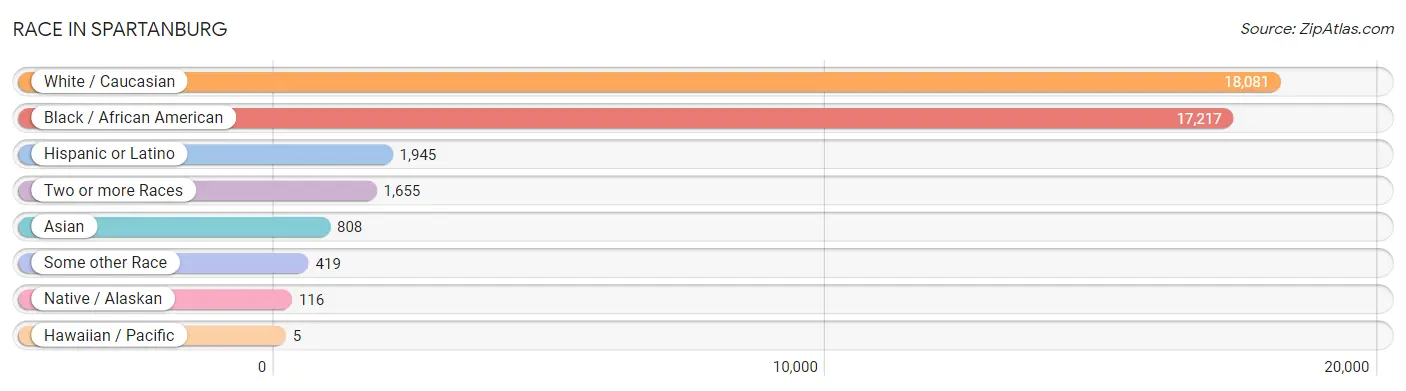
| Race | # Population | % Population |
| Asian | 808 | 2.1% |
| Black / African American | 17,217 | 45.0% |
| Hawaiian / Pacific | 5 | 0.0% |
| Hispanic or Latino | 1,945 | 5.1% |
| Native / Alaskan | 116 | 0.3% |
| White / Caucasian | 18,081 | 47.2% |
| Two or more Races | 1,655 | 4.3% |
| Some other Race | 419 | 1.1% |
| Total | 38,301 | 100.0% |
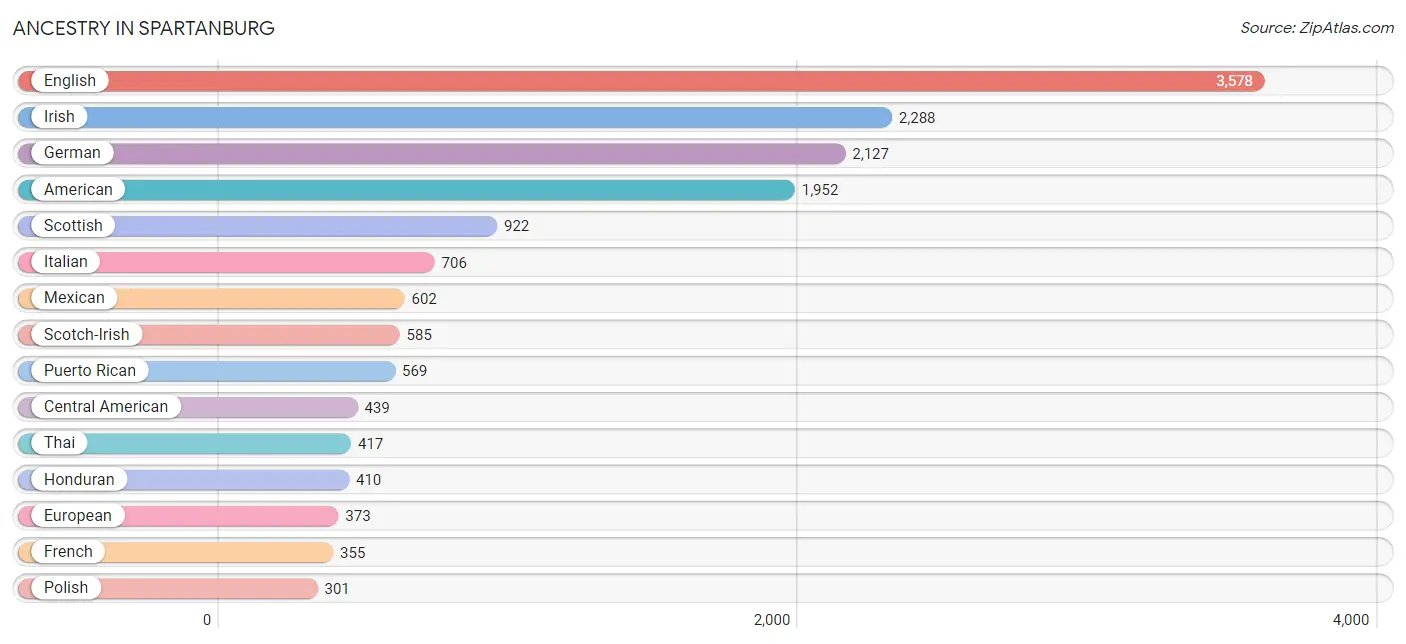
Ancestry in Spartanburg
The most populous ancestries reported in Spartanburg are English (3,578 | 9.3%), Irish (2,288 | 6.0%), German (2,127 | 5.6%), American (1,952 | 5.1%), and Scottish (922 | 2.4%), together accounting for 28.4% of all Spartanburg residents.
| Ancestry | # Population | % Population |
| African | 164 | 0.4% |
| Albanian | 187 | 0.5% |
| Alsatian | 13 | 0.0% |
| American | 1,952 | 5.1% |
| Arab | 34 | 0.1% |
| Australian | 1 | 0.0% |
| Austrian | 35 | 0.1% |
| Bahamian | 11 | 0.0% |
| Bangladeshi | 170 | 0.4% |
| Bhutanese | 32 | 0.1% |
| Blackfeet | 14 | 0.0% |
| Brazilian | 13 | 0.0% |
| British | 144 | 0.4% |
| Bulgarian | 69 | 0.2% |
| Burmese | 45 | 0.1% |
| Cajun | 7 | 0.0% |
| Cambodian | 61 | 0.2% |
| Canadian | 42 | 0.1% |
| Celtic | 16 | 0.0% |
| Central American | 439 | 1.1% |
| Central American Indian | 16 | 0.0% |
| Cherokee | 45 | 0.1% |
| Chilean | 12 | 0.0% |
| Colombian | 85 | 0.2% |
| Croatian | 14 | 0.0% |
| Cuban | 84 | 0.2% |
| Czech | 22 | 0.1% |
| Czechoslovakian | 13 | 0.0% |
| Danish | 60 | 0.2% |
| Dominican | 82 | 0.2% |
| Dutch | 115 | 0.3% |
| Dutch West Indian | 2 | 0.0% |
| Eastern European | 72 | 0.2% |
| English | 3,578 | 9.3% |
| European | 373 | 1.0% |
| French | 355 | 0.9% |
| French Canadian | 80 | 0.2% |
| German | 2,127 | 5.6% |
| Greek | 63 | 0.2% |
| Haitian | 12 | 0.0% |
| Honduran | 410 | 1.1% |
| Hungarian | 62 | 0.2% |
| Icelander | 26 | 0.1% |
| Indian (Asian) | 145 | 0.4% |
| Irish | 2,288 | 6.0% |
| Iroquois | 2 | 0.0% |
| Israeli | 5 | 0.0% |
| Italian | 706 | 1.8% |
| Jamaican | 149 | 0.4% |
| Japanese | 59 | 0.2% |
| Korean | 75 | 0.2% |
| Lebanese | 19 | 0.1% |
| Lithuanian | 8 | 0.0% |
| Lumbee | 7 | 0.0% |
| Macedonian | 33 | 0.1% |
| Malaysian | 50 | 0.1% |
| Mexican | 602 | 1.6% |
| Native Hawaiian | 21 | 0.1% |
| Nigerian | 62 | 0.2% |
| Northern European | 31 | 0.1% |
| Norwegian | 130 | 0.3% |
| Ottawa | 5 | 0.0% |
| Pakistani | 19 | 0.1% |
| Peruvian | 7 | 0.0% |
| Polish | 301 | 0.8% |
| Portuguese | 102 | 0.3% |
| Puerto Rican | 569 | 1.5% |
| Romanian | 21 | 0.1% |
| Russian | 173 | 0.4% |
| Salvadoran | 29 | 0.1% |
| Scandinavian | 57 | 0.2% |
| Scotch-Irish | 585 | 1.5% |
| Scottish | 922 | 2.4% |
| Seminole | 7 | 0.0% |
| Slovak | 22 | 0.1% |
| Slovene | 22 | 0.1% |
| South African | 15 | 0.0% |
| South American | 116 | 0.3% |
| Spaniard | 7 | 0.0% |
| Sri Lankan | 64 | 0.2% |
| Subsaharan African | 260 | 0.7% |
| Swedish | 59 | 0.2% |
| Swiss | 19 | 0.1% |
| Thai | 417 | 1.1% |
| Tlingit-Haida | 12 | 0.0% |
| Trinidadian and Tobagonian | 2 | 0.0% |
| Ugandan | 13 | 0.0% |
| Ukrainian | 91 | 0.2% |
| Venezuelan | 12 | 0.0% |
| Welsh | 292 | 0.8% |
| West Indian | 8 | 0.0% | View All 91 Rows |
Immigrants in Spartanburg
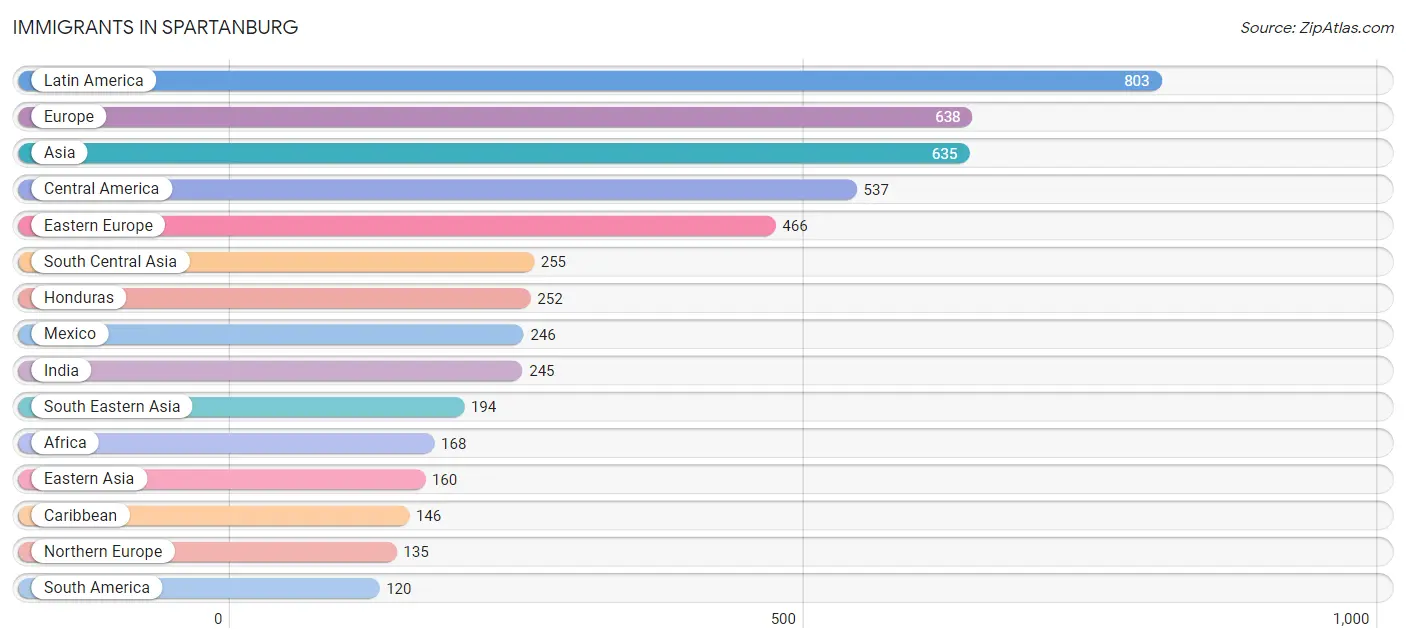
The most numerous immigrant groups reported in Spartanburg came from Latin America (803 | 2.1%), Europe (638 | 1.7%), Asia (635 | 1.7%), Central America (537 | 1.4%), and Eastern Europe (466 | 1.2%), together accounting for 8.1% of all Spartanburg residents.
| Immigration Origin | # Population | % Population |
| Africa | 168 | 0.4% |
| Albania | 6 | 0.0% |
| Asia | 635 | 1.7% |
| Australia | 1 | 0.0% |
| Belarus | 18 | 0.1% |
| Belize | 32 | 0.1% |
| Brazil | 47 | 0.1% |
| Bulgaria | 78 | 0.2% |
| Cambodia | 16 | 0.0% |
| Canada | 23 | 0.1% |
| Caribbean | 146 | 0.4% |
| Central America | 537 | 1.4% |
| China | 90 | 0.2% |
| Colombia | 50 | 0.1% |
| Cuba | 31 | 0.1% |
| Dominican Republic | 17 | 0.0% |
| Eastern Africa | 26 | 0.1% |
| Eastern Asia | 160 | 0.4% |
| Eastern Europe | 466 | 1.2% |
| Ecuador | 16 | 0.0% |
| England | 48 | 0.1% |
| Europe | 638 | 1.7% |
| Germany | 35 | 0.1% |
| Haiti | 13 | 0.0% |
| Honduras | 252 | 0.7% |
| Hungary | 8 | 0.0% |
| India | 245 | 0.6% |
| Ireland | 20 | 0.1% |
| Jamaica | 51 | 0.1% |
| Japan | 9 | 0.0% |
| Jordan | 6 | 0.0% |
| Kazakhstan | 10 | 0.0% |
| Laos | 102 | 0.3% |
| Latin America | 803 | 2.1% |
| Mexico | 246 | 0.6% |
| Netherlands | 2 | 0.0% |
| Nigeria | 115 | 0.3% |
| North Macedonia | 33 | 0.1% |
| Northern Africa | 8 | 0.0% |
| Northern Europe | 135 | 0.4% |
| Norway | 32 | 0.1% |
| Oceania | 11 | 0.0% |
| Panama | 7 | 0.0% |
| Peru | 7 | 0.0% |
| Philippines | 22 | 0.1% |
| Romania | 21 | 0.1% |
| Russia | 48 | 0.1% |
| Singapore | 8 | 0.0% |
| South Africa | 15 | 0.0% |
| South America | 120 | 0.3% |
| South Central Asia | 255 | 0.7% |
| South Eastern Asia | 194 | 0.5% |
| Sweden | 4 | 0.0% |
| Thailand | 5 | 0.0% |
| Trinidad and Tobago | 34 | 0.1% |
| Uganda | 20 | 0.1% |
| Ukraine | 73 | 0.2% |
| Vietnam | 41 | 0.1% |
| Western Africa | 115 | 0.3% |
| Western Asia | 26 | 0.1% |
| Western Europe | 37 | 0.1% | View All 61 Rows |
Sex and Age in Spartanburg
Sex and Age in Spartanburg
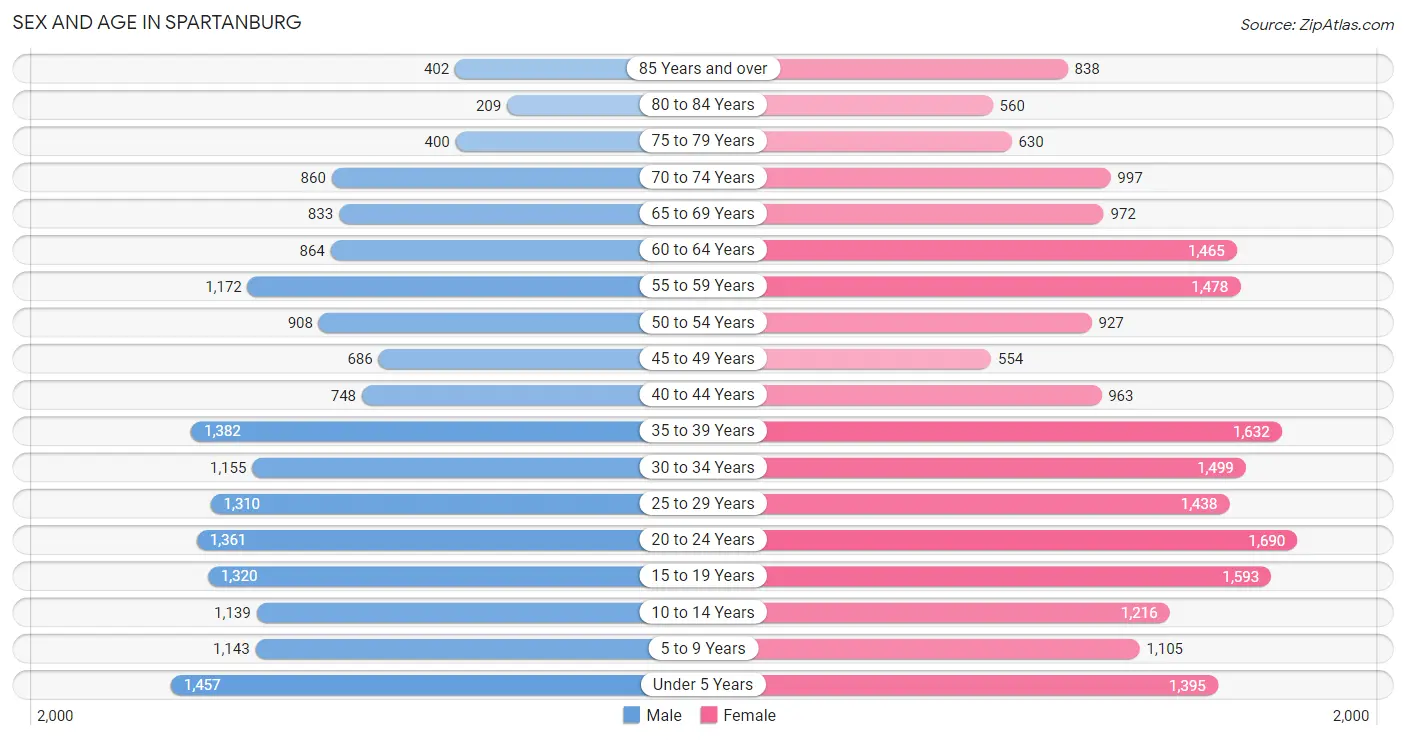
The most populous age groups in Spartanburg are Under 5 Years (1,457 | 8.4%) for men and 20 to 24 Years (1,690 | 8.1%) for women.
| Age Bracket | Male | Female |
| Under 5 Years | 1,457 (8.4%) | 1,395 (6.7%) |
| 5 to 9 Years | 1,143 (6.6%) | 1,105 (5.3%) |
| 10 to 14 Years | 1,139 (6.6%) | 1,216 (5.8%) |
| 15 to 19 Years | 1,320 (7.6%) | 1,593 (7.6%) |
| 20 to 24 Years | 1,361 (7.8%) | 1,690 (8.1%) |
| 25 to 29 Years | 1,310 (7.5%) | 1,438 (6.9%) |
| 30 to 34 Years | 1,155 (6.7%) | 1,499 (7.1%) |
| 35 to 39 Years | 1,382 (8.0%) | 1,632 (7.8%) |
| 40 to 44 Years | 748 (4.3%) | 963 (4.6%) |
| 45 to 49 Years | 686 (4.0%) | 554 (2.6%) |
| 50 to 54 Years | 908 (5.2%) | 927 (4.4%) |
| 55 to 59 Years | 1,172 (6.8%) | 1,478 (7.0%) |
| 60 to 64 Years | 864 (5.0%) | 1,465 (7.0%) |
| 65 to 69 Years | 833 (4.8%) | 972 (4.6%) |
| 70 to 74 Years | 860 (5.0%) | 997 (4.8%) |
| 75 to 79 Years | 400 (2.3%) | 630 (3.0%) |
| 80 to 84 Years | 209 (1.2%) | 560 (2.7%) |
| 85 Years and over | 402 (2.3%) | 838 (4.0%) |
| Total | 17,349 (100.0%) | 20,952 (100.0%) |
Families and Households in Spartanburg
Median Family Size in Spartanburg
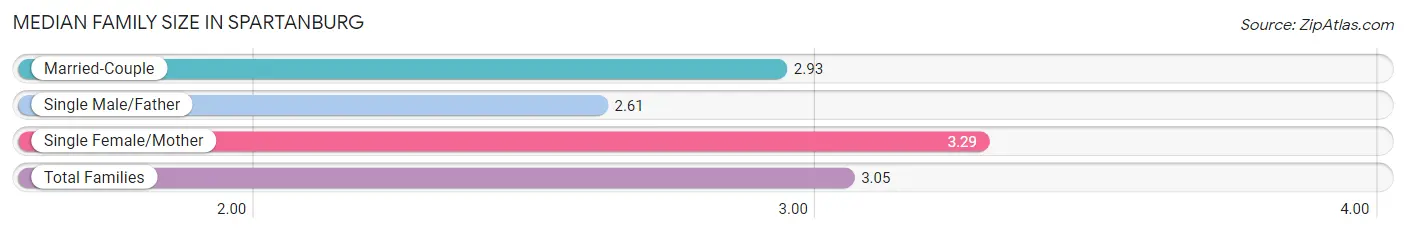
The median family size in Spartanburg is 3.05 persons per family, with single female/mother families (3,496 | 39.0%) accounting for the largest median family size of 3.29 persons per family. On the other hand, single male/father families (582 | 6.5%) represent the smallest median family size with 2.61 persons per family.
| Family Type | # Families | Family Size |
| Married-Couple | 4,884 (54.5%) | 2.93 |
| Single Male/Father | 582 (6.5%) | 2.61 |
| Single Female/Mother | 3,496 (39.0%) | 3.29 |
| Total Families | 8,962 (100.0%) | 3.05 |
Median Household Size in Spartanburg
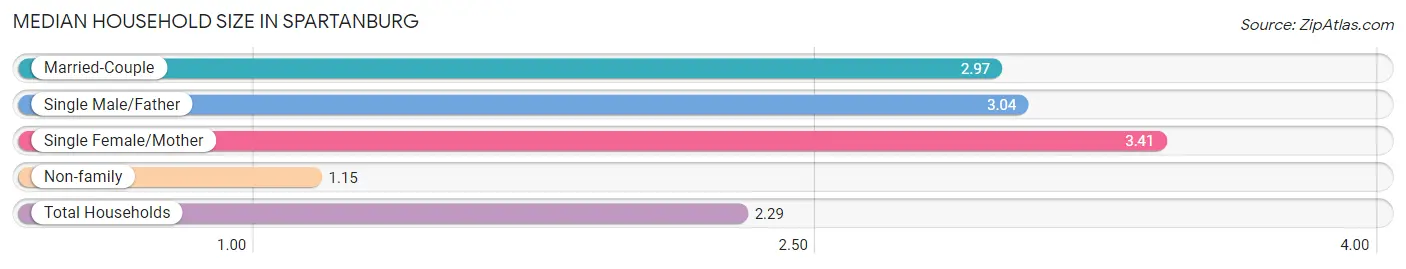
The median household size in Spartanburg is 2.29 persons per household, with single female/mother households (3,496 | 22.4%) accounting for the largest median household size of 3.41 persons per household. non-family households (6,625 | 42.5%) represent the smallest median household size with 1.15 persons per household.
| Household Type | # Households | Household Size |
| Married-Couple | 4,884 (31.3%) | 2.97 |
| Single Male/Father | 582 (3.7%) | 3.04 |
| Single Female/Mother | 3,496 (22.4%) | 3.41 |
| Non-family | 6,625 (42.5%) | 1.15 |
| Total Households | 15,587 (100.0%) | 2.29 |
Household Size by Marriage Status in Spartanburg
Out of a total of 15,587 households in Spartanburg, 8,962 (57.5%) are family households, while 6,625 (42.5%) are nonfamily households. The most numerous type of family households are 2-person households, comprising 4,125, and the most common type of nonfamily households are 1-person households, comprising 5,853.
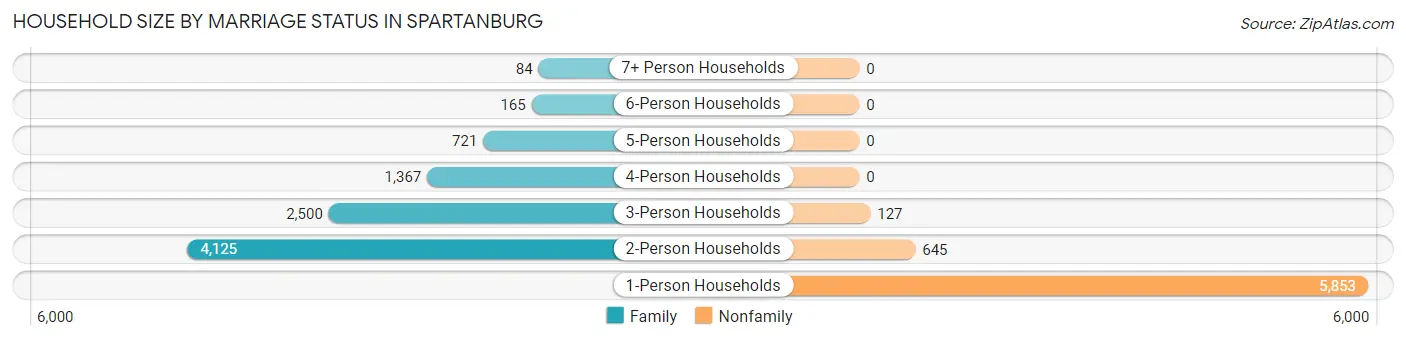
| Household Size | Family Households | Nonfamily Households |
| 1-Person Households | - | 5,853 (37.6%) |
| 2-Person Households | 4,125 (26.5%) | 645 (4.1%) |
| 3-Person Households | 2,500 (16.0%) | 127 (0.8%) |
| 4-Person Households | 1,367 (8.8%) | 0 (0.0%) |
| 5-Person Households | 721 (4.6%) | 0 (0.0%) |
| 6-Person Households | 165 (1.1%) | 0 (0.0%) |
| 7+ Person Households | 84 (0.5%) | 0 (0.0%) |
| Total | 8,962 (57.5%) | 6,625 (42.5%) |
Female Fertility in Spartanburg
Fertility by Age in Spartanburg
Average fertility rate in Spartanburg is 57.0 births per 1,000 women. Women in the age bracket of 20 to 34 years have the highest fertility rate with 101.0 births per 1,000 women. Women in the age bracket of 20 to 34 years acount for 86.2% of all women with births.

| Age Bracket | Women with Births | Births / 1,000 Women |
| 15 to 19 years | 17 (3.1%) | 11.0 |
| 20 to 34 years | 469 (86.2%) | 101.0 |
| 35 to 50 years | 58 (10.7%) | 17.0 |
| Total | 544 (100.0%) | 57.0 |
Fertility by Age by Marriage Status in Spartanburg
40.1% of women with births (544) in Spartanburg are married. The highest percentage of unmarried women with births falls into 15 to 19 years age bracket with 100.0% of them unmarried at the time of birth, while the lowest percentage of unmarried women with births belong to 35 to 50 years age bracket with 58.6% of them unmarried.
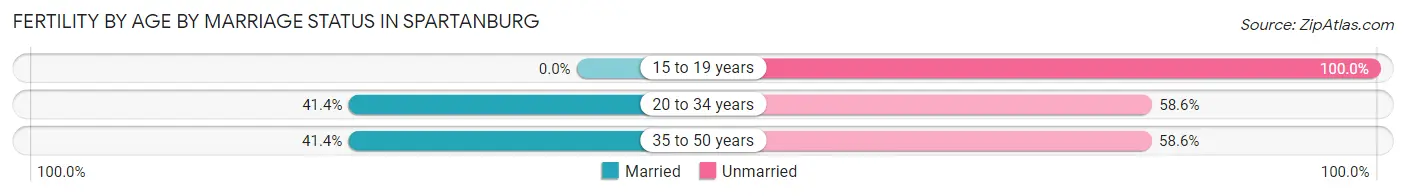
| Age Bracket | Married | Unmarried |
| 15 to 19 years | 0 (0.0%) | 17 (100.0%) |
| 20 to 34 years | 194 (41.4%) | 275 (58.6%) |
| 35 to 50 years | 24 (41.4%) | 34 (58.6%) |
| Total | 218 (40.1%) | 326 (59.9%) |
Fertility by Education in Spartanburg
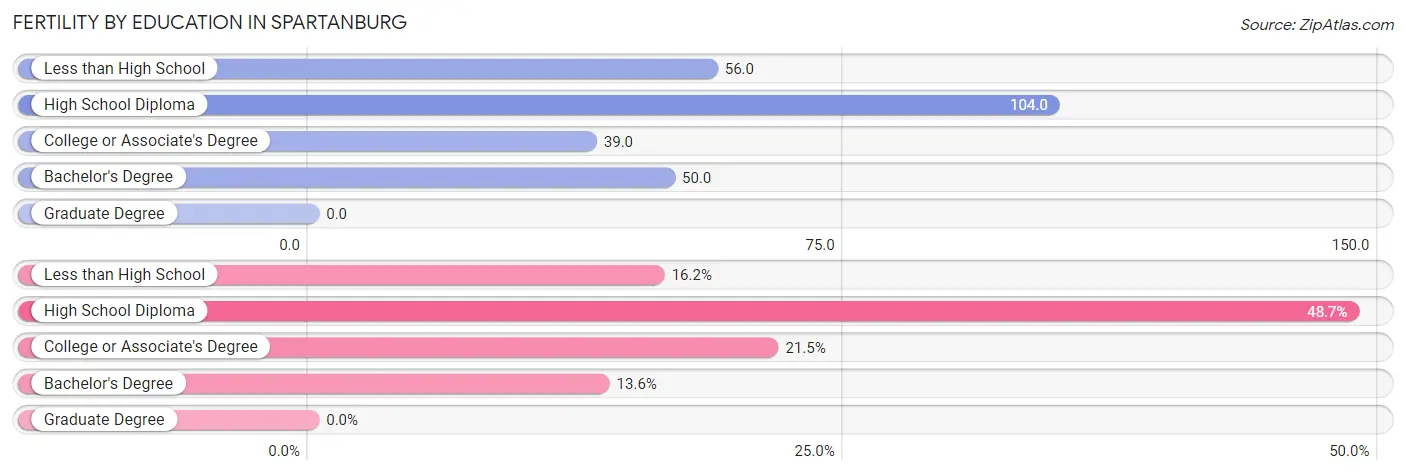
| Educational Attainment | Women with Births | Births / 1,000 Women |
| Less than High School | 88 (16.2%) | 56.0 |
| High School Diploma | 265 (48.7%) | 104.0 |
| College or Associate's Degree | 117 (21.5%) | 39.0 |
| Bachelor's Degree | 74 (13.6%) | 50.0 |
| Graduate Degree | 0 (0.0%) | 0.0 |
| Total | 544 (100.0%) | 57.0 |
Fertility by Education by Marriage Status in Spartanburg
59.9% of women with births in Spartanburg are unmarried. Women with the educational attainment of bachelor's degree are most likely to be married with 71.6% of them married at childbirth, while women with the educational attainment of high school diploma are least likely to be married with 66.8% of them unmarried at childbirth.
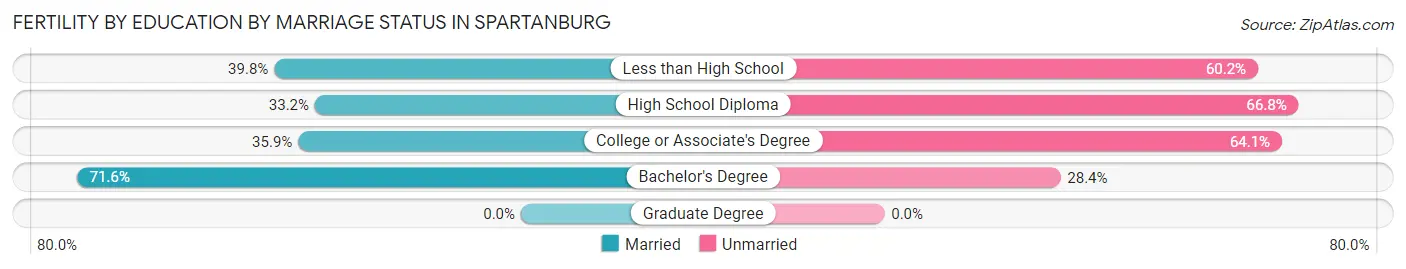
| Educational Attainment | Married | Unmarried |
| Less than High School | 35 (39.8%) | 53 (60.2%) |
| High School Diploma | 88 (33.2%) | 177 (66.8%) |
| College or Associate's Degree | 42 (35.9%) | 75 (64.1%) |
| Bachelor's Degree | 53 (71.6%) | 21 (28.4%) |
| Graduate Degree | 0 (0.0%) | 0 (0.0%) |
| Total | 218 (40.1%) | 326 (59.9%) |
Employment Characteristics in Spartanburg
Employment by Class of Employer in Spartanburg
Among the 15,894 employed individuals in Spartanburg, private company employees (10,803 | 68.0%), not-for-profit organizations (1,409 | 8.9%), and state government employees (1,232 | 7.7%) make up the most common classes of employment.
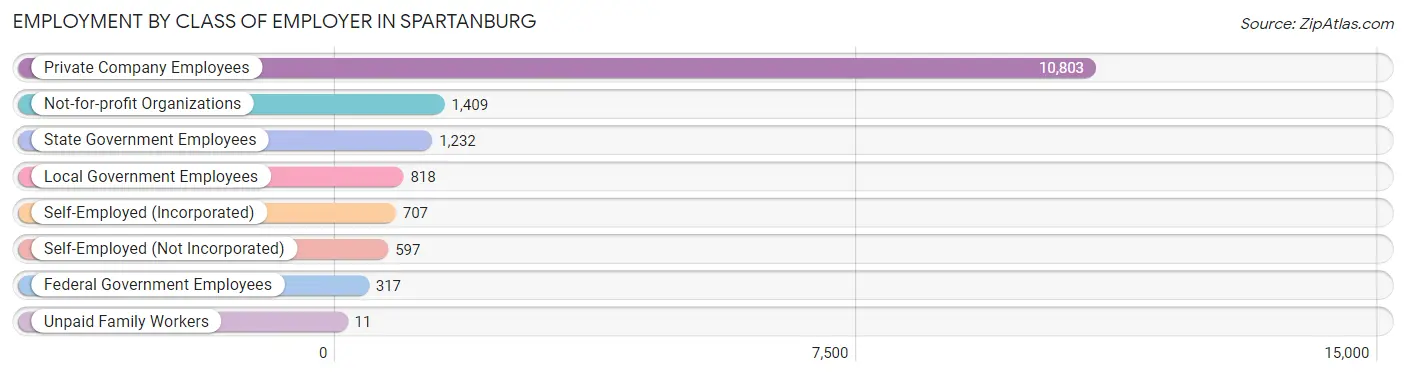
| Employer Class | # Employees | % Employees |
| Private Company Employees | 10,803 | 68.0% |
| Self-Employed (Incorporated) | 707 | 4.4% |
| Self-Employed (Not Incorporated) | 597 | 3.8% |
| Not-for-profit Organizations | 1,409 | 8.9% |
| Local Government Employees | 818 | 5.1% |
| State Government Employees | 1,232 | 7.7% |
| Federal Government Employees | 317 | 2.0% |
| Unpaid Family Workers | 11 | 0.1% |
| Total | 15,894 | 100.0% |
Employment Status by Age in Spartanburg
According to the labor force statistics for Spartanburg, out of the total population over 16 years of age (30,304), 58.9% or 17,849 individuals are in the labor force, with 7.5% or 1,339 of them unemployed. The age group with the highest labor force participation rate is 35 to 44 years, with 83.0% or 3,922 individuals in the labor force. Within the labor force, the 16 to 19 years age range has the highest percentage of unemployed individuals, with 20.6% or 202 of them being unemployed.
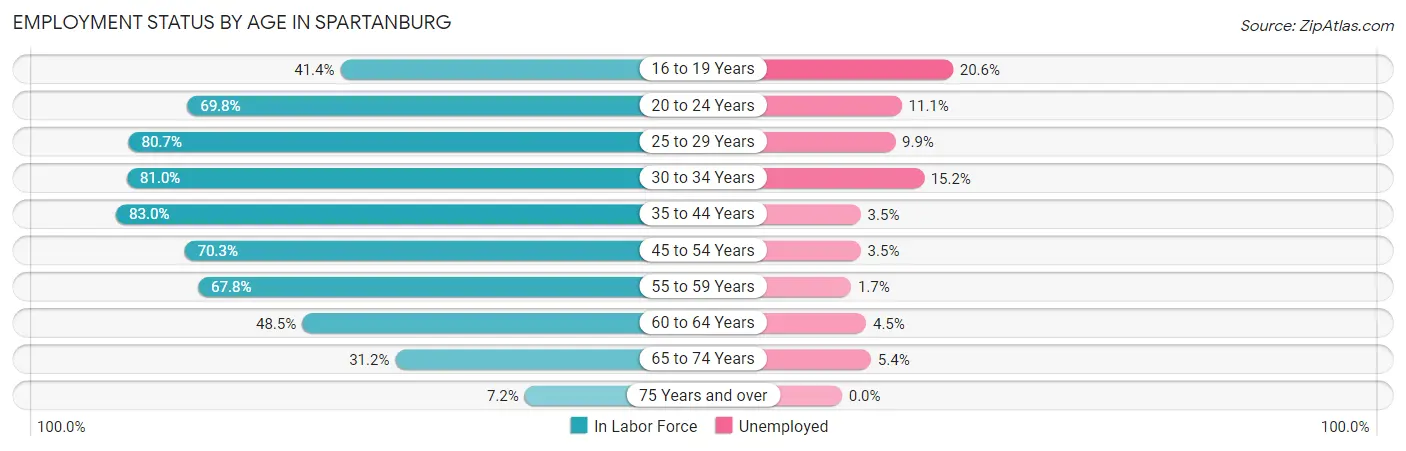
| Age Bracket | In Labor Force | Unemployed |
| 16 to 19 Years | 982 (41.4%) | 202 (20.6%) |
| 20 to 24 Years | 2,130 (69.8%) | 236 (11.1%) |
| 25 to 29 Years | 2,218 (80.7%) | 220 (9.9%) |
| 30 to 34 Years | 2,150 (81.0%) | 327 (15.2%) |
| 35 to 44 Years | 3,922 (83.0%) | 137 (3.5%) |
| 45 to 54 Years | 2,162 (70.3%) | 76 (3.5%) |
| 55 to 59 Years | 1,797 (67.8%) | 31 (1.7%) |
| 60 to 64 Years | 1,130 (48.5%) | 51 (4.5%) |
| 65 to 74 Years | 1,143 (31.2%) | 62 (5.4%) |
| 75 Years and over | 219 (7.2%) | 0 (0.0%) |
| Total | 17,849 (58.9%) | 1,339 (7.5%) |
Employment Status by Educational Attainment in Spartanburg
According to labor force statistics for Spartanburg, 73.6% of individuals (13,381) out of the total population between 25 and 64 years of age (18,181) are in the labor force, with 6.3% or 843 of them being unemployed. The group with the highest labor force participation rate are those with the educational attainment of bachelor's degree or higher, with 86.8% or 5,187 individuals in the labor force. Within the labor force, individuals with less than high school education have the highest percentage of unemployment, with 10.9% or 125 of them being unemployed.
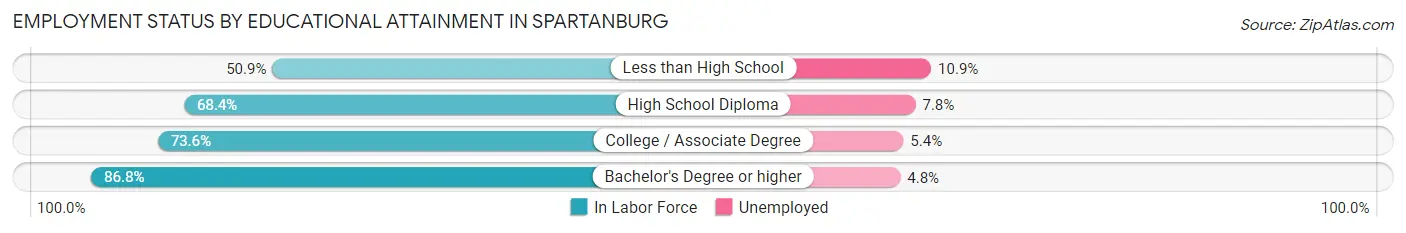
| Educational Attainment | In Labor Force | Unemployed |
| Less than High School | 1,148 (50.9%) | 246 (10.9%) |
| High School Diploma | 3,599 (68.4%) | 410 (7.8%) |
| College / Associate Degree | 3,450 (73.6%) | 253 (5.4%) |
| Bachelor's Degree or higher | 5,187 (86.8%) | 287 (4.8%) |
| Total | 13,381 (73.6%) | 1,145 (6.3%) |
Employment Occupations by Sex in Spartanburg
Management, Business, Science and Arts Occupations
The most common Management, Business, Science and Arts occupations in Spartanburg are Community & Social Service (1,938 | 11.7%), Management (1,492 | 9.0%), Education Instruction & Library (1,331 | 8.1%), Health Diagnosing & Treating (1,154 | 7.0%), and Health Technologists (782 | 4.7%).
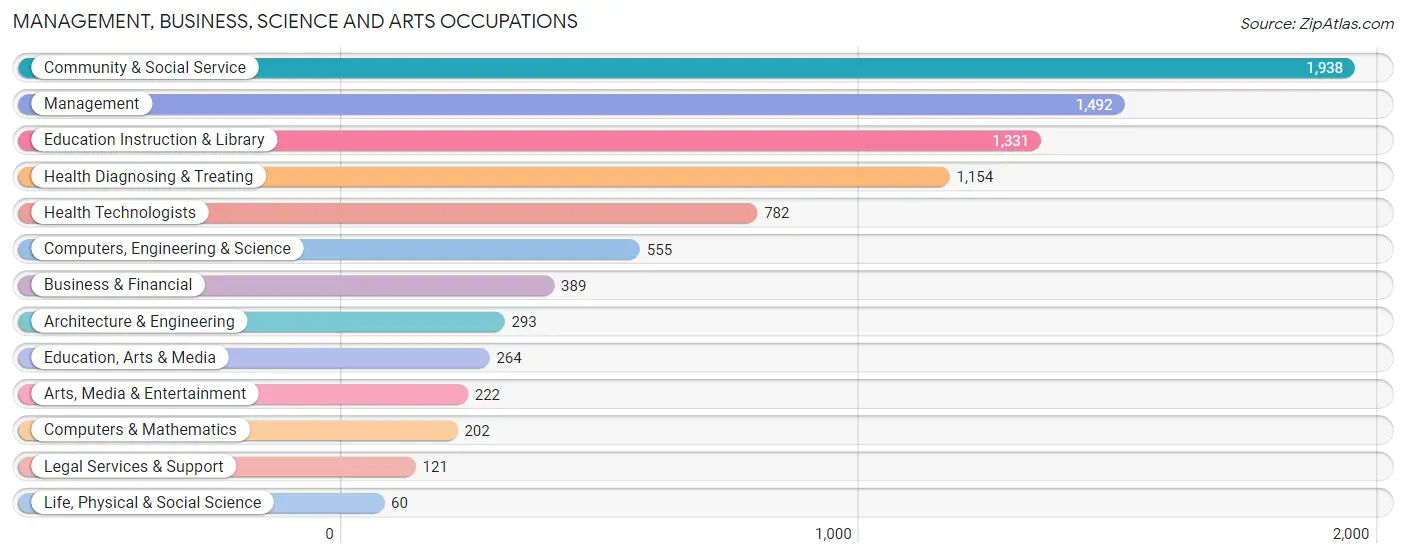
Management, Business, Science and Arts Occupations by Sex
Within the Management, Business, Science and Arts occupations in Spartanburg, the most male-oriented occupations are Computers & Mathematics (93.1%), Computers, Engineering & Science (84.0%), and Legal Services & Support (80.2%), while the most female-oriented occupations are Education Instruction & Library (74.4%), Health Diagnosing & Treating (68.9%), and Community & Social Service (65.3%).
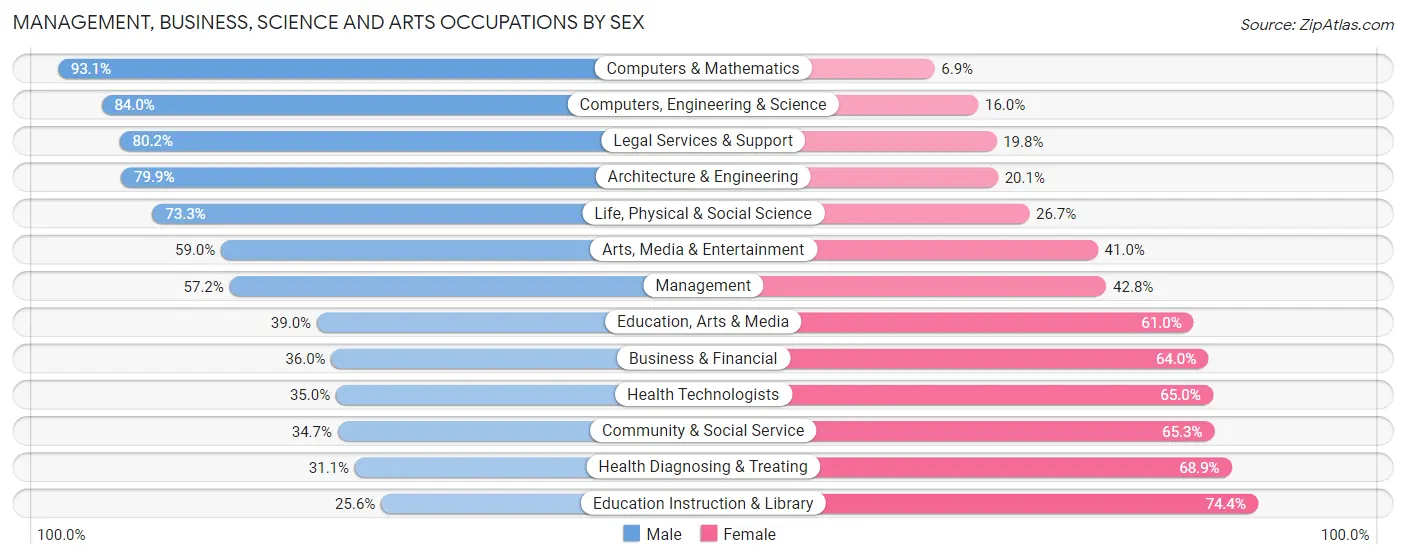
| Occupation | Male | Female |
| Management | 854 (57.2%) | 638 (42.8%) |
| Business & Financial | 140 (36.0%) | 249 (64.0%) |
| Computers, Engineering & Science | 466 (84.0%) | 89 (16.0%) |
| Computers & Mathematics | 188 (93.1%) | 14 (6.9%) |
| Architecture & Engineering | 234 (79.9%) | 59 (20.1%) |
| Life, Physical & Social Science | 44 (73.3%) | 16 (26.7%) |
| Community & Social Service | 672 (34.7%) | 1,266 (65.3%) |
| Education, Arts & Media | 103 (39.0%) | 161 (61.0%) |
| Legal Services & Support | 97 (80.2%) | 24 (19.8%) |
| Education Instruction & Library | 341 (25.6%) | 990 (74.4%) |
| Arts, Media & Entertainment | 131 (59.0%) | 91 (41.0%) |
| Health Diagnosing & Treating | 359 (31.1%) | 795 (68.9%) |
| Health Technologists | 274 (35.0%) | 508 (65.0%) |
| Total (Category) | 2,491 (45.1%) | 3,037 (54.9%) |
| Total (Overall) | 8,158 (49.4%) | 8,340 (50.5%) |
Services Occupations
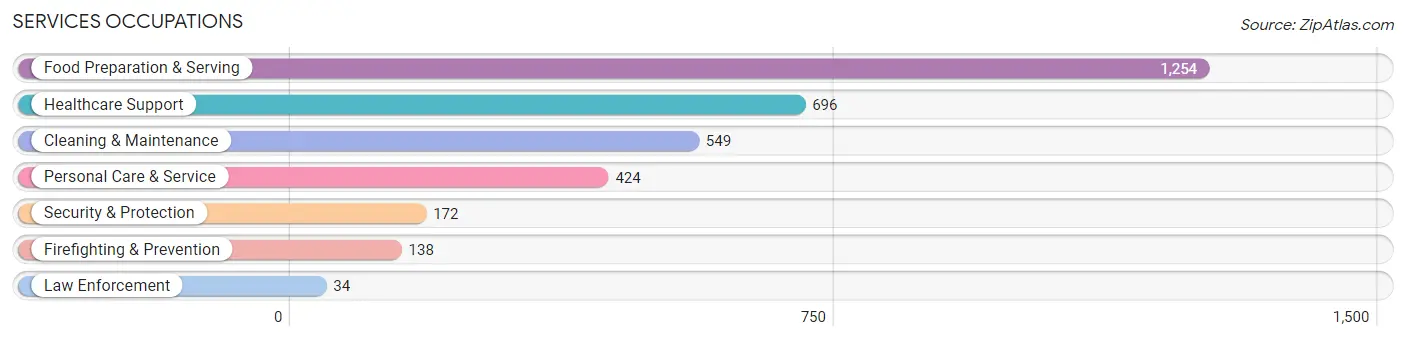
The most common Services occupations in Spartanburg are Food Preparation & Serving (1,254 | 7.6%), Healthcare Support (696 | 4.2%), Cleaning & Maintenance (549 | 3.3%), Personal Care & Service (424 | 2.6%), and Security & Protection (172 | 1.0%).
Services Occupations by Sex
Within the Services occupations in Spartanburg, the most male-oriented occupations are Law Enforcement (100.0%), Security & Protection (49.4%), and Cleaning & Maintenance (42.3%), while the most female-oriented occupations are Healthcare Support (83.3%), Food Preparation & Serving (65.9%), and Personal Care & Service (64.4%).
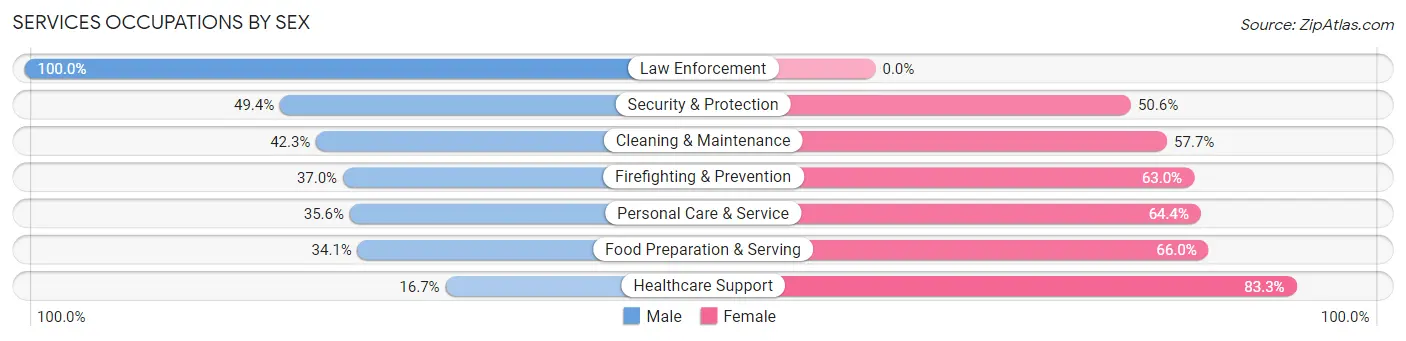
| Occupation | Male | Female |
| Healthcare Support | 116 (16.7%) | 580 (83.3%) |
| Security & Protection | 85 (49.4%) | 87 (50.6%) |
| Firefighting & Prevention | 51 (37.0%) | 87 (63.0%) |
| Law Enforcement | 34 (100.0%) | 0 (0.0%) |
| Food Preparation & Serving | 427 (34.1%) | 827 (65.9%) |
| Cleaning & Maintenance | 232 (42.3%) | 317 (57.7%) |
| Personal Care & Service | 151 (35.6%) | 273 (64.4%) |
| Total (Category) | 1,011 (32.7%) | 2,084 (67.3%) |
| Total (Overall) | 8,158 (49.4%) | 8,340 (50.5%) |
Sales and Office Occupations
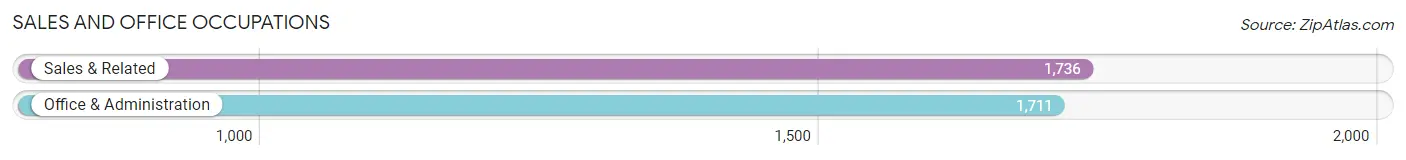
The most common Sales and Office occupations in Spartanburg are Sales & Related (1,736 | 10.5%), and Office & Administration (1,711 | 10.4%).
Sales and Office Occupations by Sex
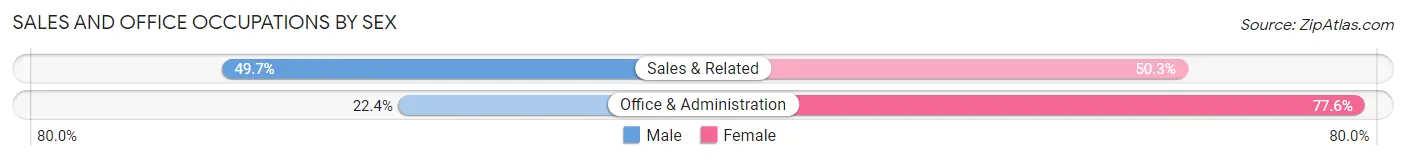
| Occupation | Male | Female |
| Sales & Related | 863 (49.7%) | 873 (50.3%) |
| Office & Administration | 384 (22.4%) | 1,327 (77.6%) |
| Total (Category) | 1,247 (36.2%) | 2,200 (63.8%) |
| Total (Overall) | 8,158 (49.4%) | 8,340 (50.5%) |
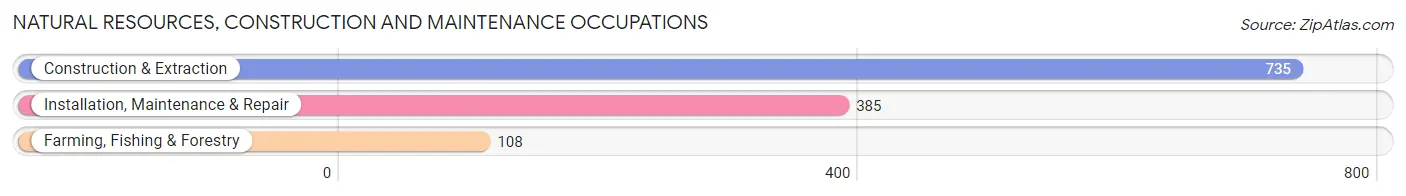
Natural Resources, Construction and Maintenance Occupations
The most common Natural Resources, Construction and Maintenance occupations in Spartanburg are Construction & Extraction (735 | 4.5%), Installation, Maintenance & Repair (385 | 2.3%), and Farming, Fishing & Forestry (108 | 0.6%).
Natural Resources, Construction and Maintenance Occupations by Sex
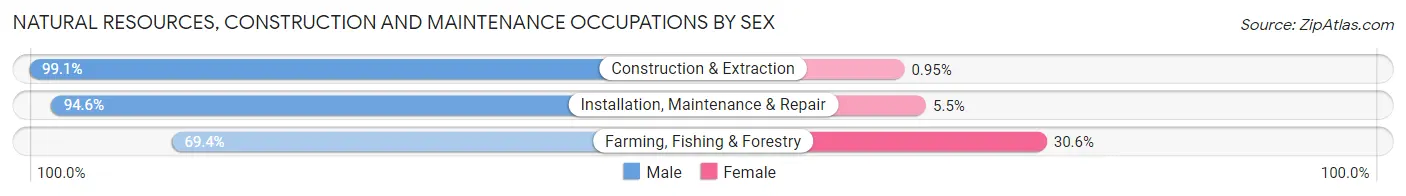
| Occupation | Male | Female |
| Farming, Fishing & Forestry | 75 (69.4%) | 33 (30.6%) |
| Construction & Extraction | 728 (99.1%) | 7 (0.9%) |
| Installation, Maintenance & Repair | 364 (94.6%) | 21 (5.4%) |
| Total (Category) | 1,167 (95.0%) | 61 (5.0%) |
| Total (Overall) | 8,158 (49.4%) | 8,340 (50.5%) |
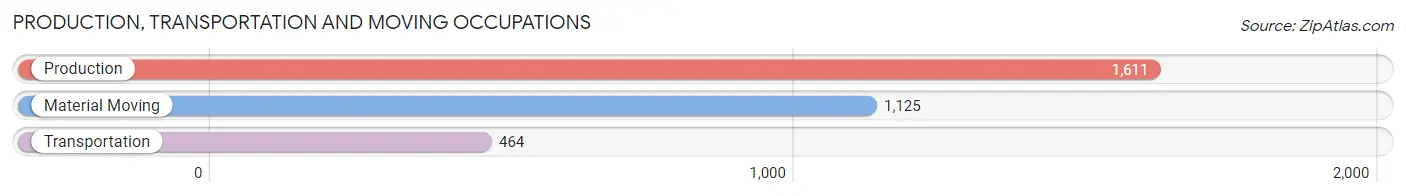
Production, Transportation and Moving Occupations
The most common Production, Transportation and Moving occupations in Spartanburg are Production (1,611 | 9.8%), Material Moving (1,125 | 6.8%), and Transportation (464 | 2.8%).
Production, Transportation and Moving Occupations by Sex
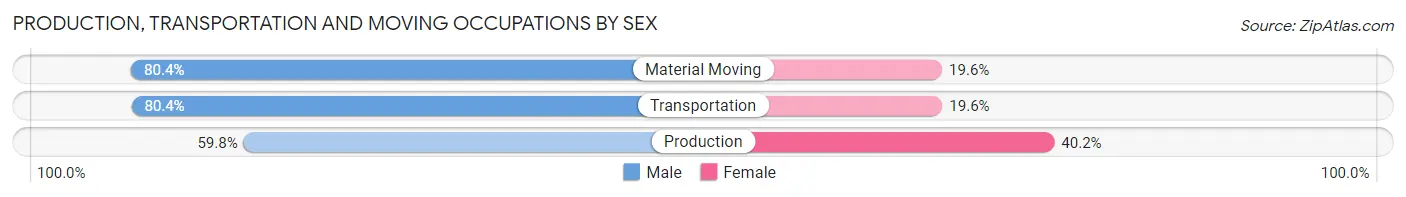
| Occupation | Male | Female |
| Production | 964 (59.8%) | 647 (40.2%) |
| Transportation | 373 (80.4%) | 91 (19.6%) |
| Material Moving | 905 (80.4%) | 220 (19.6%) |
| Total (Category) | 2,242 (70.1%) | 958 (29.9%) |
| Total (Overall) | 8,158 (49.4%) | 8,340 (50.5%) |
Employment Industries by Sex in Spartanburg
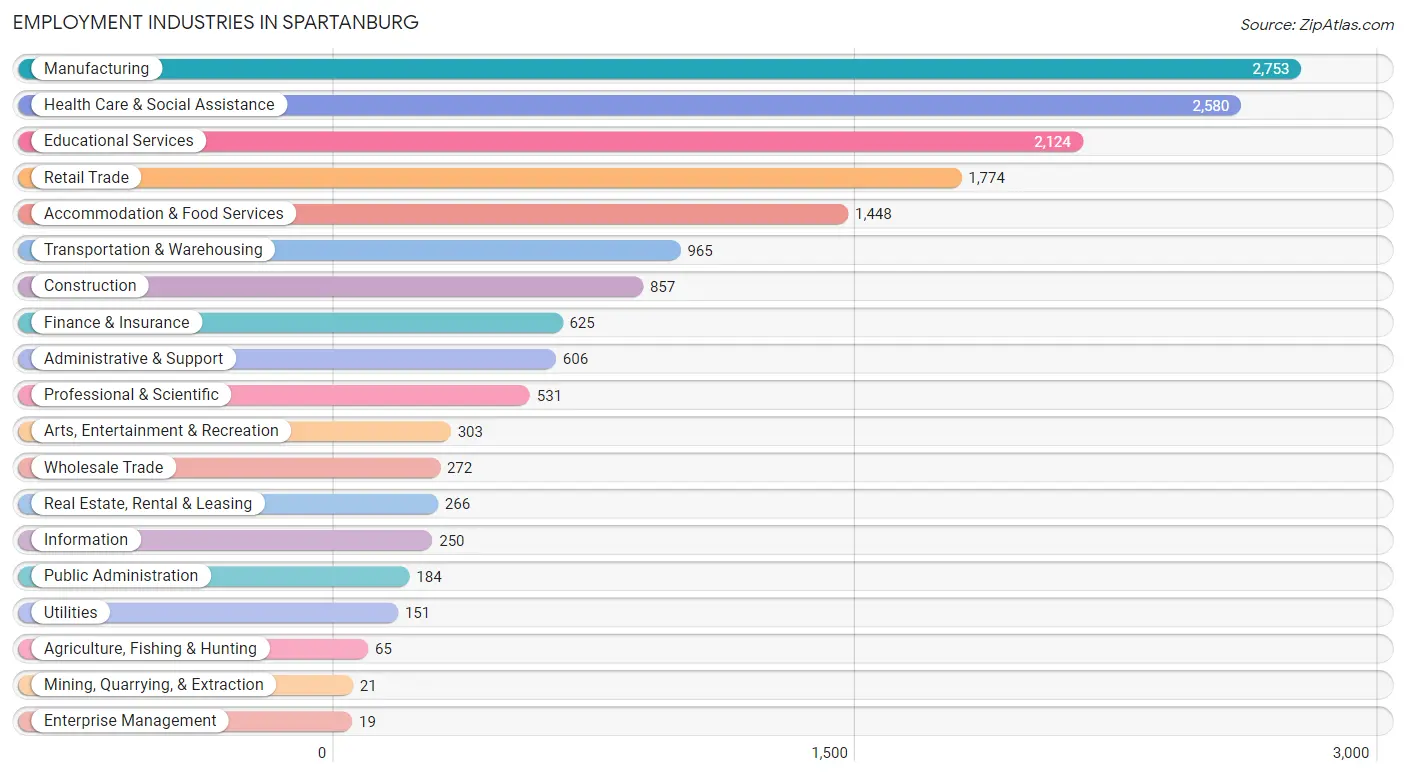
Employment Industries in Spartanburg
The major employment industries in Spartanburg include Manufacturing (2,753 | 16.7%), Health Care & Social Assistance (2,580 | 15.6%), Educational Services (2,124 | 12.9%), Retail Trade (1,774 | 10.7%), and Accommodation & Food Services (1,448 | 8.8%).
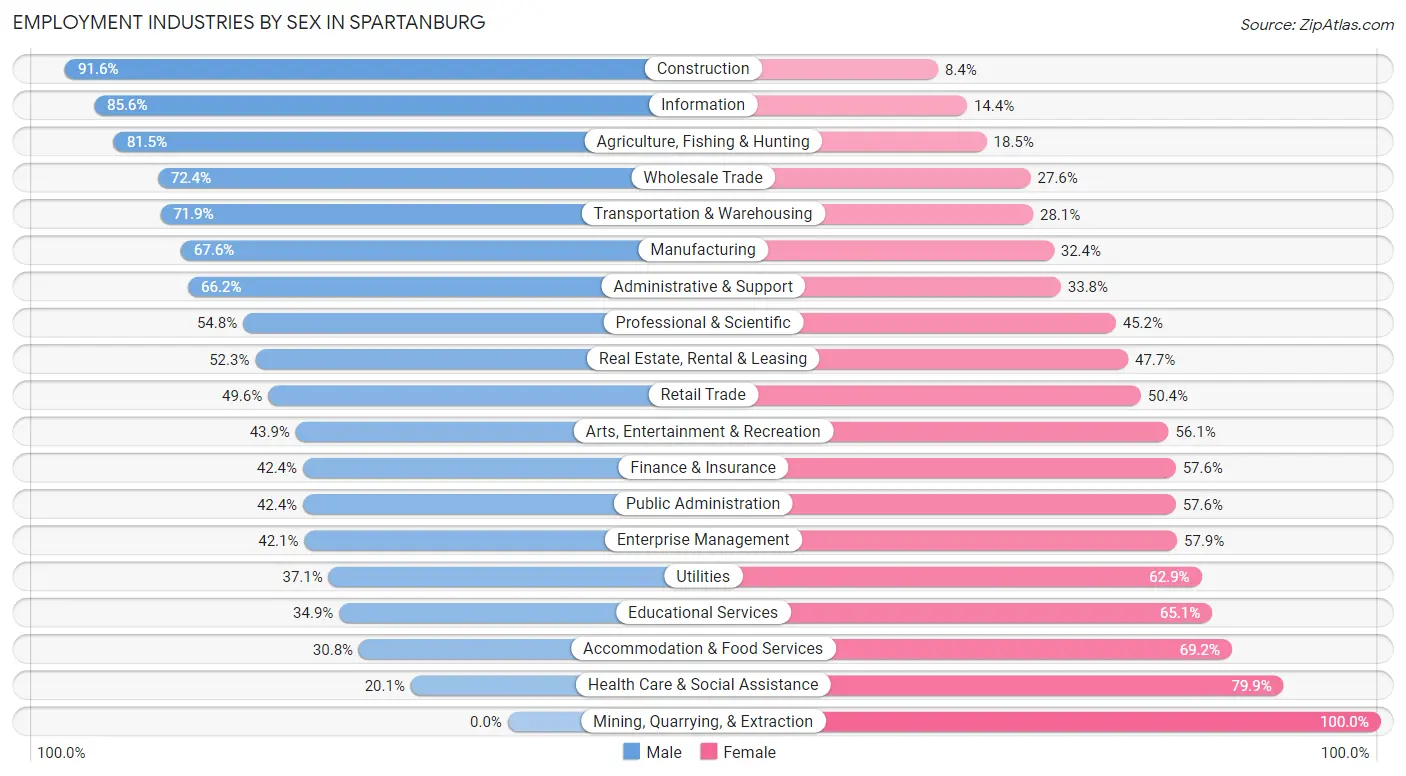
Employment Industries by Sex in Spartanburg
The Spartanburg industries that see more men than women are Construction (91.6%), Information (85.6%), and Agriculture, Fishing & Hunting (81.5%), whereas the industries that tend to have a higher number of women are Mining, Quarrying, & Extraction (100.0%), Health Care & Social Assistance (79.9%), and Accommodation & Food Services (69.2%).
| Industry | Male | Female |
| Agriculture, Fishing & Hunting | 53 (81.5%) | 12 (18.5%) |
| Mining, Quarrying, & Extraction | 0 (0.0%) | 21 (100.0%) |
| Construction | 785 (91.6%) | 72 (8.4%) |
| Manufacturing | 1,862 (67.6%) | 891 (32.4%) |
| Wholesale Trade | 197 (72.4%) | 75 (27.6%) |
| Retail Trade | 880 (49.6%) | 894 (50.4%) |
| Transportation & Warehousing | 694 (71.9%) | 271 (28.1%) |
| Utilities | 56 (37.1%) | 95 (62.9%) |
| Information | 214 (85.6%) | 36 (14.4%) |
| Finance & Insurance | 265 (42.4%) | 360 (57.6%) |
| Real Estate, Rental & Leasing | 139 (52.3%) | 127 (47.7%) |
| Professional & Scientific | 291 (54.8%) | 240 (45.2%) |
| Enterprise Management | 8 (42.1%) | 11 (57.9%) |
| Administrative & Support | 401 (66.2%) | 205 (33.8%) |
| Educational Services | 741 (34.9%) | 1,383 (65.1%) |
| Health Care & Social Assistance | 518 (20.1%) | 2,062 (79.9%) |
| Arts, Entertainment & Recreation | 133 (43.9%) | 170 (56.1%) |
| Accommodation & Food Services | 446 (30.8%) | 1,002 (69.2%) |
| Public Administration | 78 (42.4%) | 106 (57.6%) |
| Total | 8,158 (49.4%) | 8,340 (50.5%) |
Education in Spartanburg
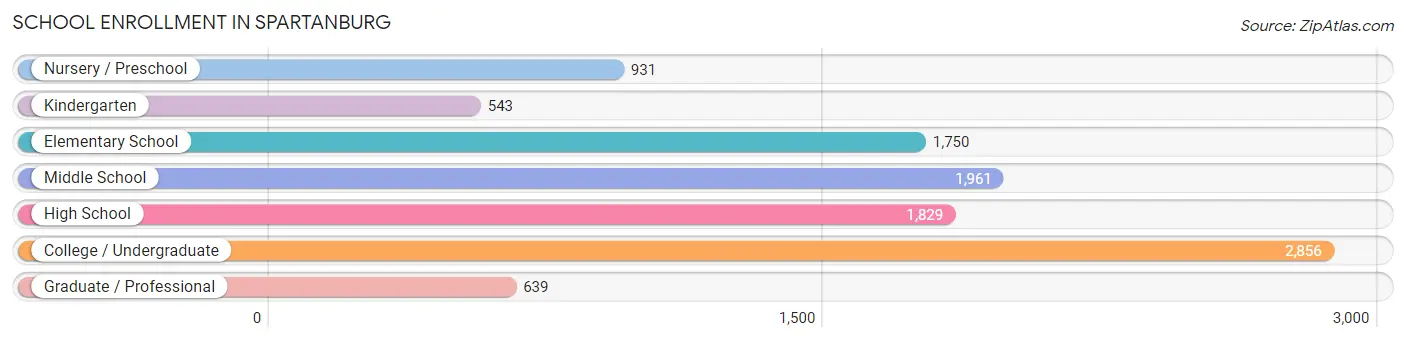
School Enrollment in Spartanburg
The most common levels of schooling among the 10,509 students in Spartanburg are college / undergraduate (2,856 | 27.2%), middle school (1,961 | 18.7%), and high school (1,829 | 17.4%).
| School Level | # Students | % Students |
| Nursery / Preschool | 931 | 8.9% |
| Kindergarten | 543 | 5.2% |
| Elementary School | 1,750 | 16.7% |
| Middle School | 1,961 | 18.7% |
| High School | 1,829 | 17.4% |
| College / Undergraduate | 2,856 | 27.2% |
| Graduate / Professional | 639 | 6.1% |
| Total | 10,509 | 100.0% |
School Enrollment by Age by Funding Source in Spartanburg
Out of a total of 10,509 students who are enrolled in schools in Spartanburg, 3,132 (29.8%) attend a private institution, while the remaining 7,377 (70.2%) are enrolled in public schools. The age group of 20 to 24 year olds has the highest likelihood of being enrolled in private schools, with 972 (70.2% in the age bracket) enrolled. Conversely, the age group of 10 to 14 year olds has the lowest likelihood of being enrolled in a private school, with 2,074 (91.2% in the age bracket) attending a public institution.
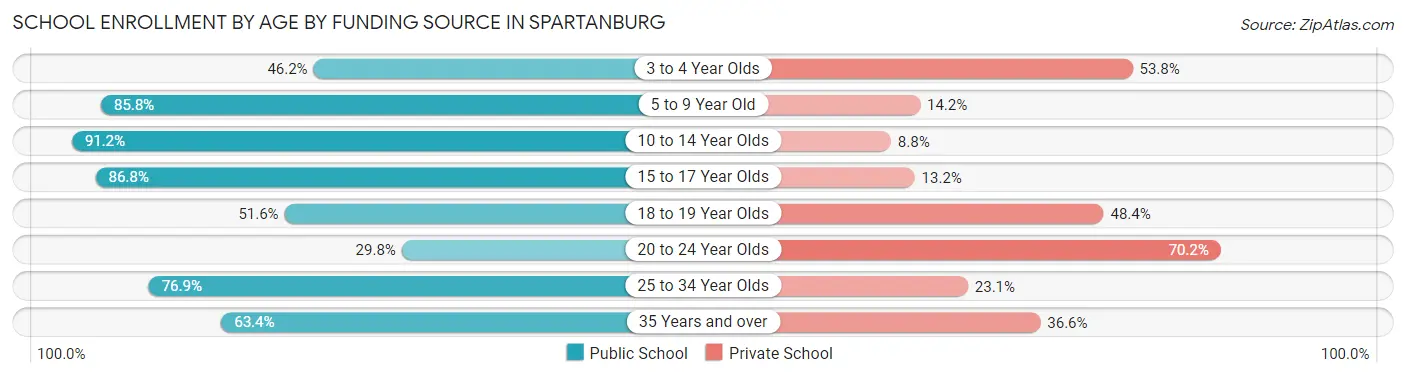
| Age Bracket | Public School | Private School |
| 3 to 4 Year Olds | 450 (46.2%) | 524 (53.8%) |
| 5 to 9 Year Old | 1,756 (85.8%) | 291 (14.2%) |
| 10 to 14 Year Olds | 2,074 (91.2%) | 200 (8.8%) |
| 15 to 17 Year Olds | 1,221 (86.8%) | 186 (13.2%) |
| 18 to 19 Year Olds | 663 (51.6%) | 622 (48.4%) |
| 20 to 24 Year Olds | 412 (29.8%) | 972 (70.2%) |
| 25 to 34 Year Olds | 472 (76.9%) | 142 (23.1%) |
| 35 Years and over | 332 (63.4%) | 192 (36.6%) |
| Total | 7,377 (70.2%) | 3,132 (29.8%) |
Educational Attainment by Field of Study in Spartanburg
Business (1,738 | 20.0%), education (1,106 | 12.7%), science & technology (831 | 9.5%), liberal arts & history (661 | 7.6%), and arts & humanities (657 | 7.5%) are the most common fields of study among 8,712 individuals in Spartanburg who have obtained a bachelor's degree or higher.
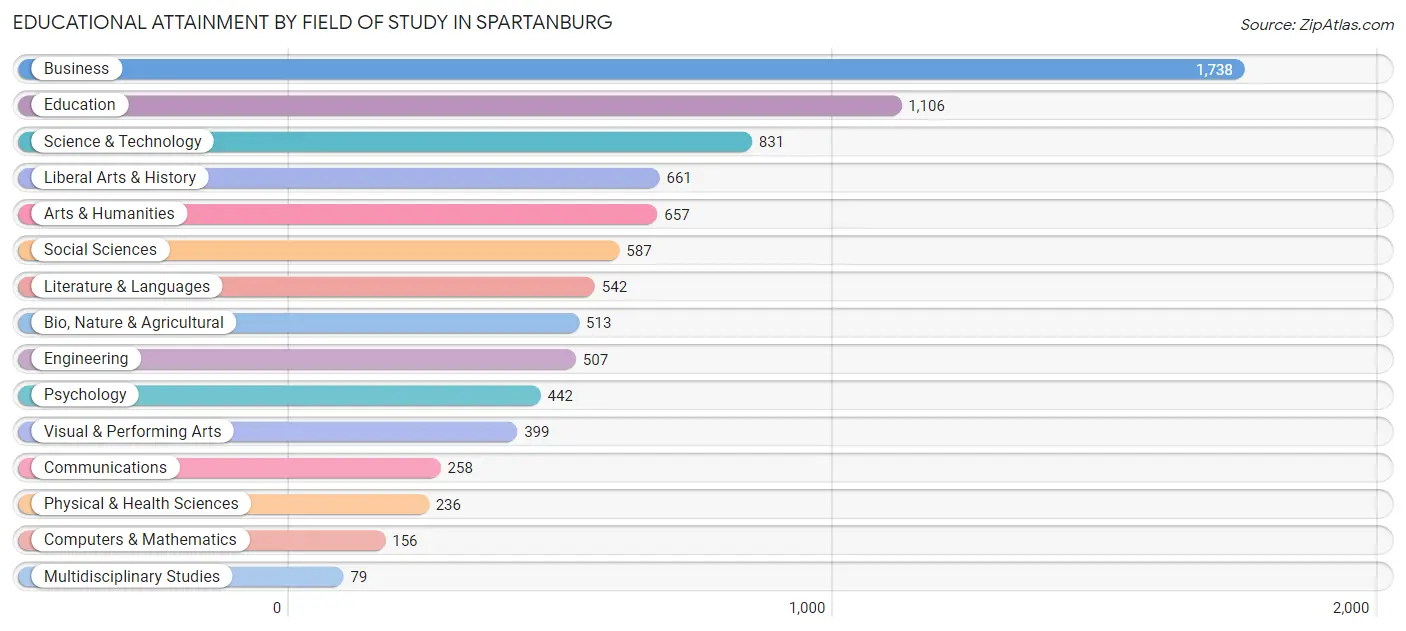
| Field of Study | # Graduates | % Graduates |
| Computers & Mathematics | 156 | 1.8% |
| Bio, Nature & Agricultural | 513 | 5.9% |
| Physical & Health Sciences | 236 | 2.7% |
| Psychology | 442 | 5.1% |
| Social Sciences | 587 | 6.7% |
| Engineering | 507 | 5.8% |
| Multidisciplinary Studies | 79 | 0.9% |
| Science & Technology | 831 | 9.5% |
| Business | 1,738 | 20.0% |
| Education | 1,106 | 12.7% |
| Literature & Languages | 542 | 6.2% |
| Liberal Arts & History | 661 | 7.6% |
| Visual & Performing Arts | 399 | 4.6% |
| Communications | 258 | 3.0% |
| Arts & Humanities | 657 | 7.5% |
| Total | 8,712 | 100.0% |
Transportation & Commute in Spartanburg
Vehicle Availability by Sex in Spartanburg
The most prevalent vehicle ownership categories in Spartanburg are males with 2 vehicles (3,488, accounting for 46.4%) and females with 2 vehicles (2,994, making up 45.6%).
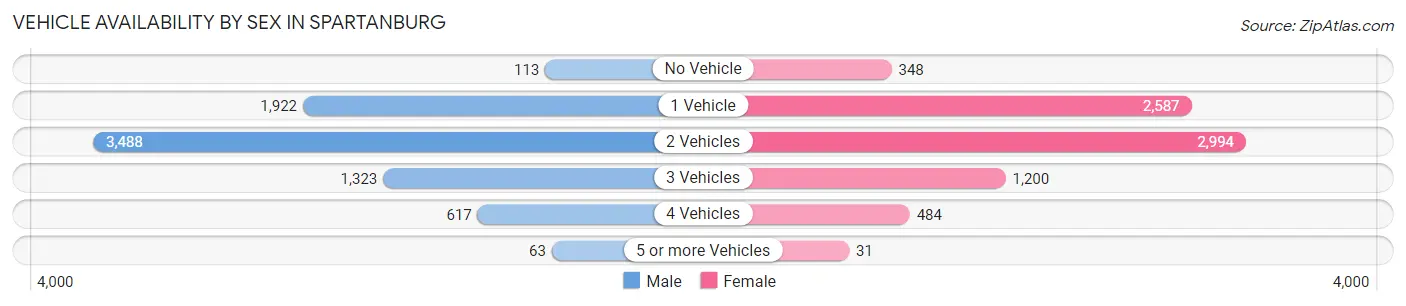
| Vehicles Available | Male | Female |
| No Vehicle | 113 (1.5%) | 348 (4.5%) |
| 1 Vehicle | 1,922 (25.5%) | 2,587 (33.8%) |
| 2 Vehicles | 3,488 (46.4%) | 2,994 (39.2%) |
| 3 Vehicles | 1,323 (17.6%) | 1,200 (15.7%) |
| 4 Vehicles | 617 (8.2%) | 484 (6.3%) |
| 5 or more Vehicles | 63 (0.8%) | 31 (0.4%) |
| Total | 7,526 (100.0%) | 7,644 (100.0%) |
Commute Time in Spartanburg
The most frequently occuring commute durations in Spartanburg are 10 to 14 minutes (3,107 commuters, 20.6%), 15 to 19 minutes (2,745 commuters, 18.2%), and 20 to 24 minutes (2,199 commuters, 14.6%).
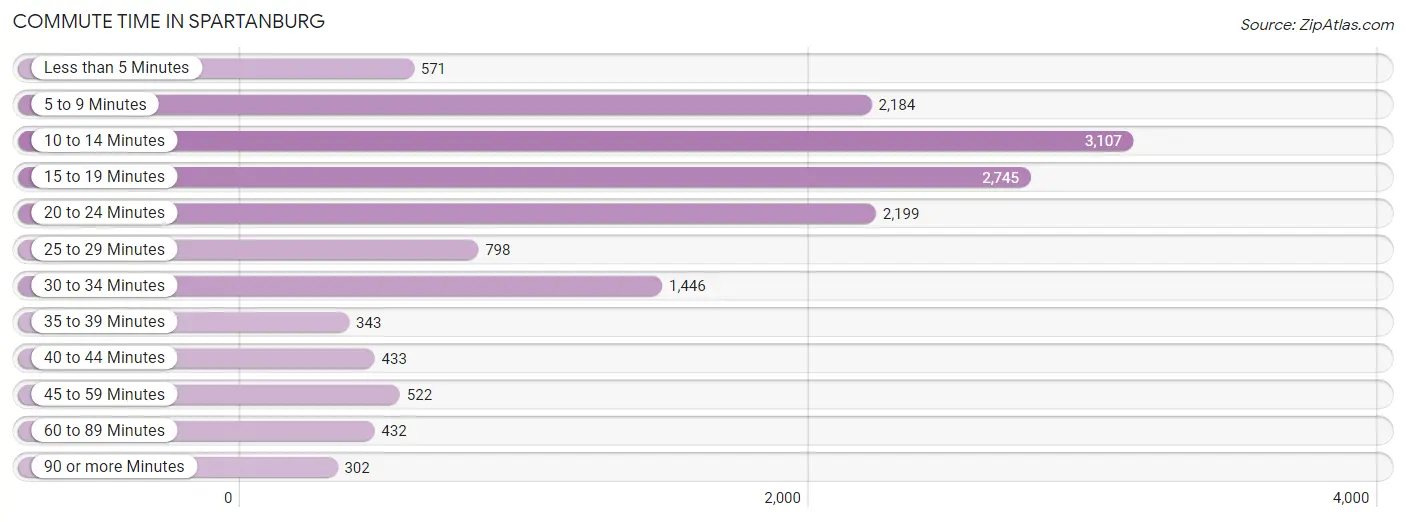
| Commute Time | # Commuters | % Commuters |
| Less than 5 Minutes | 571 | 3.8% |
| 5 to 9 Minutes | 2,184 | 14.5% |
| 10 to 14 Minutes | 3,107 | 20.6% |
| 15 to 19 Minutes | 2,745 | 18.2% |
| 20 to 24 Minutes | 2,199 | 14.6% |
| 25 to 29 Minutes | 798 | 5.3% |
| 30 to 34 Minutes | 1,446 | 9.6% |
| 35 to 39 Minutes | 343 | 2.3% |
| 40 to 44 Minutes | 433 | 2.9% |
| 45 to 59 Minutes | 522 | 3.5% |
| 60 to 89 Minutes | 432 | 2.9% |
| 90 or more Minutes | 302 | 2.0% |
Commute Time by Sex in Spartanburg
The most common commute times in Spartanburg are 15 to 19 minutes (1,357 commuters, 18.0%) for males and 10 to 14 minutes (1,814 commuters, 24.1%) for females.
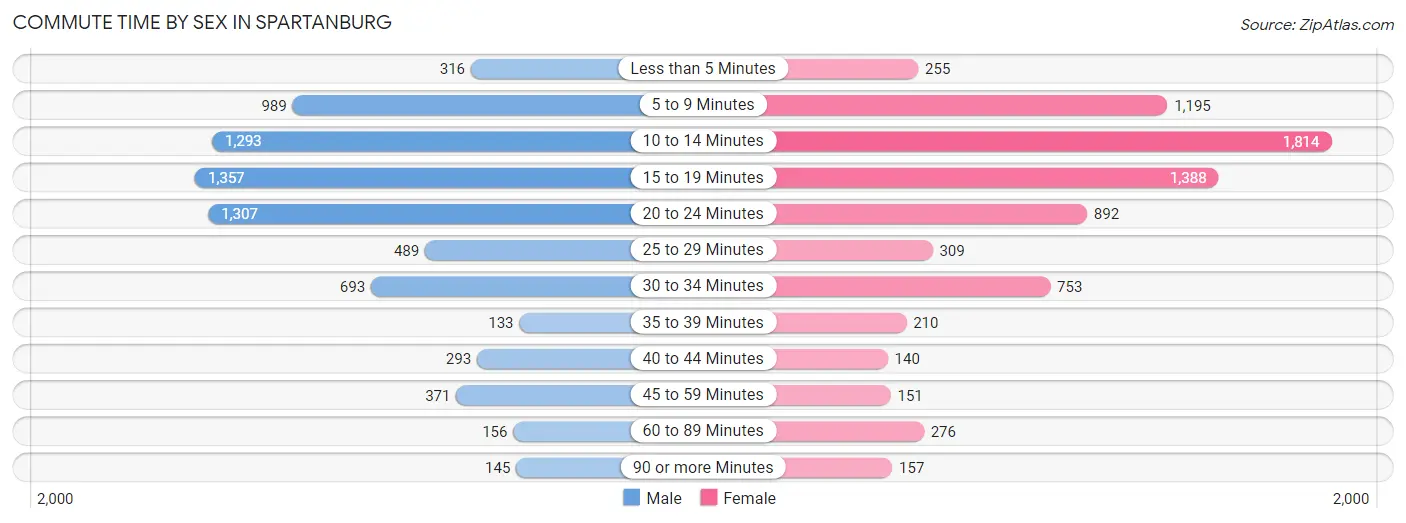
| Commute Time | Male | Female |
| Less than 5 Minutes | 316 (4.2%) | 255 (3.4%) |
| 5 to 9 Minutes | 989 (13.1%) | 1,195 (15.9%) |
| 10 to 14 Minutes | 1,293 (17.1%) | 1,814 (24.1%) |
| 15 to 19 Minutes | 1,357 (18.0%) | 1,388 (18.4%) |
| 20 to 24 Minutes | 1,307 (17.3%) | 892 (11.8%) |
| 25 to 29 Minutes | 489 (6.5%) | 309 (4.1%) |
| 30 to 34 Minutes | 693 (9.2%) | 753 (10.0%) |
| 35 to 39 Minutes | 133 (1.8%) | 210 (2.8%) |
| 40 to 44 Minutes | 293 (3.9%) | 140 (1.9%) |
| 45 to 59 Minutes | 371 (4.9%) | 151 (2.0%) |
| 60 to 89 Minutes | 156 (2.1%) | 276 (3.7%) |
| 90 or more Minutes | 145 (1.9%) | 157 (2.1%) |
Time of Departure to Work by Sex in Spartanburg
The most frequent times of departure to work in Spartanburg are 4:00 PM to 11:59 PM (1,097, 14.5%) for males and 7:00 AM to 7:29 AM (1,377, 18.3%) for females.
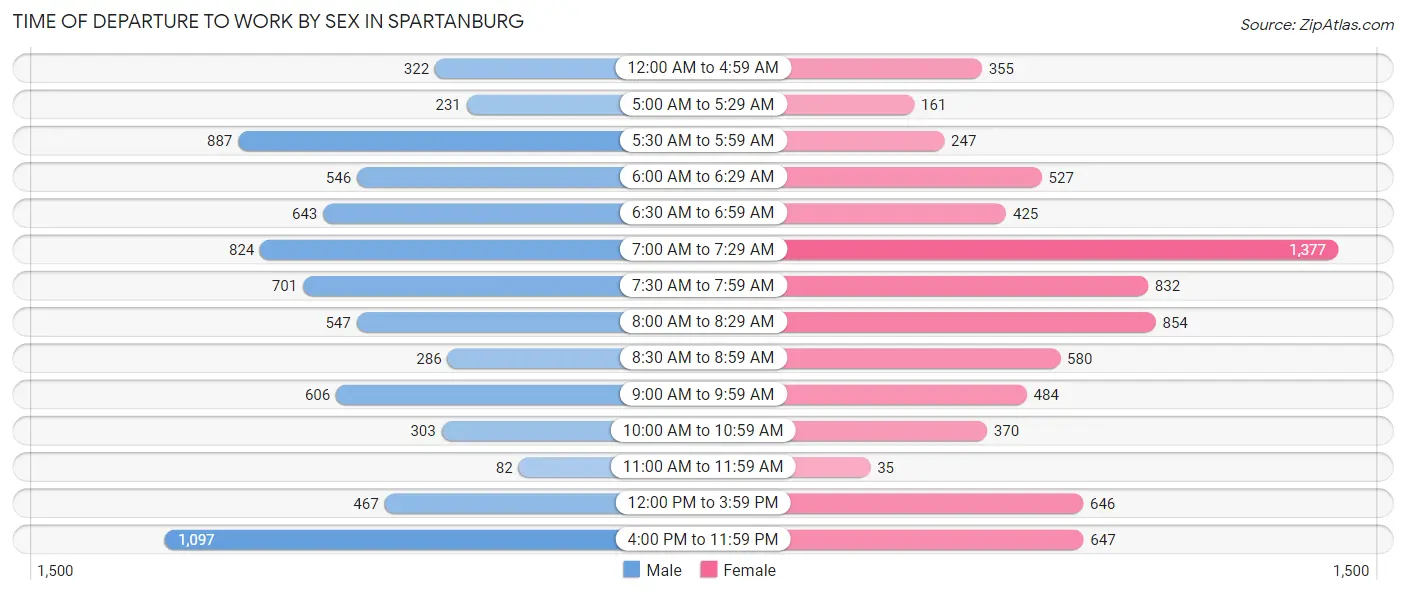
| Time of Departure | Male | Female |
| 12:00 AM to 4:59 AM | 322 (4.3%) | 355 (4.7%) |
| 5:00 AM to 5:29 AM | 231 (3.1%) | 161 (2.1%) |
| 5:30 AM to 5:59 AM | 887 (11.8%) | 247 (3.3%) |
| 6:00 AM to 6:29 AM | 546 (7.2%) | 527 (7.0%) |
| 6:30 AM to 6:59 AM | 643 (8.5%) | 425 (5.6%) |
| 7:00 AM to 7:29 AM | 824 (10.9%) | 1,377 (18.3%) |
| 7:30 AM to 7:59 AM | 701 (9.3%) | 832 (11.0%) |
| 8:00 AM to 8:29 AM | 547 (7.2%) | 854 (11.3%) |
| 8:30 AM to 8:59 AM | 286 (3.8%) | 580 (7.7%) |
| 9:00 AM to 9:59 AM | 606 (8.0%) | 484 (6.4%) |
| 10:00 AM to 10:59 AM | 303 (4.0%) | 370 (4.9%) |
| 11:00 AM to 11:59 AM | 82 (1.1%) | 35 (0.5%) |
| 12:00 PM to 3:59 PM | 467 (6.2%) | 646 (8.6%) |
| 4:00 PM to 11:59 PM | 1,097 (14.5%) | 647 (8.6%) |
| Total | 7,542 (100.0%) | 7,540 (100.0%) |
Housing Occupancy in Spartanburg
Occupancy by Ownership in Spartanburg
Of the total 15,587 dwellings in Spartanburg, owner-occupied units account for 8,254 (52.9%), while renter-occupied units make up 7,333 (47.0%).
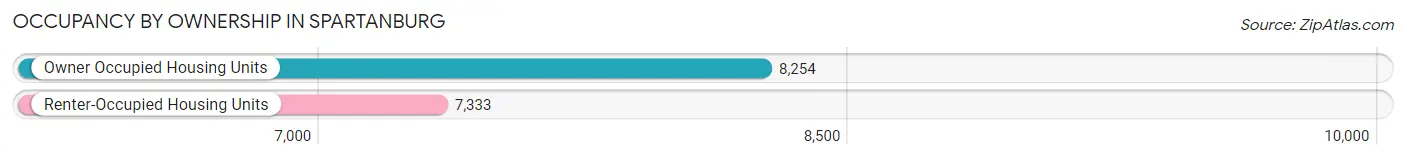
| Occupancy | # Housing Units | % Housing Units |
| Owner Occupied Housing Units | 8,254 | 52.9% |
| Renter-Occupied Housing Units | 7,333 | 47.0% |
| Total Occupied Housing Units | 15,587 | 100.0% |
Occupancy by Household Size in Spartanburg
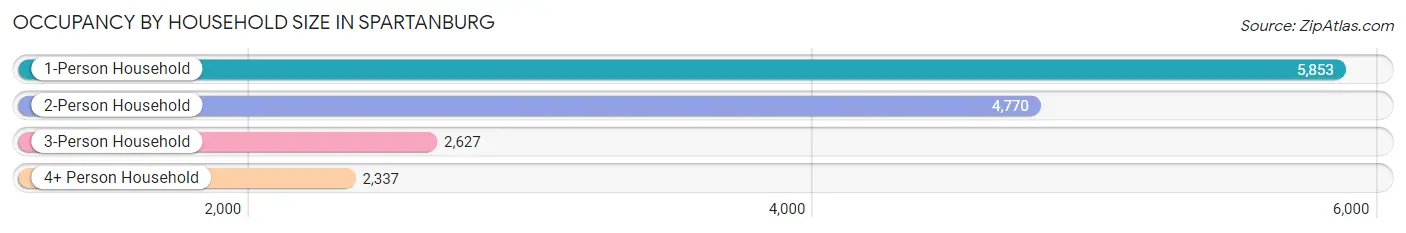
| Household Size | # Housing Units | % Housing Units |
| 1-Person Household | 5,853 | 37.6% |
| 2-Person Household | 4,770 | 30.6% |
| 3-Person Household | 2,627 | 16.9% |
| 4+ Person Household | 2,337 | 15.0% |
| Total Housing Units | 15,587 | 100.0% |
Occupancy by Ownership by Household Size in Spartanburg
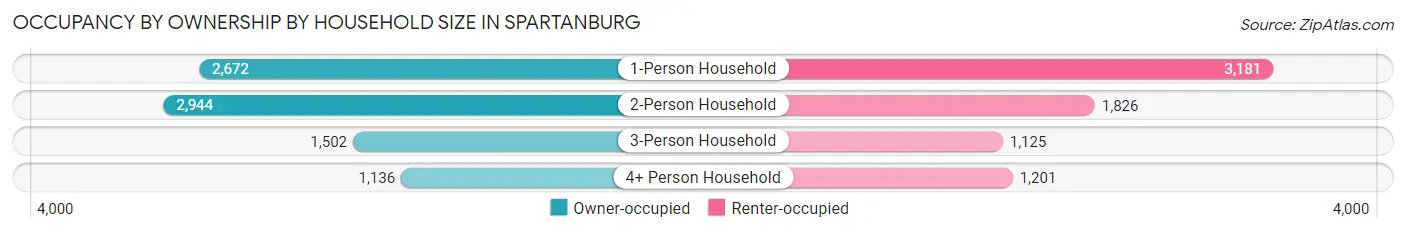
| Household Size | Owner-occupied | Renter-occupied |
| 1-Person Household | 2,672 (45.7%) | 3,181 (54.3%) |
| 2-Person Household | 2,944 (61.7%) | 1,826 (38.3%) |
| 3-Person Household | 1,502 (57.2%) | 1,125 (42.8%) |
| 4+ Person Household | 1,136 (48.6%) | 1,201 (51.4%) |
| Total Housing Units | 8,254 (52.9%) | 7,333 (47.0%) |
Occupancy by Educational Attainment in Spartanburg
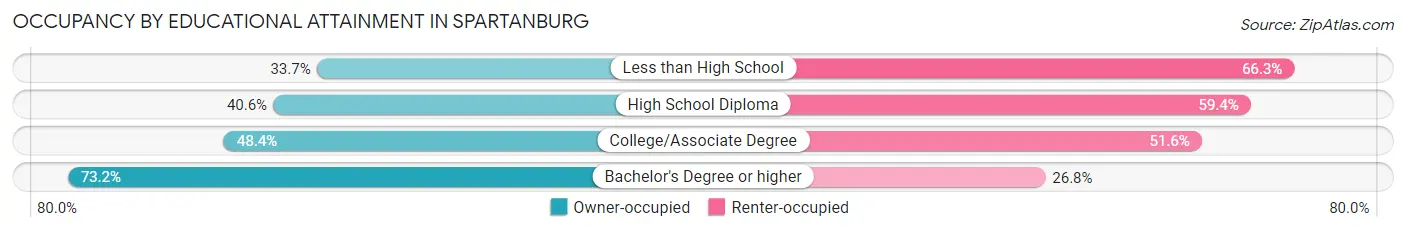
| Household Size | Owner-occupied | Renter-occupied |
| Less than High School | 645 (33.7%) | 1,269 (66.3%) |
| High School Diploma | 1,668 (40.6%) | 2,439 (59.4%) |
| College/Associate Degree | 2,065 (48.4%) | 2,203 (51.6%) |
| Bachelor's Degree or higher | 3,876 (73.2%) | 1,422 (26.8%) |
Occupancy by Age of Householder in Spartanburg
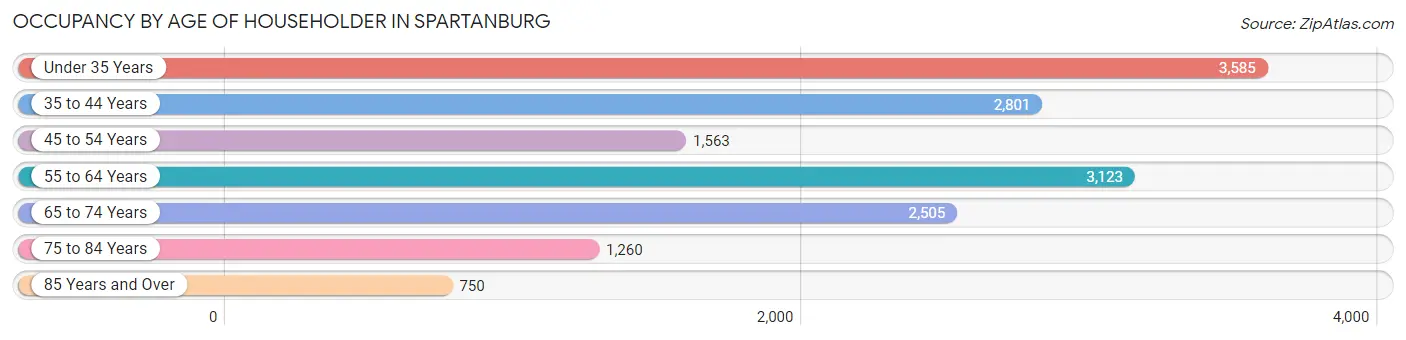
| Age Bracket | # Households | % Households |
| Under 35 Years | 3,585 | 23.0% |
| 35 to 44 Years | 2,801 | 18.0% |
| 45 to 54 Years | 1,563 | 10.0% |
| 55 to 64 Years | 3,123 | 20.0% |
| 65 to 74 Years | 2,505 | 16.1% |
| 75 to 84 Years | 1,260 | 8.1% |
| 85 Years and Over | 750 | 4.8% |
| Total | 15,587 | 100.0% |
Housing Finances in Spartanburg
Median Income by Occupancy in Spartanburg
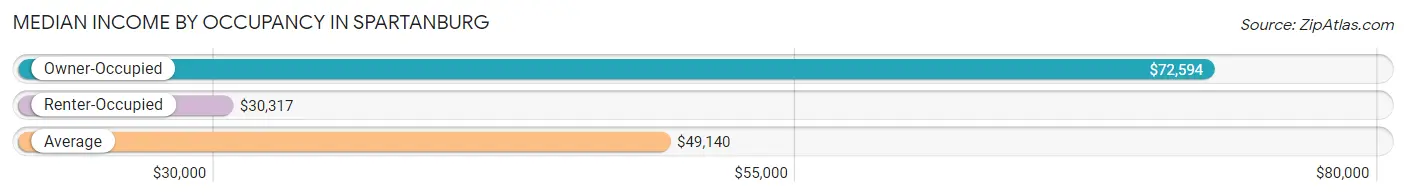
| Occupancy Type | # Households | Median Income |
| Owner-Occupied | 8,254 (52.9%) | $72,594 |
| Renter-Occupied | 7,333 (47.0%) | $30,317 |
| Average | 15,587 (100.0%) | $49,140 |
Occupancy by Householder Income Bracket in Spartanburg
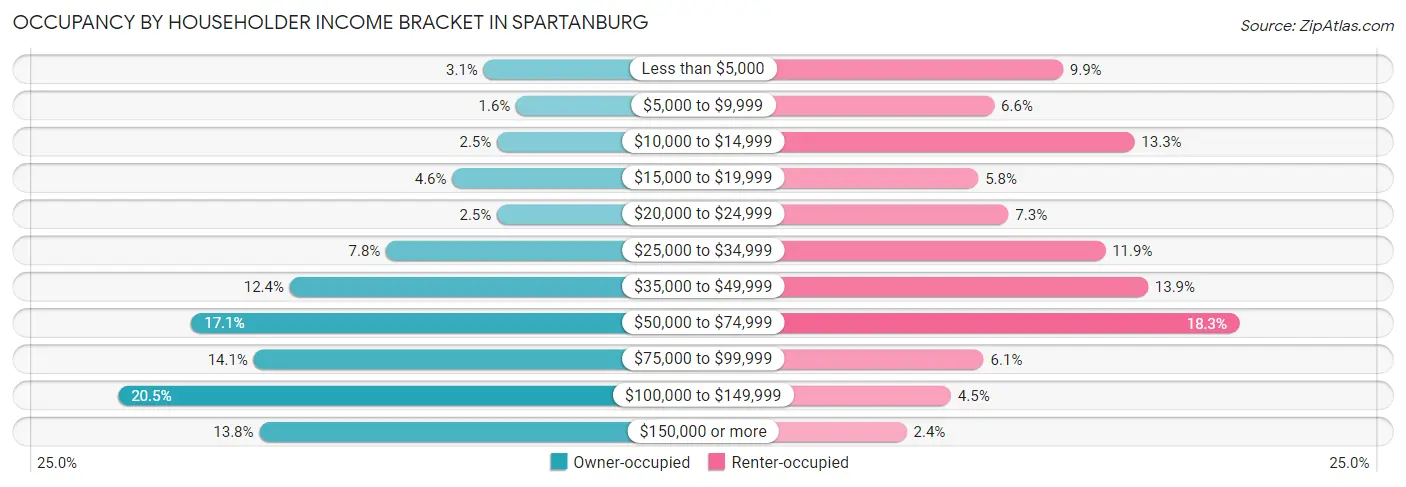
| Income Bracket | Owner-occupied | Renter-occupied |
| Less than $5,000 | 259 (3.1%) | 724 (9.9%) |
| $5,000 to $9,999 | 131 (1.6%) | 484 (6.6%) |
| $10,000 to $14,999 | 206 (2.5%) | 974 (13.3%) |
| $15,000 to $19,999 | 382 (4.6%) | 428 (5.8%) |
| $20,000 to $24,999 | 206 (2.5%) | 534 (7.3%) |
| $25,000 to $34,999 | 642 (7.8%) | 872 (11.9%) |
| $35,000 to $49,999 | 1,021 (12.4%) | 1,021 (13.9%) |
| $50,000 to $74,999 | 1,408 (17.1%) | 1,338 (18.2%) |
| $75,000 to $99,999 | 1,163 (14.1%) | 447 (6.1%) |
| $100,000 to $149,999 | 1,695 (20.5%) | 333 (4.5%) |
| $150,000 or more | 1,141 (13.8%) | 178 (2.4%) |
| Total | 8,254 (100.0%) | 7,333 (100.0%) |
Monthly Housing Cost Tiers in Spartanburg
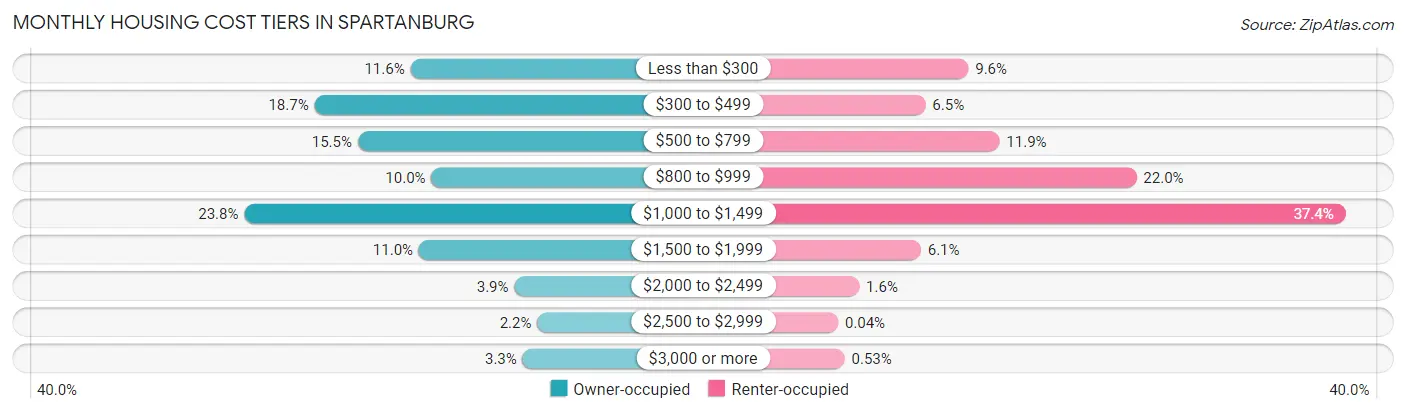
| Monthly Cost | Owner-occupied | Renter-occupied |
| Less than $300 | 956 (11.6%) | 707 (9.6%) |
| $300 to $499 | 1,539 (18.6%) | 475 (6.5%) |
| $500 to $799 | 1,276 (15.5%) | 875 (11.9%) |
| $800 to $999 | 829 (10.0%) | 1,615 (22.0%) |
| $1,000 to $1,499 | 1,966 (23.8%) | 2,745 (37.4%) |
| $1,500 to $1,999 | 905 (11.0%) | 450 (6.1%) |
| $2,000 to $2,499 | 324 (3.9%) | 117 (1.6%) |
| $2,500 to $2,999 | 185 (2.2%) | 3 (0.0%) |
| $3,000 or more | 274 (3.3%) | 39 (0.5%) |
| Total | 8,254 (100.0%) | 7,333 (100.0%) |
Physical Housing Characteristics in Spartanburg
Housing Structures in Spartanburg
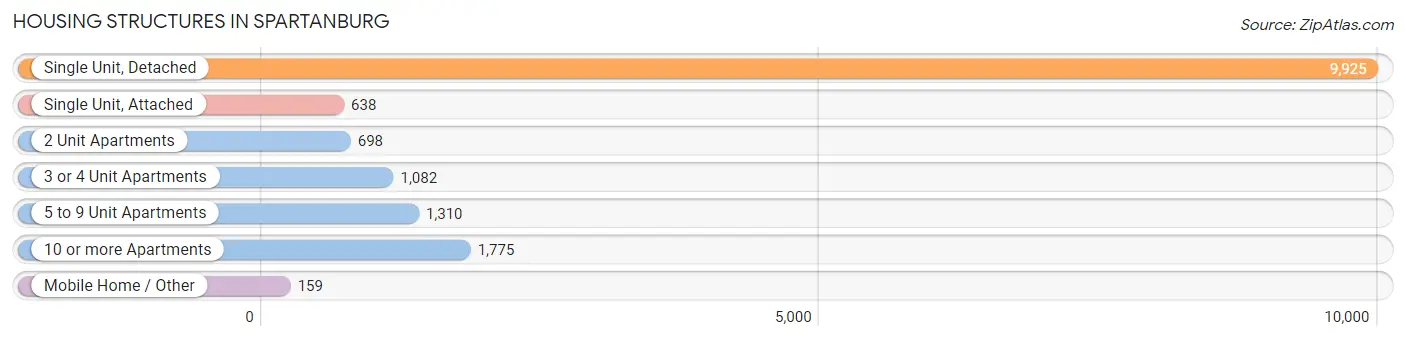
| Structure Type | # Housing Units | % Housing Units |
| Single Unit, Detached | 9,925 | 63.7% |
| Single Unit, Attached | 638 | 4.1% |
| 2 Unit Apartments | 698 | 4.5% |
| 3 or 4 Unit Apartments | 1,082 | 6.9% |
| 5 to 9 Unit Apartments | 1,310 | 8.4% |
| 10 or more Apartments | 1,775 | 11.4% |
| Mobile Home / Other | 159 | 1.0% |
| Total | 15,587 | 100.0% |
Housing Structures by Occupancy in Spartanburg
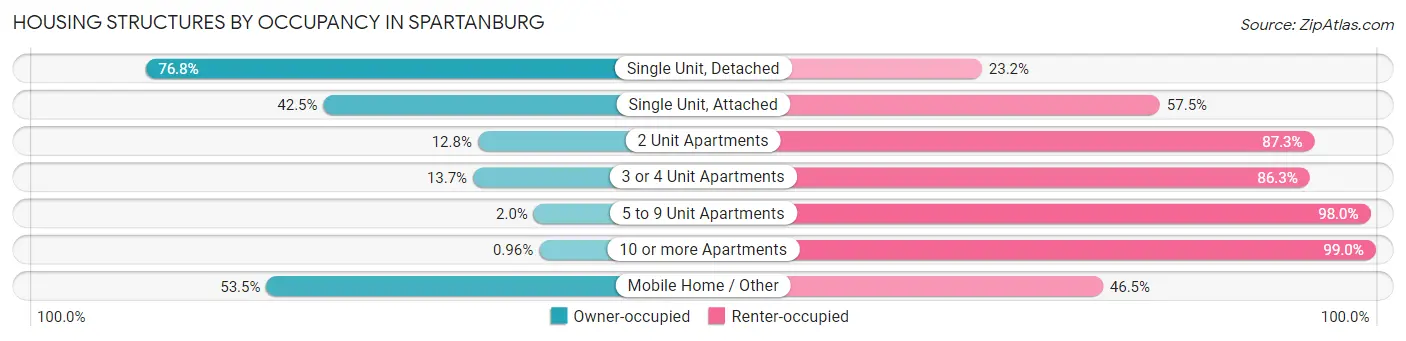
| Structure Type | Owner-occupied | Renter-occupied |
| Single Unit, Detached | 7,618 (76.8%) | 2,307 (23.2%) |
| Single Unit, Attached | 271 (42.5%) | 367 (57.5%) |
| 2 Unit Apartments | 89 (12.8%) | 609 (87.3%) |
| 3 or 4 Unit Apartments | 148 (13.7%) | 934 (86.3%) |
| 5 to 9 Unit Apartments | 26 (2.0%) | 1,284 (98.0%) |
| 10 or more Apartments | 17 (1.0%) | 1,758 (99.0%) |
| Mobile Home / Other | 85 (53.5%) | 74 (46.5%) |
| Total | 8,254 (52.9%) | 7,333 (47.0%) |
Housing Structures by Number of Rooms in Spartanburg
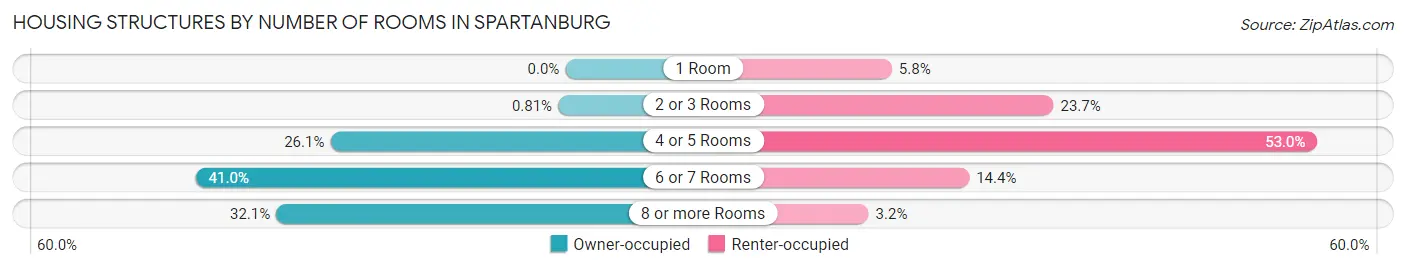
| Number of Rooms | Owner-occupied | Renter-occupied |
| 1 Room | 0 (0.0%) | 423 (5.8%) |
| 2 or 3 Rooms | 67 (0.8%) | 1,739 (23.7%) |
| 4 or 5 Rooms | 2,153 (26.1%) | 3,885 (53.0%) |
| 6 or 7 Rooms | 3,385 (41.0%) | 1,052 (14.3%) |
| 8 or more Rooms | 2,649 (32.1%) | 234 (3.2%) |
| Total | 8,254 (100.0%) | 7,333 (100.0%) |
Housing Structure by Heating Type in Spartanburg
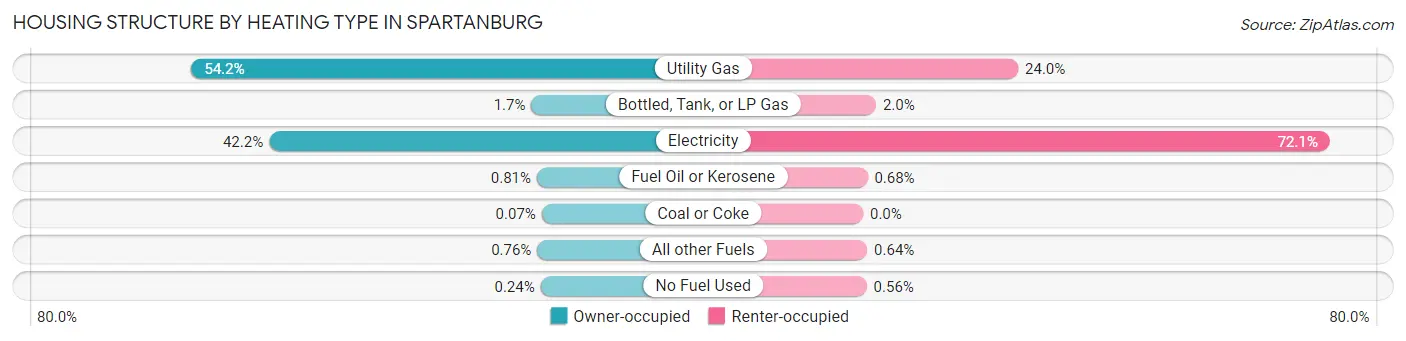
| Heating Type | Owner-occupied | Renter-occupied |
| Utility Gas | 4,475 (54.2%) | 1,758 (24.0%) |
| Bottled, Tank, or LP Gas | 138 (1.7%) | 147 (2.0%) |
| Electricity | 3,485 (42.2%) | 5,290 (72.1%) |
| Fuel Oil or Kerosene | 67 (0.8%) | 50 (0.7%) |
| Coal or Coke | 6 (0.1%) | 0 (0.0%) |
| All other Fuels | 63 (0.8%) | 47 (0.6%) |
| No Fuel Used | 20 (0.2%) | 41 (0.6%) |
| Total | 8,254 (100.0%) | 7,333 (100.0%) |
Household Vehicle Usage in Spartanburg
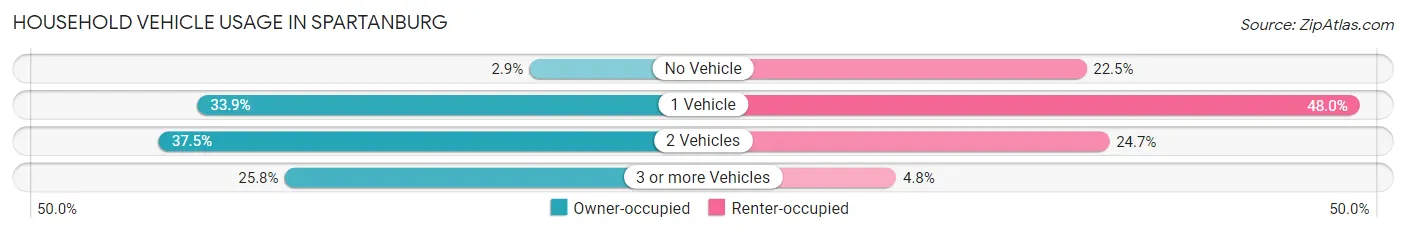
| Vehicles per Household | Owner-occupied | Renter-occupied |
| No Vehicle | 240 (2.9%) | 1,652 (22.5%) |
| 1 Vehicle | 2,796 (33.9%) | 3,522 (48.0%) |
| 2 Vehicles | 3,093 (37.5%) | 1,809 (24.7%) |
| 3 or more Vehicles | 2,125 (25.8%) | 350 (4.8%) |
| Total | 8,254 (100.0%) | 7,333 (100.0%) |
Real Estate & Mortgages in Spartanburg
Real Estate and Mortgage Overview in Spartanburg
| Characteristic | Without Mortgage | With Mortgage |
| Housing Units | 3,471 | 4,783 |
| Median Property Value | $137,200 | $184,300 |
| Median Household Income | $51,440 | $670 |
| Monthly Housing Costs | $382 | $274 |
| Real Estate Taxes | $1,083 | $72 |
Property Value by Mortgage Status in Spartanburg
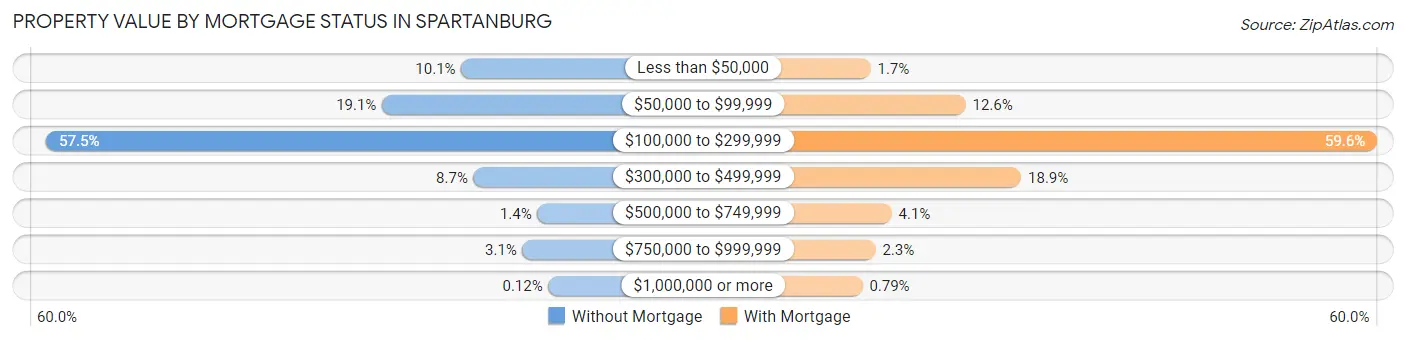
| Property Value | Without Mortgage | With Mortgage |
| Less than $50,000 | 350 (10.1%) | 82 (1.7%) |
| $50,000 to $99,999 | 664 (19.1%) | 601 (12.6%) |
| $100,000 to $299,999 | 1,997 (57.5%) | 2,851 (59.6%) |
| $300,000 to $499,999 | 301 (8.7%) | 905 (18.9%) |
| $500,000 to $749,999 | 48 (1.4%) | 197 (4.1%) |
| $750,000 to $999,999 | 107 (3.1%) | 109 (2.3%) |
| $1,000,000 or more | 4 (0.1%) | 38 (0.8%) |
| Total | 3,471 (100.0%) | 4,783 (100.0%) |
Household Income by Mortgage Status in Spartanburg
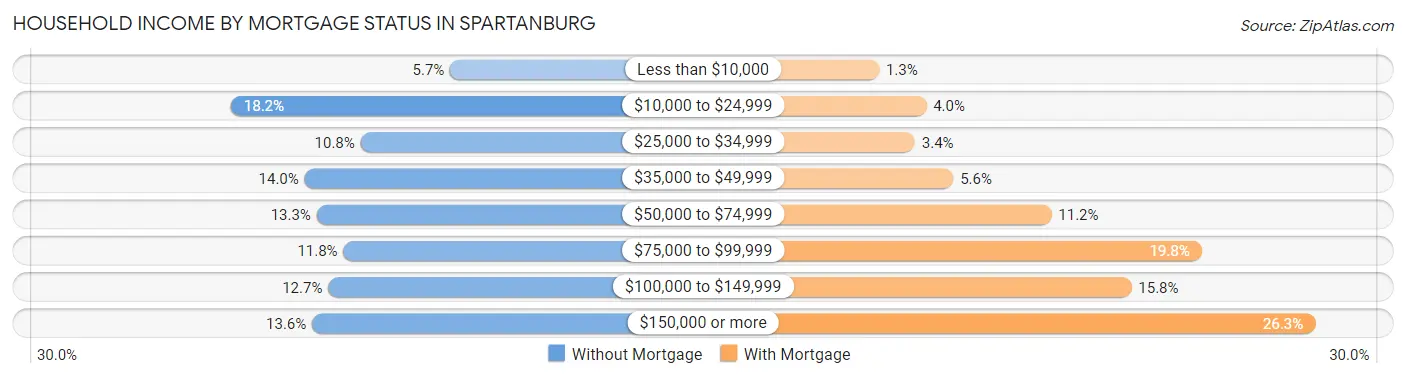
| Household Income | Without Mortgage | With Mortgage |
| Less than $10,000 | 197 (5.7%) | 64 (1.3%) |
| $10,000 to $24,999 | 632 (18.2%) | 193 (4.0%) |
| $25,000 to $34,999 | 375 (10.8%) | 162 (3.4%) |
| $35,000 to $49,999 | 486 (14.0%) | 267 (5.6%) |
| $50,000 to $74,999 | 462 (13.3%) | 535 (11.2%) |
| $75,000 to $99,999 | 409 (11.8%) | 946 (19.8%) |
| $100,000 to $149,999 | 439 (12.7%) | 754 (15.8%) |
| $150,000 or more | 471 (13.6%) | 1,256 (26.3%) |
| Total | 3,471 (100.0%) | 4,783 (100.0%) |
Property Value to Household Income Ratio in Spartanburg
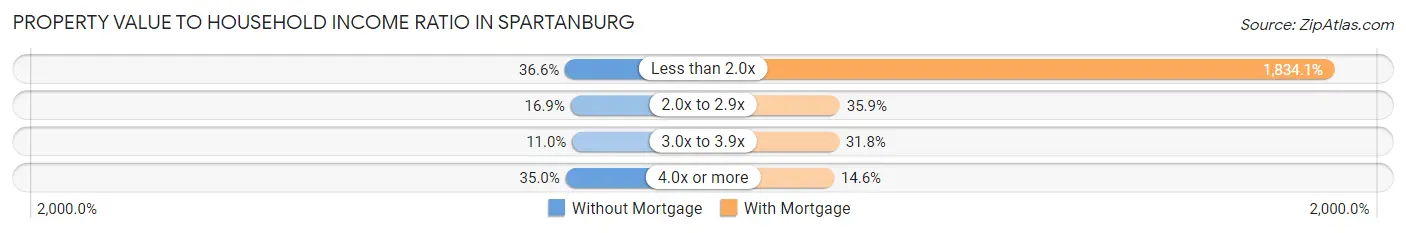
| Value-to-Income Ratio | Without Mortgage | With Mortgage |
| Less than 2.0x | 1,271 (36.6%) | 87,727 (1,834.1%) |
| 2.0x to 2.9x | 586 (16.9%) | 1,718 (35.9%) |
| 3.0x to 3.9x | 383 (11.0%) | 1,522 (31.8%) |
| 4.0x or more | 1,216 (35.0%) | 700 (14.6%) |
| Total | 3,471 (100.0%) | 4,783 (100.0%) |
Real Estate Taxes by Mortgage Status in Spartanburg
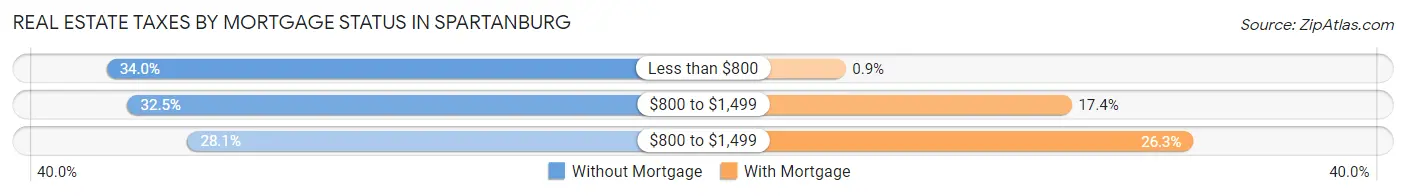
| Property Taxes | Without Mortgage | With Mortgage |
| Less than $800 | 1,180 (34.0%) | 43 (0.9%) |
| $800 to $1,499 | 1,127 (32.5%) | 833 (17.4%) |
| $800 to $1,499 | 975 (28.1%) | 1,259 (26.3%) |
| Total | 3,471 (100.0%) | 4,783 (100.0%) |
Health & Disability in Spartanburg
Health Insurance Coverage by Age in Spartanburg
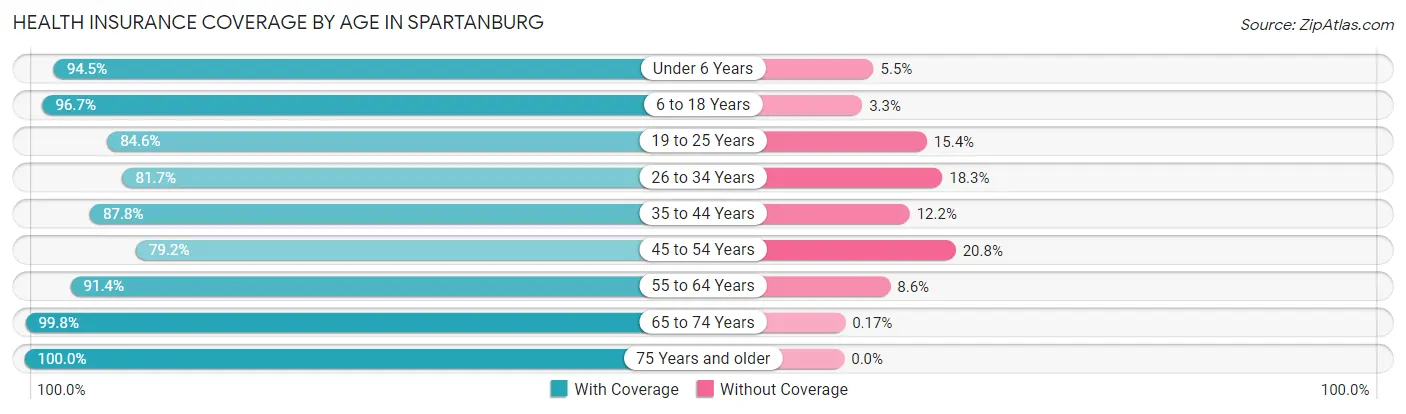
| Age Bracket | With Coverage | Without Coverage |
| Under 6 Years | 3,184 (94.5%) | 184 (5.5%) |
| 6 to 18 Years | 6,025 (96.7%) | 208 (3.3%) |
| 19 to 25 Years | 3,612 (84.6%) | 658 (15.4%) |
| 26 to 34 Years | 3,972 (81.7%) | 888 (18.3%) |
| 35 to 44 Years | 4,110 (87.8%) | 571 (12.2%) |
| 45 to 54 Years | 2,413 (79.2%) | 633 (20.8%) |
| 55 to 64 Years | 4,501 (91.4%) | 423 (8.6%) |
| 65 to 74 Years | 3,563 (99.8%) | 6 (0.2%) |
| 75 Years and older | 2,875 (100.0%) | 0 (0.0%) |
| Total | 34,255 (90.6%) | 3,571 (9.4%) |
Health Insurance Coverage by Citizenship Status in Spartanburg
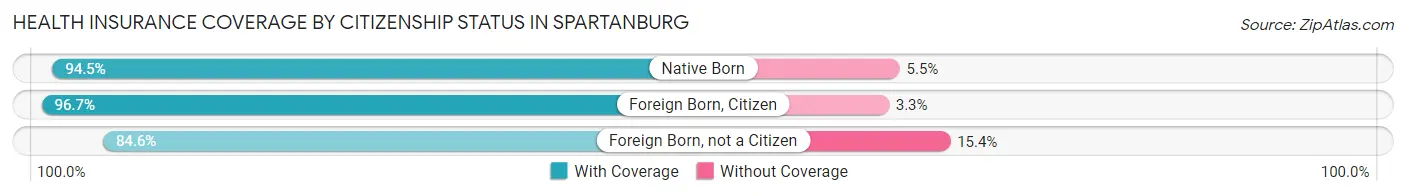
| Citizenship Status | With Coverage | Without Coverage |
| Native Born | 3,184 (94.5%) | 184 (5.5%) |
| Foreign Born, Citizen | 6,025 (96.7%) | 208 (3.3%) |
| Foreign Born, not a Citizen | 3,612 (84.6%) | 658 (15.4%) |
Health Insurance Coverage by Household Income in Spartanburg
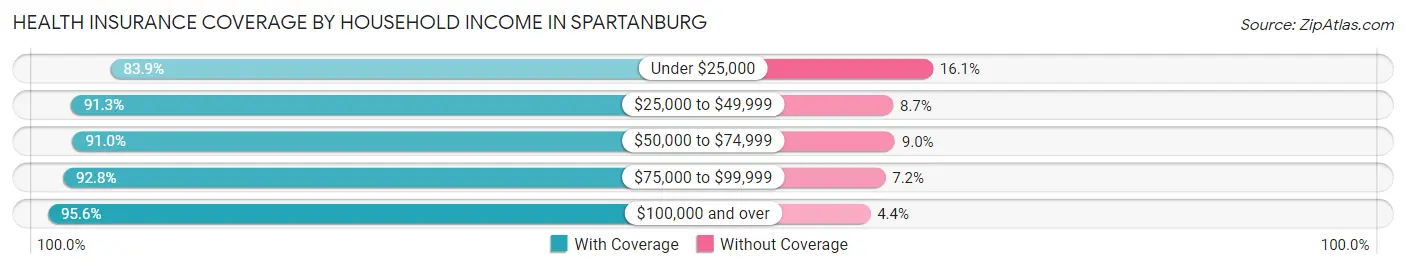
| Household Income | With Coverage | Without Coverage |
| Under $25,000 | 7,369 (83.9%) | 1,416 (16.1%) |
| $25,000 to $49,999 | 6,843 (91.3%) | 649 (8.7%) |
| $50,000 to $74,999 | 5,835 (91.0%) | 577 (9.0%) |
| $75,000 to $99,999 | 3,591 (92.8%) | 279 (7.2%) |
| $100,000 and over | 8,789 (95.6%) | 404 (4.4%) |
Public vs Private Health Insurance Coverage by Age in Spartanburg
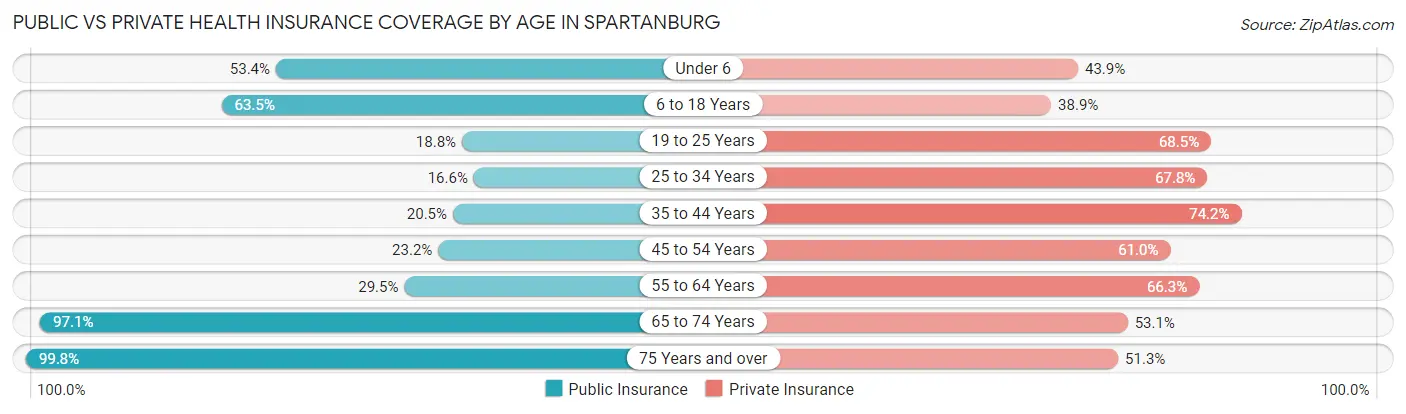
| Age Bracket | Public Insurance | Private Insurance |
| Under 6 | 1,797 (53.4%) | 1,477 (43.9%) |
| 6 to 18 Years | 3,955 (63.4%) | 2,422 (38.9%) |
| 19 to 25 Years | 804 (18.8%) | 2,926 (68.5%) |
| 25 to 34 Years | 808 (16.6%) | 3,296 (67.8%) |
| 35 to 44 Years | 960 (20.5%) | 3,471 (74.2%) |
| 45 to 54 Years | 708 (23.2%) | 1,857 (61.0%) |
| 55 to 64 Years | 1,454 (29.5%) | 3,265 (66.3%) |
| 65 to 74 Years | 3,466 (97.1%) | 1,894 (53.1%) |
| 75 Years and over | 2,868 (99.8%) | 1,475 (51.3%) |
| Total | 16,820 (44.5%) | 22,083 (58.4%) |
Disability Status by Sex by Age in Spartanburg
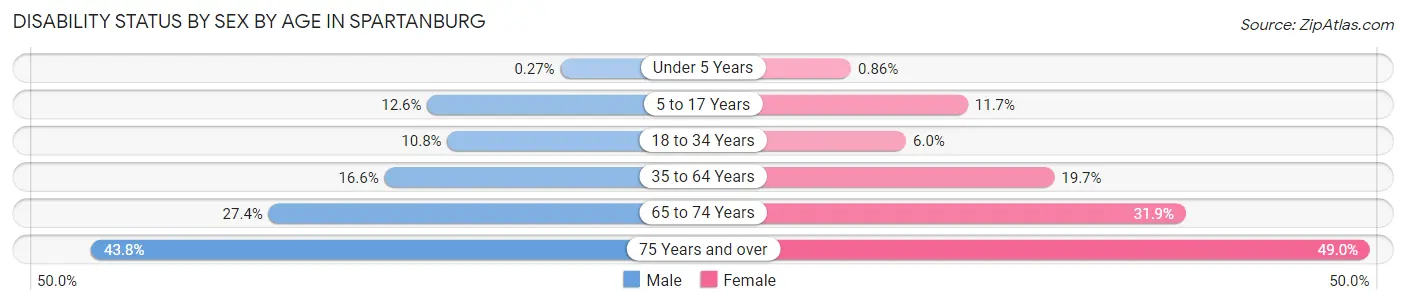
| Age Bracket | Male | Female |
| Under 5 Years | 4 (0.3%) | 12 (0.9%) |
| 5 to 17 Years | 368 (12.6%) | 362 (11.7%) |
| 18 to 34 Years | 478 (10.8%) | 324 (6.0%) |
| 35 to 64 Years | 949 (16.6%) | 1,368 (19.7%) |
| 65 to 74 Years | 451 (27.4%) | 613 (31.9%) |
| 75 Years and over | 423 (43.8%) | 936 (49.0%) |
Disability Class by Sex by Age in Spartanburg
Disability Class: Hearing Difficulty
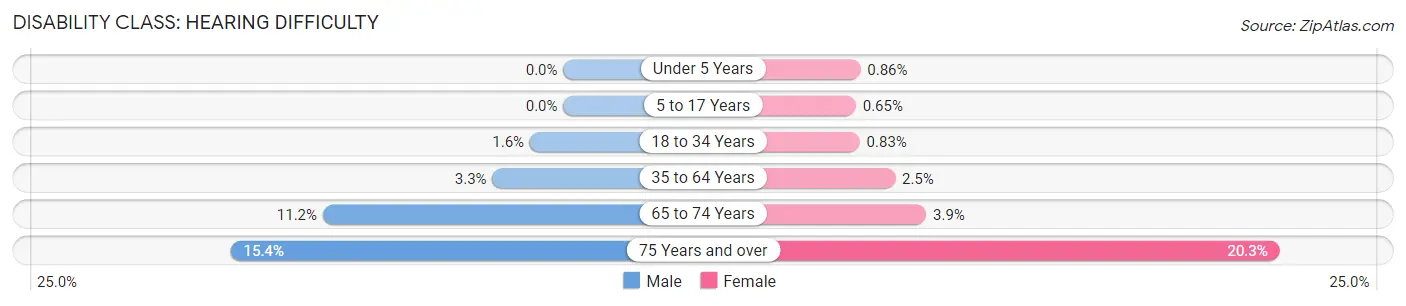
| Age Bracket | Male | Female |
| Under 5 Years | 0 (0.0%) | 12 (0.9%) |
| 5 to 17 Years | 0 (0.0%) | 20 (0.6%) |
| 18 to 34 Years | 69 (1.5%) | 45 (0.8%) |
| 35 to 64 Years | 188 (3.3%) | 171 (2.5%) |
| 65 to 74 Years | 184 (11.2%) | 75 (3.9%) |
| 75 Years and over | 149 (15.4%) | 388 (20.3%) |
Disability Class: Vision Difficulty
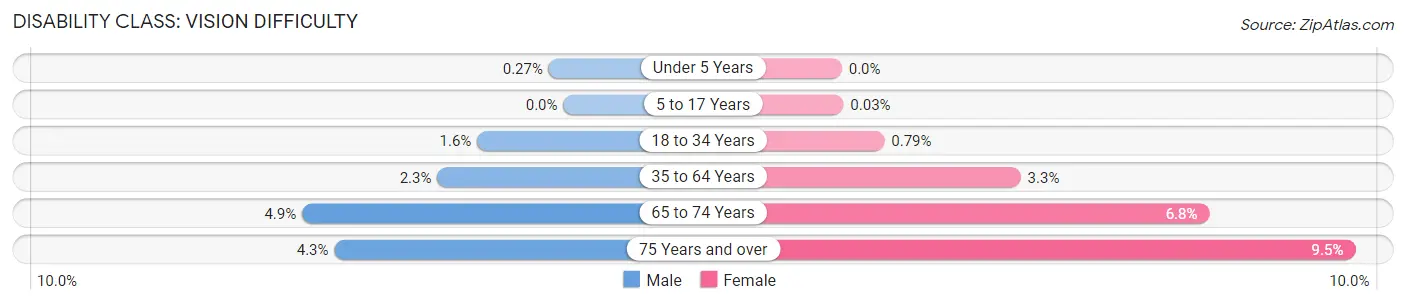
| Age Bracket | Male | Female |
| Under 5 Years | 4 (0.3%) | 0 (0.0%) |
| 5 to 17 Years | 0 (0.0%) | 1 (0.0%) |
| 18 to 34 Years | 71 (1.6%) | 43 (0.8%) |
| 35 to 64 Years | 134 (2.3%) | 230 (3.3%) |
| 65 to 74 Years | 80 (4.9%) | 131 (6.8%) |
| 75 Years and over | 41 (4.3%) | 182 (9.5%) |
Disability Class: Cognitive Difficulty
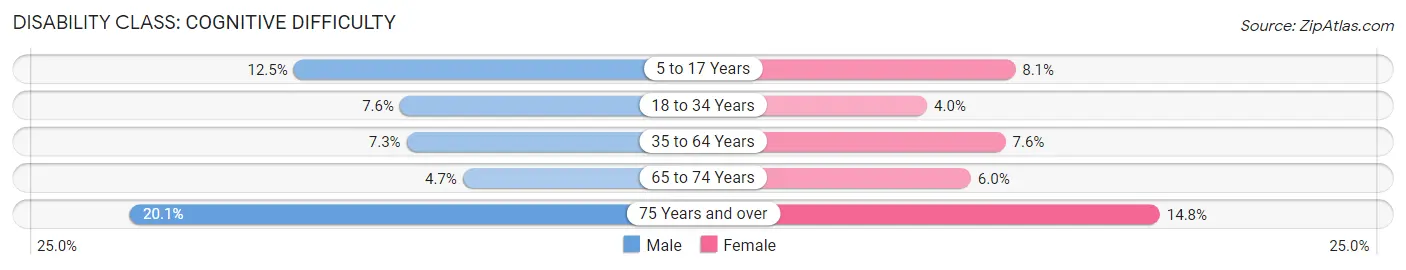
| Age Bracket | Male | Female |
| 5 to 17 Years | 365 (12.5%) | 249 (8.1%) |
| 18 to 34 Years | 337 (7.6%) | 215 (4.0%) |
| 35 to 64 Years | 416 (7.3%) | 527 (7.6%) |
| 65 to 74 Years | 77 (4.7%) | 115 (6.0%) |
| 75 Years and over | 194 (20.1%) | 282 (14.8%) |
Disability Class: Ambulatory Difficulty
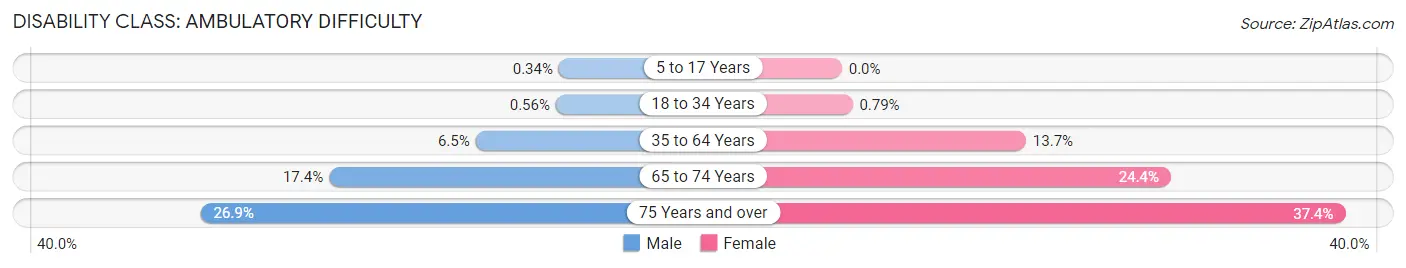
| Age Bracket | Male | Female |
| 5 to 17 Years | 10 (0.3%) | 0 (0.0%) |
| 18 to 34 Years | 25 (0.6%) | 43 (0.8%) |
| 35 to 64 Years | 373 (6.5%) | 948 (13.7%) |
| 65 to 74 Years | 287 (17.4%) | 469 (24.4%) |
| 75 Years and over | 260 (26.9%) | 714 (37.4%) |
Disability Class: Self-Care Difficulty
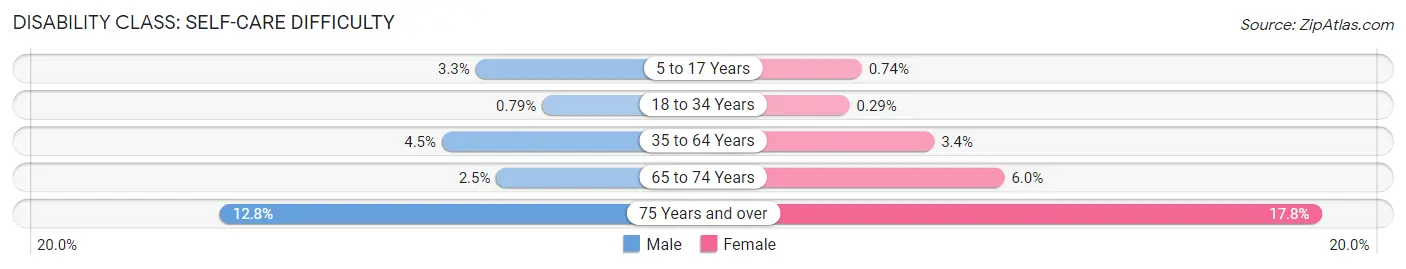
| Age Bracket | Male | Female |
| 5 to 17 Years | 95 (3.3%) | 23 (0.7%) |
| 18 to 34 Years | 35 (0.8%) | 16 (0.3%) |
| 35 to 64 Years | 258 (4.5%) | 238 (3.4%) |
| 65 to 74 Years | 41 (2.5%) | 116 (6.0%) |
| 75 Years and over | 123 (12.8%) | 340 (17.8%) |
Technology Access in Spartanburg
Computing Device Access in Spartanburg

| Device Type | # Households | % Households |
| Desktop or Laptop | 9,954 | 63.9% |
| Smartphone | 12,451 | 79.9% |
| Tablet | 8,117 | 52.1% |
| No Computing Device | 2,047 | 13.1% |
| Total | 15,587 | 100.0% |
Internet Access in Spartanburg
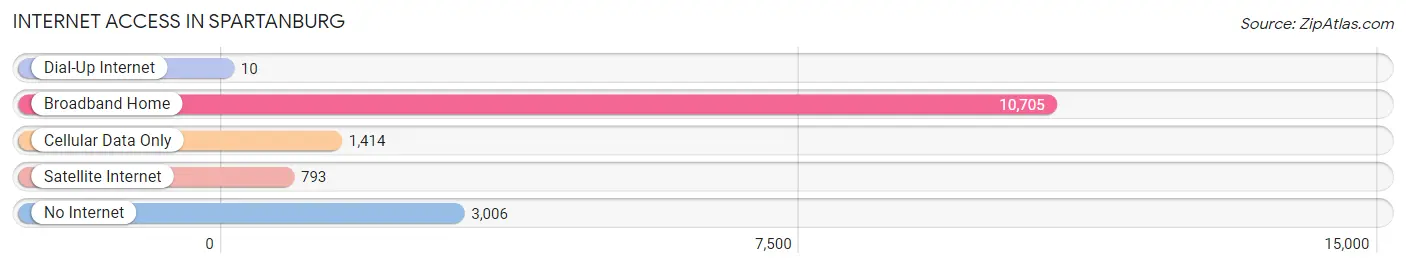
| Internet Type | # Households | % Households |
| Dial-Up Internet | 10 | 0.1% |
| Broadband Home | 10,705 | 68.7% |
| Cellular Data Only | 1,414 | 9.1% |
| Satellite Internet | 793 | 5.1% |
| No Internet | 3,006 | 19.3% |
| Total | 15,587 | 100.0% |
Spartanburg Summary
Spartanburg, South Carolina is a city located in the Upstate region of the state. It is the county seat of Spartanburg County and is the second-largest city in the state. The city is situated in the foothills of the Blue Ridge Mountains and is part of the greater Greenville-Spartanburg-Anderson Combined Statistical Area. The city has a population of 37,013 as of the 2010 census and is the principal city of the Spartanburg Metropolitan Statistical Area, which had a population of 297,302 as of the 2010 census.
History
Spartanburg was founded in 1785 by a group of settlers from the Province of North Carolina. The settlers named the area after the Spartan Regiment of the South Carolina militia, which had fought in the American Revolutionary War. The city was incorporated in 1831 and was named the county seat of Spartanburg County in 1848.
The city experienced rapid growth in the late 19th and early 20th centuries, due to the development of the textile industry. The city was a major center of the textile industry in the South, and was home to several large mills. The city was also a major center of the civil rights movement in the 1960s and 1970s.
Geography
Spartanburg is located in the foothills of the Blue Ridge Mountains in the Upstate region of South Carolina. The city is situated at the intersection of Interstate 85 and Interstate 26, and is approximately 70 miles northwest of Columbia, South Carolina and approximately 80 miles northeast of Atlanta, Georgia. The city has a total area of 24.2 square miles, of which 24.1 square miles is land and 0.1 square miles is water.
The city is located in the Piedmont region of South Carolina, and is characterized by rolling hills and valleys. The city is located in the Piedmont Uplands ecoregion, which is characterized by a mix of deciduous and coniferous forests. The city is also located in the Middle Savannah River sub-basin of the Savannah River basin.
Economy
Spartanburg has a diverse economy, with a mix of manufacturing, retail, and service industries. The city is home to several large employers, including BMW, Milliken & Company, and Spartanburg Regional Healthcare System. The city is also home to several major retail centers, including WestGate Mall and Dorman Centre.
The city is also home to several higher education institutions, including Wofford College, Converse College, and the University of South Carolina Upstate. The city is also home to several research and development centers, including the Clemson University International Center for Automotive Research and the University of South Carolina Upstate Research Park.
Demographics
As of the 2010 census, the city had a population of 37,013. The racial makeup of the city was 57.2% White, 35.2% African American, 0.3% Native American, 2.2% Asian, 0.1% Pacific Islander, 2.7% from other races, and 2.3% from two or more races. Hispanic or Latino of any race were 5.7% of the population.
The median income for a household in the city was $37,837, and the median income for a family was $45,919. The per capita income for the city was $20,945. About 17.2% of families and 21.2% of the population were below the poverty line, including 33.2% of those under age 18 and 11.2% of those age 65 or over.
Common Questions
What is Per Capita Income in Spartanburg?
Per Capita income in Spartanburg is $30,719.
What is the Median Family Income in Spartanburg?
Median Family Income in Spartanburg is $57,381.
What is the Median Household income in Spartanburg?
Median Household Income in Spartanburg is $49,140.
What is Income or Wage Gap in Spartanburg?
Income or Wage Gap in Spartanburg is 29.5%.
Women in Spartanburg earn 70.5 cents for every dollar earned by a man.
What is Family Income Deficit in Spartanburg?
Family Income Deficit in Spartanburg is $12,081.
Families that are below poverty line in Spartanburg earn $12,081 less on average than the poverty threshold level.
What is Inequality or Gini Index in Spartanburg?
Inequality or Gini Index in Spartanburg is 0.51.
What is the Total Population of Spartanburg?
Total Population of Spartanburg is 38,301.
What is the Total Male Population of Spartanburg?
Total Male Population of Spartanburg is 17,349.
What is the Total Female Population of Spartanburg?
Total Female Population of Spartanburg is 20,952.
What is the Ratio of Males per 100 Females in Spartanburg?
There are 82.80 Males per 100 Females in Spartanburg.
What is the Ratio of Females per 100 Males in Spartanburg?
There are 120.77 Females per 100 Males in Spartanburg.
What is the Median Population Age in Spartanburg?
Median Population Age in Spartanburg is 35.5 Years.
What is the Average Family Size in Spartanburg
Average Family Size in Spartanburg is 3.0 People.
What is the Average Household Size in Spartanburg
Average Household Size in Spartanburg is 2.3 People.
How Large is the Labor Force in Spartanburg?
There are 17,849 People in the Labor Forcein in Spartanburg.
What is the Percentage of People in the Labor Force in Spartanburg?
58.9% of People are in the Labor Force in Spartanburg.
What is the Unemployment Rate in Spartanburg?
Unemployment Rate in Spartanburg is 7.5%.