Kentucky Map & Demographics
Kentucky Map
Kentucky Overview
Jun 1, 1792
INCORPORATED
40,411
TOTAL AREA [ SQ MI ]
39,492
LAND AREA [ SQ MI ]
919
WATER AREA [ SQ MI ]
750
ELEVATION AVG [ FT ]
4,139
ELEVATION HIGH [ FT ]
257
ELEVATION LOW [ FT ]
114.0
POP DENSITY [ PPL / SQ MI ]
$33,515
PER CAPITA INCOME
$76,273
AVG FAMILY INCOME
$60,183
AVG HOUSEHOLD INCOME
28.4%
WAGE / INCOME GAP [ % ]
71.6¢/ $1
WAGE / INCOME GAP [ $ ]
$11,161
FAMILY INCOME DEFICIT
0.48
INEQUALITY / GINI INDEX
40475
LARGEST ZIP CODE
Louisville
LARGEST CITY
Jefferson County
LARGEST COUNTY
4,502,935
TOTAL POPULATION
2,234,041
MALE POPULATION
2,268,894
FEMALE POPULATION
98.46
MALES / 100 FEMALES
101.56
FEMALES / 100 MALES
39.1
MEDIAN AGE
3.1
AVG FAMILY SIZE
2.5
AVG HOUSEHOLD SIZE
2,146,427
LABOR FORCE [ PEOPLE ]
59.5%
PERCENT IN LABOR FORCE
5.1%
UNEMPLOYMENT RATE
Income in Kentucky
Income Overview in Kentucky
Per Capita Income in Kentucky is $33,515, while median incomes of families and households are $76,273 and $60,183 respectively.
| Characteristic | Number | Measure |
| Per Capita Income | 4,502,935 | $33,515 |
| Median Family Income | 1,142,472 | $76,273 |
| Mean Family Income | 1,142,472 | $98,972 |
| Median Household Income | 1,769,102 | $60,183 |
| Mean Household Income | 1,769,102 | $83,093 |
| Income Deficit | 1,142,472 | $11,161 |
| Wage / Income Gap (%) | 4,502,935 | 28.40% |
| Wage / Income Gap ($) | 4,502,935 | 71.60¢ per $1 |
| Gini / Inequality Index | 4,502,935 | 0.48 |
Earnings by Sex in Kentucky
Average Earnings in Kentucky are $37,041, $43,912 for men and $31,440 for women, a difference of 28.4%.
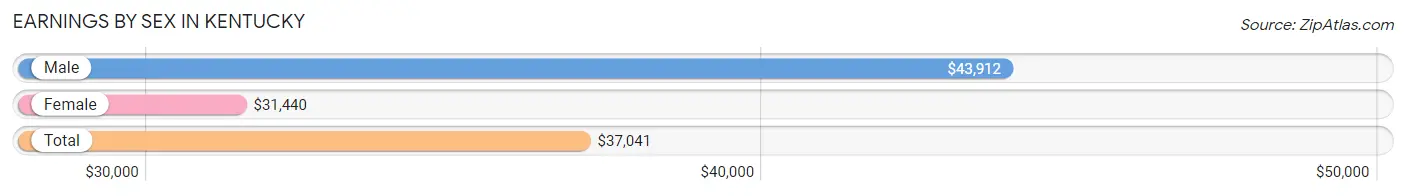
| Sex | Number | Average Earnings |
| Male | 1,186,695 (52.5%) | $43,912 |
| Female | 1,072,892 (47.5%) | $31,440 |
| Total | 2,259,587 (100.0%) | $37,041 |
Earnings by Sex by Income Bracket in Kentucky
The most common earnings brackets in Kentucky are $100,000+ for men (157,053 | 13.2%) and $25,000 to $29,999 for women (76,819 | 7.2%).
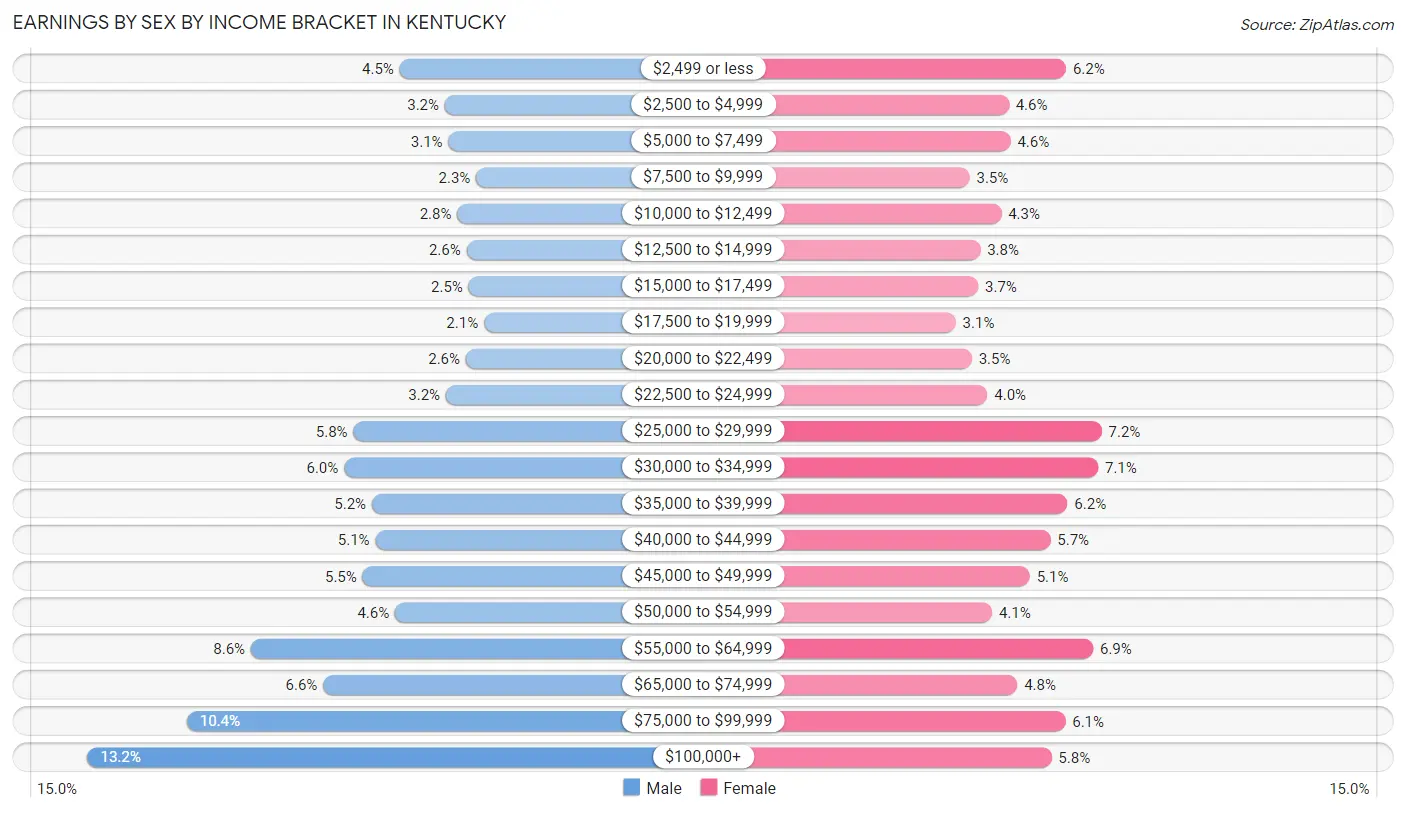
| Income | Male | Female |
| $2,499 or less | 52,873 (4.5%) | 66,056 (6.2%) |
| $2,500 to $4,999 | 37,822 (3.2%) | 48,776 (4.5%) |
| $5,000 to $7,499 | 36,673 (3.1%) | 49,340 (4.6%) |
| $7,500 to $9,999 | 27,379 (2.3%) | 37,045 (3.5%) |
| $10,000 to $12,499 | 33,653 (2.8%) | 46,543 (4.3%) |
| $12,500 to $14,999 | 30,599 (2.6%) | 40,185 (3.7%) |
| $15,000 to $17,499 | 29,952 (2.5%) | 39,571 (3.7%) |
| $17,500 to $19,999 | 24,760 (2.1%) | 32,847 (3.1%) |
| $20,000 to $22,499 | 30,885 (2.6%) | 37,619 (3.5%) |
| $22,500 to $24,999 | 37,509 (3.2%) | 42,368 (4.0%) |
| $25,000 to $29,999 | 68,349 (5.8%) | 76,819 (7.2%) |
| $30,000 to $34,999 | 71,414 (6.0%) | 75,733 (7.1%) |
| $35,000 to $39,999 | 62,170 (5.2%) | 66,531 (6.2%) |
| $40,000 to $44,999 | 60,988 (5.1%) | 61,412 (5.7%) |
| $45,000 to $49,999 | 65,312 (5.5%) | 55,177 (5.1%) |
| $50,000 to $54,999 | 54,475 (4.6%) | 43,793 (4.1%) |
| $55,000 to $64,999 | 102,494 (8.6%) | 74,200 (6.9%) |
| $65,000 to $74,999 | 78,447 (6.6%) | 51,356 (4.8%) |
| $75,000 to $99,999 | 123,888 (10.4%) | 65,847 (6.1%) |
| $100,000+ | 157,053 (13.2%) | 61,674 (5.8%) |
| Total | 1,186,695 (100.0%) | 1,072,892 (100.0%) |
Earnings by Sex by Educational Attainment in Kentucky
Average earnings in Kentucky are $50,459 for men and $36,374 for women, a difference of 27.9%. Men with an educational attainment of graduate degree enjoy the highest average annual earnings of $81,165, while those with less than high school education earn the least with $30,778. Women with an educational attainment of graduate degree earn the most with the average annual earnings of $60,495, while those with less than high school education have the smallest earnings of $21,204.
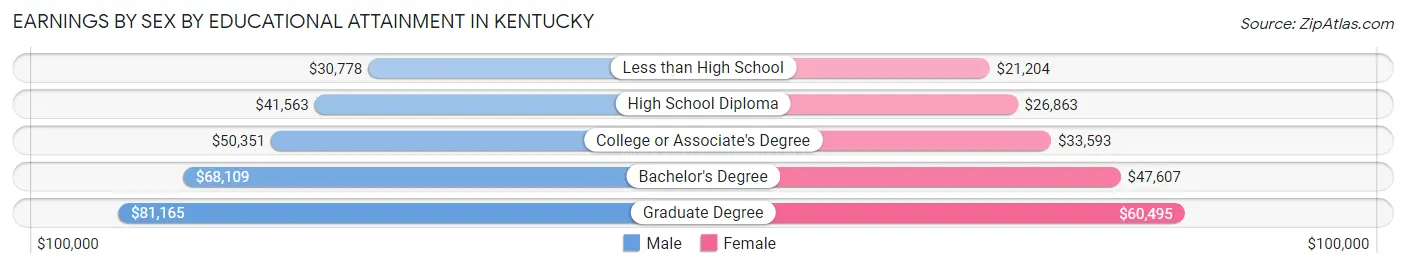
| Educational Attainment | Male Income | Female Income |
| Less than High School | $30,778 | $21,204 |
| High School Diploma | $41,563 | $26,863 |
| College or Associate's Degree | $50,351 | $33,593 |
| Bachelor's Degree | $68,109 | $47,607 |
| Graduate Degree | $81,165 | $60,495 |
| Total | $50,459 | $36,374 |
Family Income in Kentucky
Family Income Brackets in Kentucky
According to the Kentucky family income data, there are 221,640 families falling into the $100,000 to $149,999 income range, which is the most common income bracket and makes up 19.4% of all families. Conversely, the $10,000 to $14,999 income bracket is the least frequent group with only 31,989 families (2.8%) belonging to this category.
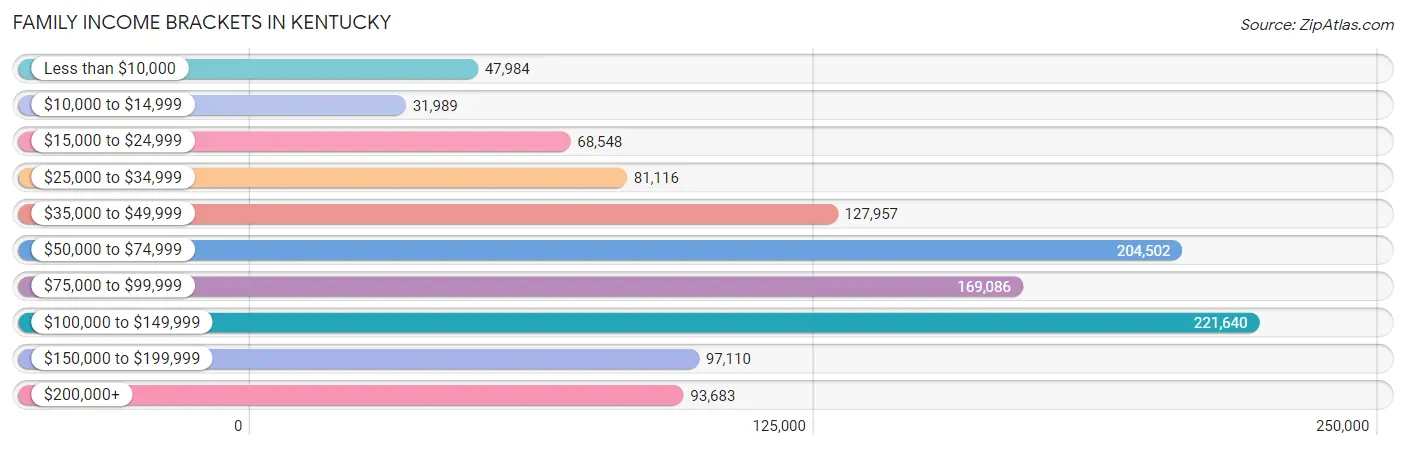
| Income Bracket | # Families | % Families |
| Less than $10,000 | 47,984 | 4.2% |
| $10,000 to $14,999 | 31,989 | 2.8% |
| $15,000 to $24,999 | 68,548 | 6.0% |
| $25,000 to $34,999 | 81,116 | 7.1% |
| $35,000 to $49,999 | 127,957 | 11.2% |
| $50,000 to $74,999 | 204,502 | 17.9% |
| $75,000 to $99,999 | 169,086 | 14.8% |
| $100,000 to $149,999 | 221,640 | 19.4% |
| $150,000 to $199,999 | 97,110 | 8.5% |
| $200,000+ | 93,683 | 8.2% |
Family Income by Famaliy Size in Kentucky
4-person families (193,020 | 16.9%) account for the highest median family income in Kentucky with $96,305 per family, while 2-person families (566,102 | 49.5%) have the highest median income of $33,684 per family member.
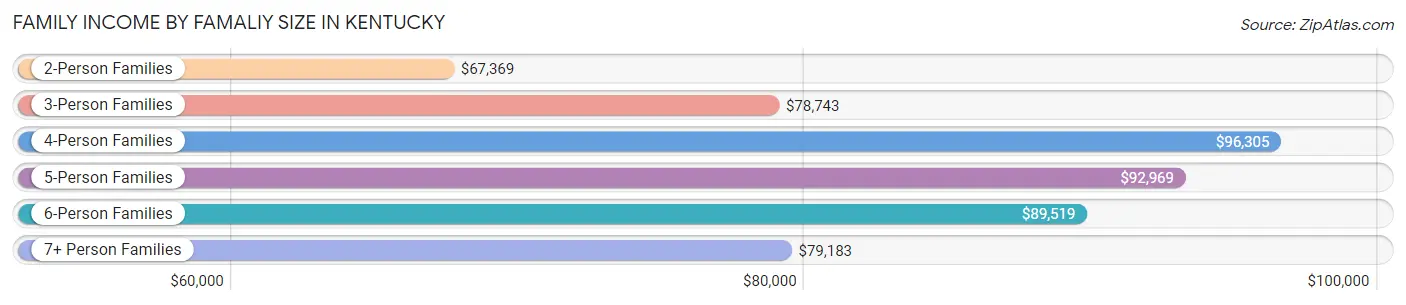
| Income Bracket | # Families | Median Income |
| 2-Person Families | 566,102 (49.5%) | $67,369 |
| 3-Person Families | 257,215 (22.5%) | $78,743 |
| 4-Person Families | 193,020 (16.9%) | $96,305 |
| 5-Person Families | 82,861 (7.2%) | $92,969 |
| 6-Person Families | 27,582 (2.4%) | $89,519 |
| 7+ Person Families | 15,692 (1.4%) | $79,183 |
| Total | 1,142,472 (100.0%) | $76,273 |
Family Income by Number of Earners in Kentucky
The median family income in Kentucky is $76,273, with families comprising 3+ earners (106,441) having the highest median family income of $133,379, while families with no earners (208,589) have the lowest median family income of $39,282, accounting for 9.3% and 18.3% of families, respectively.
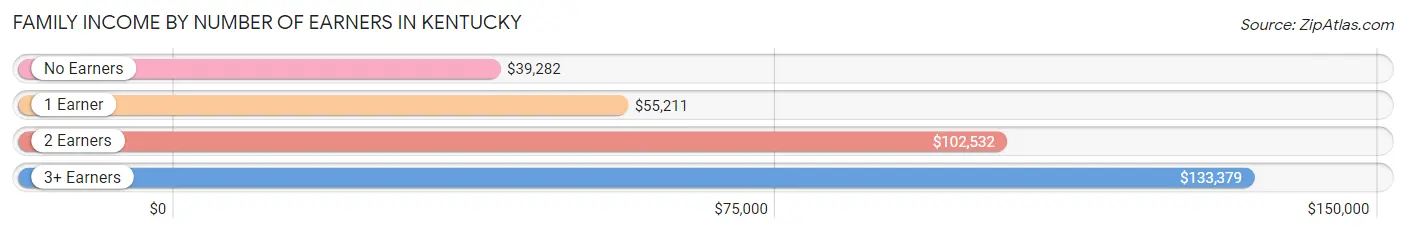
| Number of Earners | # Families | Median Income |
| No Earners | 208,589 (18.3%) | $39,282 |
| 1 Earner | 374,747 (32.8%) | $55,211 |
| 2 Earners | 452,695 (39.6%) | $102,532 |
| 3+ Earners | 106,441 (9.3%) | $133,379 |
| Total | 1,142,472 (100.0%) | $76,273 |
Household Income in Kentucky
Household Income Brackets in Kentucky
With 307,824 households falling in the category, the $50,000 to $74,999 income range is the most frequent in Kentucky, accounting for 17.4% of all households. In contrast, only 99,070 households (5.6%) fall into the $10,000 to $14,999 income bracket, making it the least populous group.
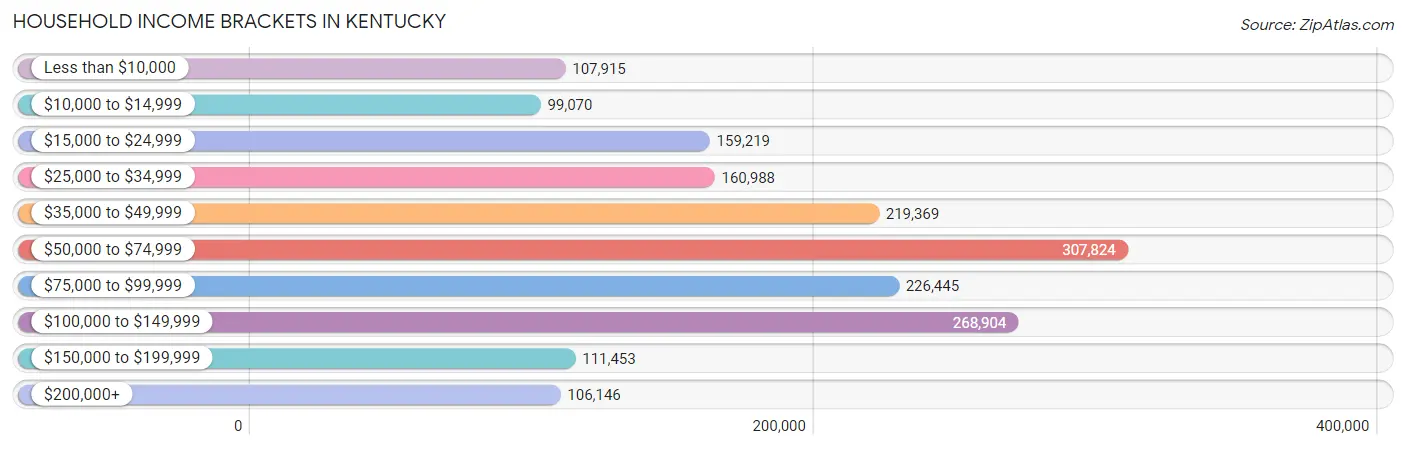
| Income Bracket | # Households | % Households |
| Less than $10,000 | 107,915 | 6.1% |
| $10,000 to $14,999 | 99,070 | 5.6% |
| $15,000 to $24,999 | 159,219 | 9.0% |
| $25,000 to $34,999 | 160,988 | 9.1% |
| $35,000 to $49,999 | 219,369 | 12.4% |
| $50,000 to $74,999 | 307,824 | 17.4% |
| $75,000 to $99,999 | 226,445 | 12.8% |
| $100,000 to $149,999 | 268,904 | 15.2% |
| $150,000 to $199,999 | 111,453 | 6.3% |
| $200,000+ | 106,146 | 6.0% |
Household Income by Householder Age in Kentucky
The median household income in Kentucky is $60,183, with the highest median household income of $70,626 found in the 45 to 64 years age bracket for the primary householder. A total of 657,580 households (37.2%) fall into this category. Meanwhile, the 15 to 24 years age bracket for the primary householder has the lowest median household income of $36,225, with 81,934 households (4.6%) in this group.
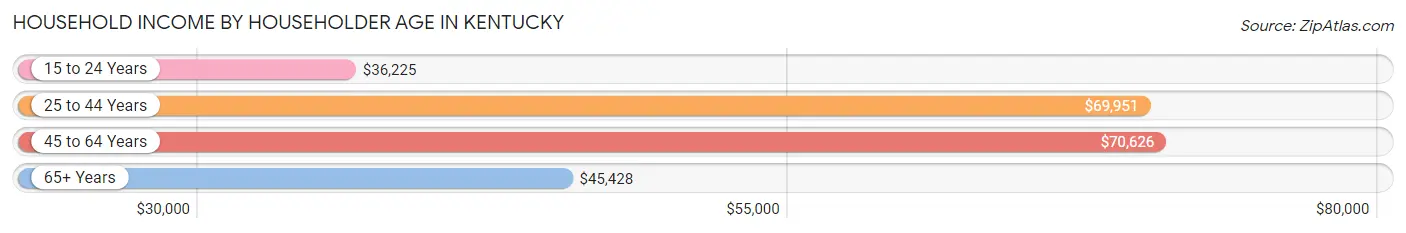
| Income Bracket | # Households | Median Income |
| 15 to 24 Years | 81,934 (4.6%) | $36,225 |
| 25 to 44 Years | 548,637 (31.0%) | $69,951 |
| 45 to 64 Years | 657,580 (37.2%) | $70,626 |
| 65+ Years | 480,951 (27.2%) | $45,428 |
| Total | 1,769,102 (100.0%) | $60,183 |
Poverty in Kentucky
Income Below Poverty by Sex and Age in Kentucky
With 14.5% poverty level for males and 17.7% for females among the residents of Kentucky, under 5 year old males and 18 to 24 year old females are the most vulnerable to poverty, with 30,426 males (22.9%) and 49,968 females (27.1%) in their respective age groups living below the poverty level.
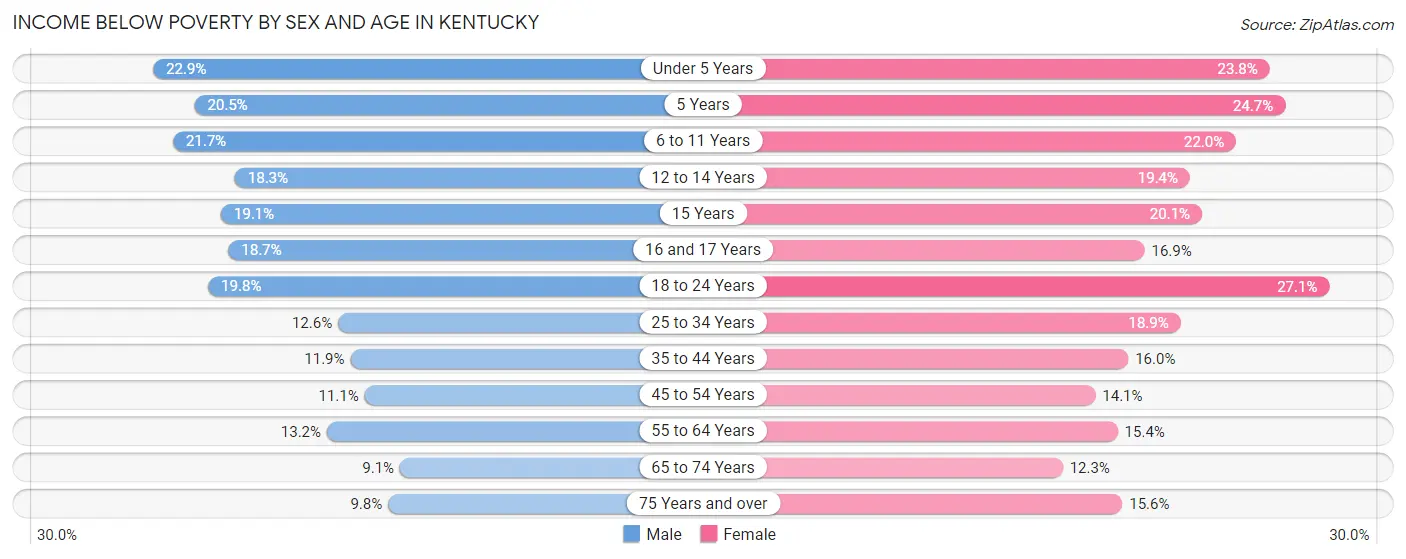
| Age Bracket | Male | Female |
| Under 5 Years | 30,426 (22.9%) | 30,127 (23.8%) |
| 5 Years | 5,670 (20.5%) | 6,448 (24.7%) |
| 6 to 11 Years | 37,119 (21.7%) | 35,214 (22.0%) |
| 12 to 14 Years | 15,847 (18.3%) | 16,325 (19.4%) |
| 15 Years | 5,872 (19.1%) | 5,677 (20.1%) |
| 16 and 17 Years | 11,065 (18.6%) | 9,359 (16.9%) |
| 18 to 24 Years | 38,781 (19.8%) | 49,968 (27.1%) |
| 25 to 34 Years | 35,958 (12.6%) | 53,533 (18.9%) |
| 35 to 44 Years | 32,179 (11.9%) | 44,124 (16.0%) |
| 45 to 54 Years | 30,794 (11.1%) | 39,481 (14.1%) |
| 55 to 64 Years | 37,915 (13.2%) | 46,816 (15.4%) |
| 65 to 74 Years | 19,452 (9.1%) | 29,329 (12.3%) |
| 75 Years and over | 11,394 (9.8%) | 25,885 (15.6%) |
| Total | 312,472 (14.5%) | 392,286 (17.7%) |
Income Above Poverty by Sex and Age in Kentucky
According to the poverty statistics in Kentucky, males aged 65 to 74 years and females aged 65 to 74 years are the age groups that are most secure financially, with 90.9% of males and 87.7% of females in these age groups living above the poverty line.
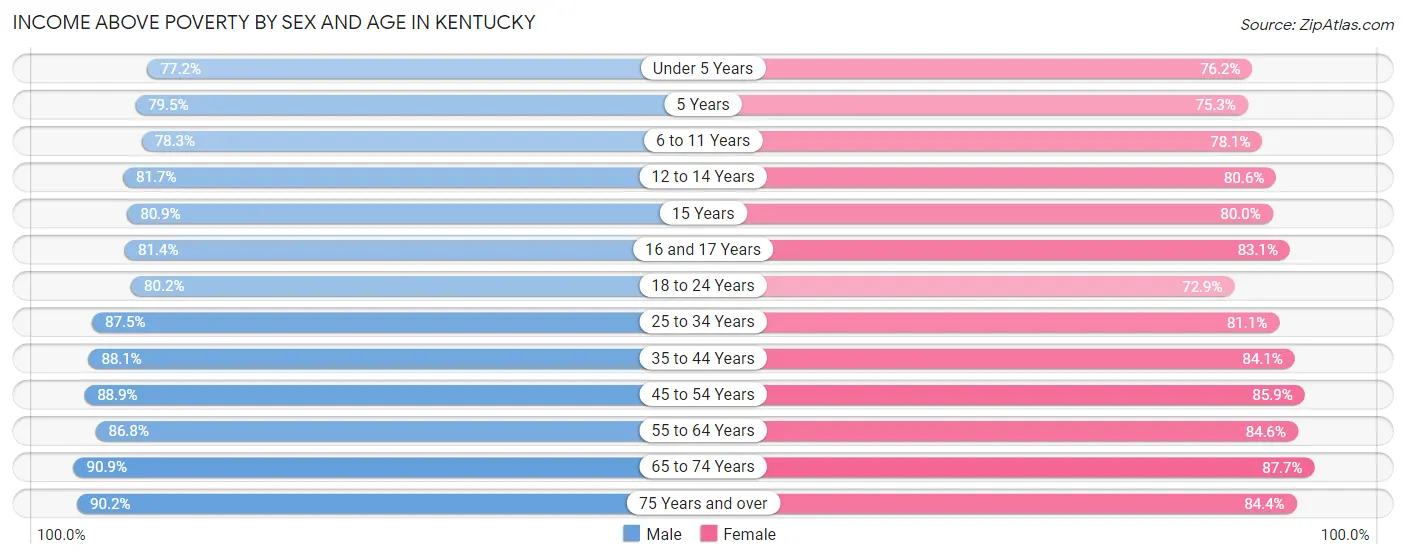
| Age Bracket | Male | Female |
| Under 5 Years | 102,752 (77.1%) | 96,336 (76.2%) |
| 5 Years | 21,940 (79.5%) | 19,683 (75.3%) |
| 6 to 11 Years | 133,600 (78.3%) | 125,246 (78.0%) |
| 12 to 14 Years | 70,777 (81.7%) | 67,912 (80.6%) |
| 15 Years | 24,915 (80.9%) | 22,636 (79.9%) |
| 16 and 17 Years | 48,272 (81.4%) | 46,164 (83.1%) |
| 18 to 24 Years | 157,309 (80.2%) | 134,171 (72.9%) |
| 25 to 34 Years | 250,626 (87.5%) | 230,320 (81.1%) |
| 35 to 44 Years | 239,098 (88.1%) | 232,478 (84.1%) |
| 45 to 54 Years | 247,342 (88.9%) | 240,126 (85.9%) |
| 55 to 64 Years | 249,890 (86.8%) | 257,936 (84.6%) |
| 65 to 74 Years | 194,212 (90.9%) | 209,091 (87.7%) |
| 75 Years and over | 105,321 (90.2%) | 139,838 (84.4%) |
| Total | 1,846,054 (85.5%) | 1,821,937 (82.3%) |
Income Below Poverty Among Married-Couple Families in Kentucky
The poverty statistics for married-couple families in Kentucky show that 6.0% or 50,653 of the total 838,364 families live below the poverty line. Families with 5 or more children have the highest poverty rate of 33.0%, comprising of 2,465 families. On the other hand, families with no children have the lowest poverty rate of 4.7%, which includes 23,603 families.
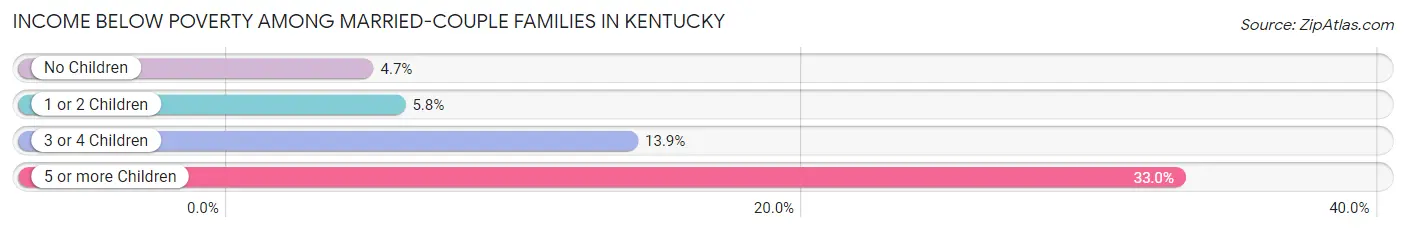
| Children | Above Poverty | Below Poverty |
| No Children | 476,384 (95.3%) | 23,603 (4.7%) |
| 1 or 2 Children | 250,180 (94.2%) | 15,500 (5.8%) |
| 3 or 4 Children | 56,143 (86.1%) | 9,085 (13.9%) |
| 5 or more Children | 5,004 (67.0%) | 2,465 (33.0%) |
| Total | 787,711 (94.0%) | 50,653 (6.0%) |
Income Below Poverty Among Single-Parent Households in Kentucky
According to the poverty data in Kentucky, 16.7% or 15,055 single-father households and 31.9% or 68,246 single-mother households are living below the poverty line. Among single-father households, those with 5 or more children have the highest poverty rate, with 253 households (41.8%) experiencing poverty. Likewise, among single-mother households, those with 5 or more children have the highest poverty rate, with 1,984 households (81.1%) falling below the poverty line.
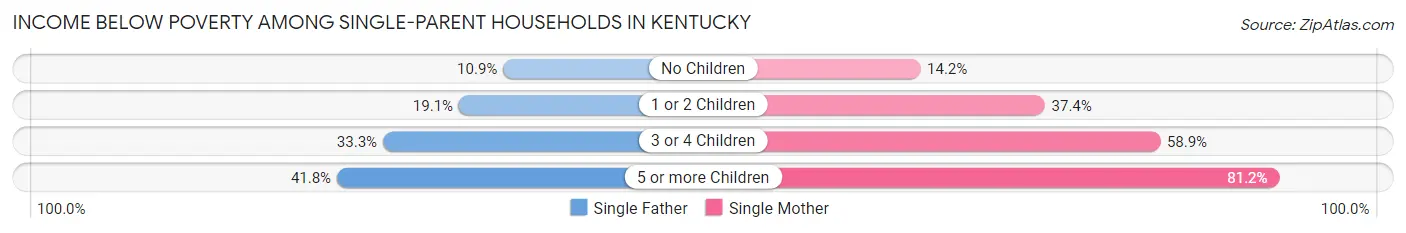
| Children | Single Father | Single Mother |
| No Children | 4,153 (10.9%) | 10,953 (14.2%) |
| 1 or 2 Children | 8,705 (19.1%) | 41,709 (37.4%) |
| 3 or 4 Children | 1,944 (33.3%) | 13,600 (58.9%) |
| 5 or more Children | 253 (41.8%) | 1,984 (81.1%) |
| Total | 15,055 (16.7%) | 68,246 (31.9%) |
Income Below Poverty Among Married-Couple vs Single-Parent Households in Kentucky
The poverty data for Kentucky shows that 50,653 of the married-couple family households (6.0%) and 83,301 of the single-parent households (27.4%) are living below the poverty level. Within the married-couple family households, those with 5 or more children have the highest poverty rate, with 2,465 households (33.0%) falling below the poverty line. Among the single-parent households, those with 5 or more children have the highest poverty rate, with 2,237 household (73.3%) living below poverty.
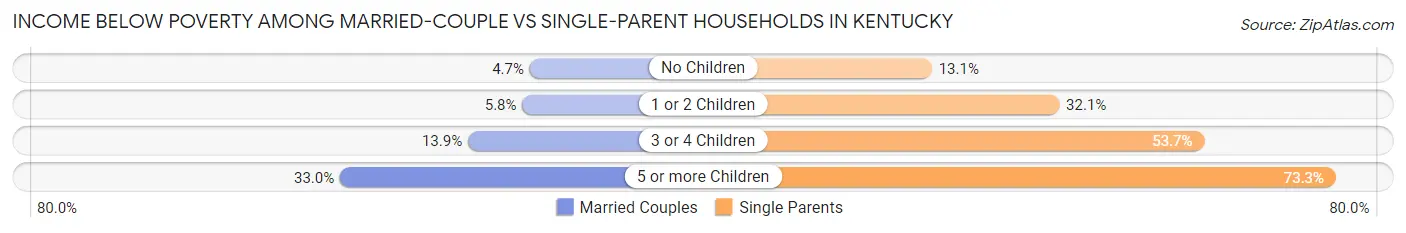
| Children | Married-Couple Families | Single-Parent Households |
| No Children | 23,603 (4.7%) | 15,106 (13.1%) |
| 1 or 2 Children | 15,500 (5.8%) | 50,414 (32.1%) |
| 3 or 4 Children | 9,085 (13.9%) | 15,544 (53.7%) |
| 5 or more Children | 2,465 (33.0%) | 2,237 (73.3%) |
| Total | 50,653 (6.0%) | 83,301 (27.4%) |
Largest Zip Codes by Population in Kentucky
The largest zip codes in Kentucky by population are 40475 (64,678), 42101 (62,041), 41042 (55,347), 42701 (52,618), and 40601 (51,579).
1.40475
64,678 (1.44%)
2.42101
62,041 (1.38%)
3.41042
55,347 (1.23%)
4.42701
52,618 (1.17%)
5.40601
51,579 (1.15%)
6.40324
51,072 (1.13%)
7.40214
46,033 (1.02%)
8.42301
45,851 (1.02%)
9.40509
45,181 (1.00%)
10.40356
44,299 (0.98%)
11.40216
43,167 (0.96%)
12.42240
41,788 (0.93%)
13.42303
41,608 (0.92%)
14.41017
41,040 (0.91%)
15.40291
40,888 (0.91%)
16.40299
40,816 (0.91%)
17.42104
40,285 (0.89%)
18.40229
39,621 (0.88%)
19.40245
38,861 (0.86%)
20.42420
38,528 (0.86%)
21.40219
38,245 (0.85%)
22.40272
38,114 (0.85%)
23.40165
38,074 (0.85%)
24.40391
36,584 (0.81%)
25.40517
36,263 (0.81%)
26.40515
36,163 (0.80%)
27.40511
34,873 (0.77%)
28.40220
34,649 (0.77%)
29.40218
33,479 (0.74%)
30.41051
31,799 (0.71%)
Largest Cities by Population in Kentucky
The largest cities in Kentucky by population are Louisville (629,176), Lexington (321,276), Bowling Green (72,385), Owensboro (60,019), and Covington (40,923).
629,176 (13.97%)
321,276 (7.13%)
72,385 (1.61%)
60,019 (1.33%)
40,923 (0.91%)
37,510 (0.83%)
7.Richmond
34,883 (0.77%)
8.Florence
32,056 (0.71%)
31,425 (0.70%)
31,352 (0.70%)
11.Hopkinsville
31,042 (0.69%)
28,796 (0.64%)
13.Independence
28,722 (0.64%)
14.Frankfort
28,460 (0.63%)
15.Henderson
28,166 (0.63%)
16.Paducah
26,869 (0.60%)
17.Radcliff
22,981 (0.51%)
18.Ashland
21,542 (0.48%)
19.Erlanger
19,577 (0.43%)
20.Madisonville
19,433 (0.43%)
21.Winchester
19,080 (0.42%)
22.Burlington
18,264 (0.41%)
17,987 (0.40%)
24.St Matthews
17,511 (0.39%)
25.Murray
17,414 (0.39%)
26.Fort Thomas
17,310 (0.38%)
27.Shelbyville
17,239 (0.38%)
28.Danville
17,191 (0.38%)
29.Shively
15,595 (0.35%)
30.Berea
15,404 (0.34%)
Largest Counties by Population in Kentucky
The largest counties in Kentucky by population are Jefferson County (779,232), Fayette County (321,276), Kenton County (169,066), Boone County (136,150), and Warren County (135,307).
779,232 (17.30%)
321,276 (7.13%)
169,066 (3.75%)
136,150 (3.02%)
135,307 (3.00%)
111,005 (2.47%)
102,916 (2.29%)
93,122 (2.07%)
92,955 (2.06%)
82,482 (1.83%)
72,766 (1.62%)
67,997 (1.51%)
67,573 (1.50%)
65,145 (1.45%)
62,442 (1.39%)
16.Pike County
58,196 (1.29%)
17.Scott County
57,286 (1.27%)
53,381 (1.19%)
51,475 (1.14%)
20.Boyd County
48,242 (1.07%)
48,105 (1.07%)
46,779 (1.04%)
45,223 (1.00%)
44,770 (0.99%)
44,511 (0.99%)
37,345 (0.83%)
27.Clark County
36,897 (0.82%)
36,701 (0.82%)
36,648 (0.81%)
35,853 (0.80%)
Race in Kentucky
The most populous races in Kentucky are White / Caucasian (3,816,997 | 84.8%), Black / African American (360,184 | 8.0%), and Two or more Races (189,589 | 4.2%).
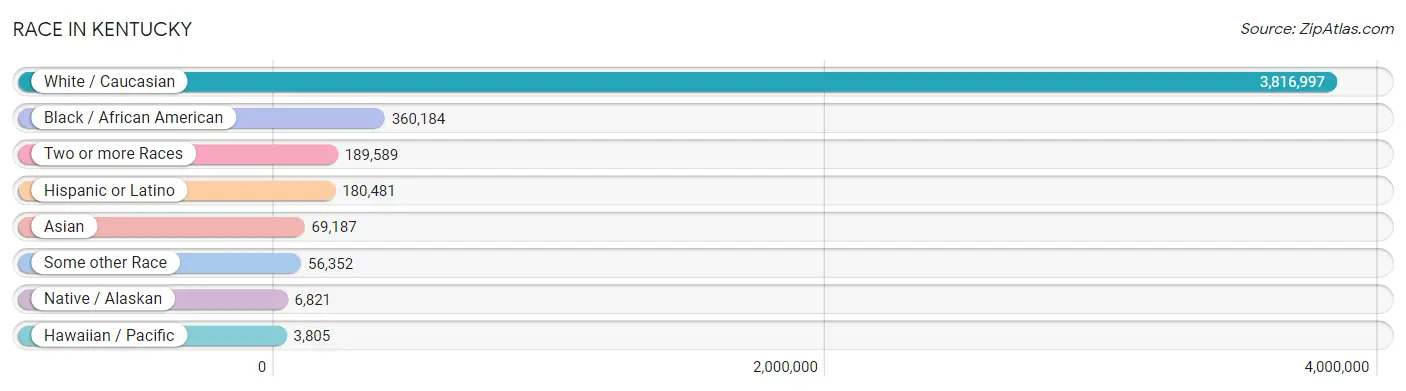
| Race | # Population | % Population |
| Asian | 69,187 | 1.5% |
| Black / African American | 360,184 | 8.0% |
| Hawaiian / Pacific | 3,805 | 0.1% |
| Hispanic or Latino | 180,481 | 4.0% |
| Native / Alaskan | 6,821 | 0.2% |
| White / Caucasian | 3,816,997 | 84.8% |
| Two or more Races | 189,589 | 4.2% |
| Some other Race | 56,352 | 1.3% |
| Total | 4,502,935 | 100.0% |
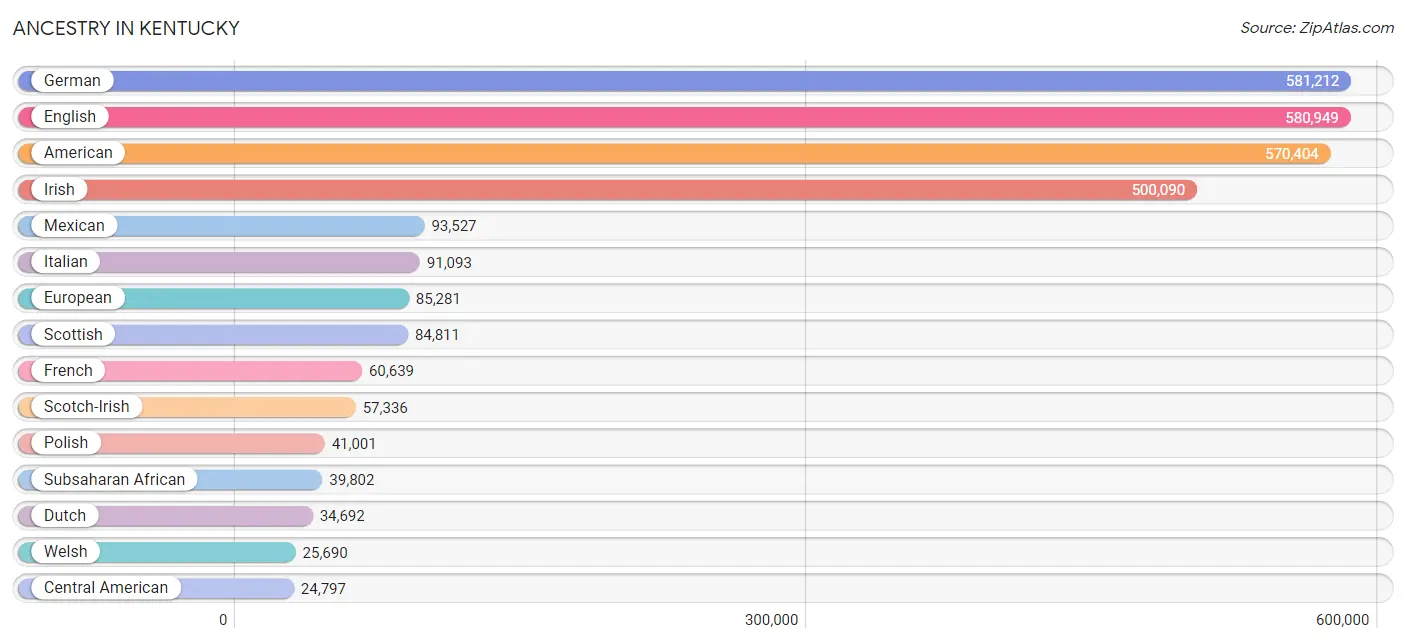
Ancestry in Kentucky
The most populous ancestries reported in Kentucky are German (581,212 | 12.9%), English (580,949 | 12.9%), American (570,404 | 12.7%), Irish (500,090 | 11.1%), and Mexican (93,527 | 2.1%), together accounting for 51.7% of all Kentucky residents.
| Ancestry | # Population | % Population |
| Afghan | 424 | 0.0% |
| African | 24,769 | 0.5% |
| Alaska Native | 44 | 0.0% |
| Alaskan Athabascan | 19 | 0.0% |
| Albanian | 1,381 | 0.0% |
| Aleut | 11 | 0.0% |
| Alsatian | 151 | 0.0% |
| American | 570,404 | 12.7% |
| Apache | 386 | 0.0% |
| Arab | 15,509 | 0.3% |
| Arapaho | 12 | 0.0% |
| Argentinean | 1,234 | 0.0% |
| Armenian | 921 | 0.0% |
| Assyrian / Chaldean / Syriac | 46 | 0.0% |
| Australian | 674 | 0.0% |
| Austrian | 3,275 | 0.1% |
| Bahamian | 262 | 0.0% |
| Bangladeshi | 364 | 0.0% |
| Barbadian | 112 | 0.0% |
| Basque | 118 | 0.0% |
| Belgian | 2,164 | 0.1% |
| Belizean | 166 | 0.0% |
| Bermudan | 106 | 0.0% |
| Bhutanese | 7,068 | 0.2% |
| Blackfeet | 2,102 | 0.1% |
| Bolivian | 197 | 0.0% |
| Brazilian | 1,178 | 0.0% |
| British | 23,780 | 0.5% |
| British West Indian | 457 | 0.0% |
| Bulgarian | 538 | 0.0% |
| Burmese | 8,737 | 0.2% |
| Cajun | 396 | 0.0% |
| Cambodian | 114 | 0.0% |
| Canadian | 3,950 | 0.1% |
| Cape Verdean | 197 | 0.0% |
| Carpatho Rusyn | 35 | 0.0% |
| Celtic | 542 | 0.0% |
| Central American | 24,797 | 0.5% |
| Central American Indian | 1,444 | 0.0% |
| Cherokee | 15,822 | 0.4% |
| Cheyenne | 84 | 0.0% |
| Chickasaw | 283 | 0.0% |
| Chilean | 464 | 0.0% |
| Chinese | 57 | 0.0% |
| Chippewa | 469 | 0.0% |
| Choctaw | 708 | 0.0% |
| Colombian | 2,665 | 0.1% |
| Comanche | 58 | 0.0% |
| Costa Rican | 400 | 0.0% |
| Cree | 255 | 0.0% |
| Creek | 271 | 0.0% |
| Croatian | 2,099 | 0.1% |
| Crow | 73 | 0.0% |
| Cuban | 21,676 | 0.5% |
| Czech | 4,054 | 0.1% |
| Czechoslovakian | 1,648 | 0.0% |
| Danish | 4,262 | 0.1% |
| Delaware | 19 | 0.0% |
| Dominican | 1,632 | 0.0% |
| Dutch | 34,692 | 0.8% |
| Dutch West Indian | 95 | 0.0% |
| Eastern European | 5,523 | 0.1% |
| Ecuadorian | 534 | 0.0% |
| Egyptian | 899 | 0.0% |
| English | 580,949 | 12.9% |
| Estonian | 25 | 0.0% |
| Ethiopian | 1,420 | 0.0% |
| European | 85,281 | 1.9% |
| Fijian | 102 | 0.0% |
| Filipino | 1,112 | 0.0% |
| Finnish | 1,858 | 0.0% |
| French | 60,639 | 1.3% |
| French American Indian | 164 | 0.0% |
| French Canadian | 7,632 | 0.2% |
| German | 581,212 | 12.9% |
| German Russian | 113 | 0.0% |
| Ghanaian | 488 | 0.0% |
| Greek | 5,714 | 0.1% |
| Guamanian / Chamorro | 887 | 0.0% |
| Guatemalan | 11,128 | 0.3% |
| Guyanese | 31 | 0.0% |
| Haitian | 1,957 | 0.0% |
| Hmong | 90 | 0.0% |
| Honduran | 7,018 | 0.2% |
| Hopi | 36 | 0.0% |
| Houma | 7 | 0.0% |
| Hungarian | 7,267 | 0.2% |
| Icelander | 250 | 0.0% |
| Indian (Asian) | 13,904 | 0.3% |
| Indonesian | 6,326 | 0.1% |
| Inupiat | 73 | 0.0% |
| Iranian | 2,194 | 0.1% |
| Iraqi | 1,509 | 0.0% |
| Irish | 500,090 | 11.1% |
| Iroquois | 482 | 0.0% |
| Israeli | 443 | 0.0% |
| Italian | 91,093 | 2.0% |
| Jamaican | 2,215 | 0.1% |
| Japanese | 2,080 | 0.1% |
| Jordanian | 963 | 0.0% |
| Kenyan | 469 | 0.0% |
| Kiowa | 5 | 0.0% |
| Korean | 14,145 | 0.3% |
| Laotian | 770 | 0.0% |
| Latvian | 783 | 0.0% |
| Lebanese | 3,462 | 0.1% |
| Liberian | 547 | 0.0% |
| Lithuanian | 2,952 | 0.1% |
| Lumbee | 177 | 0.0% |
| Luxembourger | 100 | 0.0% |
| Macedonian | 112 | 0.0% |
| Malaysian | 383 | 0.0% |
| Maltese | 110 | 0.0% |
| Menominee | 8 | 0.0% |
| Mexican | 93,527 | 2.1% |
| Mexican American Indian | 2,016 | 0.0% |
| Mongolian | 213 | 0.0% |
| Moroccan | 1,507 | 0.0% |
| Native Hawaiian | 1,910 | 0.0% |
| Navajo | 247 | 0.0% |
| New Zealander | 189 | 0.0% |
| Nicaraguan | 687 | 0.0% |
| Nigerian | 2,503 | 0.1% |
| Northern European | 4,193 | 0.1% |
| Norwegian | 15,092 | 0.3% |
| Okinawan | 72 | 0.0% |
| Osage | 78 | 0.0% |
| Ottawa | 47 | 0.0% |
| Paiute | 20 | 0.0% |
| Pakistani | 1,837 | 0.0% |
| Palestinian | 1,076 | 0.0% |
| Panamanian | 2,034 | 0.1% |
| Paraguayan | 65 | 0.0% |
| Pennsylvania German | 2,559 | 0.1% |
| Peruvian | 2,289 | 0.1% |
| Polish | 41,001 | 0.9% |
| Portuguese | 4,130 | 0.1% |
| Potawatomi | 81 | 0.0% |
| Pueblo | 90 | 0.0% |
| Puerto Rican | 17,895 | 0.4% |
| Puget Sound Salish | 28 | 0.0% |
| Romanian | 1,588 | 0.0% |
| Russian | 10,242 | 0.2% |
| Salvadoran | 3,518 | 0.1% |
| Samoan | 741 | 0.0% |
| Scandinavian | 9,954 | 0.2% |
| Scotch-Irish | 57,336 | 1.3% |
| Scottish | 84,811 | 1.9% |
| Seminole | 121 | 0.0% |
| Senegalese | 426 | 0.0% |
| Serbian | 1,099 | 0.0% |
| Shoshone | 37 | 0.0% |
| Sierra Leonean | 46 | 0.0% |
| Sioux | 533 | 0.0% |
| Slavic | 654 | 0.0% |
| Slovak | 3,188 | 0.1% |
| Slovene | 689 | 0.0% |
| Somali | 1,681 | 0.0% |
| South African | 500 | 0.0% |
| South American | 9,181 | 0.2% |
| South American Indian | 81 | 0.0% |
| Soviet Union | 16 | 0.0% |
| Spaniard | 2,821 | 0.1% |
| Spanish | 2,559 | 0.1% |
| Spanish American | 35 | 0.0% |
| Spanish American Indian | 92 | 0.0% |
| Sri Lankan | 6,823 | 0.2% |
| Subsaharan African | 39,802 | 0.9% |
| Sudanese | 439 | 0.0% |
| Swedish | 17,385 | 0.4% |
| Swiss | 10,440 | 0.2% |
| Syrian | 773 | 0.0% |
| Taiwanese | 38 | 0.0% |
| Thai | 19,846 | 0.4% |
| Tlingit-Haida | 13 | 0.0% |
| Tohono O'Odham | 255 | 0.0% |
| Tongan | 27 | 0.0% |
| Trinidadian and Tobagonian | 368 | 0.0% |
| Turkish | 1,180 | 0.0% |
| U.S. Virgin Islander | 80 | 0.0% |
| Ugandan | 182 | 0.0% |
| Ukrainian | 5,037 | 0.1% |
| Uruguayan | 24 | 0.0% |
| Ute | 19 | 0.0% |
| Venezuelan | 1,537 | 0.0% |
| Vietnamese | 179 | 0.0% |
| Welsh | 25,690 | 0.6% |
| West Indian | 705 | 0.0% |
| Yaqui | 13 | 0.0% |
| Yugoslavian | 4,202 | 0.1% |
| Yup'ik | 31 | 0.0% |
| Zimbabwean | 14 | 0.0% | View All 192 Rows |
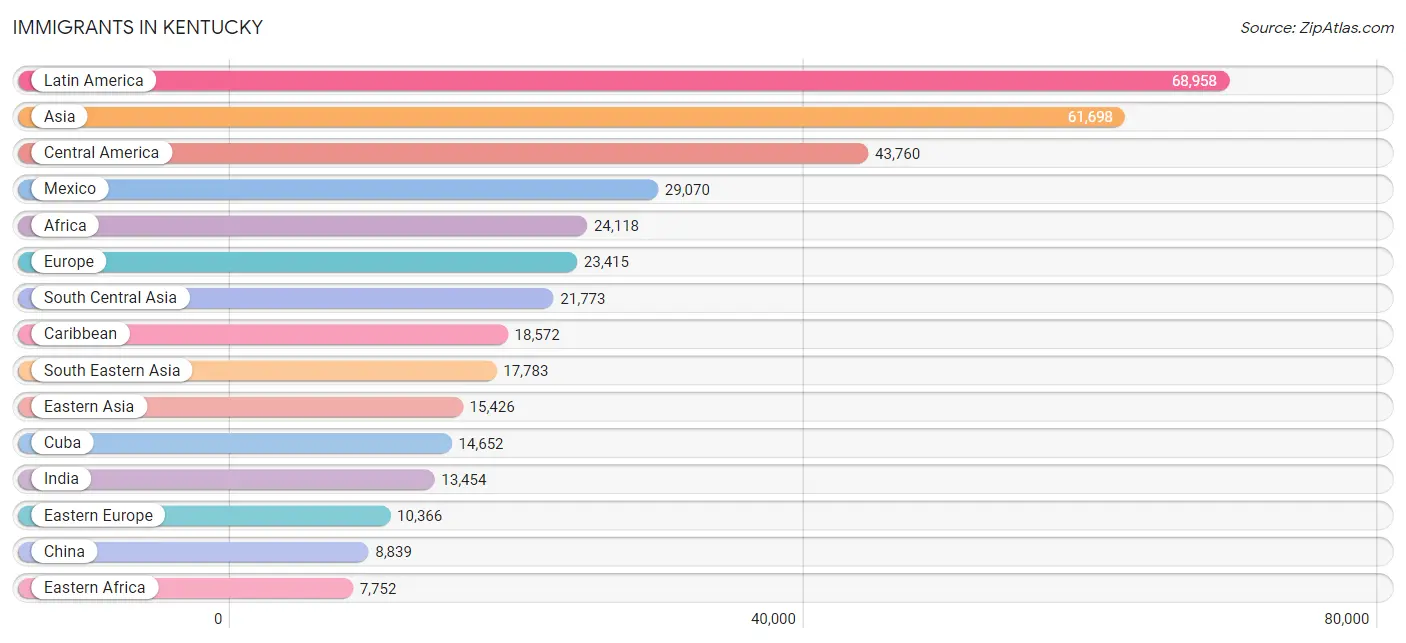
Immigrants in Kentucky
The most numerous immigrant groups reported in Kentucky came from Latin America (68,958 | 1.5%), Asia (61,698 | 1.4%), Central America (43,760 | 1.0%), Mexico (29,070 | 0.6%), and Africa (24,118 | 0.5%), together accounting for 5.1% of all Kentucky residents.
| Immigration Origin | # Population | % Population |
| Afghanistan | 370 | 0.0% |
| Africa | 24,118 | 0.5% |
| Albania | 249 | 0.0% |
| Argentina | 802 | 0.0% |
| Armenia | 1 | 0.0% |
| Asia | 61,698 | 1.4% |
| Australia | 398 | 0.0% |
| Austria | 203 | 0.0% |
| Bahamas | 155 | 0.0% |
| Bangladesh | 366 | 0.0% |
| Barbados | 88 | 0.0% |
| Belarus | 373 | 0.0% |
| Belgium | 167 | 0.0% |
| Belize | 102 | 0.0% |
| Bolivia | 142 | 0.0% |
| Bosnia and Herzegovina | 3,094 | 0.1% |
| Brazil | 778 | 0.0% |
| Bulgaria | 405 | 0.0% |
| Cambodia | 1,031 | 0.0% |
| Cameroon | 339 | 0.0% |
| Canada | 4,303 | 0.1% |
| Caribbean | 18,572 | 0.4% |
| Central America | 43,760 | 1.0% |
| Chile | 321 | 0.0% |
| China | 8,839 | 0.2% |
| Colombia | 1,529 | 0.0% |
| Congo | 2,276 | 0.1% |
| Costa Rica | 340 | 0.0% |
| Croatia | 280 | 0.0% |
| Cuba | 14,652 | 0.3% |
| Czechoslovakia | 170 | 0.0% |
| Denmark | 95 | 0.0% |
| Dominican Republic | 484 | 0.0% |
| Eastern Africa | 7,752 | 0.2% |
| Eastern Asia | 15,426 | 0.3% |
| Eastern Europe | 10,366 | 0.2% |
| Ecuador | 246 | 0.0% |
| Egypt | 488 | 0.0% |
| El Salvador | 1,652 | 0.0% |
| England | 1,743 | 0.0% |
| Eritrea | 207 | 0.0% |
| Ethiopia | 1,372 | 0.0% |
| Europe | 23,415 | 0.5% |
| Fiji | 10 | 0.0% |
| France | 704 | 0.0% |
| Germany | 5,302 | 0.1% |
| Ghana | 780 | 0.0% |
| Greece | 204 | 0.0% |
| Grenada | 70 | 0.0% |
| Guatemala | 6,894 | 0.2% |
| Guyana | 263 | 0.0% |
| Haiti | 1,121 | 0.0% |
| Honduras | 4,639 | 0.1% |
| Hong Kong | 301 | 0.0% |
| Hungary | 202 | 0.0% |
| India | 13,454 | 0.3% |
| Indonesia | 442 | 0.0% |
| Iran | 1,187 | 0.0% |
| Iraq | 2,689 | 0.1% |
| Ireland | 800 | 0.0% |
| Israel | 264 | 0.0% |
| Italy | 434 | 0.0% |
| Jamaica | 1,437 | 0.0% |
| Japan | 2,893 | 0.1% |
| Jordan | 1,095 | 0.0% |
| Kazakhstan | 129 | 0.0% |
| Kenya | 1,048 | 0.0% |
| Korea | 3,585 | 0.1% |
| Kuwait | 206 | 0.0% |
| Laos | 345 | 0.0% |
| Latin America | 68,958 | 1.5% |
| Latvia | 108 | 0.0% |
| Lebanon | 268 | 0.0% |
| Liberia | 764 | 0.0% |
| Lithuania | 46 | 0.0% |
| Malaysia | 644 | 0.0% |
| Mexico | 29,070 | 0.6% |
| Micronesia | 764 | 0.0% |
| Middle Africa | 6,589 | 0.2% |
| Moldova | 152 | 0.0% |
| Morocco | 1,089 | 0.0% |
| Nepal | 2,276 | 0.1% |
| Netherlands | 387 | 0.0% |
| Nicaragua | 264 | 0.0% |
| Nigeria | 1,397 | 0.0% |
| North Macedonia | 16 | 0.0% |
| Northern Africa | 2,553 | 0.1% |
| Northern Europe | 4,945 | 0.1% |
| Norway | 71 | 0.0% |
| Oceania | 1,525 | 0.0% |
| Pakistan | 1,327 | 0.0% |
| Panama | 782 | 0.0% |
| Peru | 1,128 | 0.0% |
| Philippines | 6,109 | 0.1% |
| Poland | 531 | 0.0% |
| Portugal | 138 | 0.0% |
| Romania | 258 | 0.0% |
| Russia | 1,604 | 0.0% |
| Saudi Arabia | 345 | 0.0% |
| Scotland | 438 | 0.0% |
| Senegal | 782 | 0.0% |
| Serbia | 272 | 0.0% |
| Sierra Leone | 15 | 0.0% |
| Singapore | 114 | 0.0% |
| Somalia | 1,776 | 0.0% |
| South Africa | 723 | 0.0% |
| South America | 6,626 | 0.2% |
| South Central Asia | 21,773 | 0.5% |
| South Eastern Asia | 17,783 | 0.4% |
| Southern Europe | 1,194 | 0.0% |
| Spain | 399 | 0.0% |
| Sri Lanka | 271 | 0.0% |
| St. Vincent and the Grenadines | 28 | 0.0% |
| Sudan | 242 | 0.0% |
| Sweden | 227 | 0.0% |
| Switzerland | 112 | 0.0% |
| Syria | 519 | 0.0% |
| Taiwan | 804 | 0.0% |
| Thailand | 1,962 | 0.0% |
| Trinidad and Tobago | 331 | 0.0% |
| Turkey | 254 | 0.0% |
| Uganda | 286 | 0.0% |
| Ukraine | 1,529 | 0.0% |
| Uruguay | 21 | 0.0% |
| Uzbekistan | 614 | 0.0% |
| Venezuela | 1,310 | 0.0% |
| Vietnam | 3,654 | 0.1% |
| West Indies | 99 | 0.0% |
| Western Africa | 4,908 | 0.1% |
| Western Asia | 6,162 | 0.1% |
| Western Europe | 6,883 | 0.2% |
| Zaire | 3,435 | 0.1% |
| Zimbabwe | 78 | 0.0% | View All 133 Rows |
Sex and Age in Kentucky
Sex and Age in Kentucky
The most populous age groups in Kentucky are 20 to 24 Years (157,987 | 7.1%) for men and 60 to 64 Years (155,531 | 6.9%) for women.
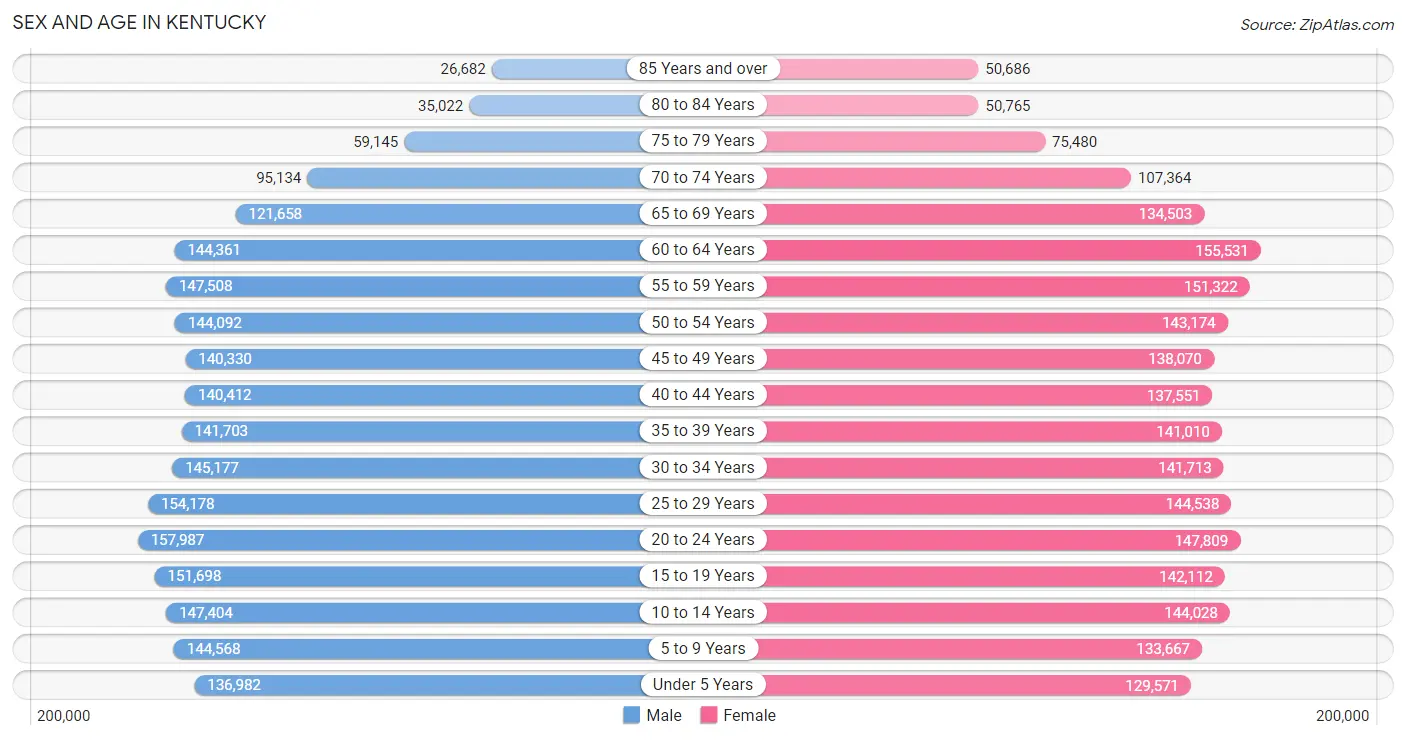
| Age Bracket | Male | Female |
| Under 5 Years | 136,982 (6.1%) | 129,571 (5.7%) |
| 5 to 9 Years | 144,568 (6.5%) | 133,667 (5.9%) |
| 10 to 14 Years | 147,404 (6.6%) | 144,028 (6.4%) |
| 15 to 19 Years | 151,698 (6.8%) | 142,112 (6.3%) |
| 20 to 24 Years | 157,987 (7.1%) | 147,809 (6.5%) |
| 25 to 29 Years | 154,178 (6.9%) | 144,538 (6.4%) |
| 30 to 34 Years | 145,177 (6.5%) | 141,713 (6.2%) |
| 35 to 39 Years | 141,703 (6.3%) | 141,010 (6.2%) |
| 40 to 44 Years | 140,412 (6.3%) | 137,551 (6.1%) |
| 45 to 49 Years | 140,330 (6.3%) | 138,070 (6.1%) |
| 50 to 54 Years | 144,092 (6.5%) | 143,174 (6.3%) |
| 55 to 59 Years | 147,508 (6.6%) | 151,322 (6.7%) |
| 60 to 64 Years | 144,361 (6.5%) | 155,531 (6.9%) |
| 65 to 69 Years | 121,658 (5.4%) | 134,503 (5.9%) |
| 70 to 74 Years | 95,134 (4.3%) | 107,364 (4.7%) |
| 75 to 79 Years | 59,145 (2.6%) | 75,480 (3.3%) |
| 80 to 84 Years | 35,022 (1.6%) | 50,765 (2.2%) |
| 85 Years and over | 26,682 (1.2%) | 50,686 (2.2%) |
| Total | 2,234,041 (100.0%) | 2,268,894 (100.0%) |
Families and Households in Kentucky
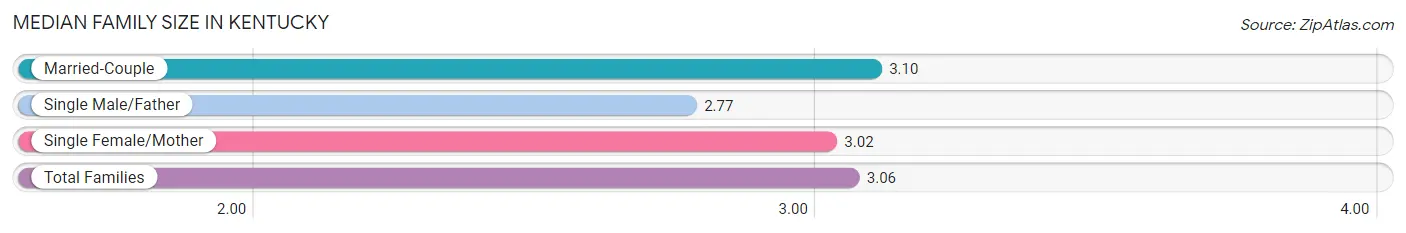
Median Family Size in Kentucky
The median family size in Kentucky is 3.06 persons per family, with married-couple families (838,364 | 73.4%) accounting for the largest median family size of 3.1 persons per family. On the other hand, single male/father families (90,229 | 7.9%) represent the smallest median family size with 2.77 persons per family.
| Family Type | # Families | Family Size |
| Married-Couple | 838,364 (73.4%) | 3.10 |
| Single Male/Father | 90,229 (7.9%) | 2.77 |
| Single Female/Mother | 213,879 (18.7%) | 3.02 |
| Total Families | 1,142,472 (100.0%) | 3.06 |
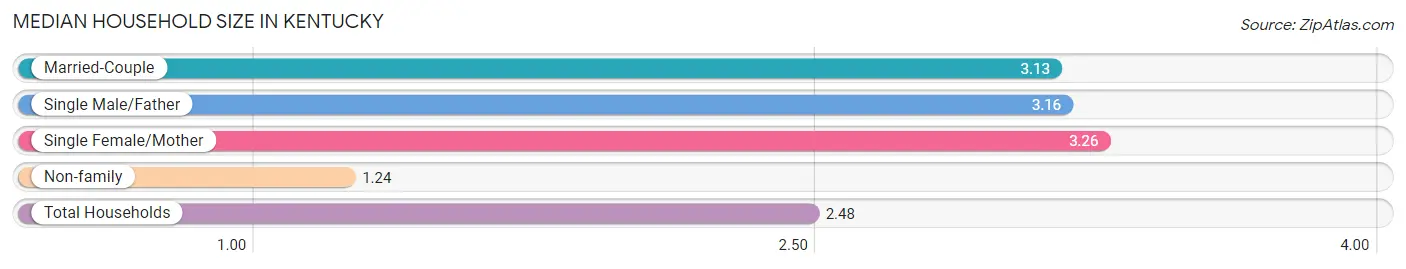
Median Household Size in Kentucky
The median household size in Kentucky is 2.48 persons per household, with single female/mother households (213,879 | 12.1%) accounting for the largest median household size of 3.26 persons per household. non-family households (626,630 | 35.4%) represent the smallest median household size with 1.24 persons per household.
| Household Type | # Households | Household Size |
| Married-Couple | 838,364 (47.4%) | 3.13 |
| Single Male/Father | 90,229 (5.1%) | 3.16 |
| Single Female/Mother | 213,879 (12.1%) | 3.26 |
| Non-family | 626,630 (35.4%) | 1.24 |
| Total Households | 1,769,102 (100.0%) | 2.48 |
Household Size by Marriage Status in Kentucky
Out of a total of 1,769,102 households in Kentucky, 1,142,472 (64.6%) are family households, while 626,630 (35.4%) are nonfamily households. The most numerous type of family households are 2-person households, comprising 527,713, and the most common type of nonfamily households are 1-person households, comprising 513,804.
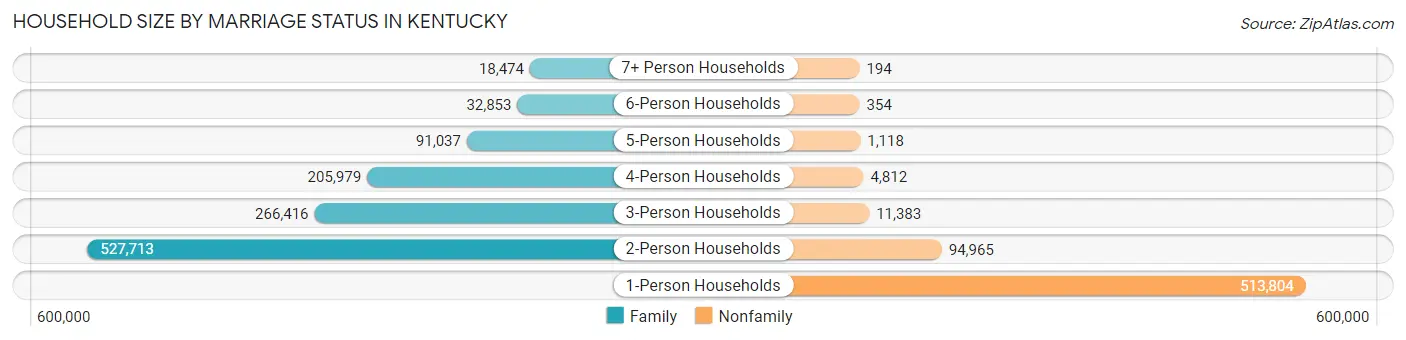
| Household Size | Family Households | Nonfamily Households |
| 1-Person Households | - | 513,804 (29.0%) |
| 2-Person Households | 527,713 (29.8%) | 94,965 (5.4%) |
| 3-Person Households | 266,416 (15.1%) | 11,383 (0.6%) |
| 4-Person Households | 205,979 (11.6%) | 4,812 (0.3%) |
| 5-Person Households | 91,037 (5.1%) | 1,118 (0.1%) |
| 6-Person Households | 32,853 (1.9%) | 354 (0.0%) |
| 7+ Person Households | 18,474 (1.0%) | 194 (0.0%) |
| Total | 1,142,472 (64.6%) | 626,630 (35.4%) |
Female Fertility in Kentucky
Fertility by Age in Kentucky
Average fertility rate in Kentucky is 53.0 births per 1,000 women. Women in the age bracket of 20 to 34 years have the highest fertility rate with 99.0 births per 1,000 women. Women in the age bracket of 20 to 34 years acount for 79.0% of all women with births.
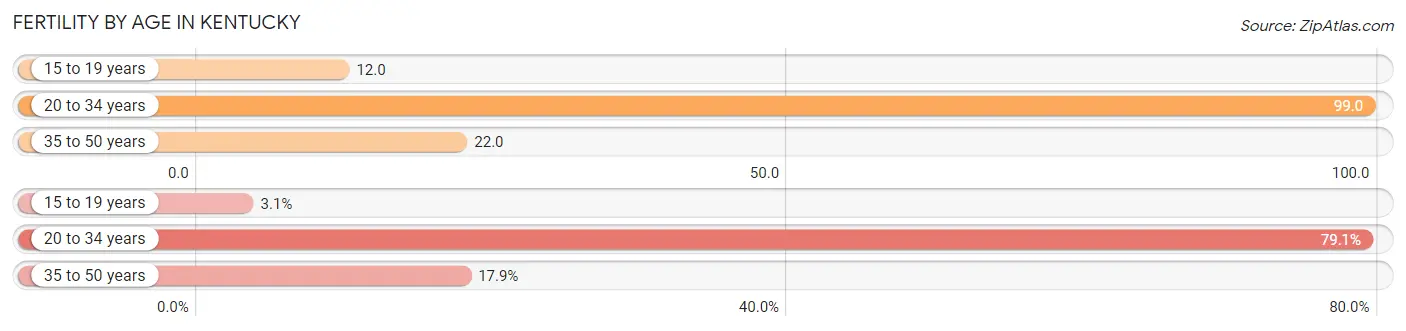
| Age Bracket | Women with Births | Births / 1,000 Women |
| 15 to 19 years | 1,673 (3.1%) | 12.0 |
| 20 to 34 years | 42,861 (79.0%) | 99.0 |
| 35 to 50 years | 9,685 (17.9%) | 22.0 |
| Total | 54,219 (100.0%) | 53.0 |
Fertility by Age by Marriage Status in Kentucky
66.2% of women with births (54,219) in Kentucky are married. The highest percentage of unmarried women with births falls into 15 to 19 years age bracket with 80.6% of them unmarried at the time of birth, while the lowest percentage of unmarried women with births belong to 35 to 50 years age bracket with 21.0% of them unmarried.
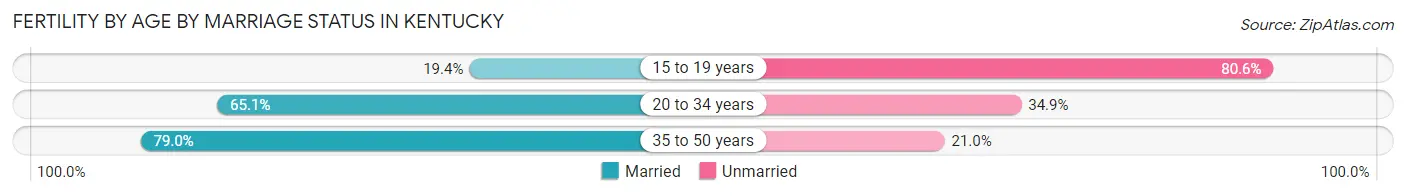
| Age Bracket | Married | Unmarried |
| 15 to 19 years | 325 (19.4%) | 1,348 (80.6%) |
| 20 to 34 years | 27,903 (65.1%) | 14,958 (34.9%) |
| 35 to 50 years | 7,651 (79.0%) | 2,034 (21.0%) |
| Total | 35,893 (66.2%) | 18,326 (33.8%) |
Fertility by Education in Kentucky
Average fertility rate in Kentucky is 53.0 births per 1,000 women. Women with the education attainment of graduate degree have the highest fertility rate of 65.0 births per 1,000 women, while women with the education attainment of less than high school have the lowest fertility at 37.0 births per 1,000 women. Women with the education attainment of college or associate's degree represent 31.9% of all women with births.
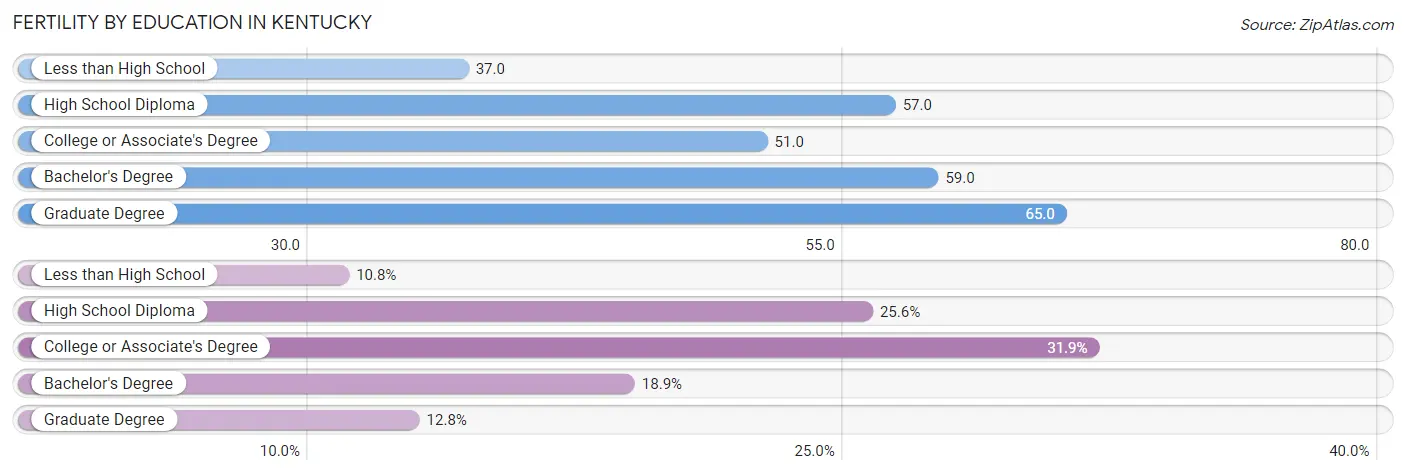
| Educational Attainment | Women with Births | Births / 1,000 Women |
| Less than High School | 5,875 (10.8%) | 37.0 |
| High School Diploma | 13,856 (25.6%) | 57.0 |
| College or Associate's Degree | 17,309 (31.9%) | 51.0 |
| Bachelor's Degree | 10,230 (18.9%) | 59.0 |
| Graduate Degree | 6,949 (12.8%) | 65.0 |
| Total | 54,219 (100.0%) | 53.0 |
Fertility by Education by Marriage Status in Kentucky
33.8% of women with births in Kentucky are unmarried. Women with the educational attainment of graduate degree are most likely to be married with 93.5% of them married at childbirth, while women with the educational attainment of less than high school are least likely to be married with 50.0% of them unmarried at childbirth.
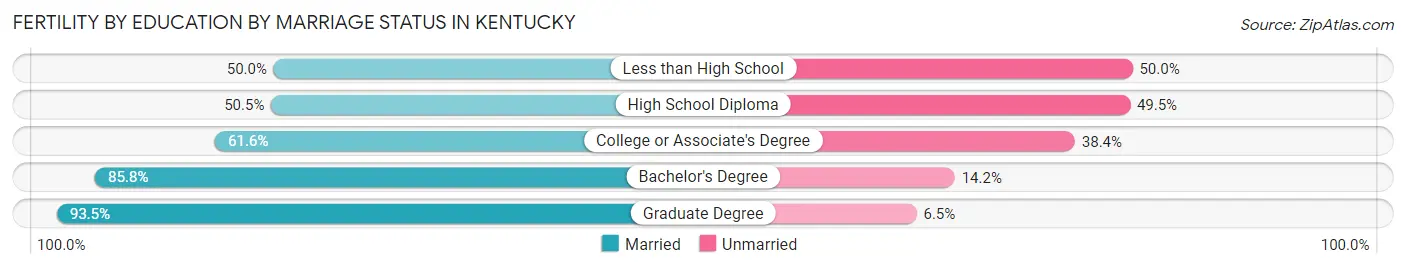
| Educational Attainment | Married | Unmarried |
| Less than High School | 2,937 (50.0%) | 2,938 (50.0%) |
| High School Diploma | 6,997 (50.5%) | 6,859 (49.5%) |
| College or Associate's Degree | 10,662 (61.6%) | 6,647 (38.4%) |
| Bachelor's Degree | 8,777 (85.8%) | 1,453 (14.2%) |
| Graduate Degree | 6,497 (93.5%) | 452 (6.5%) |
| Total | 35,893 (66.2%) | 18,326 (33.8%) |
Employment Characteristics in Kentucky
Employment by Class of Employer in Kentucky
Among the 1,993,847 employed individuals in Kentucky, private company employees (1,363,693 | 68.4%), not-for-profit organizations (164,222 | 8.2%), and local government employees (129,189 | 6.5%) make up the most common classes of employment.
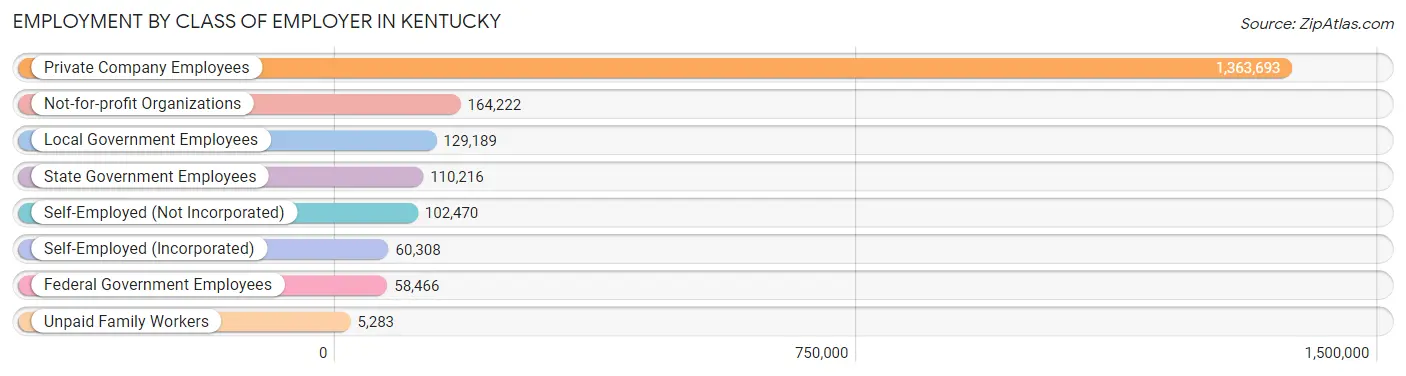
| Employer Class | # Employees | % Employees |
| Private Company Employees | 1,363,693 | 68.4% |
| Self-Employed (Incorporated) | 60,308 | 3.0% |
| Self-Employed (Not Incorporated) | 102,470 | 5.1% |
| Not-for-profit Organizations | 164,222 | 8.2% |
| Local Government Employees | 129,189 | 6.5% |
| State Government Employees | 110,216 | 5.5% |
| Federal Government Employees | 58,466 | 2.9% |
| Unpaid Family Workers | 5,283 | 0.3% |
| Total | 1,993,847 | 100.0% |
Employment Status by Age in Kentucky
According to the labor force statistics for Kentucky, out of the total population over 16 years of age (3,607,440), 59.5% or 2,146,427 individuals are in the labor force, with 5.1% or 109,468 of them unemployed. The age group with the highest labor force participation rate is 25 to 29 years, with 81.5% or 243,454 individuals in the labor force. Within the labor force, the 16 to 19 years age range has the highest percentage of unemployed individuals, with 13.9% or 14,442 of them being unemployed.
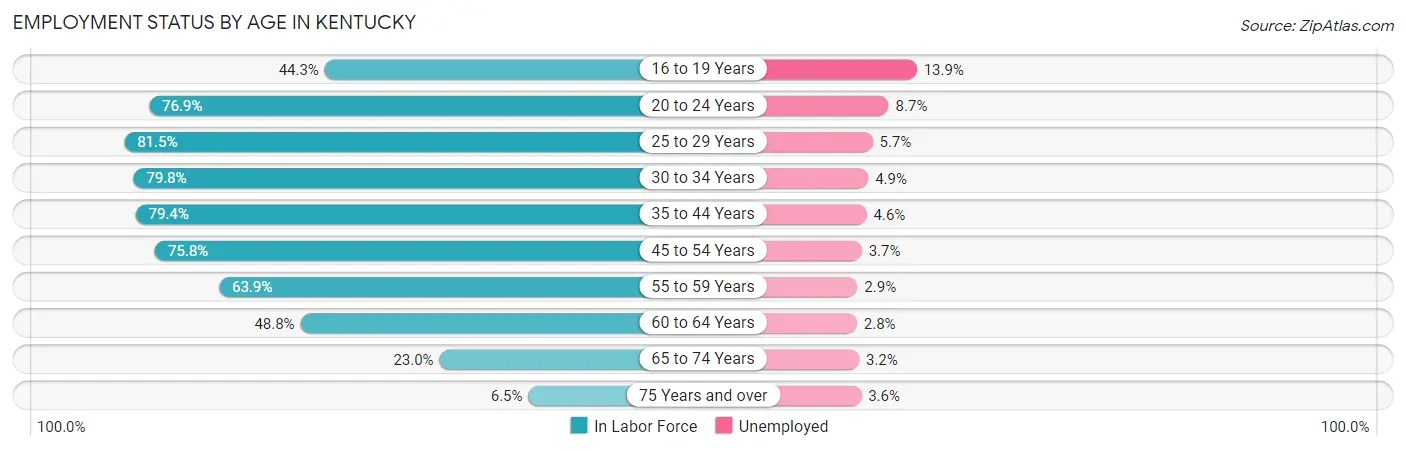
| Age Bracket | In Labor Force | Unemployed |
| 16 to 19 Years | 103,899 (44.3%) | 14,442 (13.9%) |
| 20 to 24 Years | 235,157 (76.9%) | 20,459 (8.7%) |
| 25 to 29 Years | 243,454 (81.5%) | 13,877 (5.7%) |
| 30 to 34 Years | 228,938 (79.8%) | 11,218 (4.9%) |
| 35 to 44 Years | 445,177 (79.4%) | 20,478 (4.6%) |
| 45 to 54 Years | 428,775 (75.8%) | 15,865 (3.7%) |
| 55 to 59 Years | 190,952 (63.9%) | 5,538 (2.9%) |
| 60 to 64 Years | 146,347 (48.8%) | 4,098 (2.8%) |
| 65 to 74 Years | 105,492 (23.0%) | 3,376 (3.2%) |
| 75 Years and over | 19,356 (6.5%) | 697 (3.6%) |
| Total | 2,146,427 (59.5%) | 109,468 (5.1%) |
Employment Status by Educational Attainment in Kentucky
According to labor force statistics for Kentucky, 72.9% of individuals (1,684,478) out of the total population between 25 and 64 years of age (2,310,670) are in the labor force, with 4.2% or 70,748 of them being unemployed. The group with the highest labor force participation rate are those with the educational attainment of bachelor's degree or higher, with 87.1% or 562,612 individuals in the labor force. Within the labor force, individuals with less than high school education have the highest percentage of unemployment, with 8.8% or 9,418 of them being unemployed.
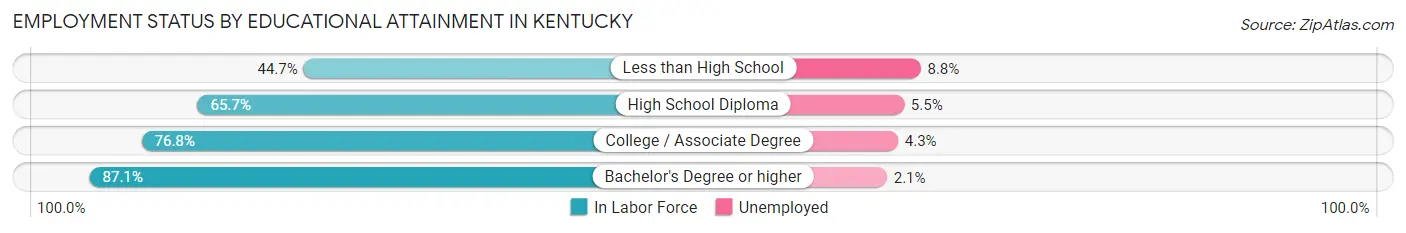
| Educational Attainment | In Labor Force | Unemployed |
| Less than High School | 107,020 (44.7%) | 21,069 (8.8%) |
| High School Diploma | 475,173 (65.7%) | 39,779 (5.5%) |
| College / Associate Degree | 539,187 (76.8%) | 30,189 (4.3%) |
| Bachelor's Degree or higher | 562,612 (87.1%) | 13,565 (2.1%) |
| Total | 1,684,478 (72.9%) | 97,048 (4.2%) |
Employment Occupations by Sex in Kentucky
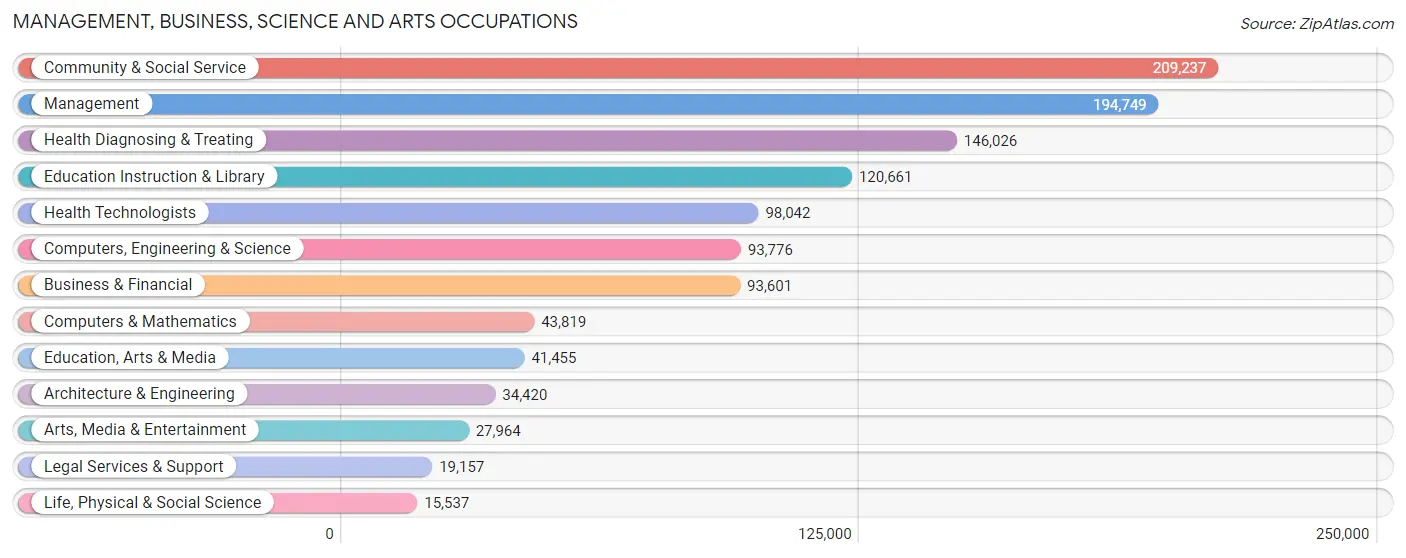
Management, Business, Science and Arts Occupations
The most common Management, Business, Science and Arts occupations in Kentucky are Community & Social Service (209,237 | 10.3%), Management (194,749 | 9.6%), Health Diagnosing & Treating (146,026 | 7.2%), Education Instruction & Library (120,661 | 6.0%), and Health Technologists (98,042 | 4.8%).
Management, Business, Science and Arts Occupations by Sex
Within the Management, Business, Science and Arts occupations in Kentucky, the most male-oriented occupations are Architecture & Engineering (82.8%), Computers, Engineering & Science (73.3%), and Computers & Mathematics (73.0%), while the most female-oriented occupations are Health Technologists (77.7%), Health Diagnosing & Treating (77.4%), and Education Instruction & Library (74.3%).
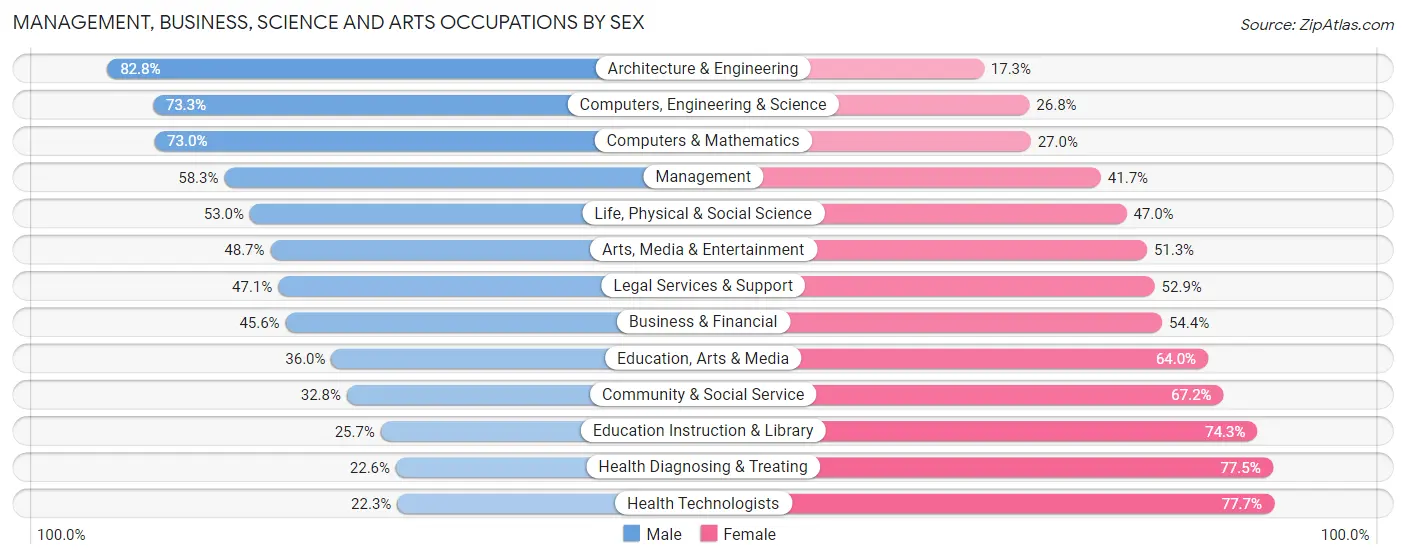
| Occupation | Male | Female |
| Management | 113,623 (58.3%) | 81,126 (41.7%) |
| Business & Financial | 42,671 (45.6%) | 50,930 (54.4%) |
| Computers, Engineering & Science | 68,692 (73.3%) | 25,084 (26.8%) |
| Computers & Mathematics | 31,974 (73.0%) | 11,845 (27.0%) |
| Architecture & Engineering | 28,482 (82.8%) | 5,938 (17.2%) |
| Life, Physical & Social Science | 8,236 (53.0%) | 7,301 (47.0%) |
| Community & Social Service | 68,610 (32.8%) | 140,627 (67.2%) |
| Education, Arts & Media | 14,926 (36.0%) | 26,529 (64.0%) |
| Legal Services & Support | 9,026 (47.1%) | 10,131 (52.9%) |
| Education Instruction & Library | 31,032 (25.7%) | 89,629 (74.3%) |
| Arts, Media & Entertainment | 13,626 (48.7%) | 14,338 (51.3%) |
| Health Diagnosing & Treating | 32,935 (22.6%) | 113,091 (77.4%) |
| Health Technologists | 21,839 (22.3%) | 76,203 (77.7%) |
| Total (Category) | 326,531 (44.3%) | 410,858 (55.7%) |
| Total (Overall) | 1,063,650 (52.5%) | 961,746 (47.5%) |
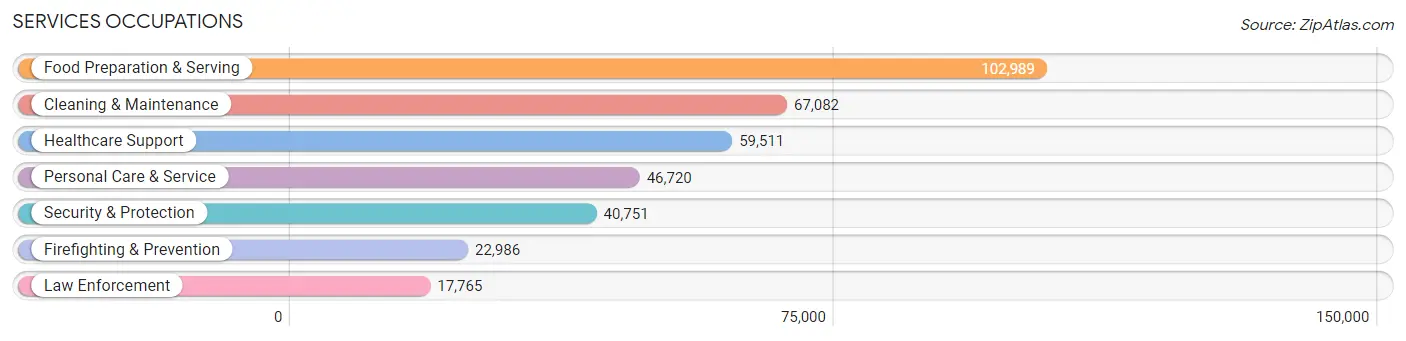
Services Occupations
The most common Services occupations in Kentucky are Food Preparation & Serving (102,989 | 5.1%), Cleaning & Maintenance (67,082 | 3.3%), Healthcare Support (59,511 | 2.9%), Personal Care & Service (46,720 | 2.3%), and Security & Protection (40,751 | 2.0%).
Services Occupations by Sex
Within the Services occupations in Kentucky, the most male-oriented occupations are Law Enforcement (82.5%), Security & Protection (79.8%), and Firefighting & Prevention (77.8%), while the most female-oriented occupations are Healthcare Support (88.1%), Personal Care & Service (75.4%), and Food Preparation & Serving (61.5%).
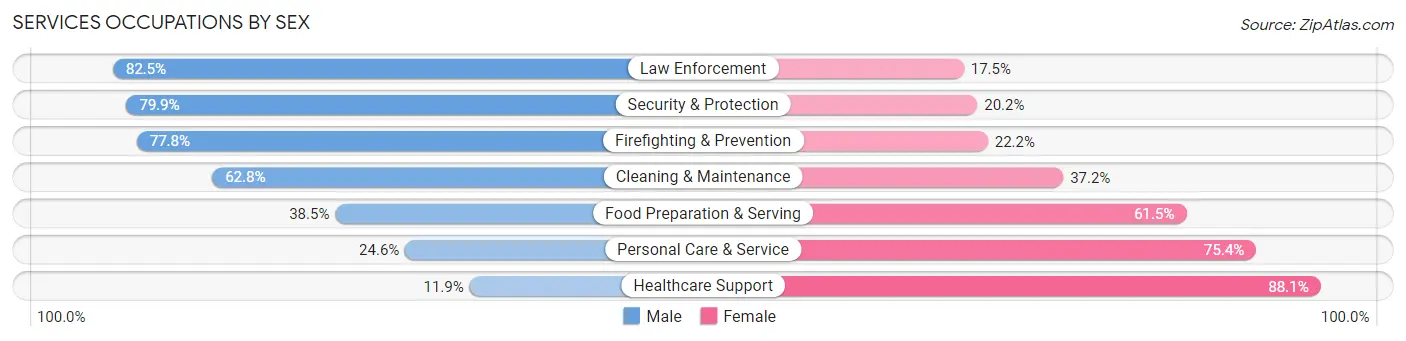
| Occupation | Male | Female |
| Healthcare Support | 7,079 (11.9%) | 52,432 (88.1%) |
| Security & Protection | 32,541 (79.8%) | 8,210 (20.2%) |
| Firefighting & Prevention | 17,879 (77.8%) | 5,107 (22.2%) |
| Law Enforcement | 14,662 (82.5%) | 3,103 (17.5%) |
| Food Preparation & Serving | 39,636 (38.5%) | 63,353 (61.5%) |
| Cleaning & Maintenance | 42,153 (62.8%) | 24,929 (37.2%) |
| Personal Care & Service | 11,512 (24.6%) | 35,208 (75.4%) |
| Total (Category) | 132,921 (41.9%) | 184,132 (58.1%) |
| Total (Overall) | 1,063,650 (52.5%) | 961,746 (47.5%) |
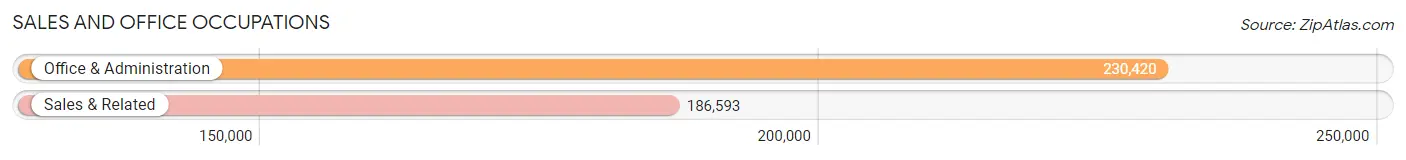
Sales and Office Occupations
The most common Sales and Office occupations in Kentucky are Office & Administration (230,420 | 11.4%), and Sales & Related (186,593 | 9.2%).
Sales and Office Occupations by Sex
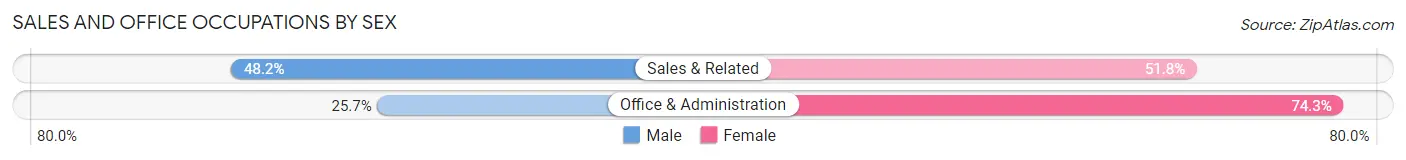
| Occupation | Male | Female |
| Sales & Related | 90,012 (48.2%) | 96,581 (51.8%) |
| Office & Administration | 59,210 (25.7%) | 171,210 (74.3%) |
| Total (Category) | 149,222 (35.8%) | 267,791 (64.2%) |
| Total (Overall) | 1,063,650 (52.5%) | 961,746 (47.5%) |
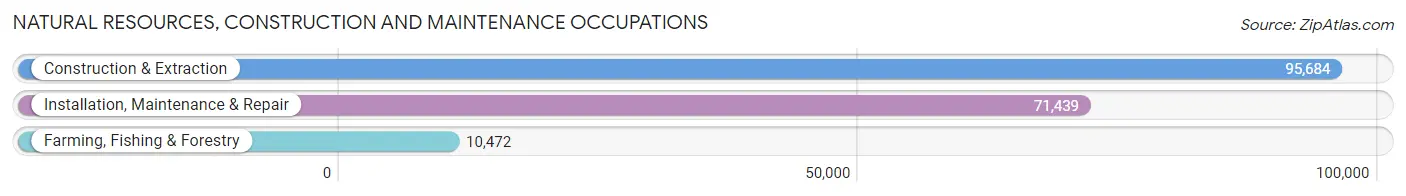
Natural Resources, Construction and Maintenance Occupations
The most common Natural Resources, Construction and Maintenance occupations in Kentucky are Construction & Extraction (95,684 | 4.7%), Installation, Maintenance & Repair (71,439 | 3.5%), and Farming, Fishing & Forestry (10,472 | 0.5%).
Natural Resources, Construction and Maintenance Occupations by Sex
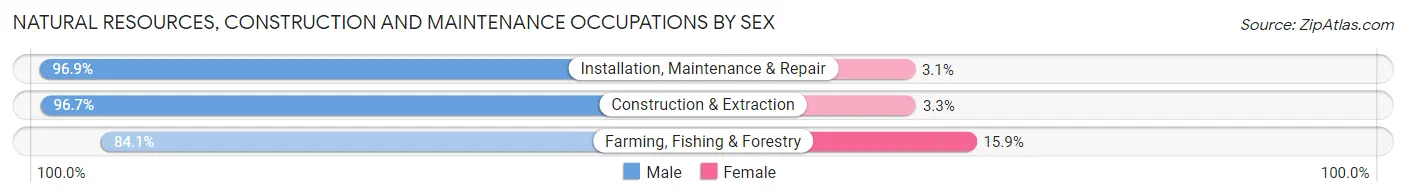
| Occupation | Male | Female |
| Farming, Fishing & Forestry | 8,804 (84.1%) | 1,668 (15.9%) |
| Construction & Extraction | 92,484 (96.7%) | 3,200 (3.3%) |
| Installation, Maintenance & Repair | 69,206 (96.9%) | 2,233 (3.1%) |
| Total (Category) | 170,494 (96.0%) | 7,101 (4.0%) |
| Total (Overall) | 1,063,650 (52.5%) | 961,746 (47.5%) |
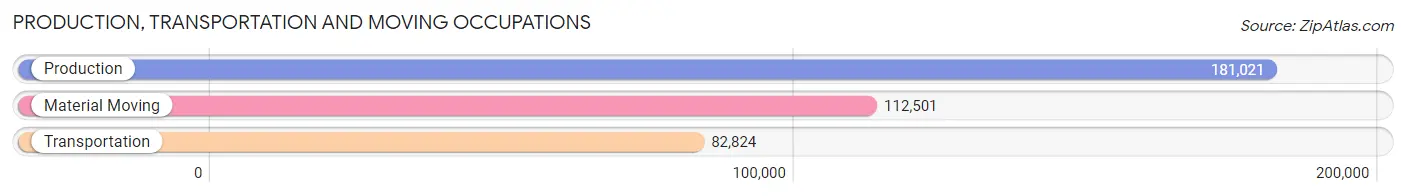
Production, Transportation and Moving Occupations
The most common Production, Transportation and Moving occupations in Kentucky are Production (181,021 | 8.9%), Material Moving (112,501 | 5.6%), and Transportation (82,824 | 4.1%).
Production, Transportation and Moving Occupations by Sex
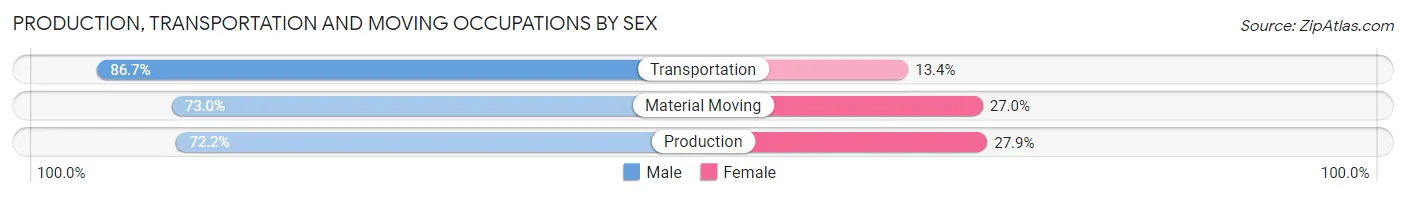
| Occupation | Male | Female |
| Production | 130,611 (72.2%) | 50,410 (27.9%) |
| Transportation | 71,769 (86.7%) | 11,055 (13.4%) |
| Material Moving | 82,102 (73.0%) | 30,399 (27.0%) |
| Total (Category) | 284,482 (75.6%) | 91,864 (24.4%) |
| Total (Overall) | 1,063,650 (52.5%) | 961,746 (47.5%) |
Employment Industries by Sex in Kentucky
Employment Industries in Kentucky
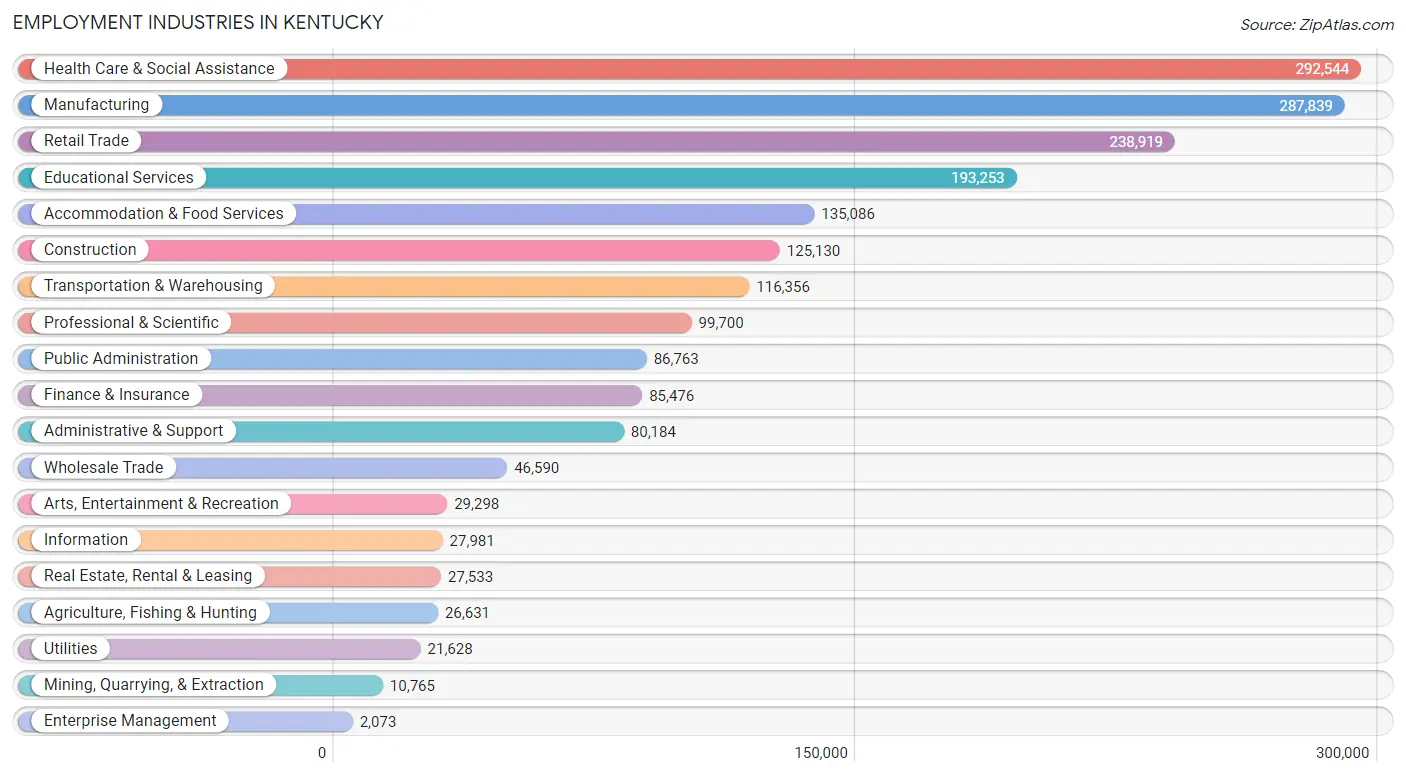
The major employment industries in Kentucky include Health Care & Social Assistance (292,544 | 14.4%), Manufacturing (287,839 | 14.2%), Retail Trade (238,919 | 11.8%), Educational Services (193,253 | 9.5%), and Accommodation & Food Services (135,086 | 6.7%).
Employment Industries by Sex in Kentucky
The Kentucky industries that see more men than women are Mining, Quarrying, & Extraction (95.1%), Construction (90.4%), and Agriculture, Fishing & Hunting (80.4%), whereas the industries that tend to have a higher number of women are Health Care & Social Assistance (80.5%), Educational Services (69.1%), and Finance & Insurance (60.3%).
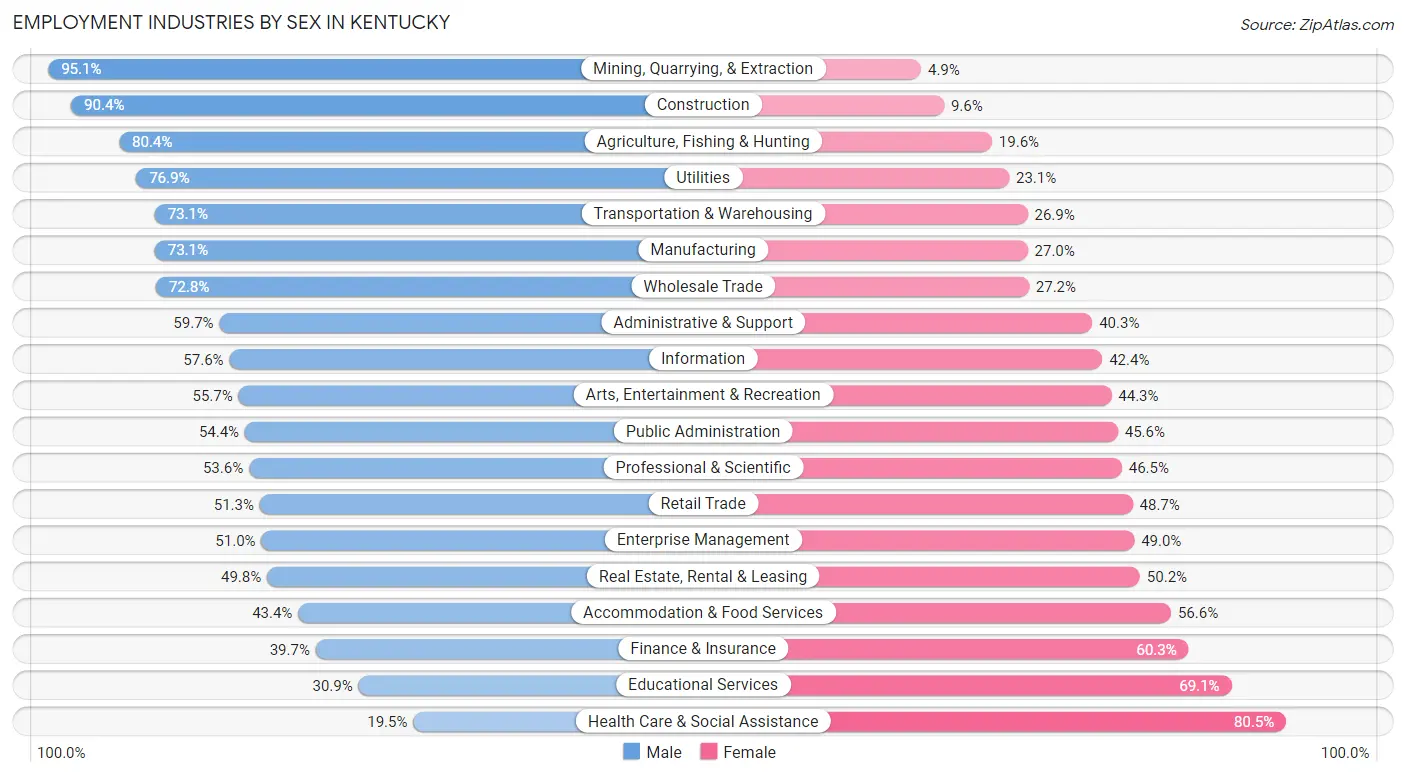
| Industry | Male | Female |
| Agriculture, Fishing & Hunting | 21,423 (80.4%) | 5,208 (19.6%) |
| Mining, Quarrying, & Extraction | 10,239 (95.1%) | 526 (4.9%) |
| Construction | 113,071 (90.4%) | 12,059 (9.6%) |
| Manufacturing | 210,262 (73.1%) | 77,577 (27.0%) |
| Wholesale Trade | 33,919 (72.8%) | 12,671 (27.2%) |
| Retail Trade | 122,623 (51.3%) | 116,296 (48.7%) |
| Transportation & Warehousing | 85,004 (73.1%) | 31,352 (26.9%) |
| Utilities | 16,630 (76.9%) | 4,998 (23.1%) |
| Information | 16,119 (57.6%) | 11,862 (42.4%) |
| Finance & Insurance | 33,969 (39.7%) | 51,507 (60.3%) |
| Real Estate, Rental & Leasing | 13,713 (49.8%) | 13,820 (50.2%) |
| Professional & Scientific | 53,385 (53.5%) | 46,315 (46.5%) |
| Enterprise Management | 1,057 (51.0%) | 1,016 (49.0%) |
| Administrative & Support | 47,854 (59.7%) | 32,330 (40.3%) |
| Educational Services | 59,655 (30.9%) | 133,598 (69.1%) |
| Health Care & Social Assistance | 57,174 (19.5%) | 235,370 (80.5%) |
| Arts, Entertainment & Recreation | 16,326 (55.7%) | 12,972 (44.3%) |
| Accommodation & Food Services | 58,585 (43.4%) | 76,501 (56.6%) |
| Public Administration | 47,190 (54.4%) | 39,573 (45.6%) |
| Total | 1,063,650 (52.5%) | 961,746 (47.5%) |
Education in Kentucky
School Enrollment in Kentucky
The most common levels of schooling among the 1,034,612 students in Kentucky are middle school (229,364 | 22.2%), high school (225,066 | 21.7%), and elementary school (215,715 | 20.8%).
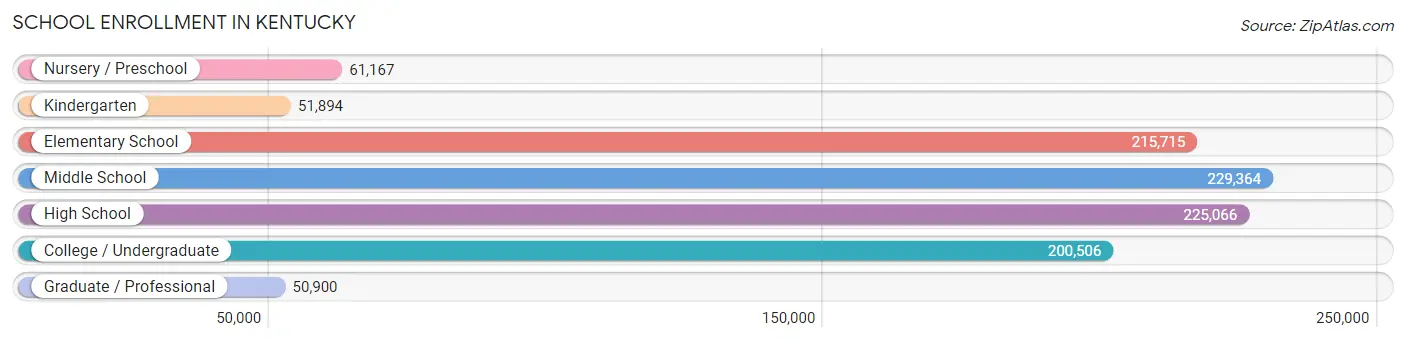
| School Level | # Students | % Students |
| Nursery / Preschool | 61,167 | 5.9% |
| Kindergarten | 51,894 | 5.0% |
| Elementary School | 215,715 | 20.8% |
| Middle School | 229,364 | 22.2% |
| High School | 225,066 | 21.7% |
| College / Undergraduate | 200,506 | 19.4% |
| Graduate / Professional | 50,900 | 4.9% |
| Total | 1,034,612 | 100.0% |
School Enrollment by Age by Funding Source in Kentucky
Out of a total of 1,034,612 students who are enrolled in schools in Kentucky, 174,849 (16.9%) attend a private institution, while the remaining 859,763 (83.1%) are enrolled in public schools. The age group of 3 to 4 year olds has the highest likelihood of being enrolled in private schools, with 16,607 (38.7% in the age bracket) enrolled. Conversely, the age group of 15 to 17 year olds has the lowest likelihood of being enrolled in a private school, with 145,580 (86.7% in the age bracket) attending a public institution.
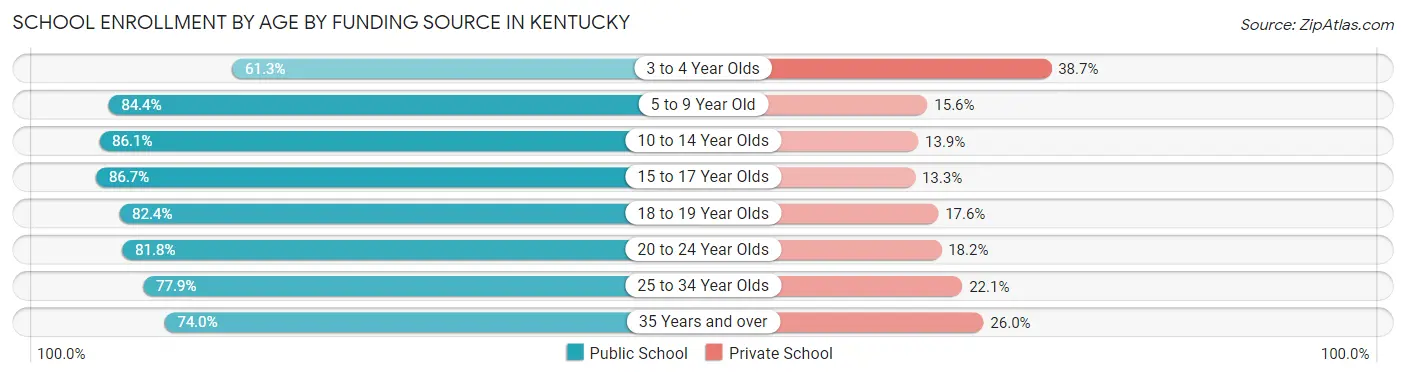
| Age Bracket | Public School | Private School |
| 3 to 4 Year Olds | 26,352 (61.3%) | 16,607 (38.7%) |
| 5 to 9 Year Old | 216,867 (84.4%) | 40,051 (15.6%) |
| 10 to 14 Year Olds | 243,204 (86.1%) | 39,163 (13.9%) |
| 15 to 17 Year Olds | 145,580 (86.7%) | 22,294 (13.3%) |
| 18 to 19 Year Olds | 65,763 (82.4%) | 14,057 (17.6%) |
| 20 to 24 Year Olds | 85,140 (81.8%) | 18,899 (18.2%) |
| 25 to 34 Year Olds | 43,988 (77.9%) | 12,464 (22.1%) |
| 35 Years and over | 32,680 (74.0%) | 11,503 (26.0%) |
| Total | 859,763 (83.1%) | 174,849 (16.9%) |
Educational Attainment by Field of Study in Kentucky
Business (164,321 | 18.7%), education (131,505 | 15.0%), science & technology (104,127 | 11.8%), arts & humanities (65,959 | 7.5%), and bio, nature & agricultural (57,802 | 6.6%) are the most common fields of study among 878,655 individuals in Kentucky who have obtained a bachelor's degree or higher.
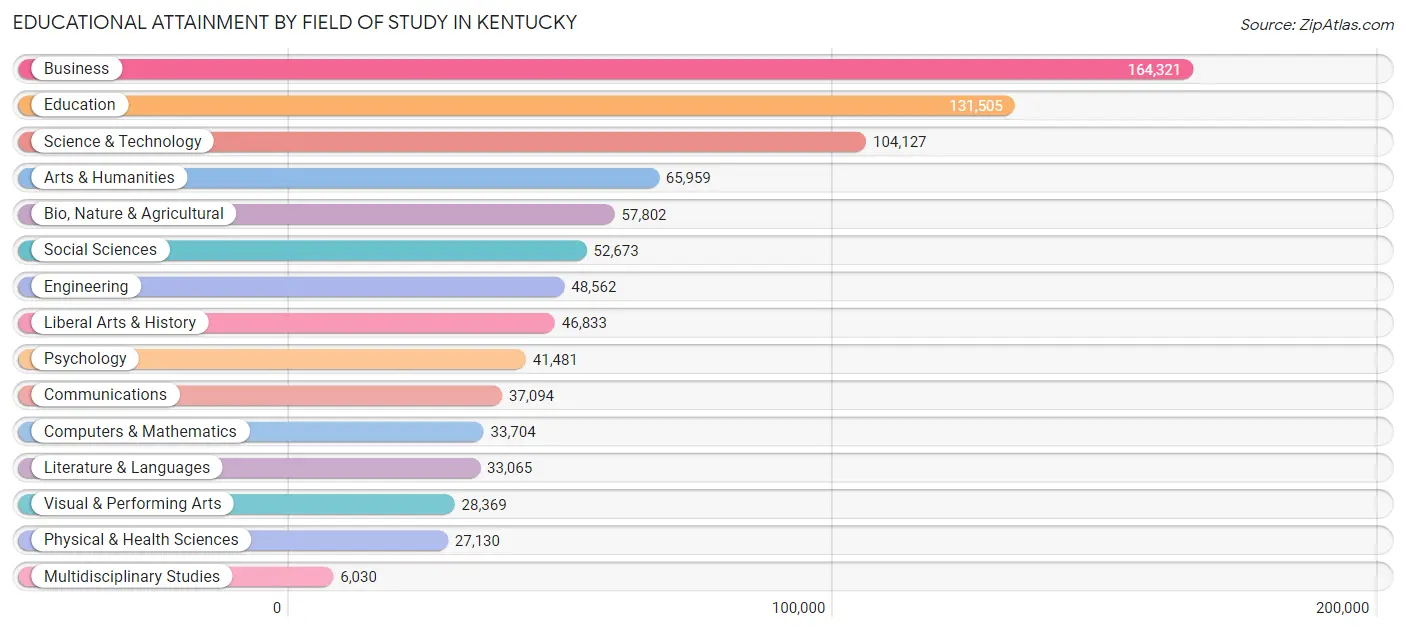
| Field of Study | # Graduates | % Graduates |
| Computers & Mathematics | 33,704 | 3.8% |
| Bio, Nature & Agricultural | 57,802 | 6.6% |
| Physical & Health Sciences | 27,130 | 3.1% |
| Psychology | 41,481 | 4.7% |
| Social Sciences | 52,673 | 6.0% |
| Engineering | 48,562 | 5.5% |
| Multidisciplinary Studies | 6,030 | 0.7% |
| Science & Technology | 104,127 | 11.8% |
| Business | 164,321 | 18.7% |
| Education | 131,505 | 15.0% |
| Literature & Languages | 33,065 | 3.8% |
| Liberal Arts & History | 46,833 | 5.3% |
| Visual & Performing Arts | 28,369 | 3.2% |
| Communications | 37,094 | 4.2% |
| Arts & Humanities | 65,959 | 7.5% |
| Total | 878,655 | 100.0% |
Transportation & Commute in Kentucky
Vehicle Availability by Sex in Kentucky
The most prevalent vehicle ownership categories in Kentucky are males with 2 vehicles (443,832, accounting for 42.5%) and females with 2 vehicles (377,716, making up 47.8%).
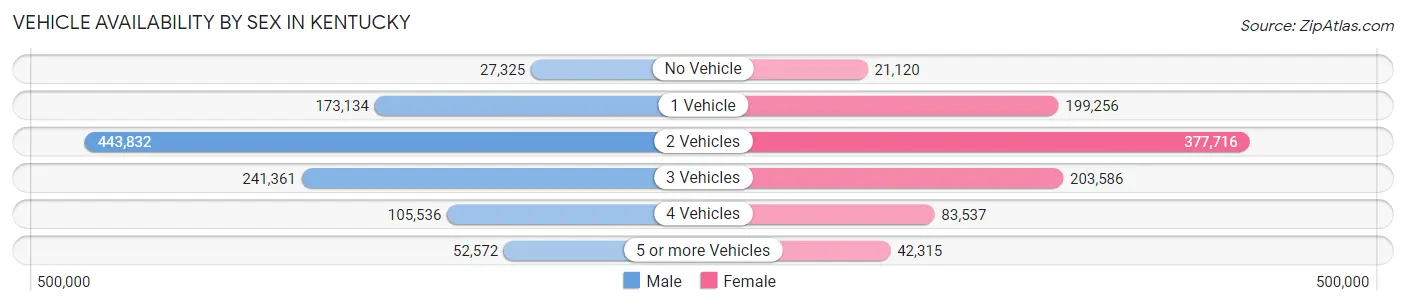
| Vehicles Available | Male | Female |
| No Vehicle | 27,325 (2.6%) | 21,120 (2.3%) |
| 1 Vehicle | 173,134 (16.6%) | 199,256 (21.5%) |
| 2 Vehicles | 443,832 (42.5%) | 377,716 (40.7%) |
| 3 Vehicles | 241,361 (23.1%) | 203,586 (22.0%) |
| 4 Vehicles | 105,536 (10.1%) | 83,537 (9.0%) |
| 5 or more Vehicles | 52,572 (5.0%) | 42,315 (4.6%) |
| Total | 1,043,760 (100.0%) | 927,530 (100.0%) |
Commute Time in Kentucky
The most frequently occuring commute durations in Kentucky are 15 to 19 minutes (309,051 commuters, 16.8%), 20 to 24 minutes (284,021 commuters, 15.5%), and 10 to 14 minutes (282,997 commuters, 15.4%).
| Commute Time | # Commuters | % Commuters |
| Less than 5 Minutes | 63,798 | 3.5% |
| 5 to 9 Minutes | 209,410 | 11.4% |
| 10 to 14 Minutes | 282,997 | 15.4% |
| 15 to 19 Minutes | 309,051 | 16.8% |
| 20 to 24 Minutes | 284,021 | 15.5% |
| 25 to 29 Minutes | 126,911 | 6.9% |
| 30 to 34 Minutes | 219,526 | 12.0% |
| 35 to 39 Minutes | 54,702 | 3.0% |
| 40 to 44 Minutes | 56,158 | 3.1% |
| 45 to 59 Minutes | 115,606 | 6.3% |
| 60 to 89 Minutes | 70,896 | 3.9% |
| 90 or more Minutes | 42,227 | 2.3% |
Commute Time by Sex in Kentucky
The most common commute times in Kentucky are 15 to 19 minutes (157,782 commuters, 16.1%) for males and 15 to 19 minutes (151,269 commuters, 17.7%) for females.
| Commute Time | Male | Female |
| Less than 5 Minutes | 33,633 (3.4%) | 30,165 (3.5%) |
| 5 to 9 Minutes | 104,191 (10.6%) | 105,219 (12.3%) |
| 10 to 14 Minutes | 139,845 (14.2%) | 143,152 (16.8%) |
| 15 to 19 Minutes | 157,782 (16.1%) | 151,269 (17.7%) |
| 20 to 24 Minutes | 150,681 (15.3%) | 133,340 (15.6%) |
| 25 to 29 Minutes | 67,630 (6.9%) | 59,281 (6.9%) |
| 30 to 34 Minutes | 121,737 (12.4%) | 97,789 (11.5%) |
| 35 to 39 Minutes | 30,296 (3.1%) | 24,406 (2.9%) |
| 40 to 44 Minutes | 31,594 (3.2%) | 24,564 (2.9%) |
| 45 to 59 Minutes | 68,133 (6.9%) | 47,473 (5.6%) |
| 60 to 89 Minutes | 46,097 (4.7%) | 24,799 (2.9%) |
| 90 or more Minutes | 30,030 (3.1%) | 12,197 (1.4%) |
Time of Departure to Work by Sex in Kentucky
The most frequent times of departure to work in Kentucky are 7:00 AM to 7:29 AM (135,704, 13.8%) for males and 7:00 AM to 7:29 AM (141,010, 16.5%) for females.
| Time of Departure | Male | Female |
| 12:00 AM to 4:59 AM | 71,073 (7.2%) | 33,079 (3.9%) |
| 5:00 AM to 5:29 AM | 51,700 (5.3%) | 22,729 (2.7%) |
| 5:30 AM to 5:59 AM | 62,921 (6.4%) | 33,036 (3.9%) |
| 6:00 AM to 6:29 AM | 97,060 (9.9%) | 62,719 (7.3%) |
| 6:30 AM to 6:59 AM | 102,082 (10.4%) | 84,706 (9.9%) |
| 7:00 AM to 7:29 AM | 135,704 (13.8%) | 141,010 (16.5%) |
| 7:30 AM to 7:59 AM | 101,800 (10.4%) | 125,820 (14.7%) |
| 8:00 AM to 8:29 AM | 83,720 (8.5%) | 87,817 (10.3%) |
| 8:30 AM to 8:59 AM | 36,022 (3.7%) | 46,204 (5.4%) |
| 9:00 AM to 9:59 AM | 41,363 (4.2%) | 50,103 (5.9%) |
| 10:00 AM to 10:59 AM | 21,699 (2.2%) | 25,222 (2.9%) |
| 11:00 AM to 11:59 AM | 12,031 (1.2%) | 11,049 (1.3%) |
| 12:00 PM to 3:59 PM | 73,883 (7.5%) | 61,016 (7.1%) |
| 4:00 PM to 11:59 PM | 90,591 (9.2%) | 69,144 (8.1%) |
| Total | 981,649 (100.0%) | 853,654 (100.0%) |
Housing Occupancy in Kentucky
Occupancy by Ownership in Kentucky
Of the total 1,769,102 dwellings in Kentucky, owner-occupied units account for 1,205,067 (68.1%), while renter-occupied units make up 564,035 (31.9%).
| Occupancy | # Housing Units | % Housing Units |
| Owner Occupied Housing Units | 1,205,067 | 68.1% |
| Renter-Occupied Housing Units | 564,035 | 31.9% |
| Total Occupied Housing Units | 1,769,102 | 100.0% |
Occupancy by Household Size in Kentucky
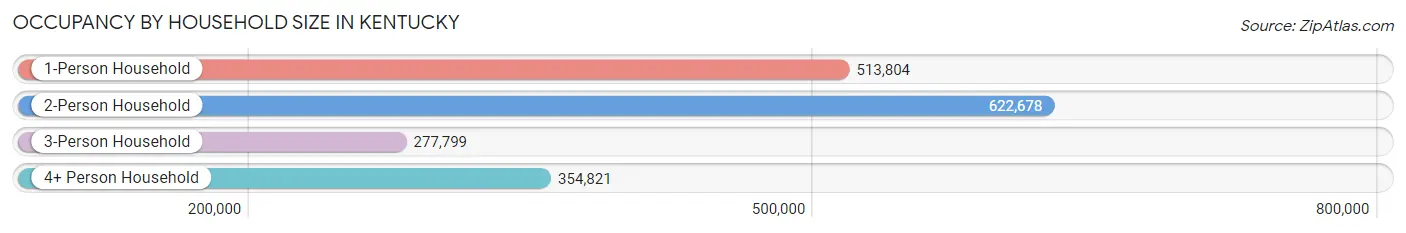
| Household Size | # Housing Units | % Housing Units |
| 1-Person Household | 513,804 | 29.0% |
| 2-Person Household | 622,678 | 35.2% |
| 3-Person Household | 277,799 | 15.7% |
| 4+ Person Household | 354,821 | 20.1% |
| Total Housing Units | 1,769,102 | 100.0% |
Occupancy by Ownership by Household Size in Kentucky
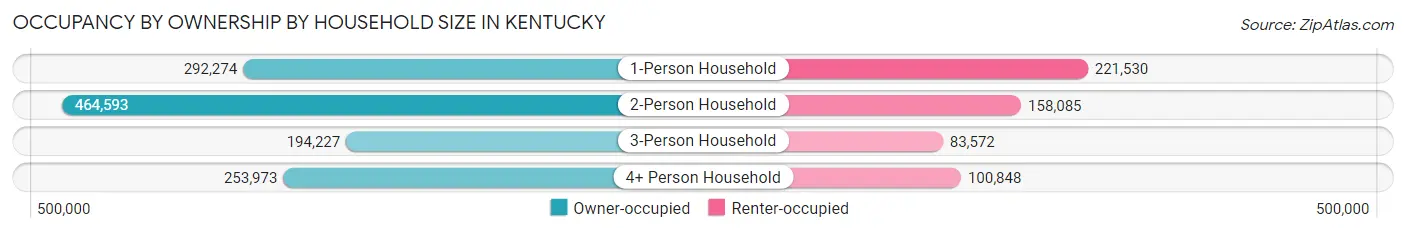
| Household Size | Owner-occupied | Renter-occupied |
| 1-Person Household | 292,274 (56.9%) | 221,530 (43.1%) |
| 2-Person Household | 464,593 (74.6%) | 158,085 (25.4%) |
| 3-Person Household | 194,227 (69.9%) | 83,572 (30.1%) |
| 4+ Person Household | 253,973 (71.6%) | 100,848 (28.4%) |
| Total Housing Units | 1,205,067 (68.1%) | 564,035 (31.9%) |
Occupancy by Educational Attainment in Kentucky
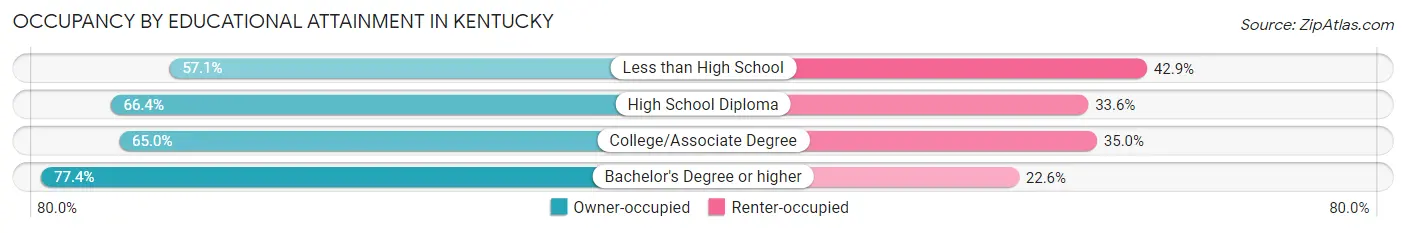
| Household Size | Owner-occupied | Renter-occupied |
| Less than High School | 105,855 (57.1%) | 79,650 (42.9%) |
| High School Diploma | 352,968 (66.4%) | 178,867 (33.6%) |
| College/Associate Degree | 354,706 (65.0%) | 191,026 (35.0%) |
| Bachelor's Degree or higher | 391,538 (77.4%) | 114,492 (22.6%) |
Occupancy by Age of Householder in Kentucky
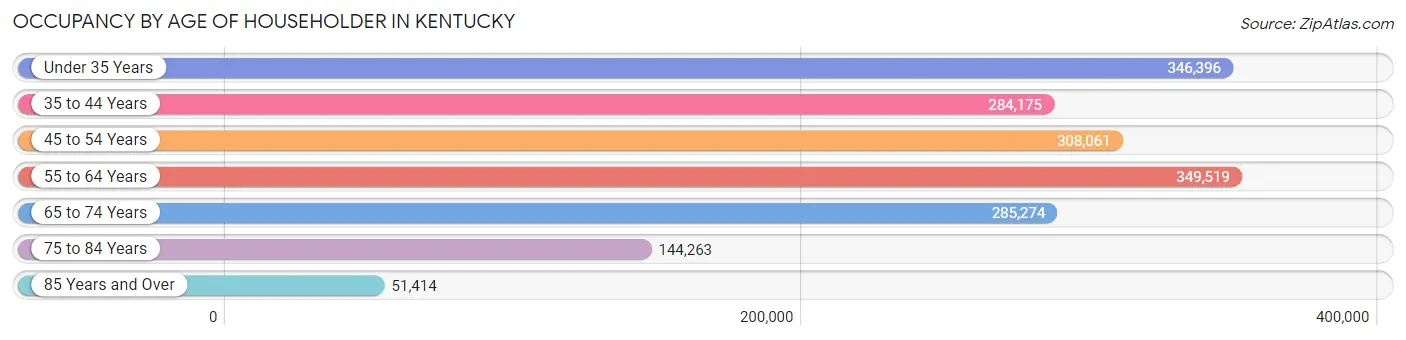
| Age Bracket | # Households | % Households |
| Under 35 Years | 346,396 | 19.6% |
| 35 to 44 Years | 284,175 | 16.1% |
| 45 to 54 Years | 308,061 | 17.4% |
| 55 to 64 Years | 349,519 | 19.8% |
| 65 to 74 Years | 285,274 | 16.1% |
| 75 to 84 Years | 144,263 | 8.2% |
| 85 Years and Over | 51,414 | 2.9% |
| Total | 1,769,102 | 100.0% |
Housing Finances in Kentucky
Median Income by Occupancy in Kentucky
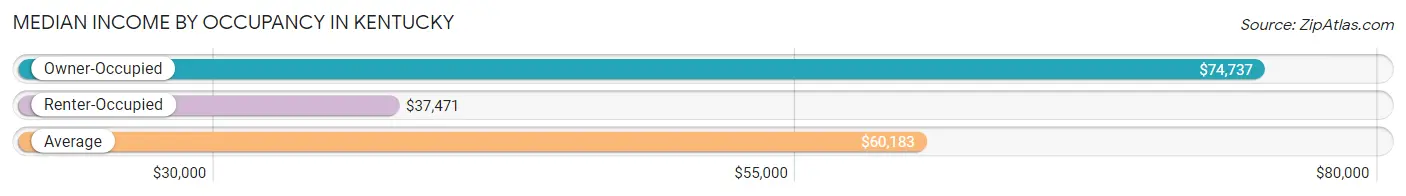
| Occupancy Type | # Households | Median Income |
| Owner-Occupied | 1,205,067 (68.1%) | $74,737 |
| Renter-Occupied | 564,035 (31.9%) | $37,471 |
| Average | 1,769,102 (100.0%) | $60,183 |
Occupancy by Householder Income Bracket in Kentucky
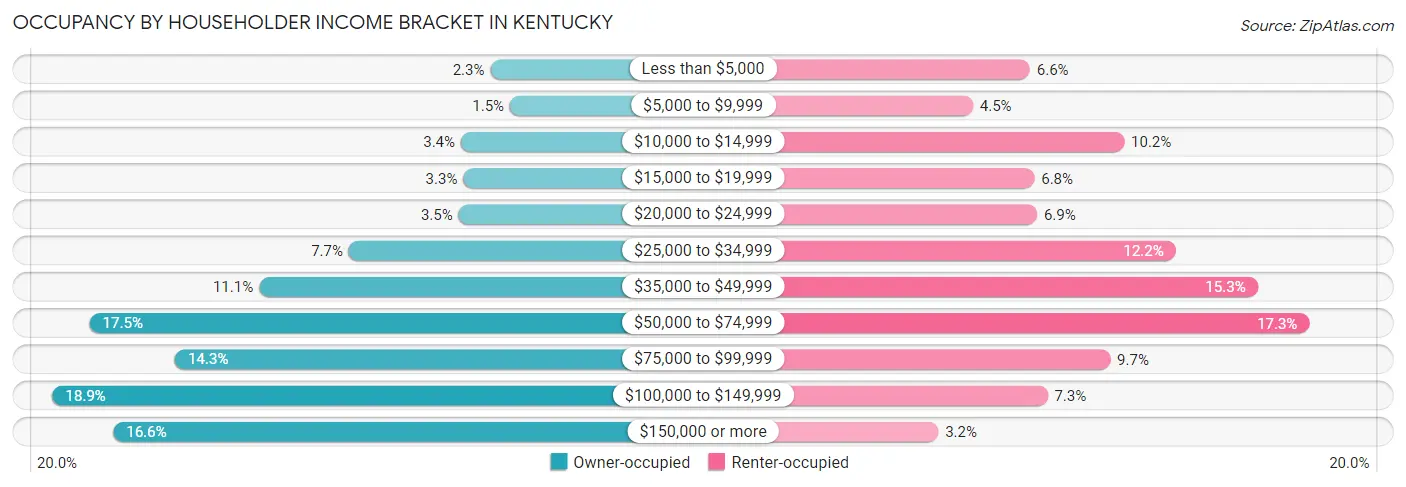
| Income Bracket | Owner-occupied | Renter-occupied |
| Less than $5,000 | 27,289 (2.3%) | 37,475 (6.6%) |
| $5,000 to $9,999 | 18,166 (1.5%) | 25,195 (4.5%) |
| $10,000 to $14,999 | 40,785 (3.4%) | 57,678 (10.2%) |
| $15,000 to $19,999 | 39,645 (3.3%) | 38,437 (6.8%) |
| $20,000 to $24,999 | 41,867 (3.5%) | 38,978 (6.9%) |
| $25,000 to $34,999 | 92,179 (7.6%) | 68,758 (12.2%) |
| $35,000 to $49,999 | 133,461 (11.1%) | 86,351 (15.3%) |
| $50,000 to $74,999 | 211,134 (17.5%) | 97,452 (17.3%) |
| $75,000 to $99,999 | 172,011 (14.3%) | 54,688 (9.7%) |
| $100,000 to $149,999 | 228,253 (18.9%) | 41,247 (7.3%) |
| $150,000 or more | 200,277 (16.6%) | 17,776 (3.2%) |
| Total | 1,205,067 (100.0%) | 564,035 (100.0%) |
Monthly Housing Cost Tiers in Kentucky
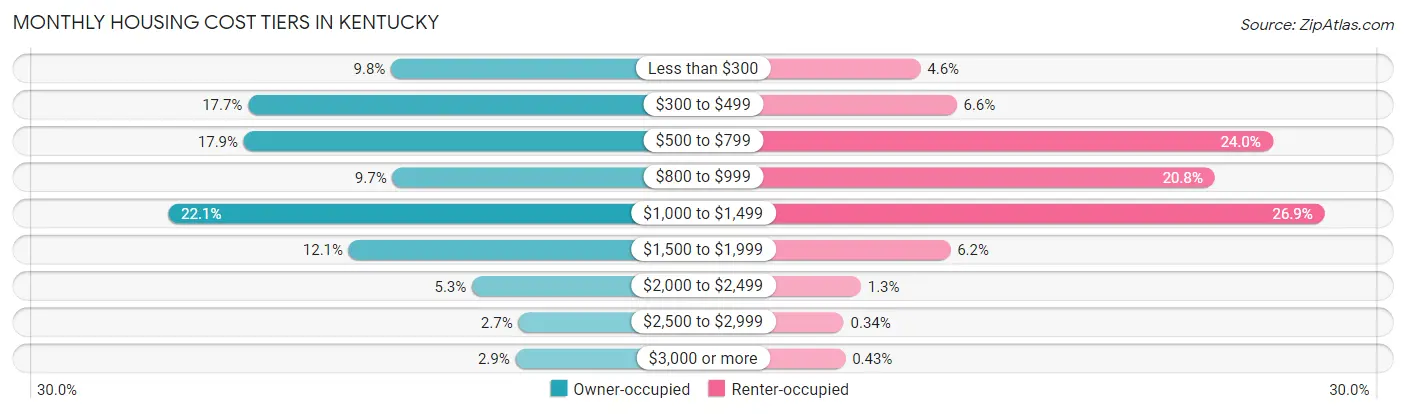
| Monthly Cost | Owner-occupied | Renter-occupied |
| Less than $300 | 117,463 (9.8%) | 25,843 (4.6%) |
| $300 to $499 | 212,749 (17.6%) | 37,141 (6.6%) |
| $500 to $799 | 215,583 (17.9%) | 135,569 (24.0%) |
| $800 to $999 | 116,642 (9.7%) | 117,518 (20.8%) |
| $1,000 to $1,499 | 265,911 (22.1%) | 151,765 (26.9%) |
| $1,500 to $1,999 | 145,657 (12.1%) | 35,139 (6.2%) |
| $2,000 to $2,499 | 63,650 (5.3%) | 7,266 (1.3%) |
| $2,500 to $2,999 | 32,766 (2.7%) | 1,892 (0.3%) |
| $3,000 or more | 34,646 (2.9%) | 2,445 (0.4%) |
| Total | 1,205,067 (100.0%) | 564,035 (100.0%) |
Physical Housing Characteristics in Kentucky
Housing Structures in Kentucky
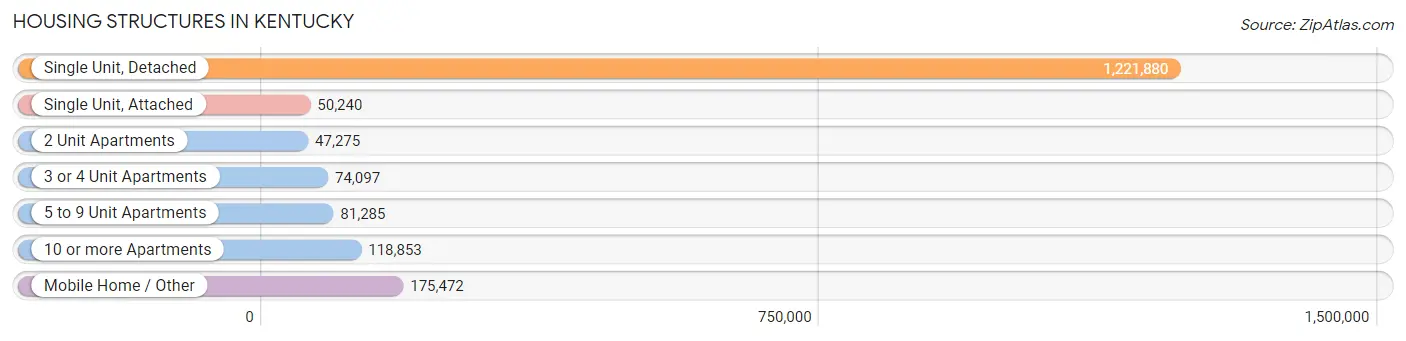
| Structure Type | # Housing Units | % Housing Units |
| Single Unit, Detached | 1,221,880 | 69.1% |
| Single Unit, Attached | 50,240 | 2.8% |
| 2 Unit Apartments | 47,275 | 2.7% |
| 3 or 4 Unit Apartments | 74,097 | 4.2% |
| 5 to 9 Unit Apartments | 81,285 | 4.6% |
| 10 or more Apartments | 118,853 | 6.7% |
| Mobile Home / Other | 175,472 | 9.9% |
| Total | 1,769,102 | 100.0% |
Housing Structures by Occupancy in Kentucky
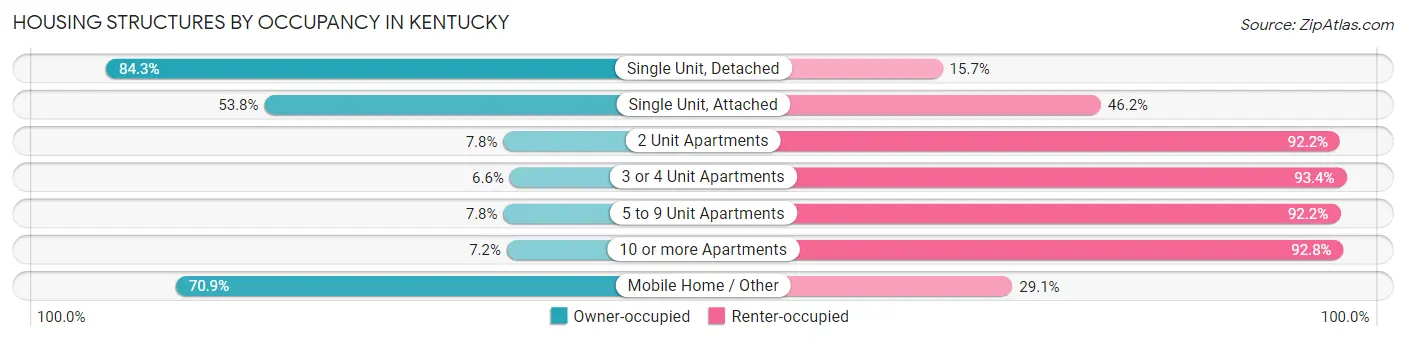
| Structure Type | Owner-occupied | Renter-occupied |
| Single Unit, Detached | 1,030,189 (84.3%) | 191,691 (15.7%) |
| Single Unit, Attached | 27,051 (53.8%) | 23,189 (46.2%) |
| 2 Unit Apartments | 3,700 (7.8%) | 43,575 (92.2%) |
| 3 or 4 Unit Apartments | 4,881 (6.6%) | 69,216 (93.4%) |
| 5 to 9 Unit Apartments | 6,358 (7.8%) | 74,927 (92.2%) |
| 10 or more Apartments | 8,515 (7.2%) | 110,338 (92.8%) |
| Mobile Home / Other | 124,373 (70.9%) | 51,099 (29.1%) |
| Total | 1,205,067 (68.1%) | 564,035 (31.9%) |
Housing Structures by Number of Rooms in Kentucky
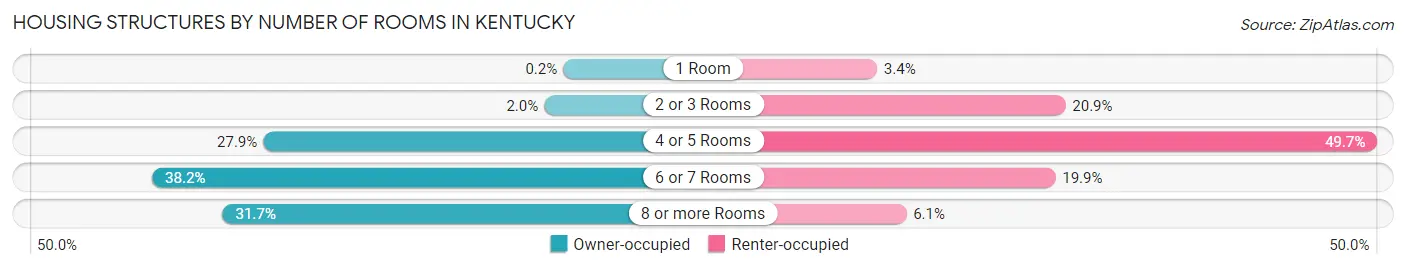
| Number of Rooms | Owner-occupied | Renter-occupied |
| 1 Room | 2,440 (0.2%) | 19,277 (3.4%) |
| 2 or 3 Rooms | 23,613 (2.0%) | 117,621 (20.8%) |
| 4 or 5 Rooms | 336,685 (27.9%) | 280,244 (49.7%) |
| 6 or 7 Rooms | 460,395 (38.2%) | 112,344 (19.9%) |
| 8 or more Rooms | 381,934 (31.7%) | 34,549 (6.1%) |
| Total | 1,205,067 (100.0%) | 564,035 (100.0%) |
Housing Structure by Heating Type in Kentucky
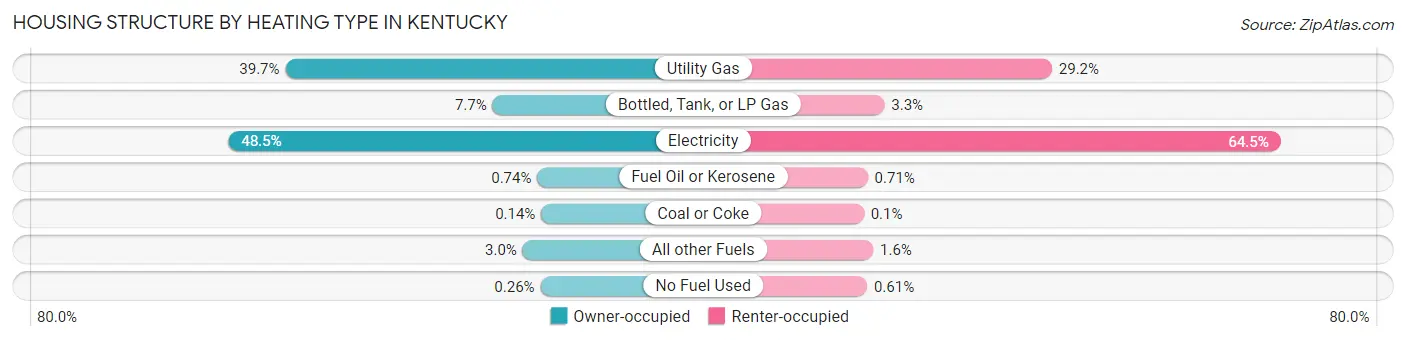
| Heating Type | Owner-occupied | Renter-occupied |
| Utility Gas | 478,324 (39.7%) | 164,621 (29.2%) |
| Bottled, Tank, or LP Gas | 92,315 (7.7%) | 18,636 (3.3%) |
| Electricity | 584,458 (48.5%) | 363,989 (64.5%) |
| Fuel Oil or Kerosene | 8,876 (0.7%) | 4,018 (0.7%) |
| Coal or Coke | 1,717 (0.1%) | 569 (0.1%) |
| All other Fuels | 36,194 (3.0%) | 8,766 (1.5%) |
| No Fuel Used | 3,183 (0.3%) | 3,436 (0.6%) |
| Total | 1,205,067 (100.0%) | 564,035 (100.0%) |
Household Vehicle Usage in Kentucky
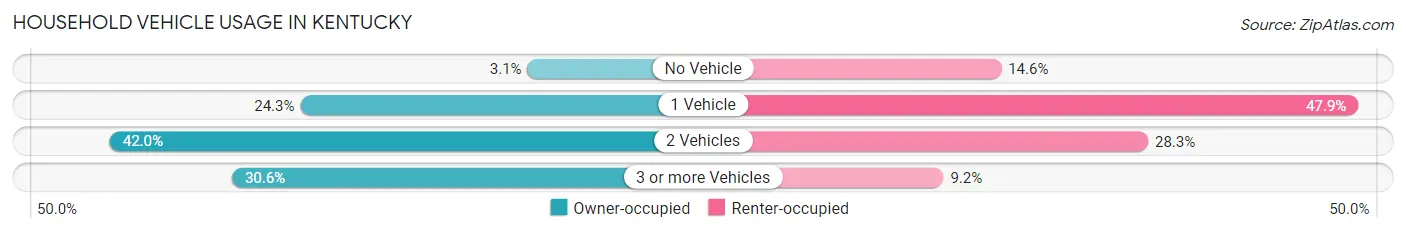
| Vehicles per Household | Owner-occupied | Renter-occupied |
| No Vehicle | 36,864 (3.1%) | 82,319 (14.6%) |
| 1 Vehicle | 292,380 (24.3%) | 270,227 (47.9%) |
| 2 Vehicles | 506,620 (42.0%) | 159,602 (28.3%) |
| 3 or more Vehicles | 369,203 (30.6%) | 51,887 (9.2%) |
| Total | 1,205,067 (100.0%) | 564,035 (100.0%) |
Real Estate & Mortgages in Kentucky
Real Estate and Mortgage Overview in Kentucky
| Characteristic | Without Mortgage | With Mortgage |
| Housing Units | 519,113 | 685,954 |
| Median Property Value | $145,500 | $198,000 |
| Median Household Income | $52,856 | $145,763 |
| Monthly Housing Costs | $440 | $33,790 |
| Real Estate Taxes | $1,094 | $22,769 |
Property Value by Mortgage Status in Kentucky
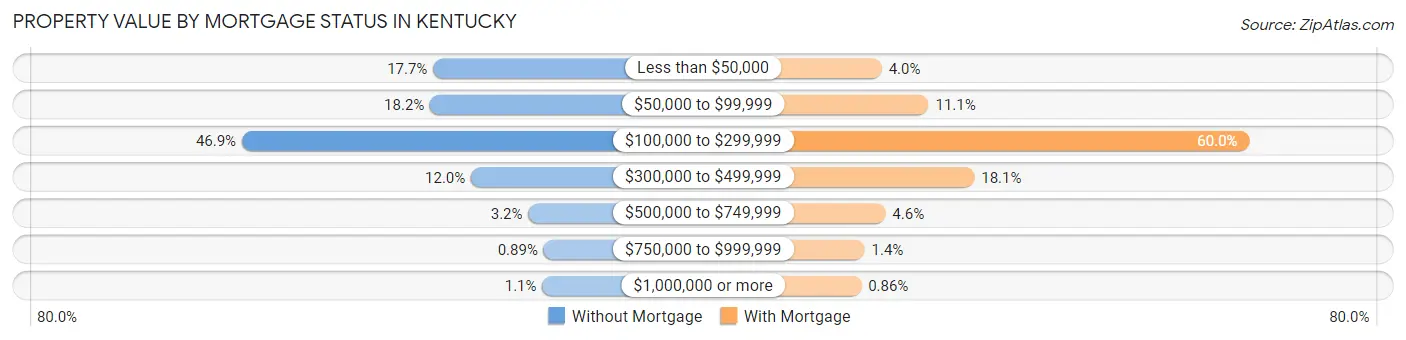
| Property Value | Without Mortgage | With Mortgage |
| Less than $50,000 | 92,065 (17.7%) | 27,341 (4.0%) |
| $50,000 to $99,999 | 94,457 (18.2%) | 76,269 (11.1%) |
| $100,000 to $299,999 | 243,384 (46.9%) | 411,619 (60.0%) |
| $300,000 to $499,999 | 62,074 (12.0%) | 124,108 (18.1%) |
| $500,000 to $749,999 | 16,815 (3.2%) | 31,207 (4.5%) |
| $750,000 to $999,999 | 4,606 (0.9%) | 9,486 (1.4%) |
| $1,000,000 or more | 5,712 (1.1%) | 5,924 (0.9%) |
| Total | 519,113 (100.0%) | 685,954 (100.0%) |
Household Income by Mortgage Status in Kentucky
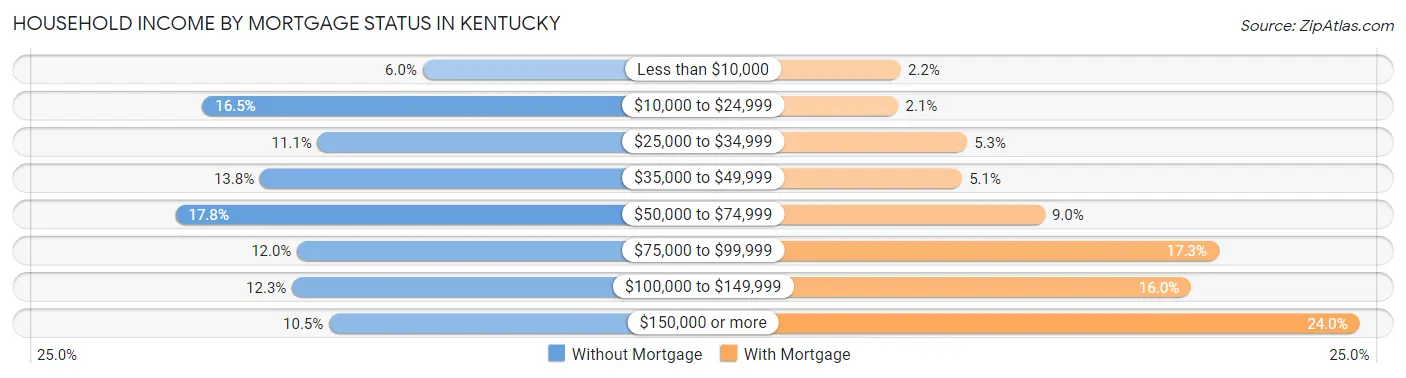
| Household Income | Without Mortgage | With Mortgage |
| Less than $10,000 | 31,360 (6.0%) | 14,901 (2.2%) |
| $10,000 to $24,999 | 85,813 (16.5%) | 14,095 (2.1%) |
| $25,000 to $34,999 | 57,344 (11.1%) | 36,484 (5.3%) |
| $35,000 to $49,999 | 71,579 (13.8%) | 34,835 (5.1%) |
| $50,000 to $74,999 | 92,469 (17.8%) | 61,882 (9.0%) |
| $75,000 to $99,999 | 62,411 (12.0%) | 118,665 (17.3%) |
| $100,000 to $149,999 | 63,623 (12.3%) | 109,600 (16.0%) |
| $150,000 or more | 54,514 (10.5%) | 164,630 (24.0%) |
| Total | 519,113 (100.0%) | 685,954 (100.0%) |
Property Value to Household Income Ratio in Kentucky
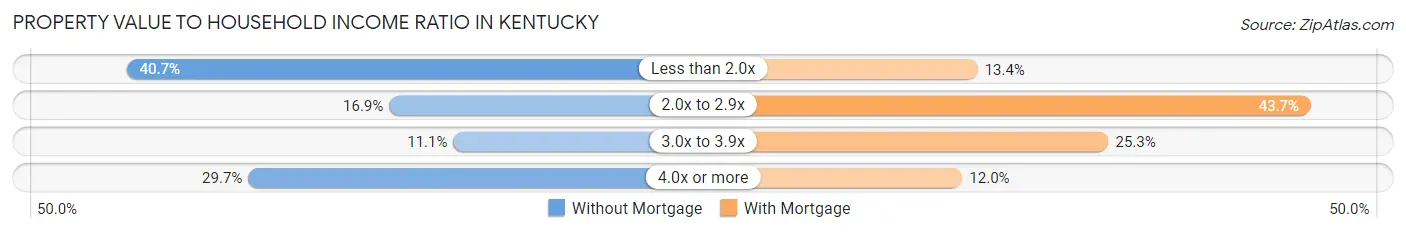
| Value-to-Income Ratio | Without Mortgage | With Mortgage |
| Less than 2.0x | 211,428 (40.7%) | 92,078 (13.4%) |
| 2.0x to 2.9x | 87,750 (16.9%) | 299,578 (43.7%) |
| 3.0x to 3.9x | 57,486 (11.1%) | 173,550 (25.3%) |
| 4.0x or more | 154,157 (29.7%) | 82,554 (12.0%) |
| Total | 519,113 (100.0%) | 685,954 (100.0%) |
Real Estate Taxes by Mortgage Status in Kentucky
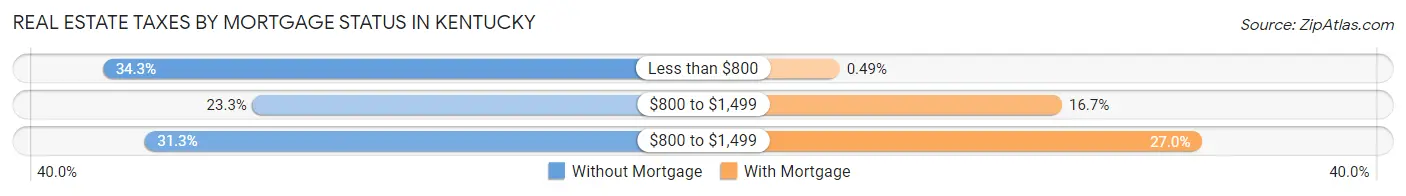
| Property Taxes | Without Mortgage | With Mortgage |
| Less than $800 | 178,016 (34.3%) | 3,331 (0.5%) |
| $800 to $1,499 | 121,141 (23.3%) | 114,778 (16.7%) |
| $800 to $1,499 | 162,244 (31.2%) | 185,003 (27.0%) |
| Total | 519,113 (100.0%) | 685,954 (100.0%) |
Health & Disability in Kentucky
Health Insurance Coverage by Age in Kentucky
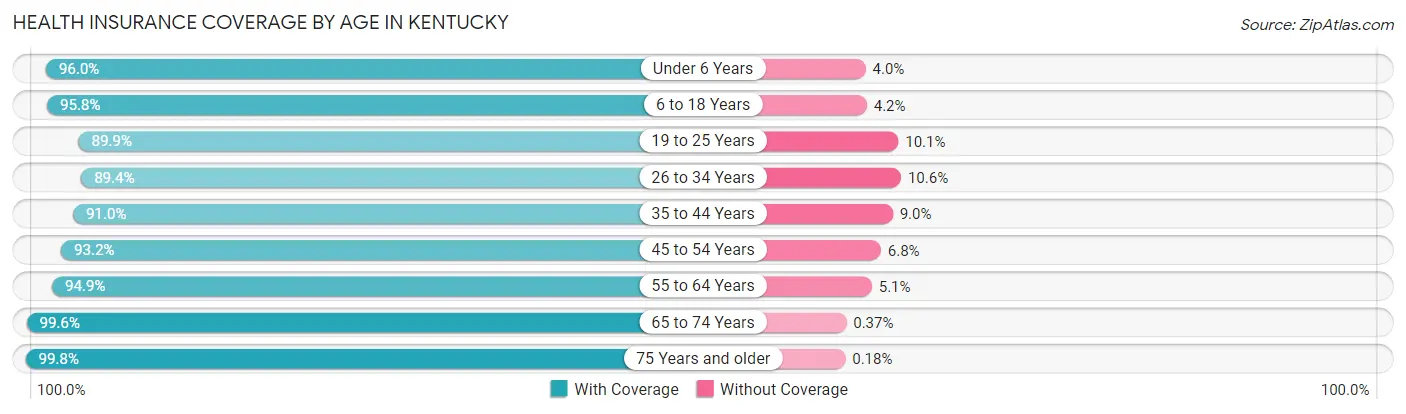
| Age Bracket | With Coverage | Without Coverage |
| Under 6 Years | 308,486 (96.0%) | 12,803 (4.0%) |
| 6 to 18 Years | 715,931 (95.8%) | 31,326 (4.2%) |
| 19 to 25 Years | 375,215 (89.9%) | 41,995 (10.1%) |
| 26 to 34 Years | 453,931 (89.4%) | 53,668 (10.6%) |
| 35 to 44 Years | 496,122 (91.0%) | 49,229 (9.0%) |
| 45 to 54 Years | 518,838 (93.2%) | 37,971 (6.8%) |
| 55 to 64 Years | 562,104 (94.9%) | 30,373 (5.1%) |
| 65 to 74 Years | 450,428 (99.6%) | 1,656 (0.4%) |
| 75 Years and older | 281,921 (99.8%) | 517 (0.2%) |
| Total | 4,162,976 (94.1%) | 259,538 (5.9%) |
Health Insurance Coverage by Citizenship Status in Kentucky
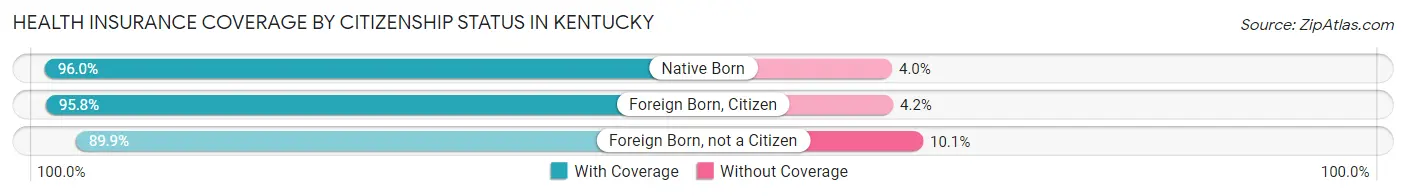
| Citizenship Status | With Coverage | Without Coverage |
| Native Born | 308,486 (96.0%) | 12,803 (4.0%) |
| Foreign Born, Citizen | 715,931 (95.8%) | 31,326 (4.2%) |
| Foreign Born, not a Citizen | 375,215 (89.9%) | 41,995 (10.1%) |
Health Insurance Coverage by Household Income in Kentucky
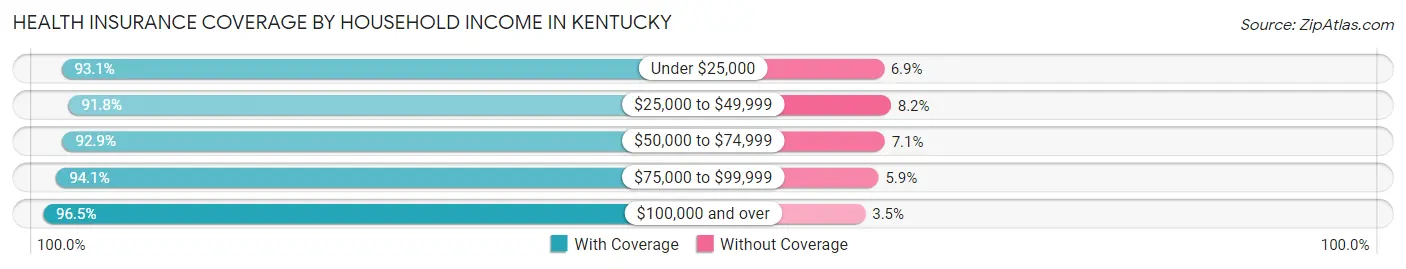
| Household Income | With Coverage | Without Coverage |
| Under $25,000 | 607,373 (93.1%) | 45,050 (6.9%) |
| $25,000 to $49,999 | 757,579 (91.8%) | 67,997 (8.2%) |
| $50,000 to $74,999 | 703,113 (92.9%) | 53,841 (7.1%) |
| $75,000 to $99,999 | 583,931 (94.1%) | 36,862 (5.9%) |
| $100,000 and over | 1,463,517 (96.5%) | 52,509 (3.5%) |
Public vs Private Health Insurance Coverage by Age in Kentucky
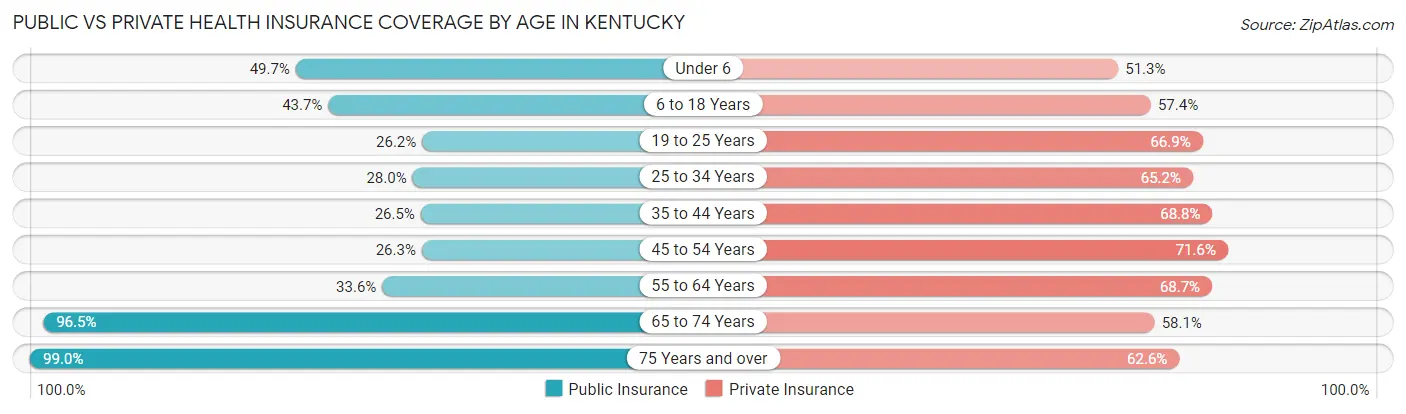
| Age Bracket | Public Insurance | Private Insurance |
| Under 6 | 159,621 (49.7%) | 164,898 (51.3%) |
| 6 to 18 Years | 326,169 (43.6%) | 428,866 (57.4%) |
| 19 to 25 Years | 109,382 (26.2%) | 279,292 (66.9%) |
| 25 to 34 Years | 142,135 (28.0%) | 330,689 (65.1%) |
| 35 to 44 Years | 144,405 (26.5%) | 374,957 (68.8%) |
| 45 to 54 Years | 146,380 (26.3%) | 398,851 (71.6%) |
| 55 to 64 Years | 199,275 (33.6%) | 407,030 (68.7%) |
| 65 to 74 Years | 436,430 (96.5%) | 262,581 (58.1%) |
| 75 Years and over | 279,516 (99.0%) | 176,833 (62.6%) |
| Total | 1,943,313 (43.9%) | 2,823,997 (63.9%) |
Disability Status by Sex by Age in Kentucky
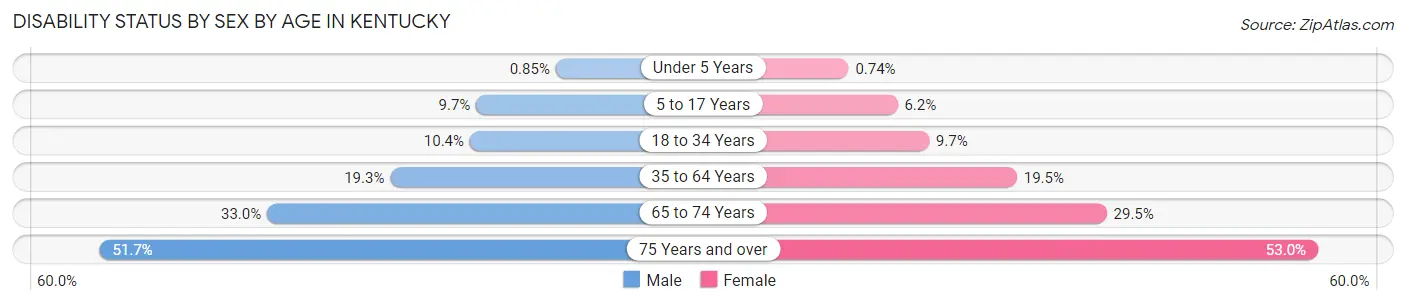
| Age Bracket | Male | Female |
| Under 5 Years | 1,170 (0.9%) | 959 (0.7%) |
| 5 to 17 Years | 37,092 (9.7%) | 22,428 (6.2%) |
| 18 to 34 Years | 51,513 (10.4%) | 47,360 (9.7%) |
| 35 to 64 Years | 160,852 (19.3%) | 167,607 (19.5%) |
| 65 to 74 Years | 70,508 (33.0%) | 70,308 (29.5%) |
| 75 Years and over | 60,300 (51.7%) | 87,869 (53.0%) |
Disability Class by Sex by Age in Kentucky
Disability Class: Hearing Difficulty
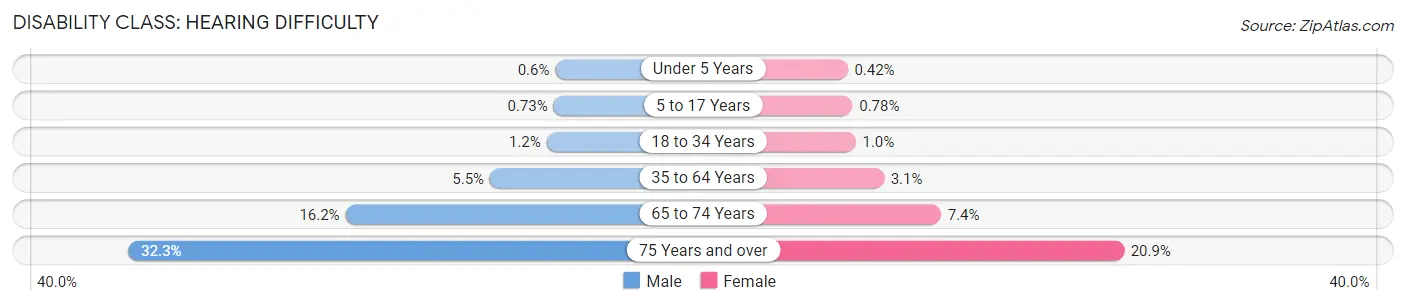
| Age Bracket | Male | Female |
| Under 5 Years | 822 (0.6%) | 549 (0.4%) |
| 5 to 17 Years | 2,778 (0.7%) | 2,836 (0.8%) |
| 18 to 34 Years | 6,123 (1.2%) | 4,975 (1.0%) |
| 35 to 64 Years | 45,510 (5.4%) | 26,718 (3.1%) |
| 65 to 74 Years | 34,564 (16.2%) | 17,532 (7.3%) |
| 75 Years and over | 37,714 (32.3%) | 34,687 (20.9%) |
Disability Class: Vision Difficulty
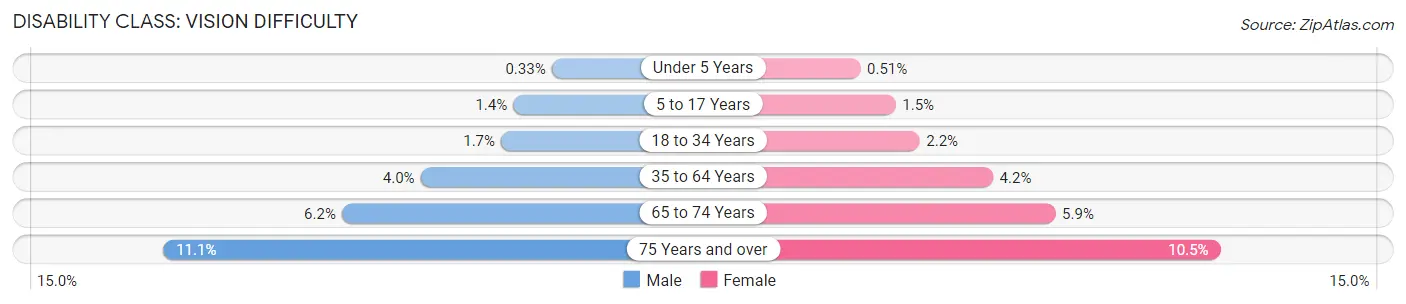
| Age Bracket | Male | Female |
| Under 5 Years | 451 (0.3%) | 661 (0.5%) |
| 5 to 17 Years | 5,357 (1.4%) | 5,376 (1.5%) |
| 18 to 34 Years | 8,586 (1.7%) | 10,565 (2.2%) |
| 35 to 64 Years | 33,191 (4.0%) | 36,111 (4.2%) |
| 65 to 74 Years | 13,193 (6.2%) | 14,163 (5.9%) |
| 75 Years and over | 13,000 (11.1%) | 17,466 (10.5%) |
Disability Class: Cognitive Difficulty
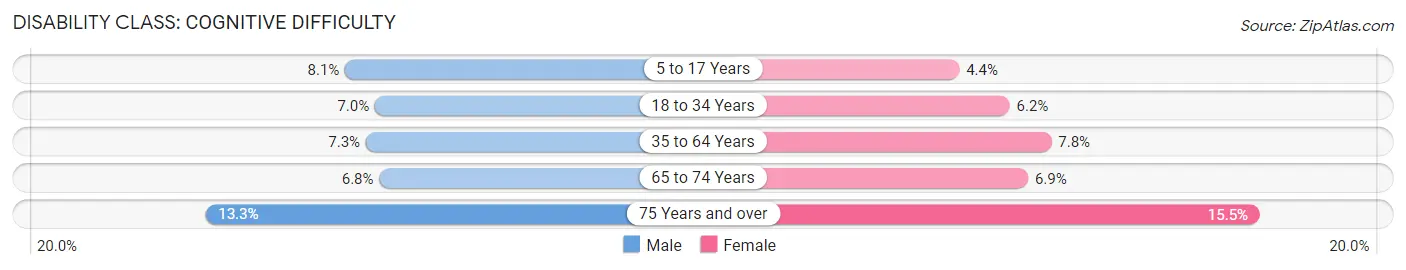
| Age Bracket | Male | Female |
| 5 to 17 Years | 30,933 (8.1%) | 15,772 (4.4%) |
| 18 to 34 Years | 34,566 (7.0%) | 30,439 (6.2%) |
| 35 to 64 Years | 61,188 (7.3%) | 66,881 (7.8%) |
| 65 to 74 Years | 14,586 (6.8%) | 16,474 (6.9%) |
| 75 Years and over | 15,506 (13.3%) | 25,721 (15.5%) |
Disability Class: Ambulatory Difficulty
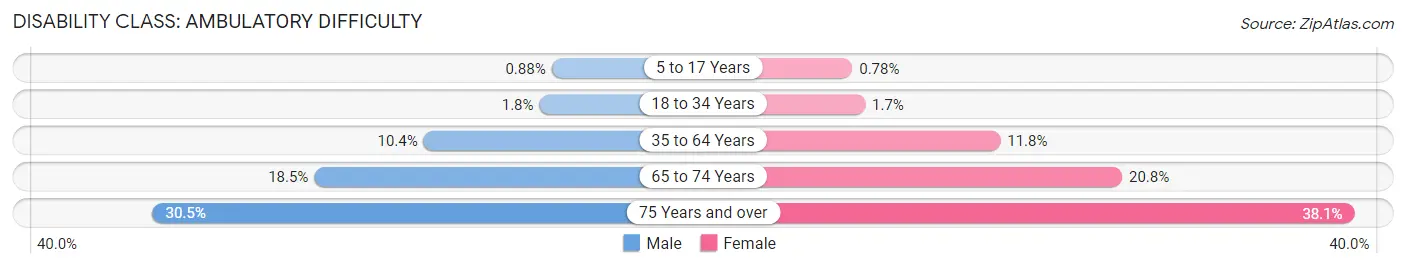
| Age Bracket | Male | Female |
| 5 to 17 Years | 3,380 (0.9%) | 2,808 (0.8%) |
| 18 to 34 Years | 8,802 (1.8%) | 8,460 (1.7%) |
| 35 to 64 Years | 86,599 (10.4%) | 101,244 (11.8%) |
| 65 to 74 Years | 39,522 (18.5%) | 49,619 (20.8%) |
| 75 Years and over | 35,601 (30.5%) | 63,075 (38.1%) |
Disability Class: Self-Care Difficulty
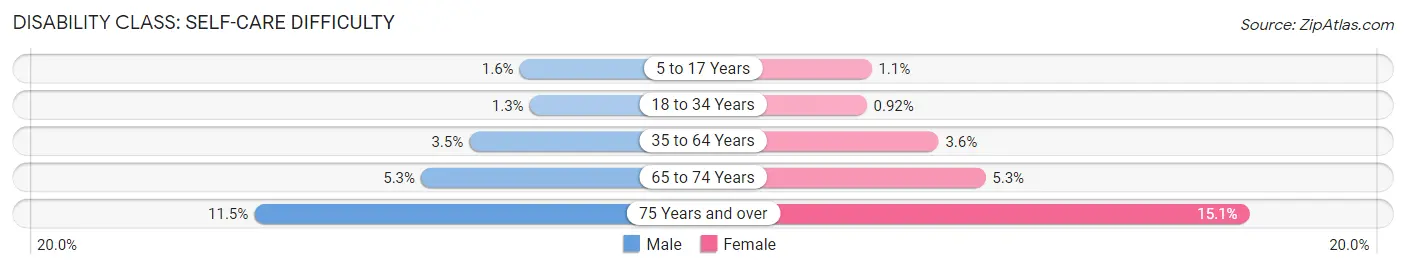
| Age Bracket | Male | Female |
| 5 to 17 Years | 6,233 (1.6%) | 3,976 (1.1%) |
| 18 to 34 Years | 6,241 (1.3%) | 4,491 (0.9%) |
| 35 to 64 Years | 29,179 (3.5%) | 30,917 (3.6%) |
| 65 to 74 Years | 11,312 (5.3%) | 12,719 (5.3%) |
| 75 Years and over | 13,394 (11.5%) | 25,079 (15.1%) |
Technology Access in Kentucky
Computing Device Access in Kentucky
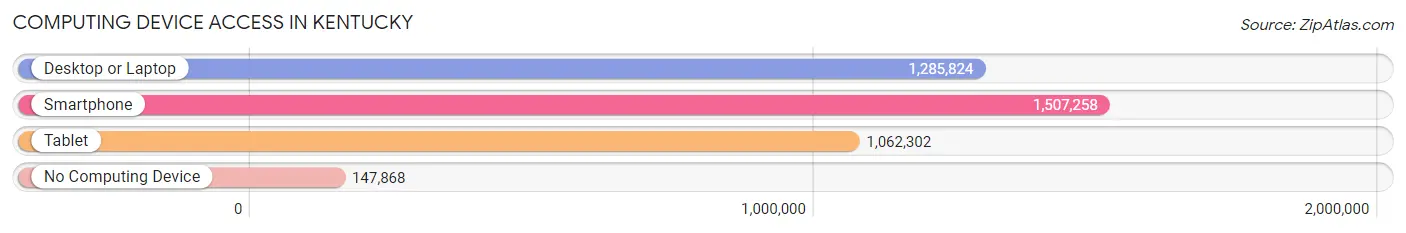
| Device Type | # Households | % Households |
| Desktop or Laptop | 1,285,824 | 72.7% |
| Smartphone | 1,507,258 | 85.2% |
| Tablet | 1,062,302 | 60.1% |
| No Computing Device | 147,868 | 8.4% |
| Total | 1,769,102 | 100.0% |
Internet Access in Kentucky
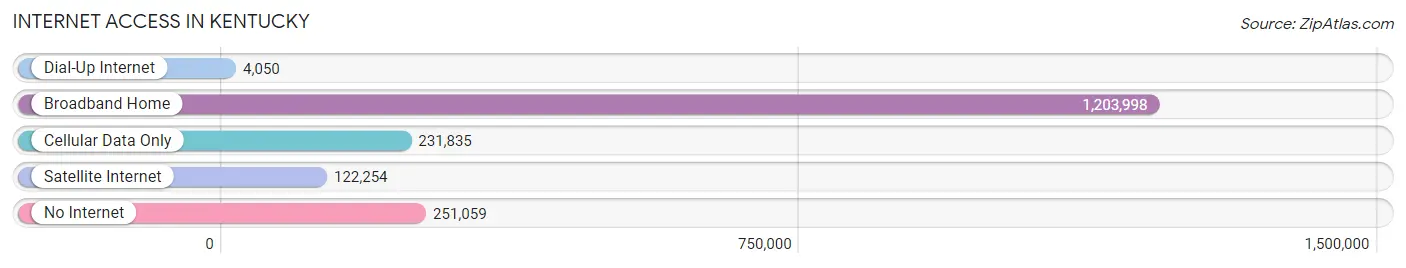
| Internet Type | # Households | % Households |
| Dial-Up Internet | 4,050 | 0.2% |
| Broadband Home | 1,203,998 | 68.1% |
| Cellular Data Only | 231,835 | 13.1% |
| Satellite Internet | 122,254 | 6.9% |
| No Internet | 251,059 | 14.2% |
| Total | 1,769,102 | 100.0% |
Kentucky Summary
Kentucky is a state located in the southeastern region of the United States. It is bordered by seven states, including Virginia, Tennessee, Missouri, Illinois, Indiana, Ohio, and West Virginia. Kentucky is the 37th most populous state in the United States, with a population of 4,468,402 as of 2019.
History
The area now known as Kentucky was first inhabited by Native American tribes, including the Shawnee, Cherokee, and Iroquois. The first Europeans to explore the area were French explorers in the late 1600s. In 1776, the area was officially declared a state and named Kentucky, after the Kentucky River.
The state was initially part of Virginia, but in 1792, it became the 15th state to join the Union. During the Civil War, Kentucky was a border state, meaning it was not part of the Confederacy, but it did not support the Union either. After the war, Kentucky experienced a period of economic growth, with the development of the coal and tobacco industries.
Geography
Kentucky is located in the southeastern region of the United States. It is bordered by seven states, including Virginia, Tennessee, Missouri, Illinois, Indiana, Ohio, and West Virginia. The state is divided into 120 counties and has a total area of 40,409 square miles.
The state is mostly composed of rolling hills and valleys, with the Appalachian Mountains in the east and the Mississippi River in the west. The highest point in the state is Black Mountain, which has an elevation of 4,145 feet. The state also has several large lakes, including Lake Cumberland and Kentucky Lake.
Economy
The economy of Kentucky is largely based on agriculture, manufacturing, and services. The state is the second-largest producer of tobacco in the United States, and it is also a major producer of corn, soybeans, and wheat. The state is also home to several large manufacturing companies, including Ford Motor Company, General Electric, and Toyota.
The state’s service sector is also growing, with the healthcare, finance, and tourism industries providing a significant number of jobs. The state’s largest city, Louisville, is home to several Fortune 500 companies, including Humana, Brown-Forman, and Yum! Brands.
Demographics
As of 2019, the population of Kentucky was 4,468,402. The state is predominantly white, with 84.3% of the population identifying as white. African Americans make up 8.4% of the population, while Hispanics and Latinos make up 4.2%.
The median household income in the state is $48,375, and the poverty rate is 17.2%. The largest cities in the state are Louisville, Lexington, and Bowling Green. The state’s capital is Frankfort.
Conclusion
Kentucky is a state located in the southeastern region of the United States. It is bordered by seven states, including Virginia, Tennessee, Missouri, Illinois, Indiana, Ohio, and West Virginia. The state has a population of 4,468,402 as of 2019 and is predominantly white. The economy of Kentucky is largely based on agriculture, manufacturing, and services. The state is also home to several large cities, including Louisville, Lexington, and Bowling Green.
Common Questions
When was Kentucky Incorporated?
Kentucky was Incorporated into the Union on Jun 1, 1792.
What is the Total Area of Kentucky?
Total Area of Kentucky is 40,411 Square Miles.
What is the Total Land Area of Kentucky?
Total Land Area of Kentucky is 39,492 Square Miles.
What is the Total Water Area of Kentucky?
Total Water Area of Kentucky is 919 Square Miles.
What is the Average Elevation in Kentucky?
Average Elevation in Kentucky is 750 Feet.
What is the Highest Elevation in Kentucky?
Highest Elevation in Kentucky is 4,139 Feet.
What is the Lowest Elevation in Kentucky?
Lowest Elevation in Kentucky is 257 Feet.
What is the Population Density in Kentucky?
Population Density in Kentucky is 114.0 People per Square Mile.
What is Per Capita Income in Kentucky?
Per Capita income in Kentucky is $33,515.
What is the Median Family Income in Kentucky?
Median Family Income in Kentucky is $76,273.
What is the Median Household income in Kentucky?
Median Household Income in Kentucky is $60,183.
What is Income or Wage Gap in Kentucky?
Income or Wage Gap in Kentucky is 28.4%.
Women in Kentucky earn 71.6 cents for every dollar earned by a man.
What is Family Income Deficit in Kentucky?
Family Income Deficit in Kentucky is $11,161.
Families that are below poverty line in Kentucky earn $11,161 less on average than the poverty threshold level.
What is Inequality or Gini Index in Kentucky?
Inequality or Gini Index in Kentucky is 0.48.
What is the Total Population of Kentucky?
Total Population of Kentucky is 4,502,935.
What is the Total Male Population of Kentucky?
Total Male Population of Kentucky is 2,234,041.
What is the Total Female Population of Kentucky?
Total Female Population of Kentucky is 2,268,894.
What is the Ratio of Males per 100 Females in Kentucky?
There are 98.46 Males per 100 Females in Kentucky.
What is the Ratio of Females per 100 Males in Kentucky?
There are 101.56 Females per 100 Males in Kentucky.
What is the Median Population Age in Kentucky?
Median Population Age in Kentucky is 39.1 Years.
What is the Average Family Size in Kentucky
Average Family Size in Kentucky is 3.1 People.
What is the Average Household Size in Kentucky
Average Household Size in Kentucky is 2.5 People.
How Large is the Labor Force in Kentucky?
There are 2,146,427 People in the Labor Forcein in Kentucky.
What is the Percentage of People in the Labor Force in Kentucky?
59.5% of People are in the Labor Force in Kentucky.
What is the Unemployment Rate in Kentucky?
Unemployment Rate in Kentucky is 5.1%.