Cities with the Most Immigrants from Dominica in the United States
RELATED REPORTS & OPTIONS
Dominica
United States
Compare Cities
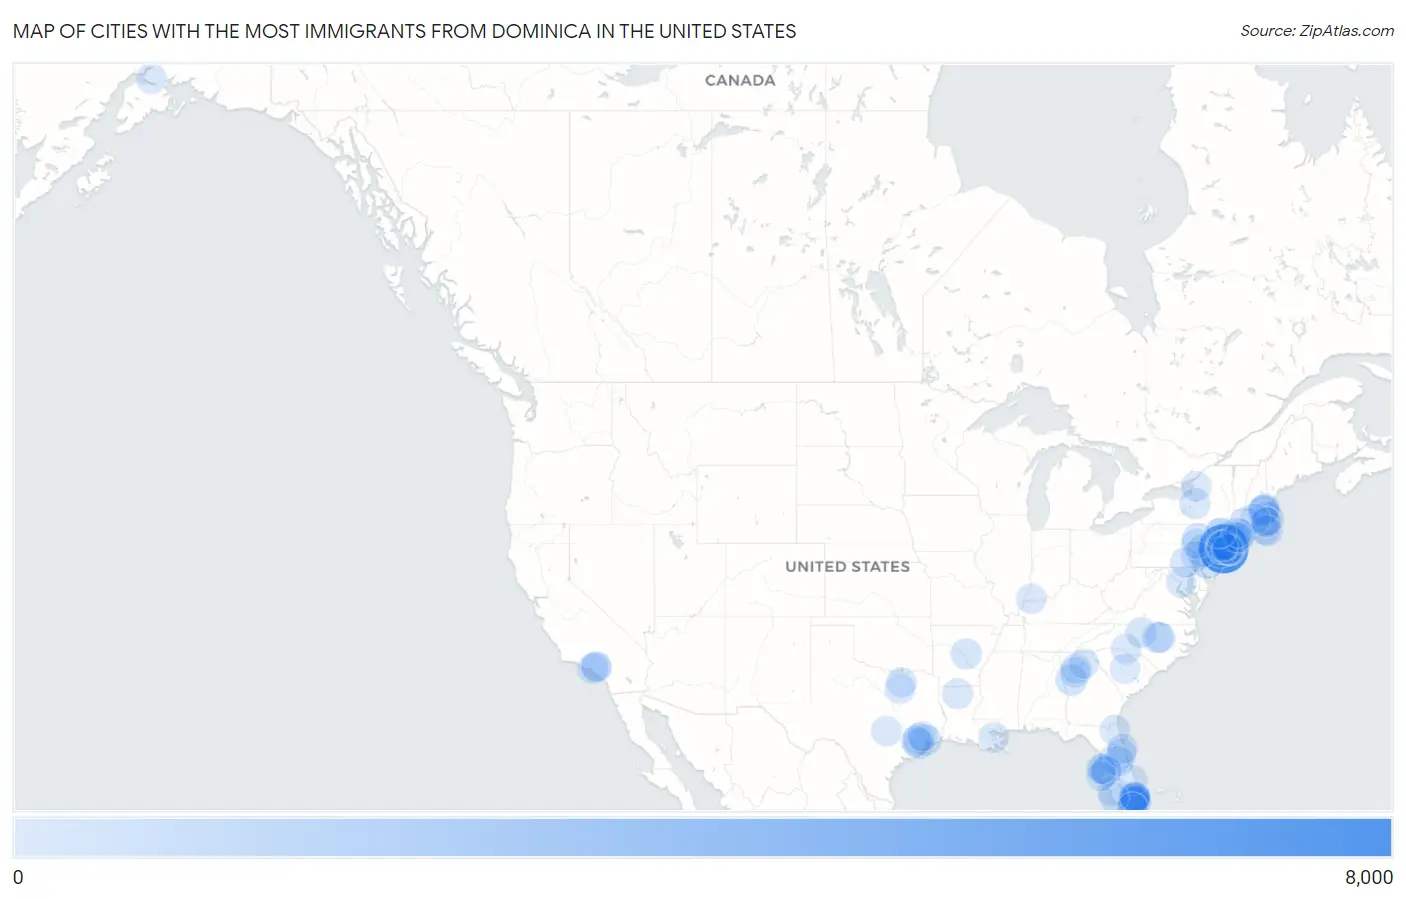
Map of Cities with the Most Immigrants from Dominica in the United States
0
8,000
Cities with the Most Immigrants from Dominica in the United States
| City | Dominica | vs State | vs National | |
| 1. | New York | 7,203 | 9,534(75.55%)#1 | 33,030(21.81%)#1 |
| 2. | Boston | 1,001 | 2,643(37.87%)#1 | 33,030(3.03%)#2 |
| 3. | Philadelphia | 772 | 2,729(28.29%)#1 | 33,030(2.34%)#3 |
| 4. | Allentown | 759 | 2,729(27.81%)#2 | 33,030(2.30%)#4 |
| 5. | Newnan | 539 | 2,022(26.66%)#1 | 33,030(1.63%)#5 |
| 6. | Lawrence | 345 | 2,643(13.05%)#2 | 33,030(1.04%)#6 |
| 7. | Raleigh | 339 | 859(39.46%)#1 | 33,030(1.03%)#7 |
| 8. | Pembroke Pines | 327 | 5,375(6.08%)#1 | 33,030(0.99%)#8 |
| 9. | Wilkes Barre | 324 | 2,729(11.87%)#3 | 33,030(0.98%)#9 |
| 10. | Yonkers | 318 | 9,534(3.34%)#2 | 33,030(0.96%)#10 |
| 11. | Sayreville Borough | 314 | 3,359(9.35%)#1 | 33,030(0.95%)#11 |
| 12. | Baytown | 305 | 2,295(13.29%)#1 | 33,030(0.92%)#12 |
| 13. | Jacksonville | 303 | 319(94.98%)#1 | 33,030(0.92%)#13 |
| 14. | Tampa | 301 | 5,375(5.60%)#2 | 33,030(0.91%)#14 |
| 15. | Minoa | 275 | 9,534(2.88%)#3 | 33,030(0.83%)#15 |
| 16. | Englewood | 269 | 3,359(8.01%)#2 | 33,030(0.81%)#16 |
| 17. | Lauderhill | 250 | 5,375(4.65%)#3 | 33,030(0.76%)#17 |
| 18. | Freeport | 245 | 9,534(2.57%)#4 | 33,030(0.74%)#18 |
| 19. | Houston | 236 | 2,295(10.28%)#2 | 33,030(0.71%)#19 |
| 20. | East Orange | 236 | 3,359(7.03%)#3 | 33,030(0.71%)#20 |
| 21. | Haverhill | 232 | 2,643(8.78%)#3 | 33,030(0.70%)#21 |
| 22. | Fresno | 227 | 2,295(9.89%)#3 | 33,030(0.69%)#22 |
| 23. | Greensboro | 213 | 859(24.80%)#2 | 33,030(0.64%)#23 |
| 24. | Jersey City | 212 | 3,359(6.31%)#4 | 33,030(0.64%)#24 |
| 25. | Grambling | 206 | 345(59.71%)#1 | 33,030(0.62%)#25 |
| 26. | Clermont | 202 | 5,375(3.76%)#4 | 33,030(0.61%)#26 |
| 27. | Four Corners | 196 | 2,295(8.54%)#4 | 33,030(0.59%)#27 |
| 28. | Golden Glades | 194 | 5,375(3.61%)#5 | 33,030(0.59%)#28 |
| 29. | Brandon | 193 | 5,375(3.59%)#6 | 33,030(0.58%)#29 |
| 30. | North Plainfield Borough | 191 | 3,359(5.69%)#5 | 33,030(0.58%)#30 |
| 31. | Newark | 187 | 3,359(5.57%)#6 | 33,030(0.57%)#31 |
| 32. | Miami Gardens | 187 | 5,375(3.48%)#7 | 33,030(0.57%)#32 |
| 33. | Los Angeles | 180 | 641(28.08%)#1 | 33,030(0.54%)#33 |
| 34. | Jacksonville | 174 | 5,375(3.24%)#8 | 33,030(0.53%)#34 |
| 35. | Hempstead | 170 | 9,534(1.78%)#5 | 33,030(0.51%)#35 |
| 36. | Springfield | 167 | 2,643(6.32%)#4 | 33,030(0.51%)#36 |
| 37. | Clifton | 158 | 3,359(4.70%)#7 | 33,030(0.48%)#37 |
| 38. | Mount Ivy | 158 | 9,534(1.66%)#6 | 33,030(0.48%)#38 |
| 39. | Atlanta | 157 | 2,022(7.76%)#2 | 33,030(0.48%)#39 |
| 40. | Reading | 151 | 2,729(5.53%)#4 | 33,030(0.46%)#40 |
| 41. | Sunrise | 141 | 5,375(2.62%)#9 | 33,030(0.43%)#41 |
| 42. | Paterson | 133 | 3,359(3.96%)#8 | 33,030(0.40%)#42 |
| 43. | Danbury | 129 | 731(17.65%)#1 | 33,030(0.39%)#43 |
| 44. | New Bedford | 128 | 2,643(4.84%)#5 | 33,030(0.39%)#44 |
| 45. | Washington | 125 | 125(100.00%)#1 | 33,030(0.38%)#45 |
| 46. | Miramar | 124 | 5,375(2.31%)#10 | 33,030(0.38%)#46 |
| 47. | Roswell | 123 | 2,022(6.08%)#3 | 33,030(0.37%)#47 |
| 48. | Knightdale | 121 | 859(14.09%)#3 | 33,030(0.37%)#48 |
| 49. | Bergenfield Borough | 119 | 3,359(3.54%)#9 | 33,030(0.36%)#49 |
| 50. | Methuen Town | 118 | 2,643(4.46%)#6 | 33,030(0.36%)#50 |
| 51. | Port St Lucie | 117 | 5,375(2.18%)#11 | 33,030(0.35%)#51 |
| 52. | Watertown | 114 | 9,534(1.20%)#7 | 33,030(0.35%)#52 |
| 53. | Fort Myers | 112 | 5,375(2.08%)#12 | 33,030(0.34%)#53 |
| 54. | Orlando | 105 | 5,375(1.95%)#13 | 33,030(0.32%)#54 |
| 55. | Deltona | 103 | 5,375(1.92%)#14 | 33,030(0.31%)#55 |
| 56. | Rosemead | 100 | 641(15.60%)#2 | 33,030(0.30%)#56 |
| 57. | Anchorage | 97 | 97(100.00%)#1 | 33,030(0.29%)#57 |
| 58. | Randolph Town | 94 | 2,643(3.56%)#7 | 33,030(0.28%)#58 |
| 59. | Lakeview | 94 | 9,534(0.99%)#8 | 33,030(0.28%)#59 |
| 60. | Hollywood | 92 | 5,375(1.71%)#15 | 33,030(0.28%)#60 |
| 61. | Athens-Clarke County Unified Government (Balance) | 92 | 2,022(4.55%)#4 | 33,030(0.28%)#61 |
| 62. | Charlotte | 91 | 859(10.59%)#4 | 33,030(0.28%)#62 |
| 63. | Ridgefield Borough | 87 | 3,359(2.59%)#10 | 33,030(0.26%)#63 |
| 64. | Daytona Beach | 86 | 5,375(1.60%)#16 | 33,030(0.26%)#64 |
| 65. | Fall River | 81 | 2,643(3.06%)#8 | 33,030(0.25%)#65 |
| 66. | Margate | 81 | 5,375(1.51%)#17 | 33,030(0.25%)#66 |
| 67. | Bridgeport | 79 | 731(10.81%)#2 | 33,030(0.24%)#67 |
| 68. | Mount Vernon | 78 | 9,534(0.82%)#9 | 33,030(0.24%)#68 |
| 69. | Hackensack | 73 | 3,359(2.17%)#11 | 33,030(0.22%)#69 |
| 70. | York | 72 | 2,729(2.64%)#5 | 33,030(0.22%)#70 |
| 71. | Valley Stream | 70 | 9,534(0.73%)#10 | 33,030(0.21%)#71 |
| 72. | Worcester | 69 | 2,643(2.61%)#9 | 33,030(0.21%)#72 |
| 73. | Perth Amboy | 69 | 3,359(2.05%)#12 | 33,030(0.21%)#73 |
| 74. | Princeton | 68 | 5,375(1.27%)#18 | 33,030(0.21%)#74 |
| 75. | Bridge City | 68 | 345(19.71%)#2 | 33,030(0.21%)#75 |
| 76. | Dallas | 67 | 2,295(2.92%)#5 | 33,030(0.20%)#76 |
| 77. | Meriden | 67 | 731(9.17%)#3 | 33,030(0.20%)#77 |
| 78. | South Miami Heights | 66 | 5,375(1.23%)#19 | 33,030(0.20%)#78 |
| 79. | Austin | 64 | 2,295(2.79%)#6 | 33,030(0.19%)#79 |
| 80. | Brockton | 63 | 2,643(2.38%)#10 | 33,030(0.19%)#80 |
| 81. | Riverview | 63 | 5,375(1.17%)#20 | 33,030(0.19%)#81 |
| 82. | Gainesville | 63 | 2,022(3.12%)#5 | 33,030(0.19%)#82 |
| 83. | Evansville | 62 | 86(72.09%)#1 | 33,030(0.19%)#83 |
| 84. | North Lauderdale | 62 | 5,375(1.15%)#21 | 33,030(0.19%)#84 |
| 85. | Hazleton | 62 | 2,729(2.27%)#6 | 33,030(0.19%)#85 |
| 86. | Mckinney | 61 | 2,295(2.66%)#7 | 33,030(0.18%)#86 |
| 87. | Shelton | 61 | 731(8.34%)#4 | 33,030(0.18%)#87 |
| 88. | Golden Gate | 60 | 5,375(1.12%)#22 | 33,030(0.18%)#88 |
| 89. | Pasadena | 59 | 641(9.20%)#3 | 33,030(0.18%)#89 |
| 90. | Bradenton | 58 | 5,375(1.08%)#23 | 33,030(0.18%)#90 |
| 91. | North Valley Stream | 58 | 9,534(0.61%)#11 | 33,030(0.18%)#91 |
| 92. | Town N Country | 56 | 5,375(1.04%)#24 | 33,030(0.17%)#92 |
| 93. | Woodlawn Cdp Baltimore County | 56 | 403(13.90%)#1 | 33,030(0.17%)#93 |
| 94. | Scotchtown | 56 | 9,534(0.59%)#12 | 33,030(0.17%)#94 |
| 95. | Columbia | 55 | 109(50.46%)#1 | 33,030(0.17%)#95 |
| 96. | New Haven | 55 | 731(7.52%)#5 | 33,030(0.17%)#96 |
| 97. | Waterbury | 55 | 731(7.52%)#6 | 33,030(0.17%)#97 |
| 98. | Walden | 55 | 9,534(0.58%)#13 | 33,030(0.17%)#98 |
| 99. | Garfield | 53 | 3,359(1.58%)#13 | 33,030(0.16%)#99 |
| 100. | Atascocita | 52 | 2,295(2.27%)#8 | 33,030(0.16%)#100 |
Common Questions
What are the Top 10 Cities with the Most Immigrants from Dominica in the United States?
Top 10 Cities with the Most Immigrants from Dominica in the United States are:
What city has the Most Immigrants from Dominica in the United States?
New York has the Most Immigrants from Dominica in the United States with 7,203.
What is the Total Immigrants from Dominica in the United States?
Total Immigrants from Dominica in the United States is 33,030.