Cities with the Highest Percentage of Immigrants from Trinidad and Tobago in the United States
RELATED REPORTS & OPTIONS
Trinidad and Tobago
United States
Compare Cities
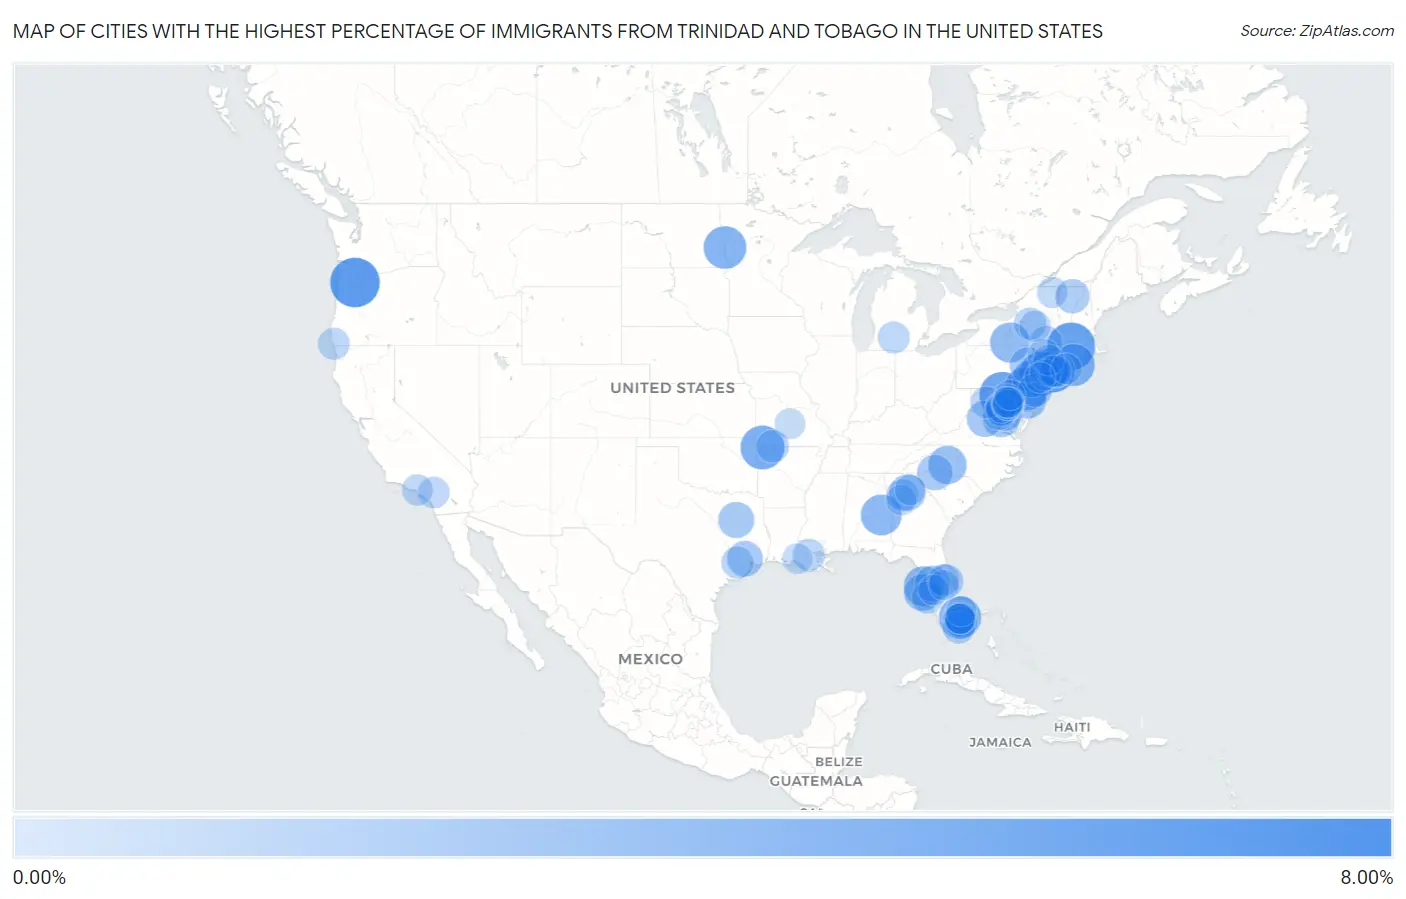
Map of Cities with the Highest Percentage of Immigrants from Trinidad and Tobago in the United States
0.00%
8.00%
Cities with the Highest Percentage of Immigrants from Trinidad and Tobago in the United States
| City | Trinidad and Tobago | vs State | vs National | |
| 1. | Botsford | 6.13% | 0.082%(+6.05)#-1 | 0.070%(+6.06)#0 |
| 2. | Aurora | 5.59% | 0.014%(+5.58)#-1 | 0.070%(+5.52)#1 |
| 3. | Somers | 5.15% | 0.082%(+5.07)#0 | 0.070%(+5.08)#2 |
| 4. | Monrovia | 4.77% | 0.19%(+4.58)#-1 | 0.070%(+4.70)#3 |
| 5. | Teterboro Borough | 4.40% | 0.17%(+4.23)#-1 | 0.070%(+4.33)#4 |
| 6. | East Millstone | 4.25% | 0.17%(+4.08)#0 | 0.070%(+4.18)#5 |
| 7. | Pea Ridge | 4.20% | 0.011%(+4.19)#-1 | 0.070%(+4.13)#6 |
| 8. | South Floral Park | 4.20% | 0.46%(+3.74)#5 | 0.070%(+4.13)#120 |
| 9. | Wilmington Manor | 4.14% | 0.14%(+4.00)#-1 | 0.070%(+4.07)#121 |
| 10. | North River | 3.92% | 0.00026%(+3.92)#-1 | 0.070%(+3.85)#122 |
| 11. | Lakeview | 3.84% | 0.46%(+3.38)#6 | 0.070%(+3.77)#123 |
| 12. | Margate | 3.83% | 0.20%(+3.62)#106 | 0.070%(+3.76)#235 |
| 13. | Wainscott | 3.76% | 0.46%(+3.30)#7 | 0.070%(+3.69)#236 |
| 14. | Reeltown | 3.46% | 0.0093%(+3.45)#-1 | 0.070%(+3.39)#237 |
| 15. | Key Vista | 3.31% | 0.20%(+3.11)#107 | 0.070%(+3.24)#238 |
| 16. | Breesport | 3.24% | 0.46%(+2.78)#8 | 0.070%(+3.17)#239 |
| 17. | Iron Station | 2.86% | 0.034%(+2.83)#-1 | 0.070%(+2.79)#240 |
| 18. | South Valley Stream | 2.85% | 0.46%(+2.39)#9 | 0.070%(+2.78)#241 |
| 19. | North Valley Stream | 2.75% | 0.46%(+2.29)#10 | 0.070%(+2.68)#242 |
| 20. | Rodney Village | 2.68% | 0.14%(+2.54)#0 | 0.070%(+2.61)#243 |
| 21. | Brittany Farms The Highlands | 2.68% | 0.056%(+2.63)#-1 | 0.070%(+2.61)#244 |
| 22. | Indian Shores | 2.54% | 0.20%(+2.34)#108 | 0.070%(+2.47)#245 |
| 23. | Bowling Green | 2.54% | 0.049%(+2.49)#-1 | 0.070%(+2.47)#246 |
| 24. | Pantops | 2.41% | 0.049%(+2.36)#0 | 0.070%(+2.34)#247 |
| 25. | Grayson | 2.41% | 0.081%(+2.32)#-1 | 0.070%(+2.34)#248 |
| 26. | Log Cabin | 2.34% | 0.033%(+2.31)#-1 | 0.070%(+2.27)#249 |
| 27. | Dade City North | 2.30% | 0.20%(+2.10)#109 | 0.070%(+2.23)#250 |
| 28. | Aldine | 2.27% | 0.033%(+2.24)#0 | 0.070%(+2.20)#251 |
| 29. | Valley Falls | 2.27% | 0.021%(+2.25)#-1 | 0.070%(+2.20)#252 |
| 30. | Milstead | 2.22% | 0.081%(+2.14)#0 | 0.070%(+2.15)#253 |
| 31. | Indian Mountain Lake | 2.22% | 0.056%(+2.16)#0 | 0.070%(+2.15)#254 |
| 32. | North Lauderdale | 2.09% | 0.20%(+1.89)#110 | 0.070%(+2.02)#255 |
| 33. | Roosevelt Gardens | 1.94% | 0.20%(+1.74)#111 | 0.070%(+1.87)#256 |
| 34. | Hardwick | 1.92% | 0.0076%(+1.92)#-1 | 0.070%(+1.85)#257 |
| 35. | Dahlgren | 1.91% | 0.049%(+1.86)#1 | 0.070%(+1.84)#258 |
| 36. | Union Park | 1.89% | 0.20%(+1.68)#112 | 0.070%(+1.82)#259 |
| 37. | Victory Lakes | 1.82% | 0.17%(+1.65)#1 | 0.070%(+1.75)#260 |
| 38. | North Amityville | 1.80% | 0.46%(+1.35)#11 | 0.070%(+1.73)#261 |
| 39. | Elmont | 1.77% | 0.46%(+1.31)#12 | 0.070%(+1.70)#262 |
| 40. | Roosevelt | 1.76% | 0.46%(+1.30)#13 | 0.070%(+1.69)#263 |
| 41. | East Orange | 1.76% | 0.17%(+1.59)#2 | 0.070%(+1.69)#264 |
| 42. | Yeadon Borough | 1.74% | 0.056%(+1.68)#1 | 0.070%(+1.67)#265 |
| 43. | Dumfries | 1.74% | 0.049%(+1.69)#2 | 0.070%(+1.67)#266 |
| 44. | Cliffside Park Borough | 1.67% | 0.17%(+1.50)#3 | 0.070%(+1.60)#267 |
| 45. | Seat Pleasant | 1.65% | 0.19%(+1.46)#0 | 0.070%(+1.58)#268 |
| 46. | New Salem Borough | 1.61% | 0.056%(+1.56)#2 | 0.070%(+1.54)#269 |
| 47. | Spencerville | 1.57% | 0.19%(+1.38)#1 | 0.070%(+1.50)#270 |
| 48. | Lauderdale Lakes | 1.55% | 0.20%(+1.35)#113 | 0.070%(+1.48)#271 |
| 49. | Blue Eye | 1.54% | 0.011%(+1.53)#-1 | 0.070%(+1.47)#272 |
| 50. | Kettering | 1.52% | 0.19%(+1.33)#2 | 0.070%(+1.45)#273 |
| 51. | Tannersville | 1.50% | 0.46%(+1.04)#14 | 0.070%(+1.43)#274 |
| 52. | Whitesboro | 1.50% | 0.46%(+1.04)#15 | 0.070%(+1.43)#275 |
| 53. | Sunrise | 1.50% | 0.20%(+1.29)#114 | 0.070%(+1.43)#276 |
| 54. | Southern Gateway | 1.49% | 0.049%(+1.44)#3 | 0.070%(+1.42)#277 |
| 55. | Cheverly | 1.47% | 0.19%(+1.28)#3 | 0.070%(+1.40)#278 |
| 56. | Memphis | 1.46% | 0.20%(+1.26)#115 | 0.070%(+1.39)#279 |
| 57. | West Park | 1.46% | 0.20%(+1.26)#116 | 0.070%(+1.39)#280 |
| 58. | Sorrento | 1.46% | 0.031%(+1.43)#-1 | 0.070%(+1.39)#281 |
| 59. | Scotchtown | 1.46% | 0.46%(+1.00)#16 | 0.070%(+1.39)#282 |
| 60. | Richmond Heights | 1.45% | 0.20%(+1.25)#117 | 0.070%(+1.38)#283 |
| 61. | Fulshear | 1.44% | 0.033%(+1.41)#1 | 0.070%(+1.37)#284 |
| 62. | Peppermill Village | 1.42% | 0.19%(+1.23)#4 | 0.070%(+1.35)#285 |
| 63. | Panthersville | 1.41% | 0.081%(+1.33)#1 | 0.070%(+1.34)#286 |
| 64. | Olivet | 1.38% | 0.012%(+1.37)#-1 | 0.070%(+1.31)#287 |
| 65. | Toms Brook | 1.38% | 0.049%(+1.33)#4 | 0.070%(+1.31)#288 |
| 66. | Eatonville | 1.37% | 0.20%(+1.17)#118 | 0.070%(+1.30)#289 |
| 67. | Valley Stream | 1.36% | 0.46%(+0.905)#17 | 0.070%(+1.29)#290 |
| 68. | Brookings | 1.35% | 0.014%(+1.34)#0 | 0.070%(+1.28)#291 |
| 69. | Mount Rainier | 1.32% | 0.19%(+1.13)#5 | 0.070%(+1.25)#292 |
| 70. | Triangle | 1.30% | 0.049%(+1.25)#5 | 0.070%(+1.23)#293 |
| 71. | March Arb | 1.28% | 0.014%(+1.26)#-1 | 0.070%(+1.21)#294 |
| 72. | Herkimer | 1.25% | 0.46%(+0.797)#18 | 0.070%(+1.18)#295 |
| 73. | New Carrollton | 1.25% | 0.19%(+1.07)#6 | 0.070%(+1.18)#296 |
| 74. | Taylor Corners | 1.24% | 0.082%(+1.16)#1 | 0.070%(+1.17)#297 |
| 75. | Laurence Harbor | 1.23% | 0.17%(+1.06)#4 | 0.070%(+1.16)#298 |
| 76. | Baldwin | 1.23% | 0.46%(+0.771)#19 | 0.070%(+1.16)#299 |
| 77. | View Park Windsor Hills | 1.23% | 0.014%(+1.21)#0 | 0.070%(+1.16)#300 |
| 78. | Stony Point | 1.20% | 0.46%(+0.748)#20 | 0.070%(+1.13)#301 |
| 79. | Vauxhall | 1.20% | 0.17%(+1.03)#5 | 0.070%(+1.13)#302 |
| 80. | East Moriches | 1.18% | 0.46%(+0.725)#21 | 0.070%(+1.11)#303 |
| 81. | Robbinsville Center | 1.17% | 0.17%(+1.01)#6 | 0.070%(+1.10)#304 |
| 82. | University Cdp Hillsborough County | 1.17% | 0.20%(+0.972)#119 | 0.070%(+1.10)#305 |
| 83. | Dannemora | 1.16% | 0.46%(+0.699)#22 | 0.070%(+1.09)#306 |
| 84. | Tuxedo | 1.14% | 0.46%(+0.682)#23 | 0.070%(+1.07)#307 |
| 85. | South Laurel | 1.13% | 0.19%(+0.939)#7 | 0.070%(+1.06)#308 |
| 86. | Plainsboro Center | 1.12% | 0.17%(+0.953)#7 | 0.070%(+1.05)#309 |
| 87. | Potomac Mills | 1.11% | 0.049%(+1.06)#6 | 0.070%(+1.04)#310 |
| 88. | Tamarac | 1.10% | 0.20%(+0.899)#120 | 0.070%(+1.03)#311 |
| 89. | Bonanza | 1.10% | 0.081%(+1.02)#2 | 0.070%(+1.03)#312 |
| 90. | Winder | 1.09% | 0.081%(+1.01)#3 | 0.070%(+1.02)#313 |
| 91. | Springdale | 1.07% | 0.19%(+0.884)#8 | 0.070%(+1.00)#314 |
| 92. | Plant City | 1.07% | 0.20%(+0.867)#121 | 0.070%(+0.999)#315 |
| 93. | Buenaventura Lakes | 1.07% | 0.20%(+0.865)#122 | 0.070%(+0.997)#316 |
| 94. | Morningside | 1.06% | 0.19%(+0.876)#9 | 0.070%(+0.993)#317 |
| 95. | Waynesville | 1.06% | 0.011%(+1.05)#0 | 0.070%(+0.991)#318 |
| 96. | Colmar Manor | 1.06% | 0.19%(+0.869)#10 | 0.070%(+0.986)#319 |
| 97. | Jeanerette | 1.04% | 0.031%(+1.01)#0 | 0.070%(+0.970)#320 |
| 98. | Greenacres | 1.02% | 0.20%(+0.822)#142 | 0.070%(+0.954)#379 |
| 99. | Lauderhill | 1.02% | 0.20%(+0.819)#143 | 0.070%(+0.951)#380 |
| 100. | Milford Mill | 1.02% | 0.19%(+0.832)#11 | 0.070%(+0.949)#381 |
Common Questions
What are the Top 10 Cities with the Highest Percentage of Immigrants from Trinidad and Tobago in the United States?
Top 10 Cities with the Highest Percentage of Immigrants from Trinidad and Tobago in the United States are:
#1
5.59%
#2
5.15%
#3
4.77%
#4
4.25%
#5
4.20%
#6
4.20%
#7
4.14%
#8
3.92%
#9
3.84%
#10
3.83%
What city has the Highest Percentage of Immigrants from Trinidad and Tobago in the United States?
Aurora has the Highest Percentage of Immigrants from Trinidad and Tobago in the United States with 5.59%.
What is the Percentage of Immigrants from Trinidad and Tobago in the United States?
Percentage of Immigrants from Trinidad and Tobago in the United States is 0.070%.