Cherokee County, SC Map & Demographics
Cherokee County Map
Cherokee County Overview
$26,706
PER CAPITA INCOME
$64,216
AVG FAMILY INCOME
$47,011
AVG HOUSEHOLD INCOME
26.8%
WAGE / INCOME GAP [ % ]
73.2¢/ $1
WAGE / INCOME GAP [ $ ]
$10,000
FAMILY INCOME DEFICIT
0.48
INEQUALITY / GINI INDEX
56,200
TOTAL POPULATION
27,445
MALE POPULATION
28,755
FEMALE POPULATION
95.44
MALES / 100 FEMALES
104.77
FEMALES / 100 MALES
40.0
MEDIAN AGE
3.4
AVG FAMILY SIZE
2.6
AVG HOUSEHOLD SIZE
25,839
LABOR FORCE [ PEOPLE ]
57.6%
PERCENT IN LABOR FORCE
5.9%
UNEMPLOYMENT RATE
Cherokee County Area Codes
Income in Cherokee County
Income Overview in Cherokee County
Per Capita Income in Cherokee County is $26,706, while median incomes of families and households are $64,216 and $47,011 respectively.
| Characteristic | Number | Measure |
| Per Capita Income | 56,200 | $26,706 |
| Median Family Income | 13,084 | $64,216 |
| Mean Family Income | 13,084 | $77,277 |
| Median Household Income | 21,288 | $47,011 |
| Mean Household Income | 21,288 | $65,759 |
| Income Deficit | 13,084 | $10,000 |
| Wage / Income Gap (%) | 56,200 | 26.76% |
| Wage / Income Gap ($) | 56,200 | 73.24¢ per $1 |
| Gini / Inequality Index | 56,200 | 0.48 |
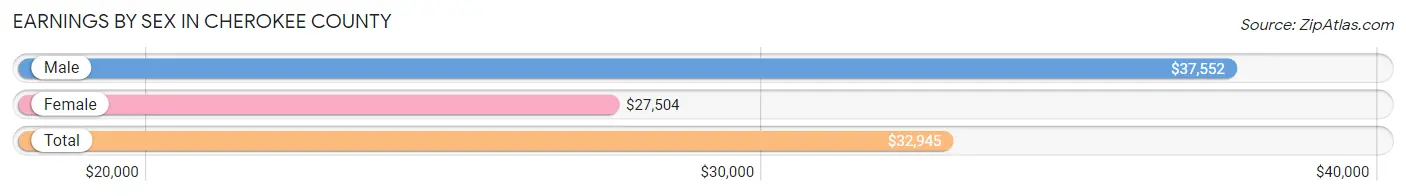
Earnings by Sex in Cherokee County
Average Earnings in Cherokee County are $32,945, $37,552 for men and $27,504 for women, a difference of 26.8%.
| Sex | Number | Average Earnings |
| Male | 14,639 (54.7%) | $37,552 |
| Female | 12,118 (45.3%) | $27,504 |
| Total | 26,757 (100.0%) | $32,945 |
Earnings by Sex by Income Bracket in Cherokee County
The most common earnings brackets in Cherokee County are $30,000 to $34,999 for men (1,280 | 8.7%) and $25,000 to $29,999 for women (917 | 7.6%).
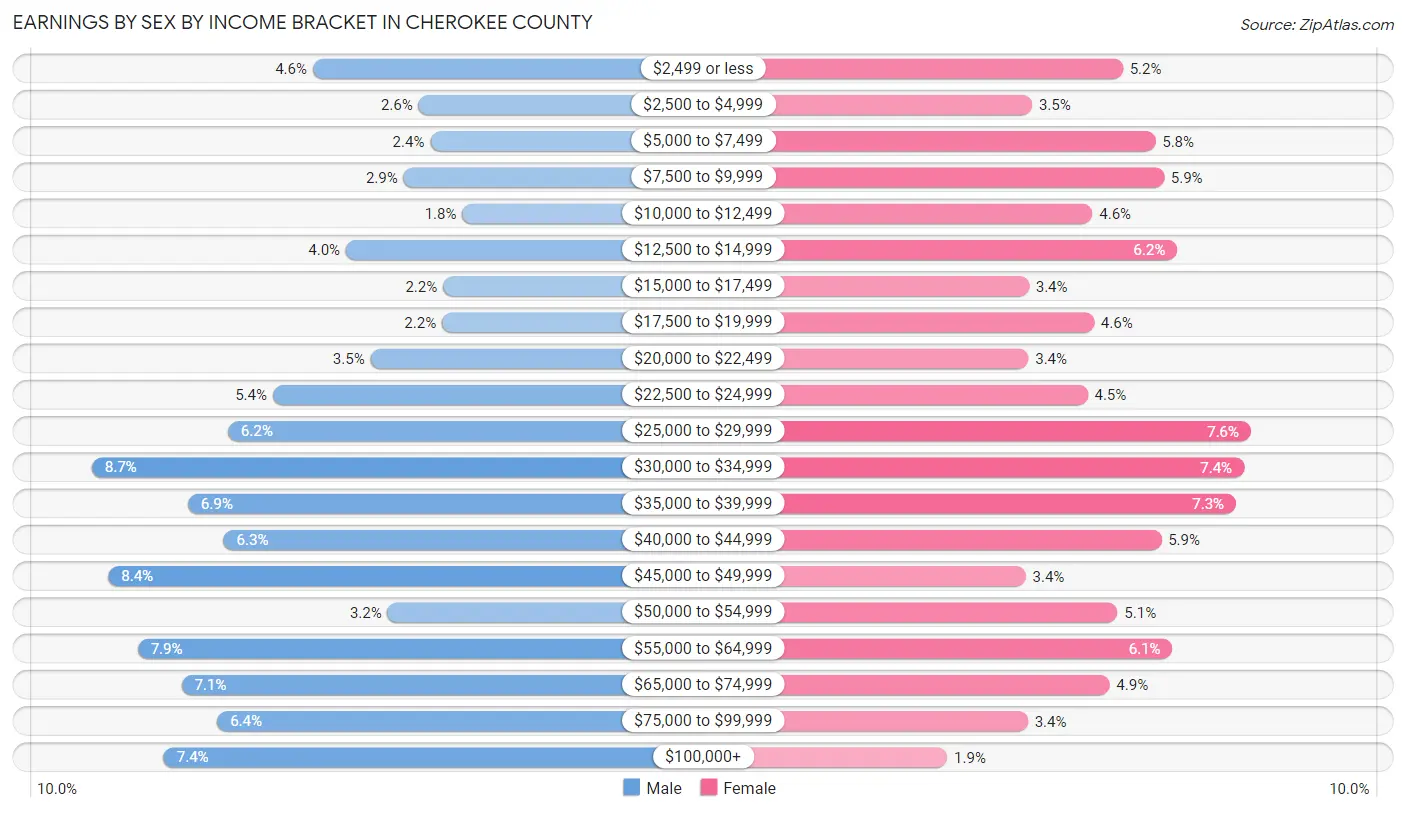
| Income | Male | Female |
| $2,499 or less | 673 (4.6%) | 626 (5.2%) |
| $2,500 to $4,999 | 383 (2.6%) | 421 (3.5%) |
| $5,000 to $7,499 | 351 (2.4%) | 700 (5.8%) |
| $7,500 to $9,999 | 425 (2.9%) | 720 (5.9%) |
| $10,000 to $12,499 | 263 (1.8%) | 558 (4.6%) |
| $12,500 to $14,999 | 583 (4.0%) | 750 (6.2%) |
| $15,000 to $17,499 | 316 (2.2%) | 413 (3.4%) |
| $17,500 to $19,999 | 319 (2.2%) | 561 (4.6%) |
| $20,000 to $22,499 | 515 (3.5%) | 412 (3.4%) |
| $22,500 to $24,999 | 783 (5.3%) | 547 (4.5%) |
| $25,000 to $29,999 | 906 (6.2%) | 917 (7.6%) |
| $30,000 to $34,999 | 1,280 (8.7%) | 902 (7.4%) |
| $35,000 to $39,999 | 1,016 (6.9%) | 883 (7.3%) |
| $40,000 to $44,999 | 918 (6.3%) | 714 (5.9%) |
| $45,000 to $49,999 | 1,234 (8.4%) | 406 (3.4%) |
| $50,000 to $54,999 | 469 (3.2%) | 614 (5.1%) |
| $55,000 to $64,999 | 1,154 (7.9%) | 739 (6.1%) |
| $65,000 to $74,999 | 1,034 (7.1%) | 596 (4.9%) |
| $75,000 to $99,999 | 935 (6.4%) | 411 (3.4%) |
| $100,000+ | 1,082 (7.4%) | 228 (1.9%) |
| Total | 14,639 (100.0%) | 12,118 (100.0%) |
Earnings by Sex by Educational Attainment in Cherokee County
Average earnings in Cherokee County are $41,913 for men and $30,934 for women, a difference of 26.2%. Men with an educational attainment of bachelor's degree enjoy the highest average annual earnings of $46,947, while those with less than high school education earn the least with $32,602. Women with an educational attainment of graduate degree earn the most with the average annual earnings of $54,170, while those with less than high school education have the smallest earnings of $20,288.
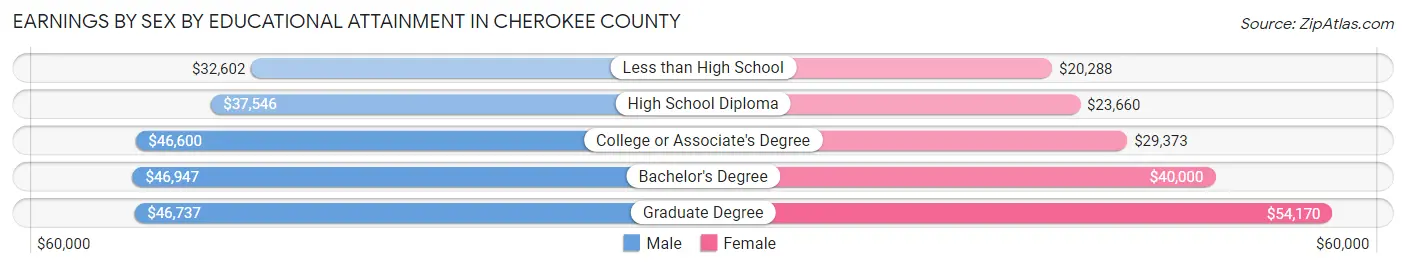
| Educational Attainment | Male Income | Female Income |
| Less than High School | $32,602 | $20,288 |
| High School Diploma | $37,546 | $23,660 |
| College or Associate's Degree | $46,600 | $29,373 |
| Bachelor's Degree | $46,947 | $40,000 |
| Graduate Degree | $46,737 | $54,170 |
| Total | $41,913 | $30,934 |
Family Income in Cherokee County
Family Income Brackets in Cherokee County
According to the Cherokee County family income data, there are 2,434 families falling into the $50,000 to $74,999 income range, which is the most common income bracket and makes up 18.6% of all families. Conversely, the $10,000 to $14,999 income bracket is the least frequent group with only 157 families (1.2%) belonging to this category.
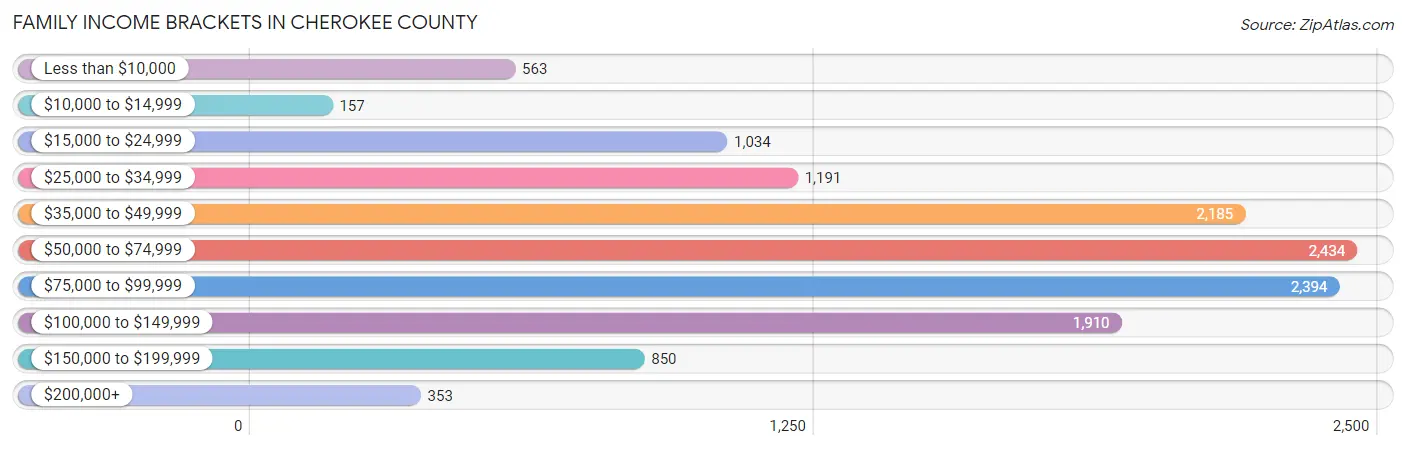
| Income Bracket | # Families | % Families |
| Less than $10,000 | 563 | 4.3% |
| $10,000 to $14,999 | 157 | 1.2% |
| $15,000 to $24,999 | 1,034 | 7.9% |
| $25,000 to $34,999 | 1,191 | 9.1% |
| $35,000 to $49,999 | 2,185 | 16.7% |
| $50,000 to $74,999 | 2,434 | 18.6% |
| $75,000 to $99,999 | 2,394 | 18.3% |
| $100,000 to $149,999 | 1,910 | 14.6% |
| $150,000 to $199,999 | 850 | 6.5% |
| $200,000+ | 353 | 2.7% |
Family Income by Famaliy Size in Cherokee County
6-person families (388 | 3.0%) account for the highest median family income in Cherokee County with $84,270 per family, while 2-person families (6,440 | 49.2%) have the highest median income of $29,071 per family member.
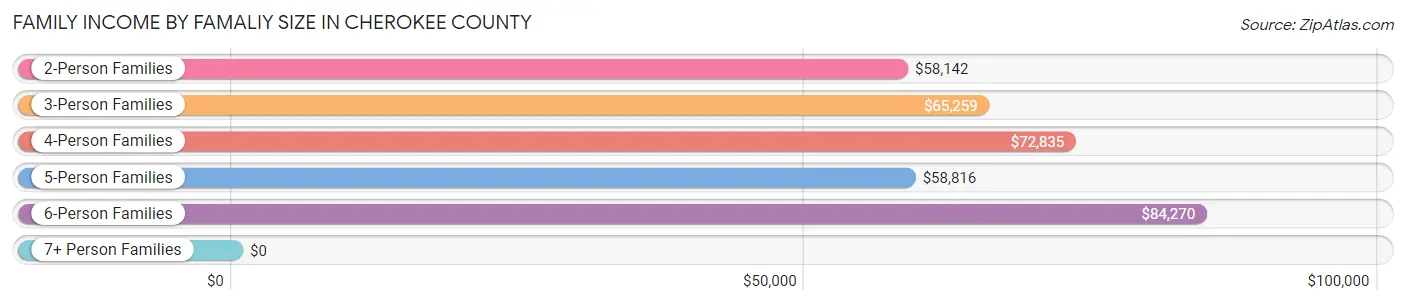
| Income Bracket | # Families | Median Income |
| 2-Person Families | 6,440 (49.2%) | $58,142 |
| 3-Person Families | 3,388 (25.9%) | $65,259 |
| 4-Person Families | 1,739 (13.3%) | $72,835 |
| 5-Person Families | 1,062 (8.1%) | $58,816 |
| 6-Person Families | 388 (3.0%) | $84,270 |
| 7+ Person Families | 67 (0.5%) | $0 |
| Total | 13,084 (100.0%) | $64,216 |
Family Income by Number of Earners in Cherokee County
The median family income in Cherokee County is $64,216, with families comprising 3+ earners (1,129) having the highest median family income of $123,988, while families with no earners (2,450) have the lowest median family income of $34,125, accounting for 8.6% and 18.7% of families, respectively.
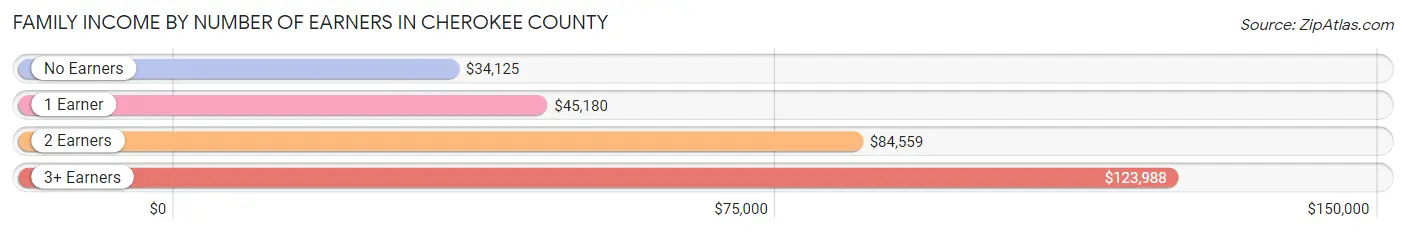
| Number of Earners | # Families | Median Income |
| No Earners | 2,450 (18.7%) | $34,125 |
| 1 Earner | 4,418 (33.8%) | $45,180 |
| 2 Earners | 5,087 (38.9%) | $84,559 |
| 3+ Earners | 1,129 (8.6%) | $123,988 |
| Total | 13,084 (100.0%) | $64,216 |
Household Income in Cherokee County
Household Income Brackets in Cherokee County
With 3,640 households falling in the category, the $50,000 to $74,999 income range is the most frequent in Cherokee County, accounting for 17.1% of all households. In contrast, only 639 households (3.0%) fall into the $200,000+ income bracket, making it the least populous group.
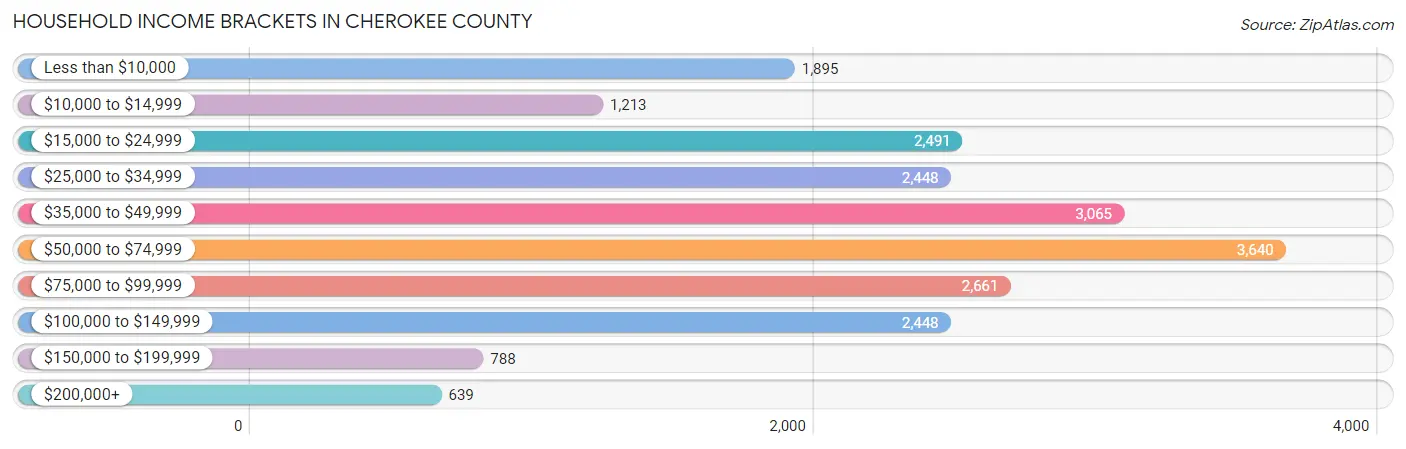
| Income Bracket | # Households | % Households |
| Less than $10,000 | 1,895 | 8.9% |
| $10,000 to $14,999 | 1,213 | 5.7% |
| $15,000 to $24,999 | 2,491 | 11.7% |
| $25,000 to $34,999 | 2,448 | 11.5% |
| $35,000 to $49,999 | 3,065 | 14.4% |
| $50,000 to $74,999 | 3,640 | 17.1% |
| $75,000 to $99,999 | 2,661 | 12.5% |
| $100,000 to $149,999 | 2,448 | 11.5% |
| $150,000 to $199,999 | 788 | 3.7% |
| $200,000+ | 639 | 3.0% |
Household Income by Householder Age in Cherokee County
The median household income in Cherokee County is $47,011, with the highest median household income of $57,461 found in the 45 to 64 years age bracket for the primary householder. A total of 8,071 households (37.9%) fall into this category. Meanwhile, the 15 to 24 years age bracket for the primary householder has the lowest median household income of $34,167, with 714 households (3.4%) in this group.
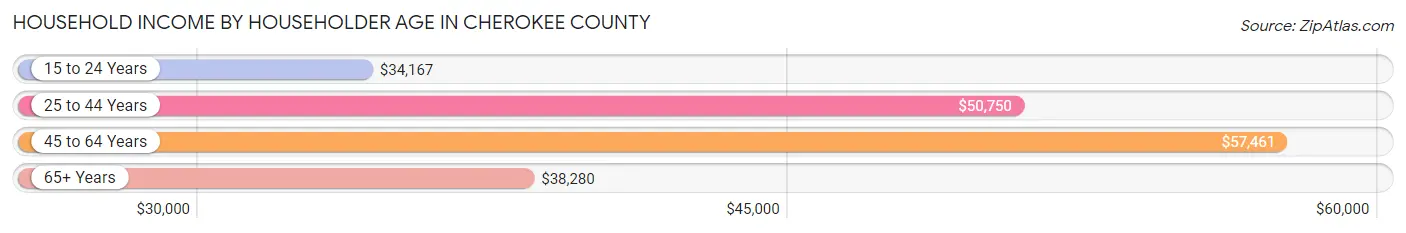
| Income Bracket | # Households | Median Income |
| 15 to 24 Years | 714 (3.4%) | $34,167 |
| 25 to 44 Years | 6,397 (30.0%) | $50,750 |
| 45 to 64 Years | 8,071 (37.9%) | $57,461 |
| 65+ Years | 6,106 (28.7%) | $38,280 |
| Total | 21,288 (100.0%) | $47,011 |
Poverty in Cherokee County
Income Below Poverty by Sex and Age in Cherokee County
With 14.7% poverty level for males and 21.1% for females among the residents of Cherokee County, 12 to 14 year old males and 15 year old females are the most vulnerable to poverty, with 284 males (36.3%) and 201 females (48.5%) in their respective age groups living below the poverty level.
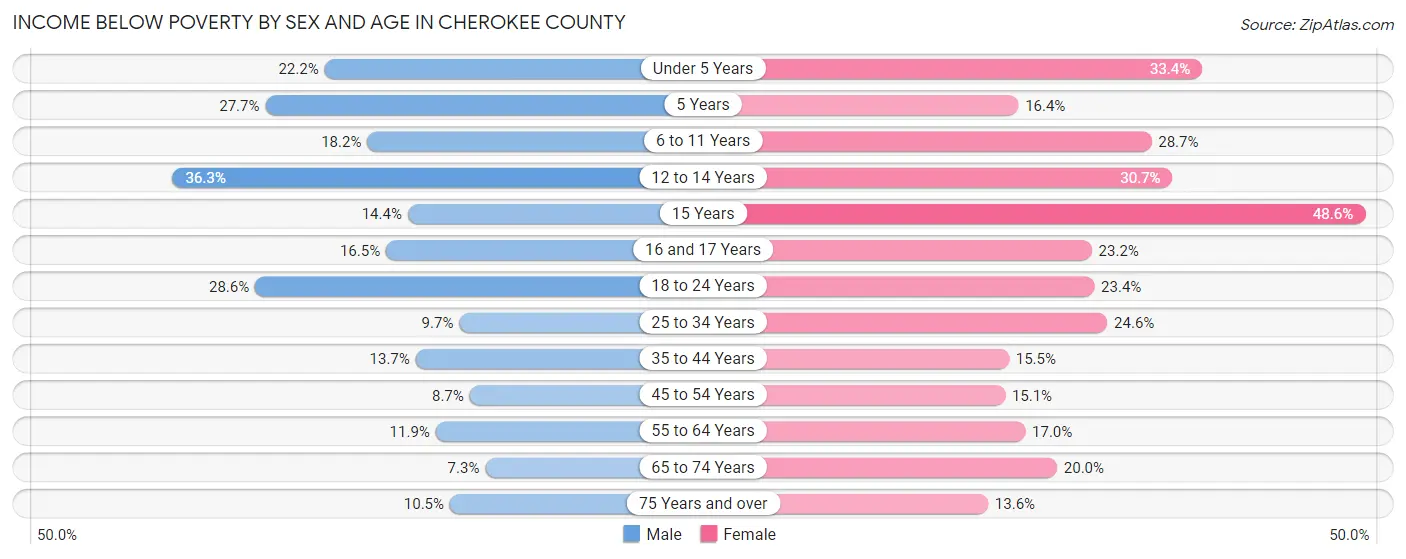
| Age Bracket | Male | Female |
| Under 5 Years | 358 (22.2%) | 569 (33.4%) |
| 5 Years | 109 (27.7%) | 64 (16.4%) |
| 6 to 11 Years | 429 (18.2%) | 575 (28.7%) |
| 12 to 14 Years | 284 (36.3%) | 355 (30.7%) |
| 15 Years | 52 (14.4%) | 201 (48.5%) |
| 16 and 17 Years | 119 (16.5%) | 154 (23.2%) |
| 18 to 24 Years | 747 (28.6%) | 509 (23.4%) |
| 25 to 34 Years | 341 (9.7%) | 926 (24.6%) |
| 35 to 44 Years | 420 (13.7%) | 516 (15.5%) |
| 45 to 54 Years | 319 (8.7%) | 561 (15.1%) |
| 55 to 64 Years | 440 (11.8%) | 642 (17.0%) |
| 65 to 74 Years | 199 (7.2%) | 594 (20.0%) |
| 75 Years and over | 151 (10.5%) | 287 (13.6%) |
| Total | 3,968 (14.7%) | 5,953 (21.1%) |
Income Above Poverty by Sex and Age in Cherokee County
According to the poverty statistics in Cherokee County, males aged 65 to 74 years and females aged 75 years and over are the age groups that are most secure financially, with 92.7% of males and 86.4% of females in these age groups living above the poverty line.
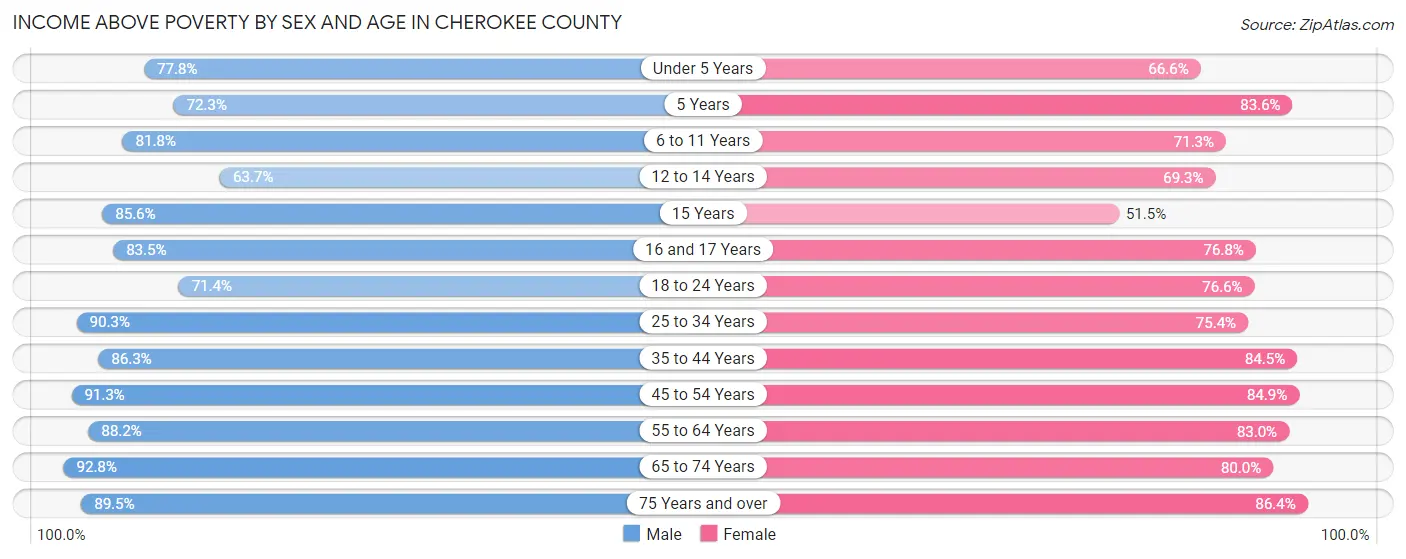
| Age Bracket | Male | Female |
| Under 5 Years | 1,257 (77.8%) | 1,133 (66.6%) |
| 5 Years | 285 (72.3%) | 327 (83.6%) |
| 6 to 11 Years | 1,928 (81.8%) | 1,427 (71.3%) |
| 12 to 14 Years | 499 (63.7%) | 802 (69.3%) |
| 15 Years | 308 (85.6%) | 213 (51.4%) |
| 16 and 17 Years | 604 (83.5%) | 510 (76.8%) |
| 18 to 24 Years | 1,864 (71.4%) | 1,664 (76.6%) |
| 25 to 34 Years | 3,190 (90.3%) | 2,833 (75.4%) |
| 35 to 44 Years | 2,644 (86.3%) | 2,813 (84.5%) |
| 45 to 54 Years | 3,346 (91.3%) | 3,145 (84.9%) |
| 55 to 64 Years | 3,274 (88.1%) | 3,132 (83.0%) |
| 65 to 74 Years | 2,545 (92.7%) | 2,382 (80.0%) |
| 75 Years and over | 1,283 (89.5%) | 1,830 (86.4%) |
| Total | 23,027 (85.3%) | 22,211 (78.9%) |
Income Below Poverty Among Married-Couple Families in Cherokee County
The poverty statistics for married-couple families in Cherokee County show that 4.9% or 440 of the total 9,041 families live below the poverty line. Families with 5 or more children have the highest poverty rate of 73.1%, comprising of 38 families. On the other hand, families with no children have the lowest poverty rate of 2.8%, which includes 164 families.
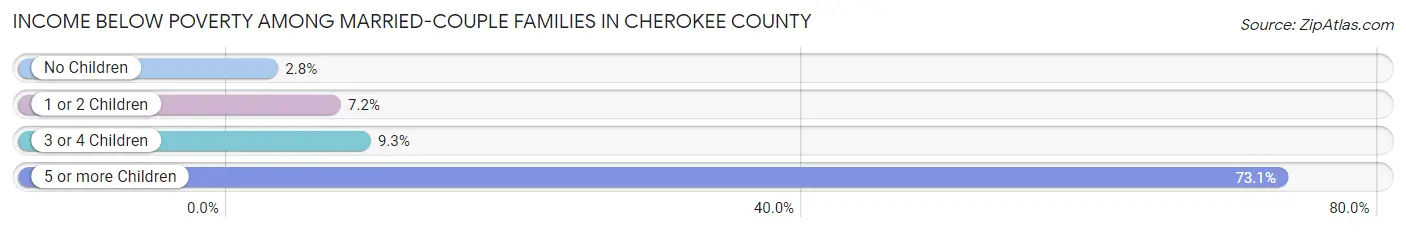
| Children | Above Poverty | Below Poverty |
| No Children | 5,662 (97.2%) | 164 (2.8%) |
| 1 or 2 Children | 2,445 (92.8%) | 189 (7.2%) |
| 3 or 4 Children | 480 (90.7%) | 49 (9.3%) |
| 5 or more Children | 14 (26.9%) | 38 (73.1%) |
| Total | 8,601 (95.1%) | 440 (4.9%) |
Income Below Poverty Among Single-Parent Households in Cherokee County
According to the poverty data in Cherokee County, 21.4% or 255 single-father households and 31.3% or 892 single-mother households are living below the poverty line. Among single-father households, those with 3 or 4 children have the highest poverty rate, with 86 households (58.5%) experiencing poverty. Likewise, among single-mother households, those with 3 or 4 children have the highest poverty rate, with 169 households (53.8%) falling below the poverty line.
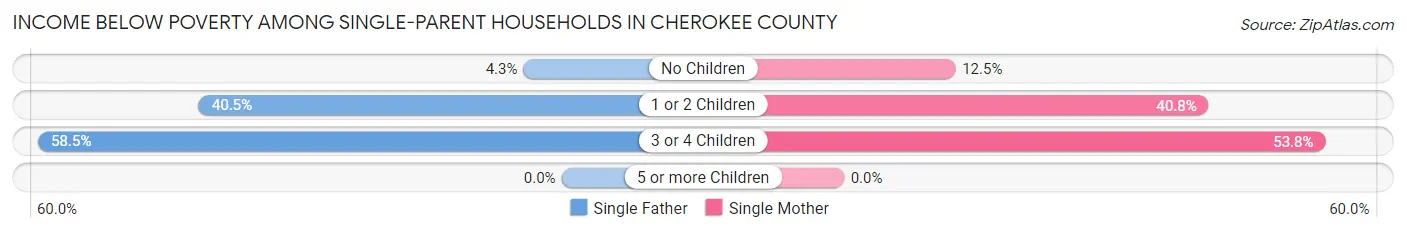
| Children | Single Father | Single Mother |
| No Children | 30 (4.3%) | 137 (12.5%) |
| 1 or 2 Children | 139 (40.5%) | 586 (40.8%) |
| 3 or 4 Children | 86 (58.5%) | 169 (53.8%) |
| 5 or more Children | 0 (0.0%) | 0 (0.0%) |
| Total | 255 (21.4%) | 892 (31.3%) |
Income Below Poverty Among Married-Couple vs Single-Parent Households in Cherokee County
The poverty data for Cherokee County shows that 440 of the married-couple family households (4.9%) and 1,147 of the single-parent households (28.4%) are living below the poverty level. Within the married-couple family households, those with 5 or more children have the highest poverty rate, with 38 households (73.1%) falling below the poverty line. Among the single-parent households, those with 3 or 4 children have the highest poverty rate, with 255 household (55.3%) living below poverty.
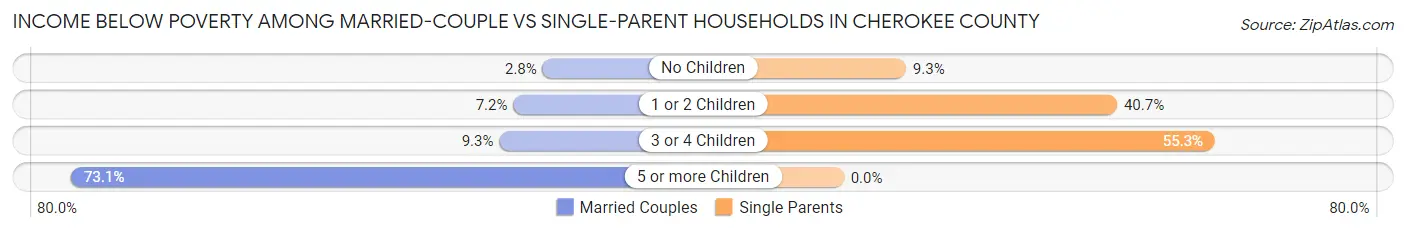
| Children | Married-Couple Families | Single-Parent Households |
| No Children | 164 (2.8%) | 167 (9.3%) |
| 1 or 2 Children | 189 (7.2%) | 725 (40.7%) |
| 3 or 4 Children | 49 (9.3%) | 255 (55.3%) |
| 5 or more Children | 38 (73.1%) | 0 (0.0%) |
| Total | 440 (4.9%) | 1,147 (28.4%) |
Race in Cherokee County
The most populous races in Cherokee County are White / Caucasian (40,494 | 72.1%), Black / African American (11,055 | 19.7%), and Two or more Races (2,857 | 5.1%).
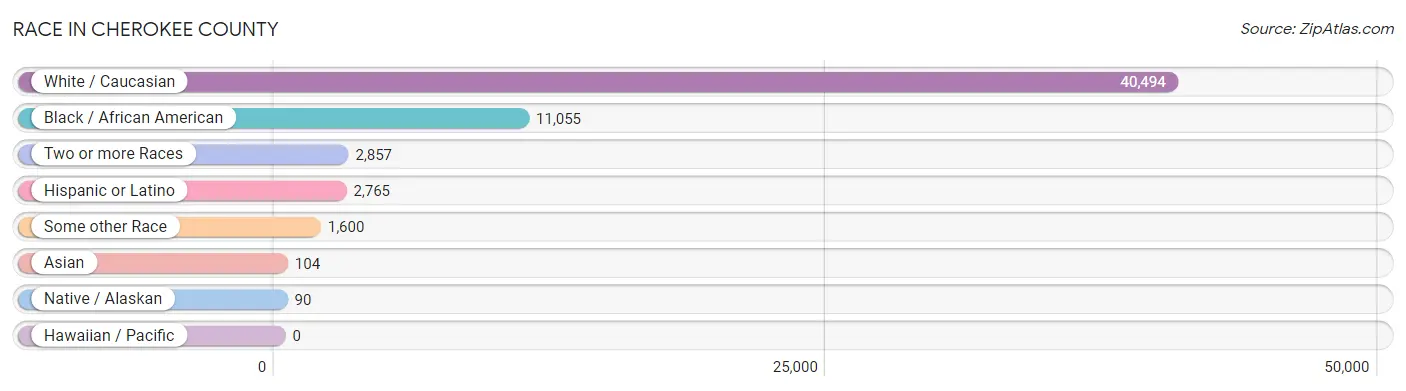
| Race | # Population | % Population |
| Asian | 104 | 0.2% |
| Black / African American | 11,055 | 19.7% |
| Hawaiian / Pacific | 0 | 0.0% |
| Hispanic or Latino | 2,765 | 4.9% |
| Native / Alaskan | 90 | 0.2% |
| White / Caucasian | 40,494 | 72.1% |
| Two or more Races | 2,857 | 5.1% |
| Some other Race | 1,600 | 2.9% |
| Total | 56,200 | 100.0% |
Ancestry in Cherokee County
The most populous ancestries reported in Cherokee County are American (8,886 | 15.8%), English (4,633 | 8.2%), Irish (4,149 | 7.4%), German (3,224 | 5.7%), and Mexican (1,730 | 3.1%), together accounting for 40.3% of all Cherokee County residents.
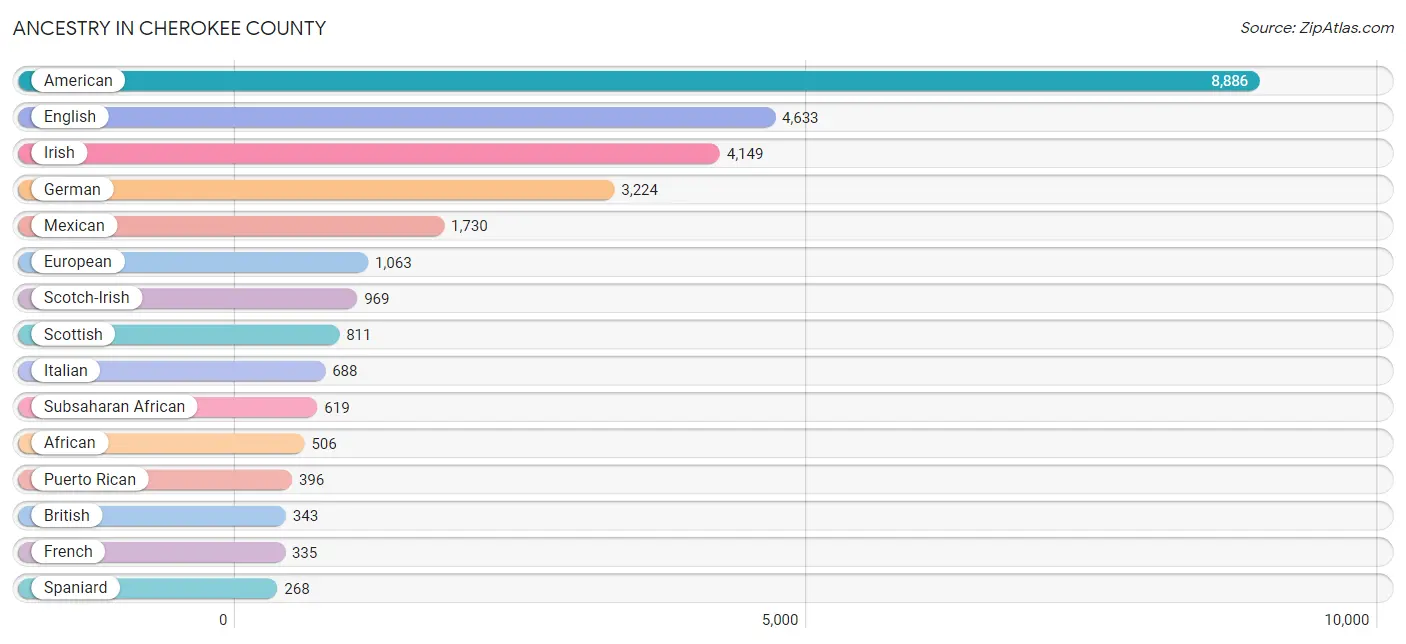
| Ancestry | # Population | % Population |
| African | 506 | 0.9% |
| American | 8,886 | 15.8% |
| Arab | 35 | 0.1% |
| Argentinean | 39 | 0.1% |
| Austrian | 35 | 0.1% |
| Barbadian | 2 | 0.0% |
| Blackfeet | 11 | 0.0% |
| Brazilian | 67 | 0.1% |
| British | 343 | 0.6% |
| Burmese | 31 | 0.1% |
| Canadian | 19 | 0.0% |
| Celtic | 44 | 0.1% |
| Central American | 211 | 0.4% |
| Cherokee | 110 | 0.2% |
| Cheyenne | 65 | 0.1% |
| Chippewa | 13 | 0.0% |
| Colombian | 37 | 0.1% |
| Croatian | 24 | 0.0% |
| Cuban | 44 | 0.1% |
| Czech | 16 | 0.0% |
| Dominican | 23 | 0.0% |
| Dutch | 235 | 0.4% |
| Eastern European | 11 | 0.0% |
| English | 4,633 | 8.2% |
| European | 1,063 | 1.9% |
| French | 335 | 0.6% |
| French Canadian | 98 | 0.2% |
| German | 3,224 | 5.7% |
| Greek | 118 | 0.2% |
| Guatemalan | 172 | 0.3% |
| Honduran | 12 | 0.0% |
| Hungarian | 25 | 0.0% |
| Indian (Asian) | 62 | 0.1% |
| Irish | 4,149 | 7.4% |
| Iroquois | 22 | 0.0% |
| Israeli | 146 | 0.3% |
| Italian | 688 | 1.2% |
| Japanese | 4 | 0.0% |
| Korean | 24 | 0.0% |
| Lebanese | 35 | 0.1% |
| Mexican | 1,730 | 3.1% |
| Native Hawaiian | 97 | 0.2% |
| Navajo | 53 | 0.1% |
| Nicaraguan | 21 | 0.0% |
| Nigerian | 68 | 0.1% |
| Northern European | 15 | 0.0% |
| Norwegian | 27 | 0.1% |
| Panamanian | 6 | 0.0% |
| Pennsylvania German | 5 | 0.0% |
| Polish | 249 | 0.4% |
| Portuguese | 171 | 0.3% |
| Potawatomi | 5 | 0.0% |
| Puerto Rican | 396 | 0.7% |
| Russian | 25 | 0.0% |
| Scandinavian | 231 | 0.4% |
| Scotch-Irish | 969 | 1.7% |
| Scottish | 811 | 1.4% |
| Slavic | 4 | 0.0% |
| Slovak | 36 | 0.1% |
| South African | 26 | 0.1% |
| South American | 76 | 0.1% |
| Spaniard | 268 | 0.5% |
| Spanish | 7 | 0.0% |
| Subsaharan African | 619 | 1.1% |
| Swedish | 132 | 0.2% |
| Swiss | 86 | 0.2% |
| Thai | 2 | 0.0% |
| Ukrainian | 31 | 0.1% |
| Ute | 3 | 0.0% |
| Welsh | 117 | 0.2% |
| West Indian | 57 | 0.1% | View All 71 Rows |
Immigrants in Cherokee County
The most numerous immigrant groups reported in Cherokee County came from Latin America (1,148 | 2.0%), Central America (931 | 1.7%), Mexico (925 | 1.7%), South America (159 | 0.3%), and Europe (130 | 0.2%), together accounting for 5.9% of all Cherokee County residents.
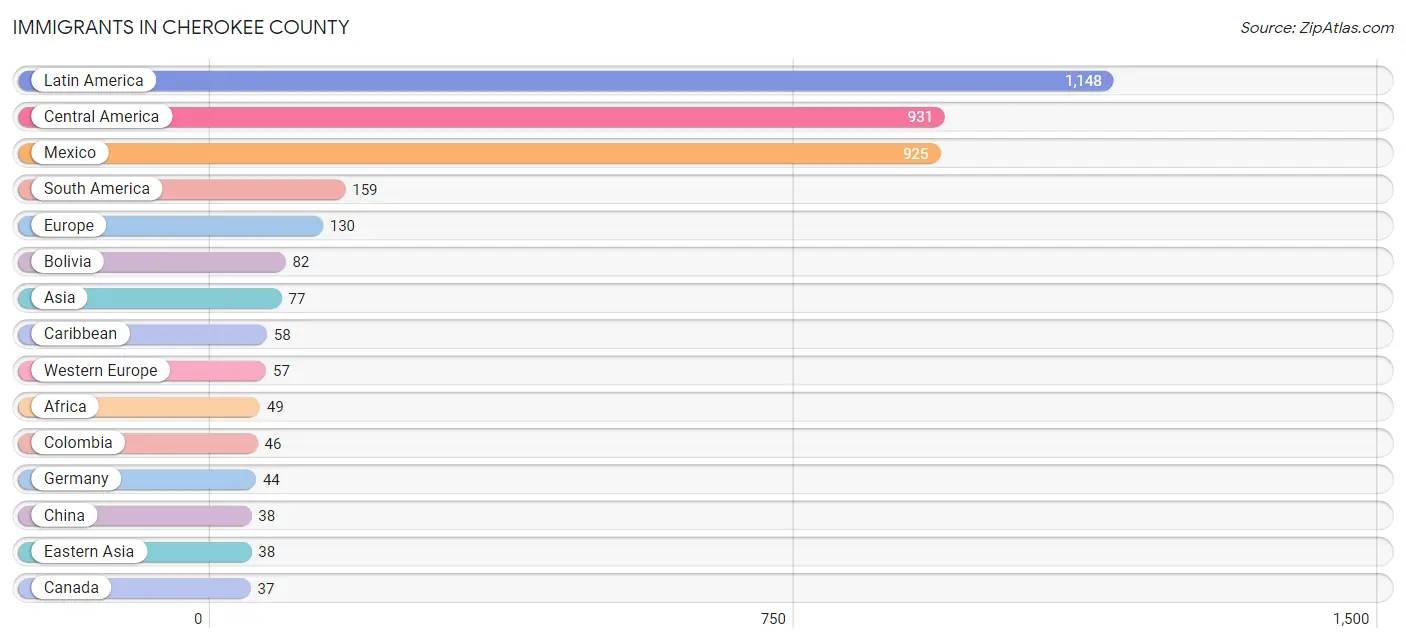
| Immigration Origin | # Population | % Population |
| Africa | 49 | 0.1% |
| Asia | 77 | 0.1% |
| Bolivia | 82 | 0.2% |
| Brazil | 31 | 0.1% |
| Cameroon | 19 | 0.0% |
| Canada | 37 | 0.1% |
| Caribbean | 58 | 0.1% |
| Central America | 931 | 1.7% |
| China | 38 | 0.1% |
| Colombia | 46 | 0.1% |
| Cuba | 24 | 0.0% |
| Dominican Republic | 11 | 0.0% |
| Eastern Asia | 38 | 0.1% |
| England | 23 | 0.0% |
| Europe | 130 | 0.2% |
| France | 13 | 0.0% |
| Germany | 44 | 0.1% |
| Greece | 9 | 0.0% |
| Haiti | 8 | 0.0% |
| Italy | 26 | 0.1% |
| Jamaica | 15 | 0.0% |
| Latin America | 1,148 | 2.0% |
| Mexico | 925 | 1.7% |
| Middle Africa | 19 | 0.0% |
| Northern Europe | 37 | 0.1% |
| Pakistan | 9 | 0.0% |
| Panama | 6 | 0.0% |
| Philippines | 26 | 0.1% |
| South Africa | 28 | 0.1% |
| South America | 159 | 0.3% |
| South Central Asia | 9 | 0.0% |
| South Eastern Asia | 30 | 0.1% |
| Southern Europe | 36 | 0.1% |
| Spain | 1 | 0.0% |
| Sweden | 2 | 0.0% |
| Taiwan | 2 | 0.0% |
| Thailand | 4 | 0.0% |
| Western Europe | 57 | 0.1% | View All 38 Rows |
Sex and Age in Cherokee County
Sex and Age in Cherokee County
The most populous age groups in Cherokee County are 60 to 64 Years (2,024 | 7.4%) for men and 55 to 59 Years (1,980 | 6.9%) for women.
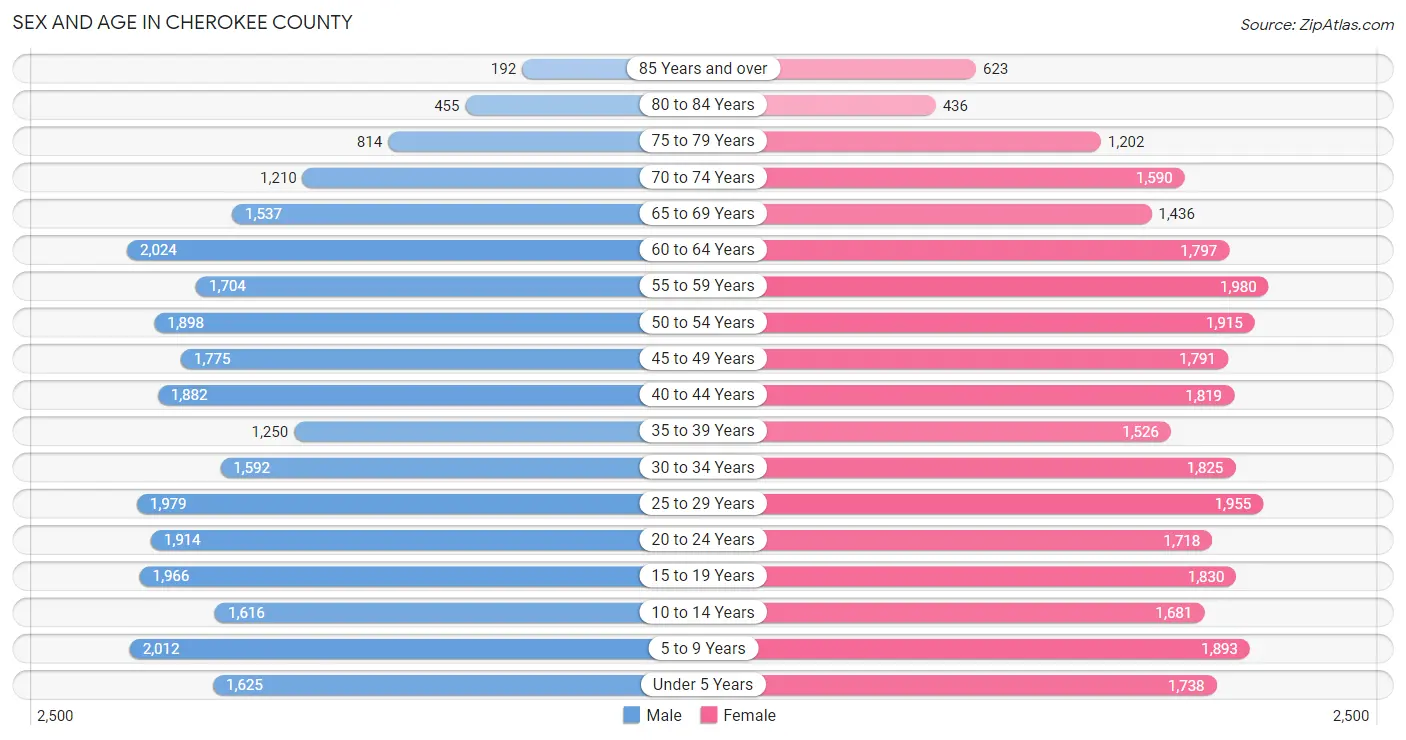
| Age Bracket | Male | Female |
| Under 5 Years | 1,625 (5.9%) | 1,738 (6.0%) |
| 5 to 9 Years | 2,012 (7.3%) | 1,893 (6.6%) |
| 10 to 14 Years | 1,616 (5.9%) | 1,681 (5.9%) |
| 15 to 19 Years | 1,966 (7.2%) | 1,830 (6.4%) |
| 20 to 24 Years | 1,914 (7.0%) | 1,718 (6.0%) |
| 25 to 29 Years | 1,979 (7.2%) | 1,955 (6.8%) |
| 30 to 34 Years | 1,592 (5.8%) | 1,825 (6.4%) |
| 35 to 39 Years | 1,250 (4.5%) | 1,526 (5.3%) |
| 40 to 44 Years | 1,882 (6.9%) | 1,819 (6.3%) |
| 45 to 49 Years | 1,775 (6.5%) | 1,791 (6.2%) |
| 50 to 54 Years | 1,898 (6.9%) | 1,915 (6.7%) |
| 55 to 59 Years | 1,704 (6.2%) | 1,980 (6.9%) |
| 60 to 64 Years | 2,024 (7.4%) | 1,797 (6.2%) |
| 65 to 69 Years | 1,537 (5.6%) | 1,436 (5.0%) |
| 70 to 74 Years | 1,210 (4.4%) | 1,590 (5.5%) |
| 75 to 79 Years | 814 (3.0%) | 1,202 (4.2%) |
| 80 to 84 Years | 455 (1.7%) | 436 (1.5%) |
| 85 Years and over | 192 (0.7%) | 623 (2.2%) |
| Total | 27,445 (100.0%) | 28,755 (100.0%) |
Families and Households in Cherokee County
Median Family Size in Cherokee County
The median family size in Cherokee County is 3.37 persons per family, with single female/mother families (2,850 | 21.8%) accounting for the largest median family size of 3.74 persons per family. On the other hand, married-couple families (9,041 | 69.1%) represent the smallest median family size with 3.27 persons per family.
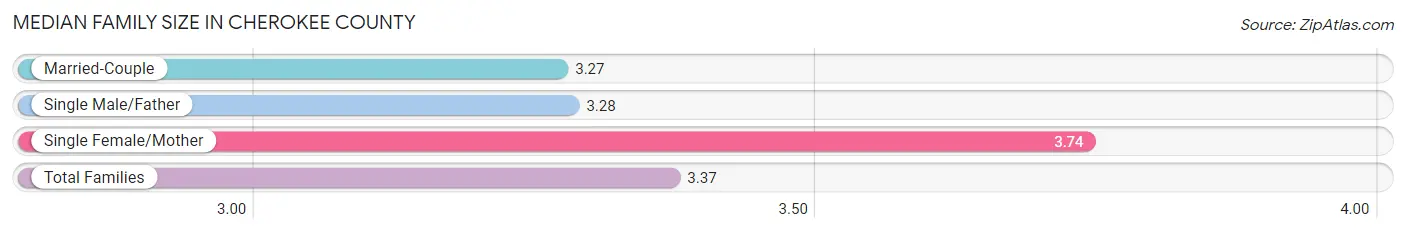
| Family Type | # Families | Family Size |
| Married-Couple | 9,041 (69.1%) | 3.27 |
| Single Male/Father | 1,193 (9.1%) | 3.28 |
| Single Female/Mother | 2,850 (21.8%) | 3.74 |
| Total Families | 13,084 (100.0%) | 3.37 |
Median Household Size in Cherokee County
The median household size in Cherokee County is 2.59 persons per household, with single female/mother households (2,850 | 13.4%) accounting for the largest median household size of 3.94 persons per household. non-family households (8,204 | 38.5%) represent the smallest median household size with 1.18 persons per household.
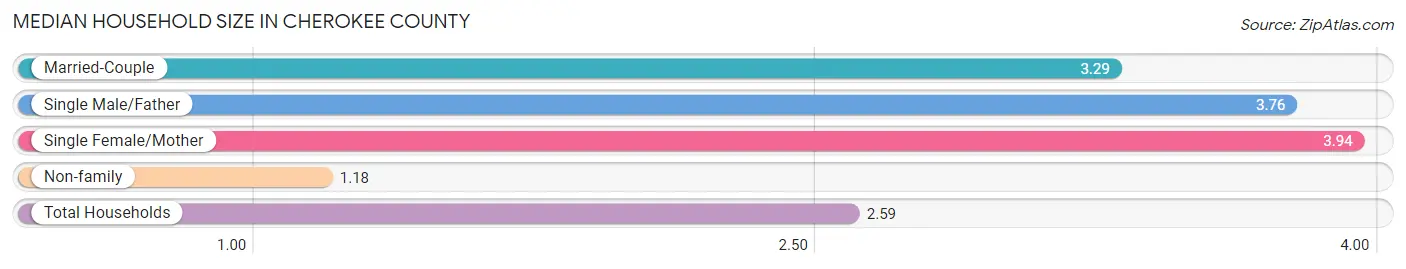
| Household Type | # Households | Household Size |
| Married-Couple | 9,041 (42.5%) | 3.29 |
| Single Male/Father | 1,193 (5.6%) | 3.76 |
| Single Female/Mother | 2,850 (13.4%) | 3.94 |
| Non-family | 8,204 (38.5%) | 1.18 |
| Total Households | 21,288 (100.0%) | 2.59 |
Household Size by Marriage Status in Cherokee County
Out of a total of 21,288 households in Cherokee County, 13,084 (61.5%) are family households, while 8,204 (38.5%) are nonfamily households. The most numerous type of family households are 2-person households, comprising 6,272, and the most common type of nonfamily households are 1-person households, comprising 7,301.
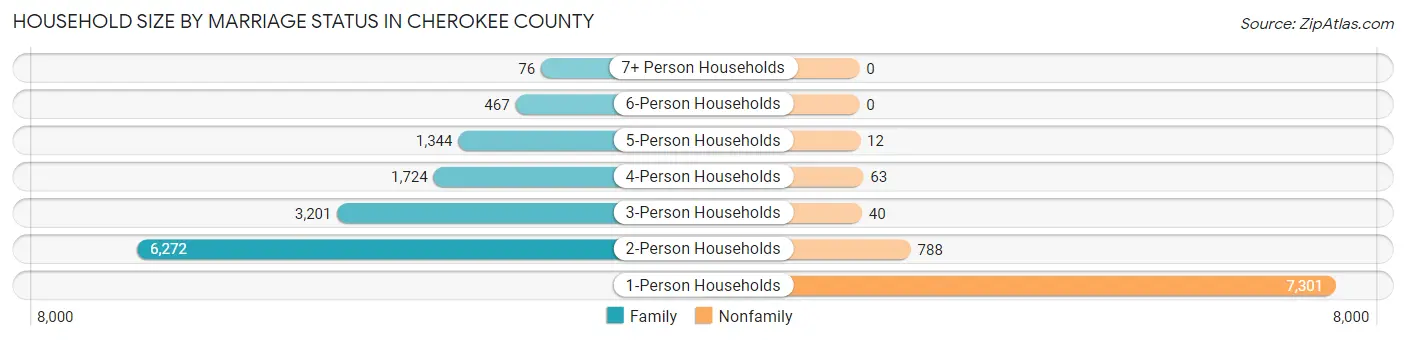
| Household Size | Family Households | Nonfamily Households |
| 1-Person Households | - | 7,301 (34.3%) |
| 2-Person Households | 6,272 (29.5%) | 788 (3.7%) |
| 3-Person Households | 3,201 (15.0%) | 40 (0.2%) |
| 4-Person Households | 1,724 (8.1%) | 63 (0.3%) |
| 5-Person Households | 1,344 (6.3%) | 12 (0.1%) |
| 6-Person Households | 467 (2.2%) | 0 (0.0%) |
| 7+ Person Households | 76 (0.4%) | 0 (0.0%) |
| Total | 13,084 (61.5%) | 8,204 (38.5%) |
Female Fertility in Cherokee County
Fertility by Age in Cherokee County
Average fertility rate in Cherokee County is 64.0 births per 1,000 women. Women in the age bracket of 20 to 34 years have the highest fertility rate with 129.0 births per 1,000 women. Women in the age bracket of 20 to 34 years acount for 87.5% of all women with births.
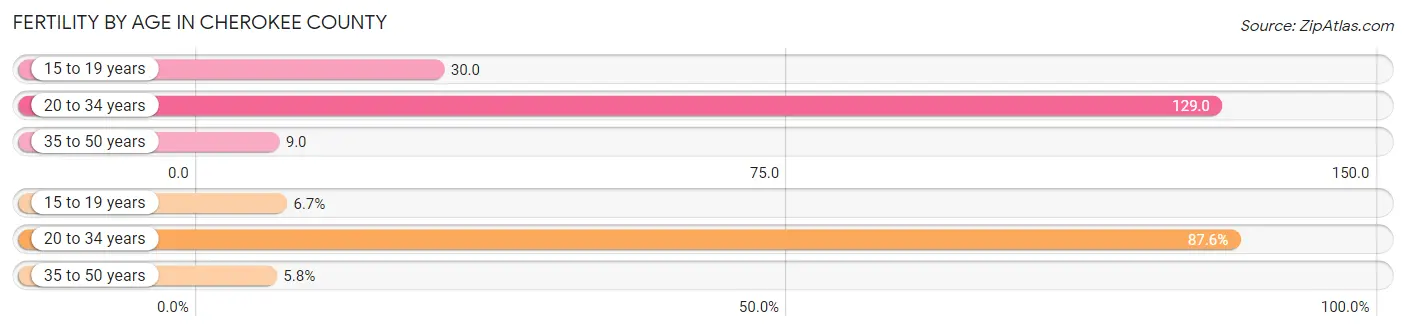
| Age Bracket | Women with Births | Births / 1,000 Women |
| 15 to 19 years | 54 (6.7%) | 30.0 |
| 20 to 34 years | 710 (87.5%) | 129.0 |
| 35 to 50 years | 47 (5.8%) | 9.0 |
| Total | 811 (100.0%) | 64.0 |
Fertility by Age by Marriage Status in Cherokee County
35.9% of women with births (811) in Cherokee County are married. The highest percentage of unmarried women with births falls into 35 to 50 years age bracket with 74.5% of them unmarried at the time of birth, while the lowest percentage of unmarried women with births belong to 15 to 19 years age bracket with 38.9% of them unmarried.
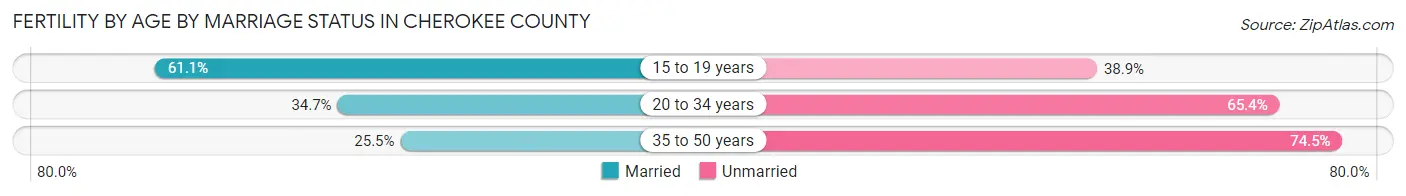
| Age Bracket | Married | Unmarried |
| 15 to 19 years | 33 (61.1%) | 21 (38.9%) |
| 20 to 34 years | 246 (34.6%) | 464 (65.3%) |
| 35 to 50 years | 12 (25.5%) | 35 (74.5%) |
| Total | 291 (35.9%) | 520 (64.1%) |
Fertility by Education in Cherokee County
Average fertility rate in Cherokee County is 64.0 births per 1,000 women. Women with the education attainment of college or associate's degree have the highest fertility rate of 89.0 births per 1,000 women, while women with the education attainment of less than high school have the lowest fertility at 22.0 births per 1,000 women. Women with the education attainment of college or associate's degree represent 46.1% of all women with births.
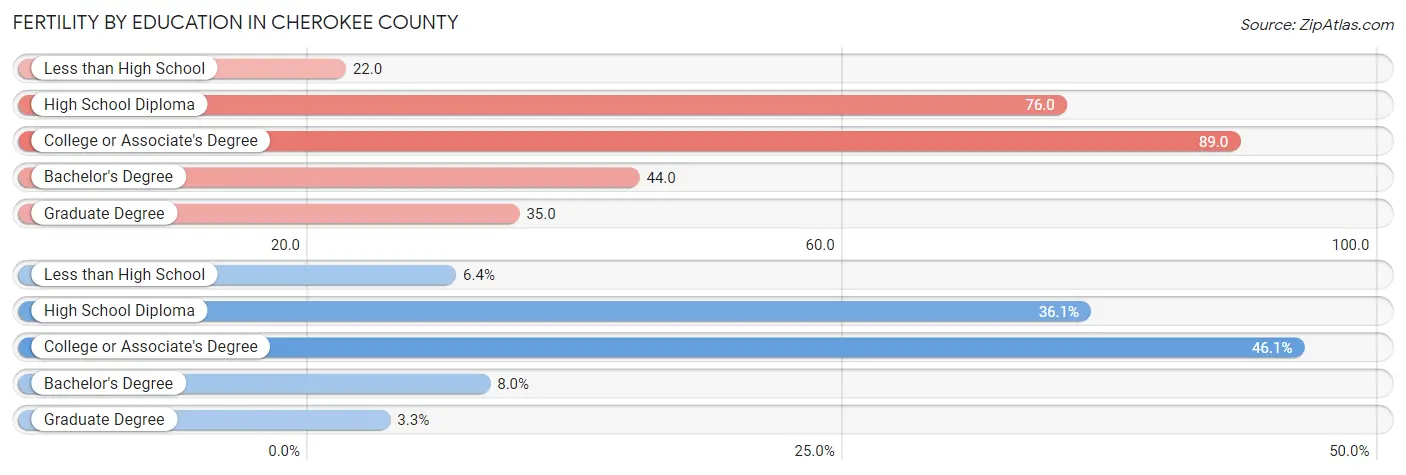
| Educational Attainment | Women with Births | Births / 1,000 Women |
| Less than High School | 52 (6.4%) | 22.0 |
| High School Diploma | 293 (36.1%) | 76.0 |
| College or Associate's Degree | 374 (46.1%) | 89.0 |
| Bachelor's Degree | 65 (8.0%) | 44.0 |
| Graduate Degree | 27 (3.3%) | 35.0 |
| Total | 811 (100.0%) | 64.0 |
Fertility by Education by Marriage Status in Cherokee County
64.1% of women with births in Cherokee County are unmarried. Women with the educational attainment of graduate degree are most likely to be married with 100.0% of them married at childbirth, while women with the educational attainment of college or associate's degree are least likely to be married with 86.1% of them unmarried at childbirth.
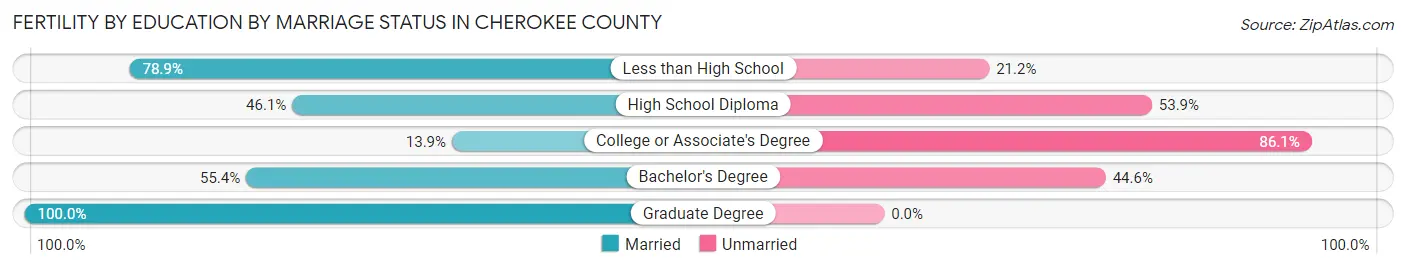
| Educational Attainment | Married | Unmarried |
| Less than High School | 41 (78.8%) | 11 (21.1%) |
| High School Diploma | 135 (46.1%) | 158 (53.9%) |
| College or Associate's Degree | 52 (13.9%) | 322 (86.1%) |
| Bachelor's Degree | 36 (55.4%) | 29 (44.6%) |
| Graduate Degree | 27 (100.0%) | 0 (0.0%) |
| Total | 291 (35.9%) | 520 (64.1%) |
Employment Characteristics in Cherokee County
Employment by Class of Employer in Cherokee County
Among the 23,919 employed individuals in Cherokee County, private company employees (16,984 | 71.0%), local government employees (1,991 | 8.3%), and not-for-profit organizations (1,429 | 6.0%) make up the most common classes of employment.
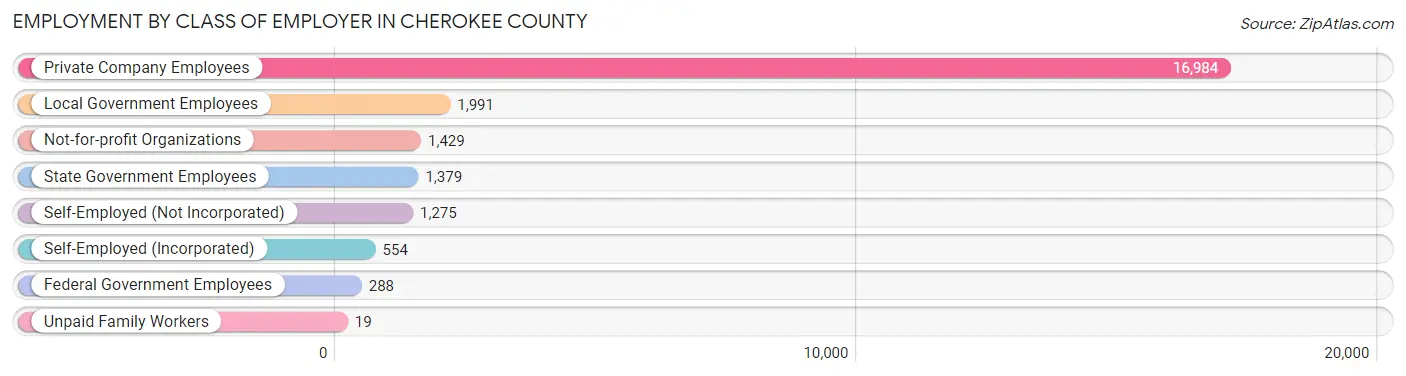
| Employer Class | # Employees | % Employees |
| Private Company Employees | 16,984 | 71.0% |
| Self-Employed (Incorporated) | 554 | 2.3% |
| Self-Employed (Not Incorporated) | 1,275 | 5.3% |
| Not-for-profit Organizations | 1,429 | 6.0% |
| Local Government Employees | 1,991 | 8.3% |
| State Government Employees | 1,379 | 5.8% |
| Federal Government Employees | 288 | 1.2% |
| Unpaid Family Workers | 19 | 0.1% |
| Total | 23,919 | 100.0% |
Employment Status by Age in Cherokee County
According to the labor force statistics for Cherokee County, out of the total population over 16 years of age (44,860), 57.6% or 25,839 individuals are in the labor force, with 5.9% or 1,525 of them unemployed. The age group with the highest labor force participation rate is 35 to 44 years, with 79.3% or 5,136 individuals in the labor force. Within the labor force, the 16 to 19 years age range has the highest percentage of unemployed individuals, with 28.9% or 389 of them being unemployed.
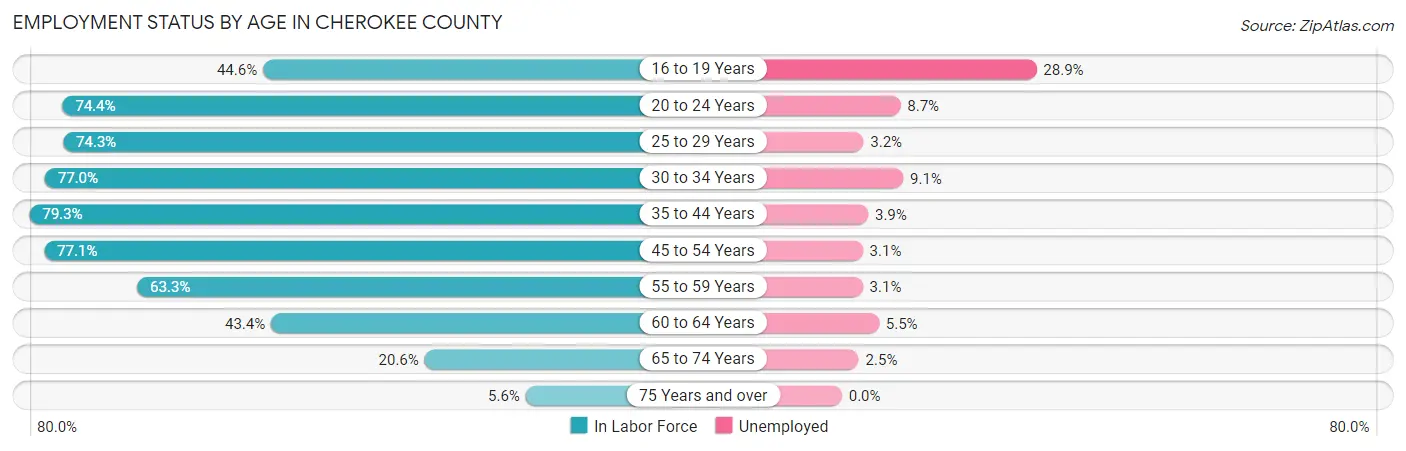
| Age Bracket | In Labor Force | Unemployed |
| 16 to 19 Years | 1,347 (44.6%) | 389 (28.9%) |
| 20 to 24 Years | 2,702 (74.4%) | 235 (8.7%) |
| 25 to 29 Years | 2,923 (74.3%) | 94 (3.2%) |
| 30 to 34 Years | 2,631 (77.0%) | 239 (9.1%) |
| 35 to 44 Years | 5,136 (79.3%) | 200 (3.9%) |
| 45 to 54 Years | 5,689 (77.1%) | 176 (3.1%) |
| 55 to 59 Years | 2,332 (63.3%) | 72 (3.1%) |
| 60 to 64 Years | 1,658 (43.4%) | 91 (5.5%) |
| 65 to 74 Years | 1,189 (20.6%) | 30 (2.5%) |
| 75 Years and over | 208 (5.6%) | 0 (0.0%) |
| Total | 25,839 (57.6%) | 1,525 (5.9%) |
Employment Status by Educational Attainment in Cherokee County
According to labor force statistics for Cherokee County, 71.0% of individuals (20,386) out of the total population between 25 and 64 years of age (28,712) are in the labor force, with 4.3% or 877 of them being unemployed. The group with the highest labor force participation rate are those with the educational attainment of bachelor's degree or higher, with 81.9% or 4,218 individuals in the labor force. Within the labor force, individuals with less than high school education have the highest percentage of unemployment, with 10.4% or 203 of them being unemployed.
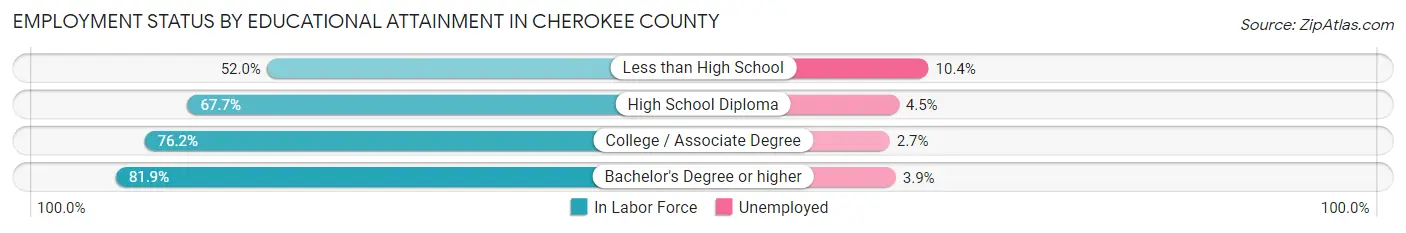
| Educational Attainment | In Labor Force | Unemployed |
| Less than High School | 1,953 (52.0%) | 391 (10.4%) |
| High School Diploma | 7,045 (67.7%) | 468 (4.5%) |
| College / Associate Degree | 7,164 (76.2%) | 254 (2.7%) |
| Bachelor's Degree or higher | 4,218 (81.9%) | 201 (3.9%) |
| Total | 20,386 (71.0%) | 1,235 (4.3%) |
Employment Occupations by Sex in Cherokee County
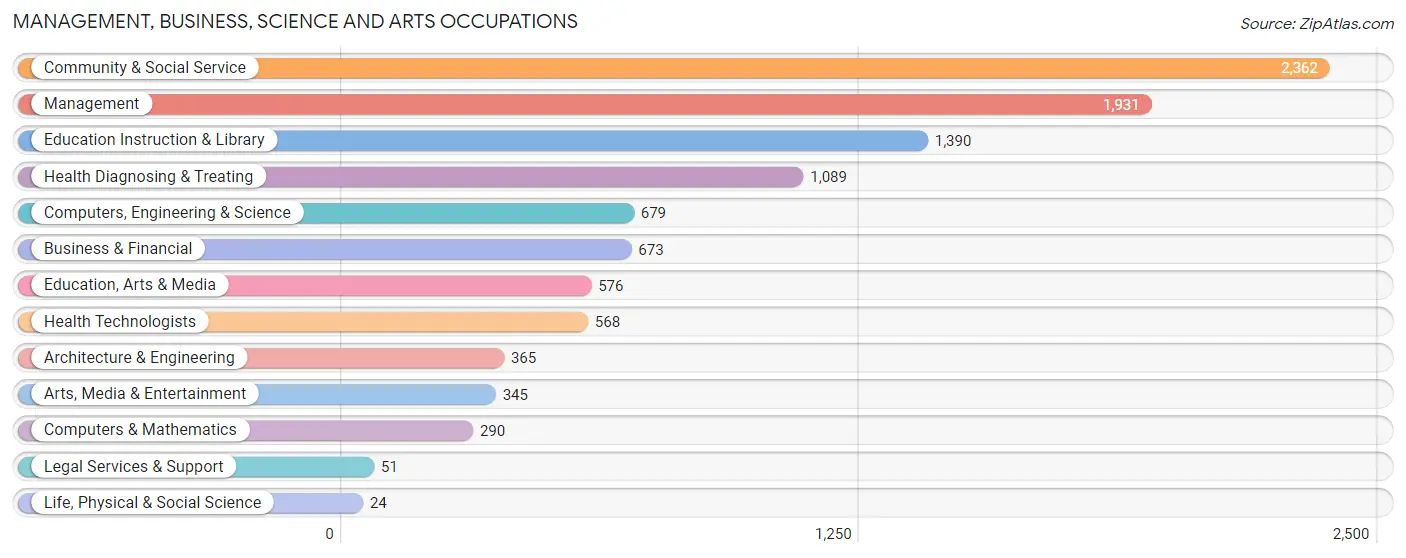
Management, Business, Science and Arts Occupations
The most common Management, Business, Science and Arts occupations in Cherokee County are Community & Social Service (2,362 | 9.8%), Management (1,931 | 8.0%), Education Instruction & Library (1,390 | 5.7%), Health Diagnosing & Treating (1,089 | 4.5%), and Computers, Engineering & Science (679 | 2.8%).
Management, Business, Science and Arts Occupations by Sex
Within the Management, Business, Science and Arts occupations in Cherokee County, the most male-oriented occupations are Life, Physical & Social Science (100.0%), Architecture & Engineering (79.4%), and Arts, Media & Entertainment (75.9%), while the most female-oriented occupations are Health Diagnosing & Treating (85.7%), Education Instruction & Library (80.0%), and Health Technologists (78.7%).
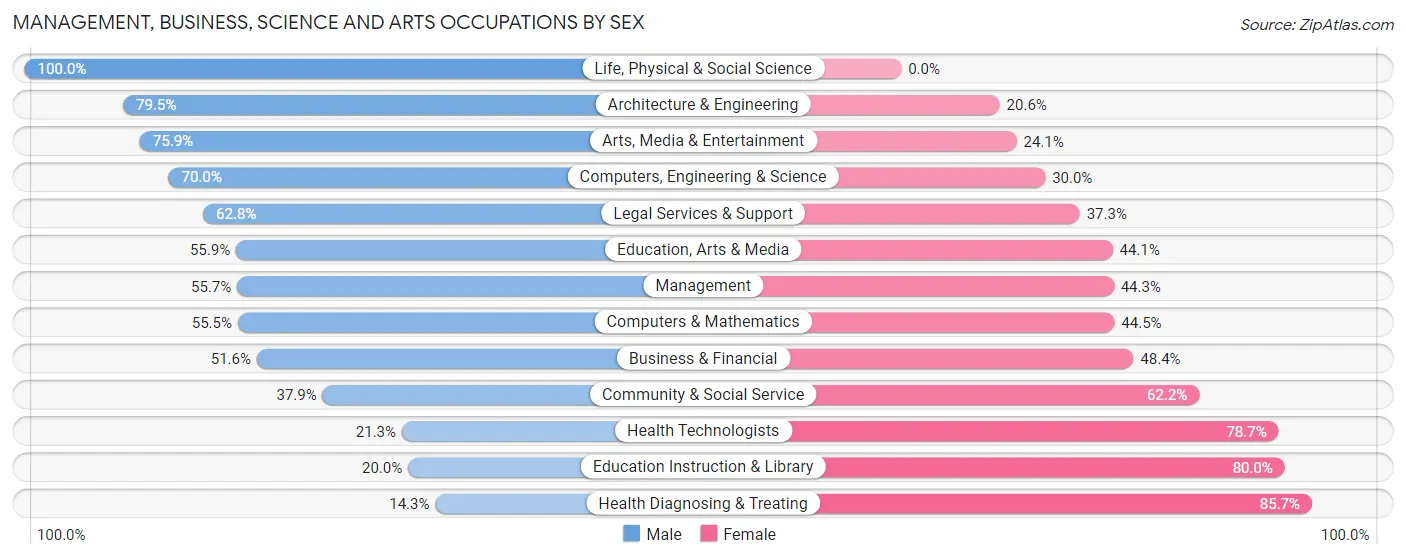
| Occupation | Male | Female |
| Management | 1,075 (55.7%) | 856 (44.3%) |
| Business & Financial | 347 (51.6%) | 326 (48.4%) |
| Computers, Engineering & Science | 475 (70.0%) | 204 (30.0%) |
| Computers & Mathematics | 161 (55.5%) | 129 (44.5%) |
| Architecture & Engineering | 290 (79.4%) | 75 (20.5%) |
| Life, Physical & Social Science | 24 (100.0%) | 0 (0.0%) |
| Community & Social Service | 894 (37.9%) | 1,468 (62.2%) |
| Education, Arts & Media | 322 (55.9%) | 254 (44.1%) |
| Legal Services & Support | 32 (62.7%) | 19 (37.2%) |
| Education Instruction & Library | 278 (20.0%) | 1,112 (80.0%) |
| Arts, Media & Entertainment | 262 (75.9%) | 83 (24.1%) |
| Health Diagnosing & Treating | 156 (14.3%) | 933 (85.7%) |
| Health Technologists | 121 (21.3%) | 447 (78.7%) |
| Total (Category) | 2,947 (43.8%) | 3,787 (56.2%) |
| Total (Overall) | 13,130 (54.2%) | 11,082 (45.8%) |
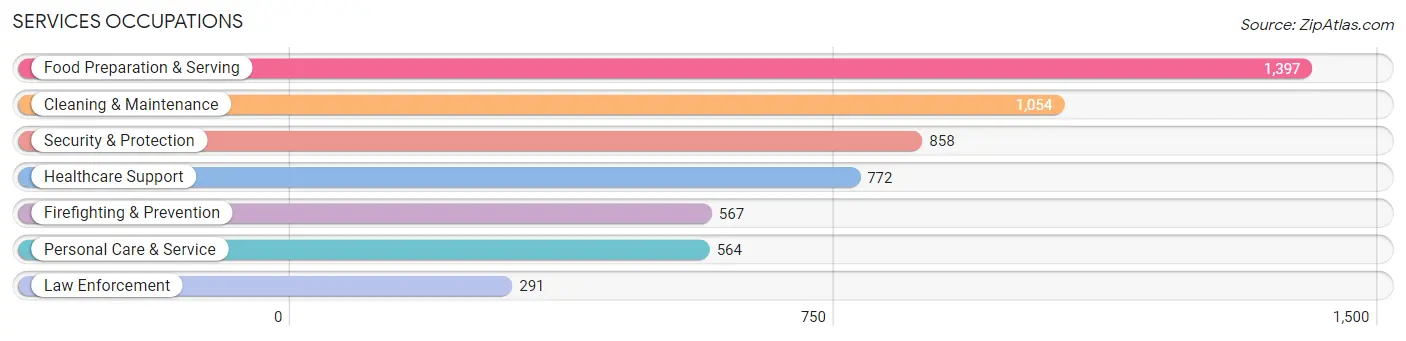
Services Occupations
The most common Services occupations in Cherokee County are Food Preparation & Serving (1,397 | 5.8%), Cleaning & Maintenance (1,054 | 4.3%), Security & Protection (858 | 3.5%), Healthcare Support (772 | 3.2%), and Firefighting & Prevention (567 | 2.3%).
Services Occupations by Sex
Within the Services occupations in Cherokee County, the most male-oriented occupations are Firefighting & Prevention (93.6%), Security & Protection (82.4%), and Cleaning & Maintenance (77.4%), while the most female-oriented occupations are Healthcare Support (98.7%), Personal Care & Service (84.0%), and Food Preparation & Serving (59.9%).
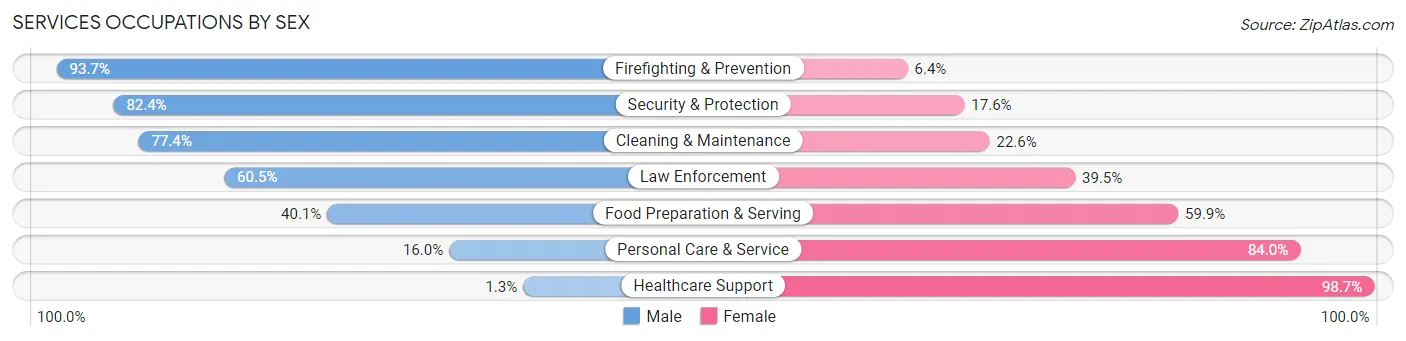
| Occupation | Male | Female |
| Healthcare Support | 10 (1.3%) | 762 (98.7%) |
| Security & Protection | 707 (82.4%) | 151 (17.6%) |
| Firefighting & Prevention | 531 (93.6%) | 36 (6.4%) |
| Law Enforcement | 176 (60.5%) | 115 (39.5%) |
| Food Preparation & Serving | 560 (40.1%) | 837 (59.9%) |
| Cleaning & Maintenance | 816 (77.4%) | 238 (22.6%) |
| Personal Care & Service | 90 (16.0%) | 474 (84.0%) |
| Total (Category) | 2,183 (47.0%) | 2,462 (53.0%) |
| Total (Overall) | 13,130 (54.2%) | 11,082 (45.8%) |
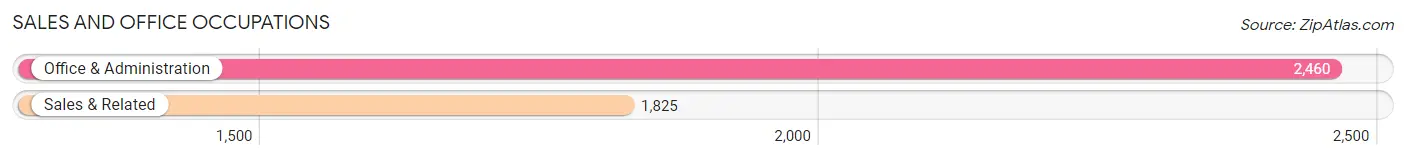
Sales and Office Occupations
The most common Sales and Office occupations in Cherokee County are Office & Administration (2,460 | 10.2%), and Sales & Related (1,825 | 7.5%).
Sales and Office Occupations by Sex
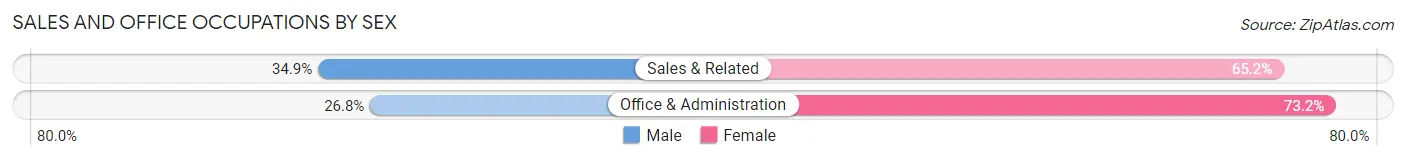
| Occupation | Male | Female |
| Sales & Related | 636 (34.8%) | 1,189 (65.1%) |
| Office & Administration | 660 (26.8%) | 1,800 (73.2%) |
| Total (Category) | 1,296 (30.2%) | 2,989 (69.8%) |
| Total (Overall) | 13,130 (54.2%) | 11,082 (45.8%) |
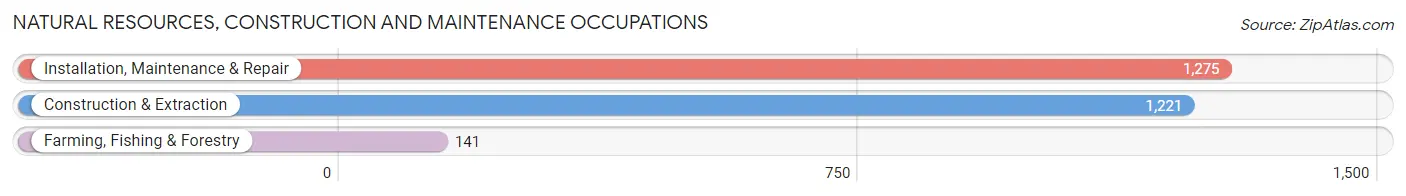
Natural Resources, Construction and Maintenance Occupations
The most common Natural Resources, Construction and Maintenance occupations in Cherokee County are Installation, Maintenance & Repair (1,275 | 5.3%), Construction & Extraction (1,221 | 5.0%), and Farming, Fishing & Forestry (141 | 0.6%).
Natural Resources, Construction and Maintenance Occupations by Sex
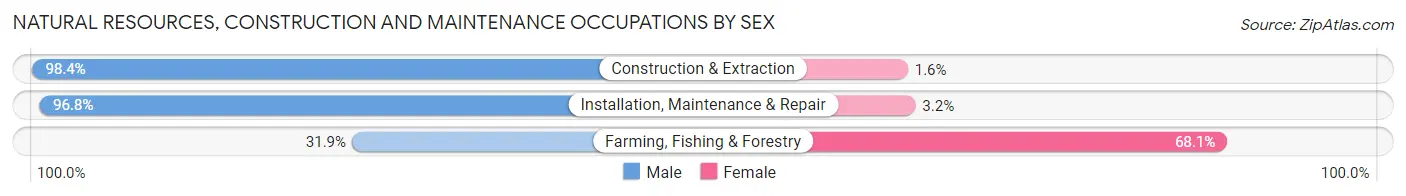
| Occupation | Male | Female |
| Farming, Fishing & Forestry | 45 (31.9%) | 96 (68.1%) |
| Construction & Extraction | 1,201 (98.4%) | 20 (1.6%) |
| Installation, Maintenance & Repair | 1,234 (96.8%) | 41 (3.2%) |
| Total (Category) | 2,480 (94.1%) | 157 (5.9%) |
| Total (Overall) | 13,130 (54.2%) | 11,082 (45.8%) |
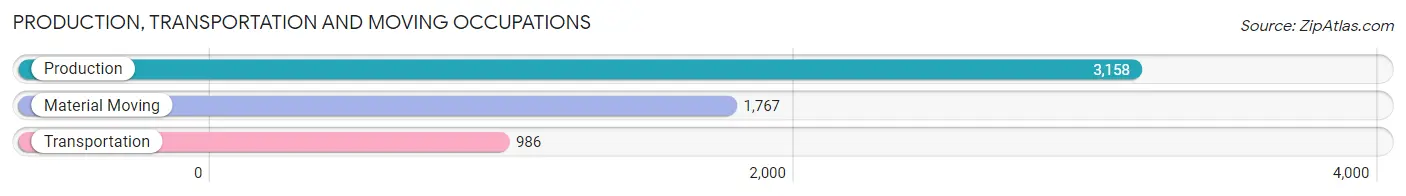
Production, Transportation and Moving Occupations
The most common Production, Transportation and Moving occupations in Cherokee County are Production (3,158 | 13.0%), Material Moving (1,767 | 7.3%), and Transportation (986 | 4.1%).
Production, Transportation and Moving Occupations by Sex
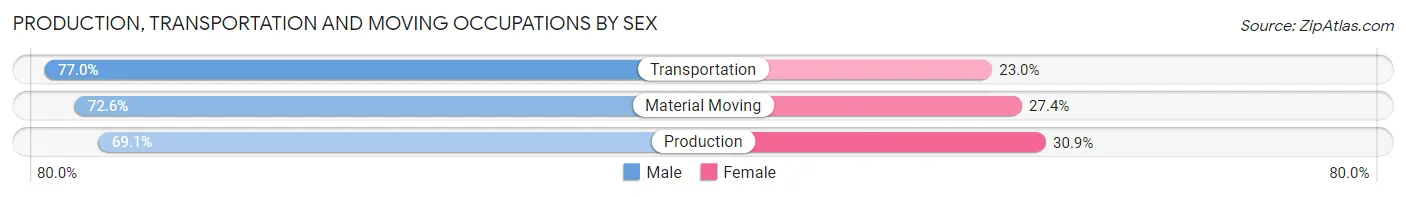
| Occupation | Male | Female |
| Production | 2,182 (69.1%) | 976 (30.9%) |
| Transportation | 759 (77.0%) | 227 (23.0%) |
| Material Moving | 1,283 (72.6%) | 484 (27.4%) |
| Total (Category) | 4,224 (71.5%) | 1,687 (28.5%) |
| Total (Overall) | 13,130 (54.2%) | 11,082 (45.8%) |
Employment Industries by Sex in Cherokee County
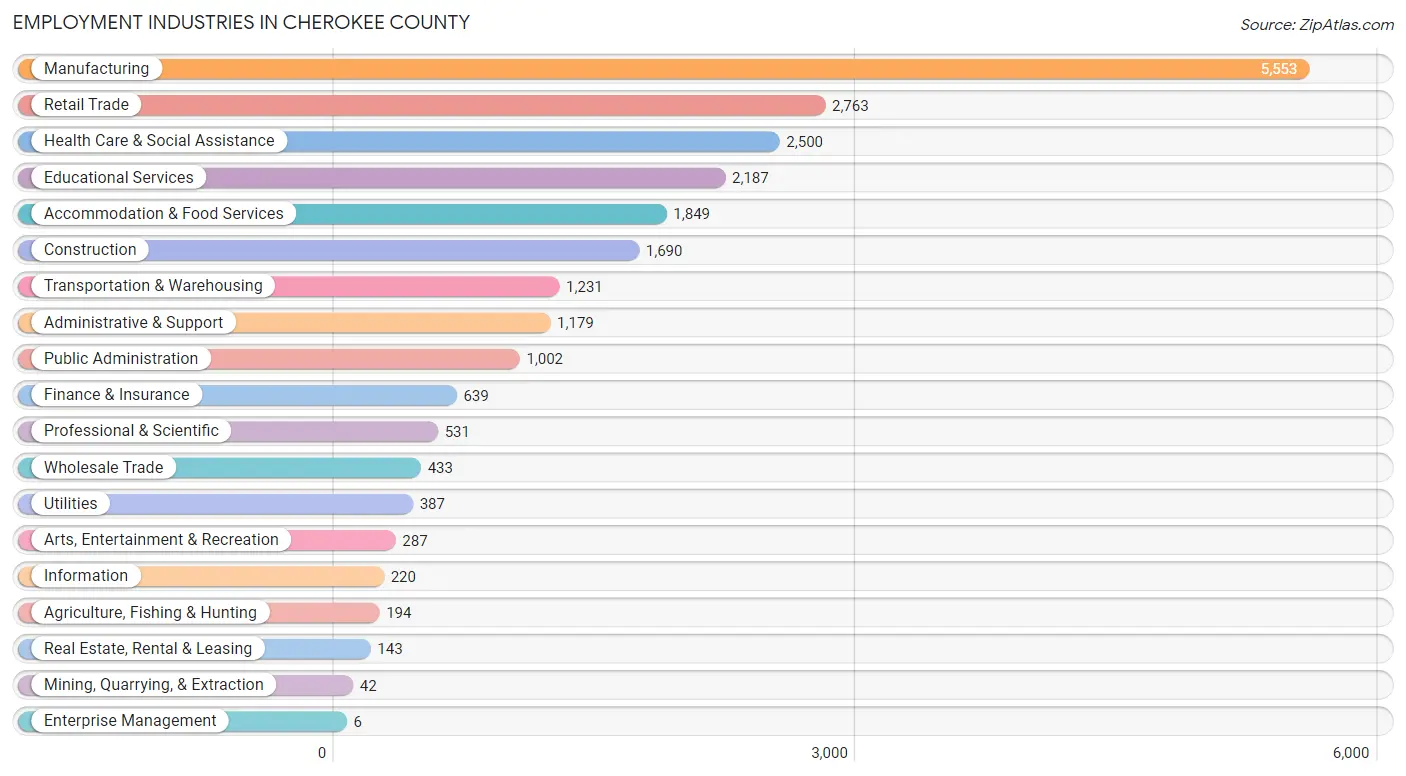
Employment Industries in Cherokee County
The major employment industries in Cherokee County include Manufacturing (5,553 | 22.9%), Retail Trade (2,763 | 11.4%), Health Care & Social Assistance (2,500 | 10.3%), Educational Services (2,187 | 9.0%), and Accommodation & Food Services (1,849 | 7.6%).
Employment Industries by Sex in Cherokee County
The Cherokee County industries that see more men than women are Mining, Quarrying, & Extraction (100.0%), Enterprise Management (100.0%), and Construction (93.3%), whereas the industries that tend to have a higher number of women are Health Care & Social Assistance (86.8%), Professional & Scientific (76.8%), and Educational Services (74.2%).
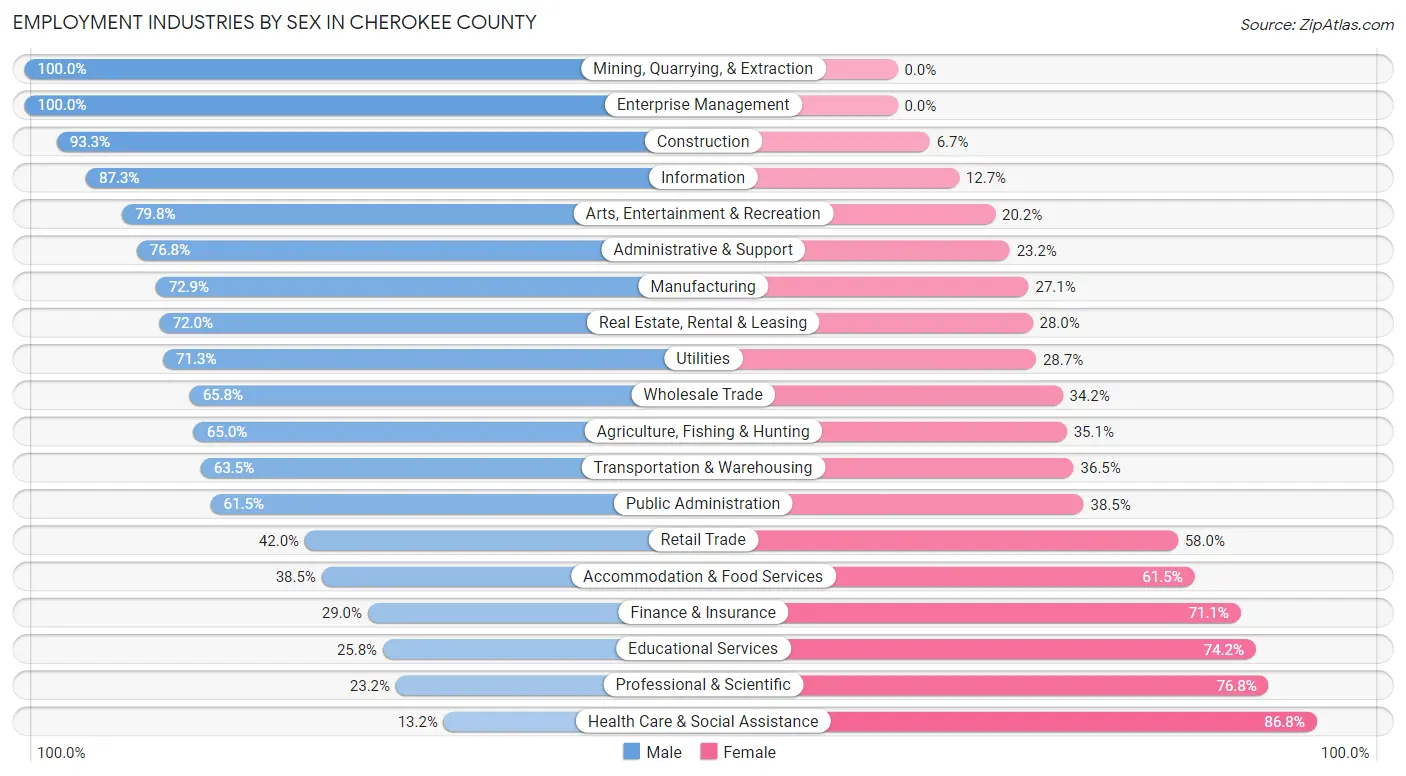
| Industry | Male | Female |
| Agriculture, Fishing & Hunting | 126 (64.9%) | 68 (35.0%) |
| Mining, Quarrying, & Extraction | 42 (100.0%) | 0 (0.0%) |
| Construction | 1,577 (93.3%) | 113 (6.7%) |
| Manufacturing | 4,046 (72.9%) | 1,507 (27.1%) |
| Wholesale Trade | 285 (65.8%) | 148 (34.2%) |
| Retail Trade | 1,160 (42.0%) | 1,603 (58.0%) |
| Transportation & Warehousing | 782 (63.5%) | 449 (36.5%) |
| Utilities | 276 (71.3%) | 111 (28.7%) |
| Information | 192 (87.3%) | 28 (12.7%) |
| Finance & Insurance | 185 (28.9%) | 454 (71.1%) |
| Real Estate, Rental & Leasing | 103 (72.0%) | 40 (28.0%) |
| Professional & Scientific | 123 (23.2%) | 408 (76.8%) |
| Enterprise Management | 6 (100.0%) | 0 (0.0%) |
| Administrative & Support | 905 (76.8%) | 274 (23.2%) |
| Educational Services | 565 (25.8%) | 1,622 (74.2%) |
| Health Care & Social Assistance | 331 (13.2%) | 2,169 (86.8%) |
| Arts, Entertainment & Recreation | 229 (79.8%) | 58 (20.2%) |
| Accommodation & Food Services | 712 (38.5%) | 1,137 (61.5%) |
| Public Administration | 616 (61.5%) | 386 (38.5%) |
| Total | 13,130 (54.2%) | 11,082 (45.8%) |
Education in Cherokee County
School Enrollment in Cherokee County
The most common levels of schooling among the 12,743 students in Cherokee County are elementary school (3,124 | 24.5%), high school (2,870 | 22.5%), and middle school (2,569 | 20.2%).
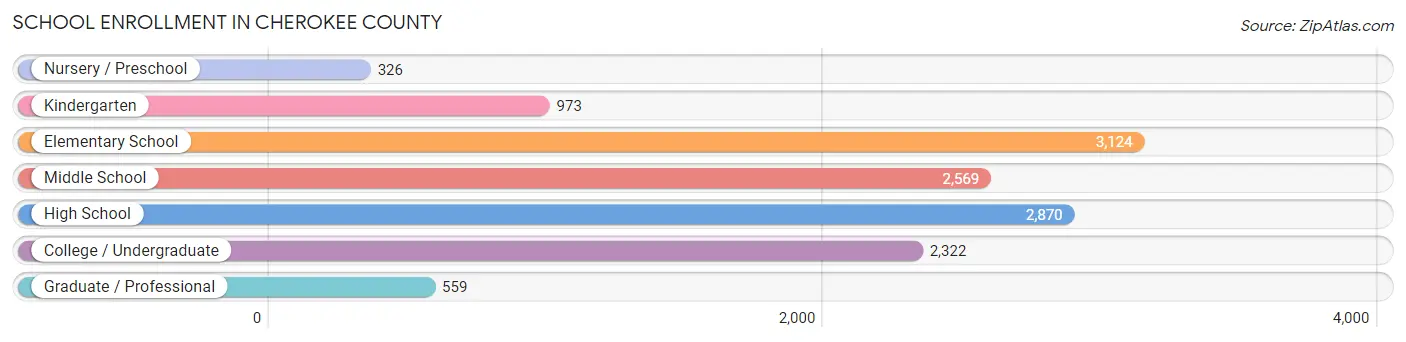
| School Level | # Students | % Students |
| Nursery / Preschool | 326 | 2.6% |
| Kindergarten | 973 | 7.6% |
| Elementary School | 3,124 | 24.5% |
| Middle School | 2,569 | 20.2% |
| High School | 2,870 | 22.5% |
| College / Undergraduate | 2,322 | 18.2% |
| Graduate / Professional | 559 | 4.4% |
| Total | 12,743 | 100.0% |
School Enrollment by Age by Funding Source in Cherokee County
Out of a total of 12,743 students who are enrolled in schools in Cherokee County, 2,026 (15.9%) attend a private institution, while the remaining 10,717 (84.1%) are enrolled in public schools. The age group of 20 to 24 year olds has the highest likelihood of being enrolled in private schools, with 657 (45.0% in the age bracket) enrolled. Conversely, the age group of 5 to 9 year old has the lowest likelihood of being enrolled in a private school, with 3,424 (92.5% in the age bracket) attending a public institution.
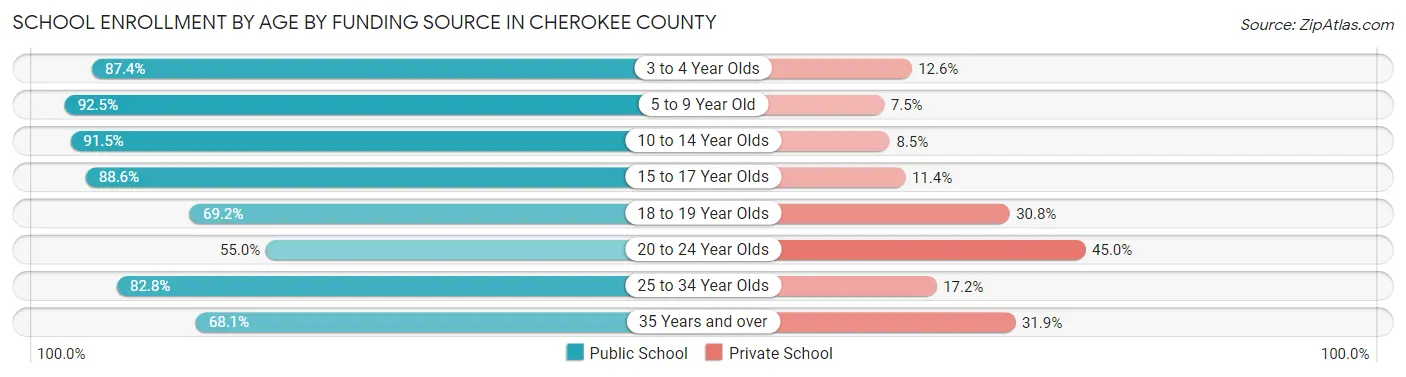
| Age Bracket | Public School | Private School |
| 3 to 4 Year Olds | 271 (87.4%) | 39 (12.6%) |
| 5 to 9 Year Old | 3,424 (92.5%) | 277 (7.5%) |
| 10 to 14 Year Olds | 2,999 (91.5%) | 280 (8.5%) |
| 15 to 17 Year Olds | 1,838 (88.6%) | 237 (11.4%) |
| 18 to 19 Year Olds | 644 (69.2%) | 287 (30.8%) |
| 20 to 24 Year Olds | 804 (55.0%) | 657 (45.0%) |
| 25 to 34 Year Olds | 370 (82.8%) | 77 (17.2%) |
| 35 Years and over | 367 (68.1%) | 172 (31.9%) |
| Total | 10,717 (84.1%) | 2,026 (15.9%) |
Educational Attainment by Field of Study in Cherokee County
Business (1,669 | 24.3%), education (1,496 | 21.7%), science & technology (745 | 10.8%), arts & humanities (443 | 6.4%), and bio, nature & agricultural (389 | 5.7%) are the most common fields of study among 6,877 individuals in Cherokee County who have obtained a bachelor's degree or higher.
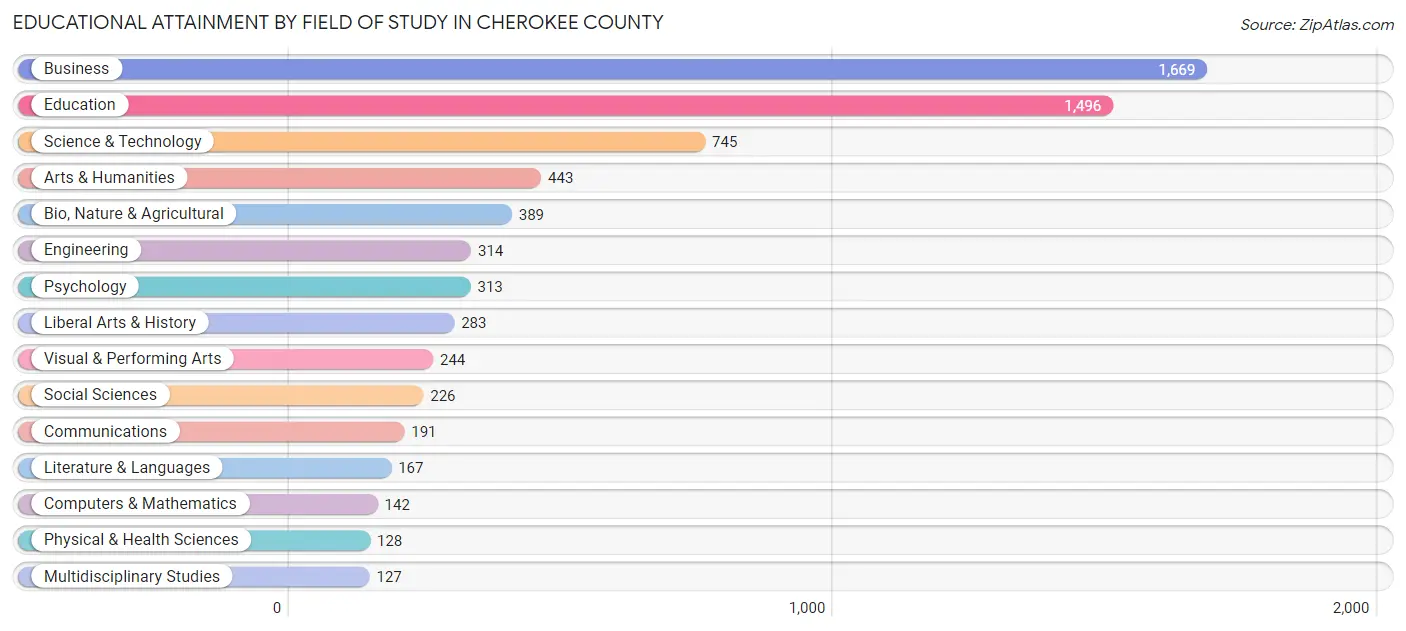
| Field of Study | # Graduates | % Graduates |
| Computers & Mathematics | 142 | 2.1% |
| Bio, Nature & Agricultural | 389 | 5.7% |
| Physical & Health Sciences | 128 | 1.9% |
| Psychology | 313 | 4.5% |
| Social Sciences | 226 | 3.3% |
| Engineering | 314 | 4.6% |
| Multidisciplinary Studies | 127 | 1.8% |
| Science & Technology | 745 | 10.8% |
| Business | 1,669 | 24.3% |
| Education | 1,496 | 21.7% |
| Literature & Languages | 167 | 2.4% |
| Liberal Arts & History | 283 | 4.1% |
| Visual & Performing Arts | 244 | 3.5% |
| Communications | 191 | 2.8% |
| Arts & Humanities | 443 | 6.4% |
| Total | 6,877 | 100.0% |
Transportation & Commute in Cherokee County
Vehicle Availability by Sex in Cherokee County
The most prevalent vehicle ownership categories in Cherokee County are males with 2 vehicles (4,079, accounting for 31.5%) and females with 2 vehicles (3,632, making up 38.1%).
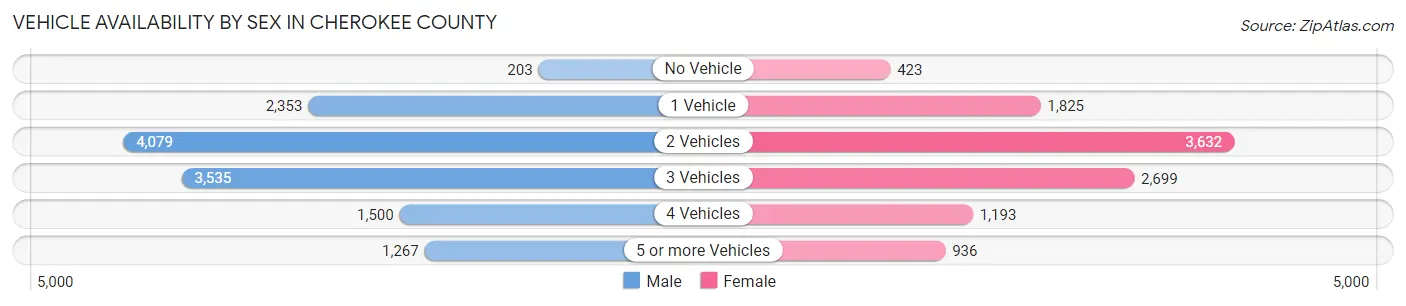
| Vehicles Available | Male | Female |
| No Vehicle | 203 (1.6%) | 423 (4.0%) |
| 1 Vehicle | 2,353 (18.2%) | 1,825 (17.0%) |
| 2 Vehicles | 4,079 (31.5%) | 3,632 (33.9%) |
| 3 Vehicles | 3,535 (27.3%) | 2,699 (25.2%) |
| 4 Vehicles | 1,500 (11.6%) | 1,193 (11.1%) |
| 5 or more Vehicles | 1,267 (9.8%) | 936 (8.7%) |
| Total | 12,937 (100.0%) | 10,708 (100.0%) |
Commute Time in Cherokee County
The most frequently occuring commute durations in Cherokee County are 10 to 14 minutes (3,737 commuters, 16.4%), 15 to 19 minutes (3,666 commuters, 16.1%), and 20 to 24 minutes (3,413 commuters, 15.0%).
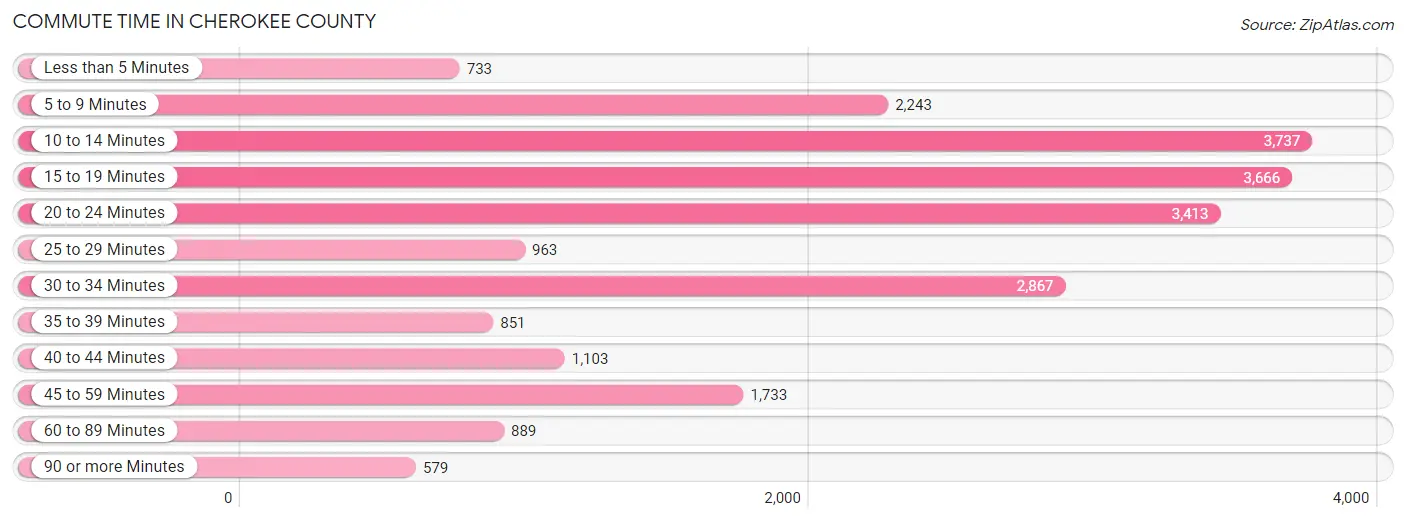
| Commute Time | # Commuters | % Commuters |
| Less than 5 Minutes | 733 | 3.2% |
| 5 to 9 Minutes | 2,243 | 9.9% |
| 10 to 14 Minutes | 3,737 | 16.4% |
| 15 to 19 Minutes | 3,666 | 16.1% |
| 20 to 24 Minutes | 3,413 | 15.0% |
| 25 to 29 Minutes | 963 | 4.2% |
| 30 to 34 Minutes | 2,867 | 12.6% |
| 35 to 39 Minutes | 851 | 3.7% |
| 40 to 44 Minutes | 1,103 | 4.8% |
| 45 to 59 Minutes | 1,733 | 7.6% |
| 60 to 89 Minutes | 889 | 3.9% |
| 90 or more Minutes | 579 | 2.5% |
Commute Time by Sex in Cherokee County
The most common commute times in Cherokee County are 15 to 19 minutes (2,201 commuters, 17.8%) for males and 10 to 14 minutes (1,637 commuters, 15.7%) for females.
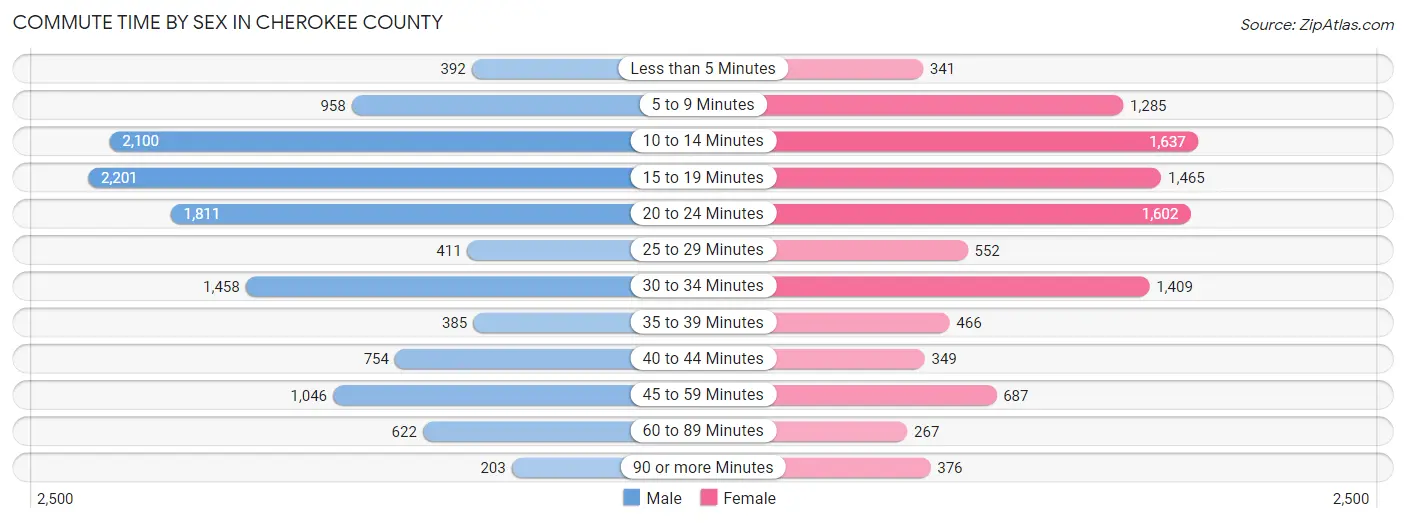
| Commute Time | Male | Female |
| Less than 5 Minutes | 392 (3.2%) | 341 (3.3%) |
| 5 to 9 Minutes | 958 (7.8%) | 1,285 (12.3%) |
| 10 to 14 Minutes | 2,100 (17.0%) | 1,637 (15.7%) |
| 15 to 19 Minutes | 2,201 (17.8%) | 1,465 (14.0%) |
| 20 to 24 Minutes | 1,811 (14.7%) | 1,602 (15.3%) |
| 25 to 29 Minutes | 411 (3.3%) | 552 (5.3%) |
| 30 to 34 Minutes | 1,458 (11.8%) | 1,409 (13.5%) |
| 35 to 39 Minutes | 385 (3.1%) | 466 (4.5%) |
| 40 to 44 Minutes | 754 (6.1%) | 349 (3.3%) |
| 45 to 59 Minutes | 1,046 (8.5%) | 687 (6.6%) |
| 60 to 89 Minutes | 622 (5.0%) | 267 (2.6%) |
| 90 or more Minutes | 203 (1.6%) | 376 (3.6%) |
Time of Departure to Work by Sex in Cherokee County
The most frequent times of departure to work in Cherokee County are 7:00 AM to 7:29 AM (1,775, 14.4%) for males and 7:00 AM to 7:29 AM (1,695, 16.2%) for females.
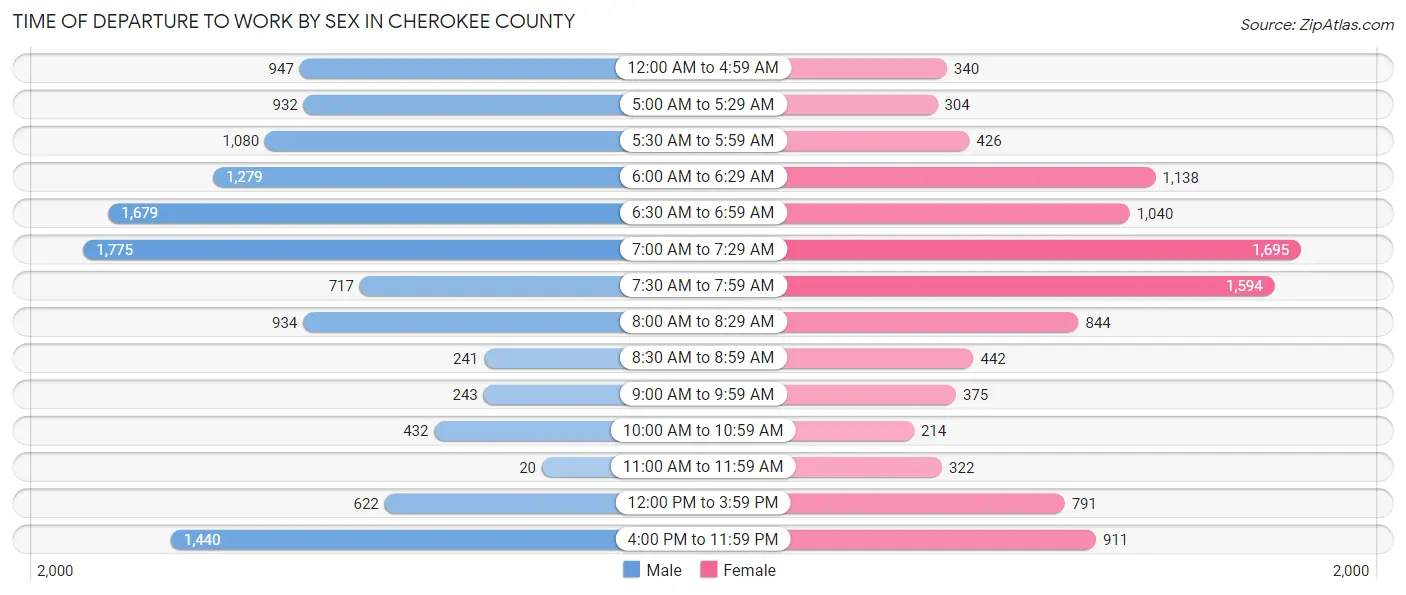
| Time of Departure | Male | Female |
| 12:00 AM to 4:59 AM | 947 (7.7%) | 340 (3.3%) |
| 5:00 AM to 5:29 AM | 932 (7.5%) | 304 (2.9%) |
| 5:30 AM to 5:59 AM | 1,080 (8.7%) | 426 (4.1%) |
| 6:00 AM to 6:29 AM | 1,279 (10.4%) | 1,138 (10.9%) |
| 6:30 AM to 6:59 AM | 1,679 (13.6%) | 1,040 (10.0%) |
| 7:00 AM to 7:29 AM | 1,775 (14.4%) | 1,695 (16.2%) |
| 7:30 AM to 7:59 AM | 717 (5.8%) | 1,594 (15.3%) |
| 8:00 AM to 8:29 AM | 934 (7.6%) | 844 (8.1%) |
| 8:30 AM to 8:59 AM | 241 (1.9%) | 442 (4.2%) |
| 9:00 AM to 9:59 AM | 243 (2.0%) | 375 (3.6%) |
| 10:00 AM to 10:59 AM | 432 (3.5%) | 214 (2.1%) |
| 11:00 AM to 11:59 AM | 20 (0.2%) | 322 (3.1%) |
| 12:00 PM to 3:59 PM | 622 (5.0%) | 791 (7.6%) |
| 4:00 PM to 11:59 PM | 1,440 (11.7%) | 911 (8.7%) |
| Total | 12,341 (100.0%) | 10,436 (100.0%) |
Housing Occupancy in Cherokee County
Occupancy by Ownership in Cherokee County
Of the total 21,288 dwellings in Cherokee County, owner-occupied units account for 15,079 (70.8%), while renter-occupied units make up 6,209 (29.2%).
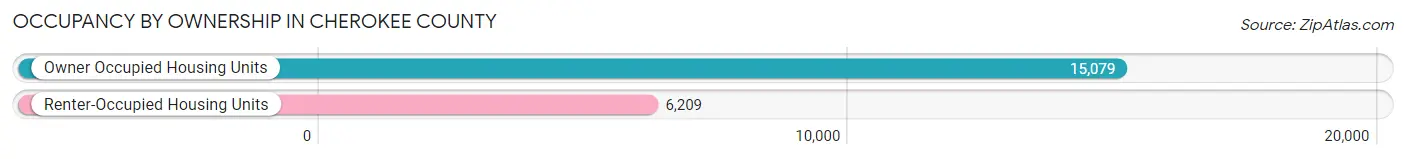
| Occupancy | # Housing Units | % Housing Units |
| Owner Occupied Housing Units | 15,079 | 70.8% |
| Renter-Occupied Housing Units | 6,209 | 29.2% |
| Total Occupied Housing Units | 21,288 | 100.0% |
Occupancy by Household Size in Cherokee County
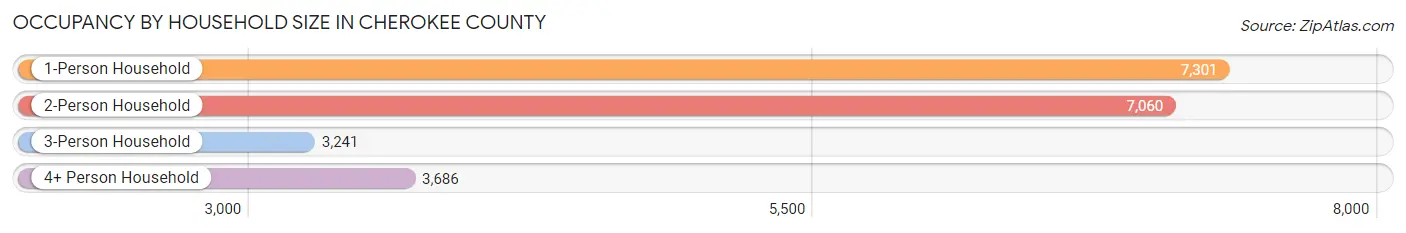
| Household Size | # Housing Units | % Housing Units |
| 1-Person Household | 7,301 | 34.3% |
| 2-Person Household | 7,060 | 33.2% |
| 3-Person Household | 3,241 | 15.2% |
| 4+ Person Household | 3,686 | 17.3% |
| Total Housing Units | 21,288 | 100.0% |
Occupancy by Ownership by Household Size in Cherokee County
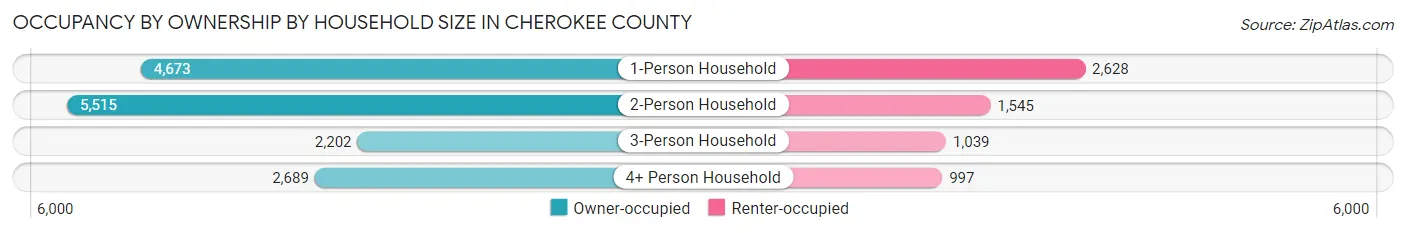
| Household Size | Owner-occupied | Renter-occupied |
| 1-Person Household | 4,673 (64.0%) | 2,628 (36.0%) |
| 2-Person Household | 5,515 (78.1%) | 1,545 (21.9%) |
| 3-Person Household | 2,202 (67.9%) | 1,039 (32.1%) |
| 4+ Person Household | 2,689 (73.0%) | 997 (27.1%) |
| Total Housing Units | 15,079 (70.8%) | 6,209 (29.2%) |
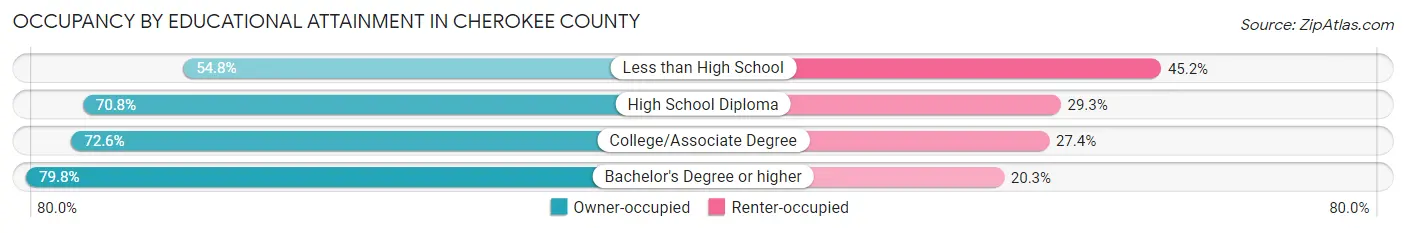
Occupancy by Educational Attainment in Cherokee County
| Household Size | Owner-occupied | Renter-occupied |
| Less than High School | 1,560 (54.8%) | 1,285 (45.2%) |
| High School Diploma | 5,543 (70.8%) | 2,292 (29.2%) |
| College/Associate Degree | 4,897 (72.6%) | 1,850 (27.4%) |
| Bachelor's Degree or higher | 3,079 (79.7%) | 782 (20.3%) |
Occupancy by Age of Householder in Cherokee County
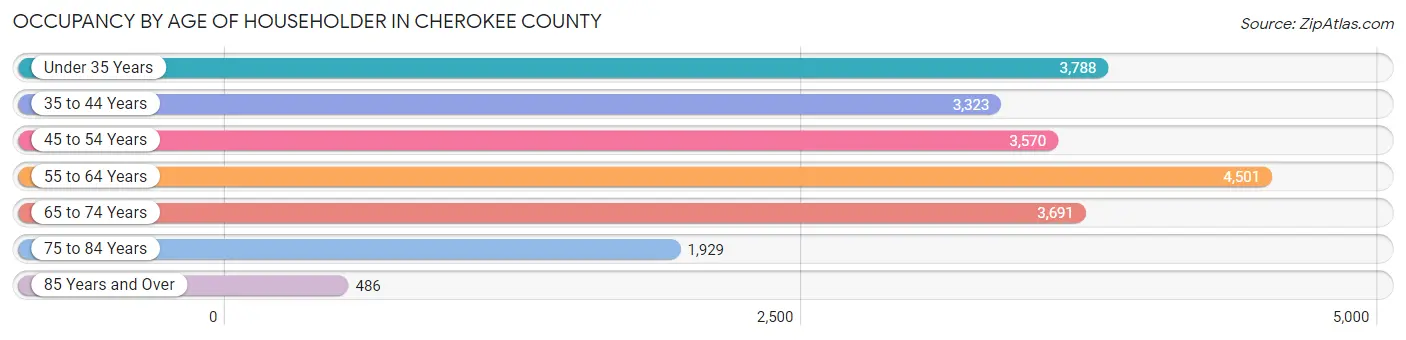
| Age Bracket | # Households | % Households |
| Under 35 Years | 3,788 | 17.8% |
| 35 to 44 Years | 3,323 | 15.6% |
| 45 to 54 Years | 3,570 | 16.8% |
| 55 to 64 Years | 4,501 | 21.1% |
| 65 to 74 Years | 3,691 | 17.3% |
| 75 to 84 Years | 1,929 | 9.1% |
| 85 Years and Over | 486 | 2.3% |
| Total | 21,288 | 100.0% |
Housing Finances in Cherokee County
Median Income by Occupancy in Cherokee County
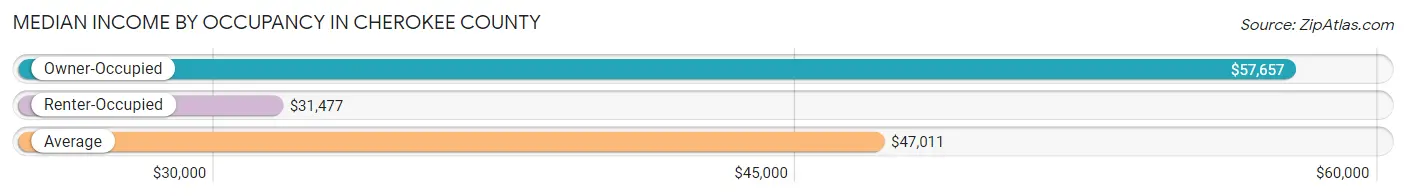
| Occupancy Type | # Households | Median Income |
| Owner-Occupied | 15,079 (70.8%) | $57,657 |
| Renter-Occupied | 6,209 (29.2%) | $31,477 |
| Average | 21,288 (100.0%) | $47,011 |
Occupancy by Householder Income Bracket in Cherokee County
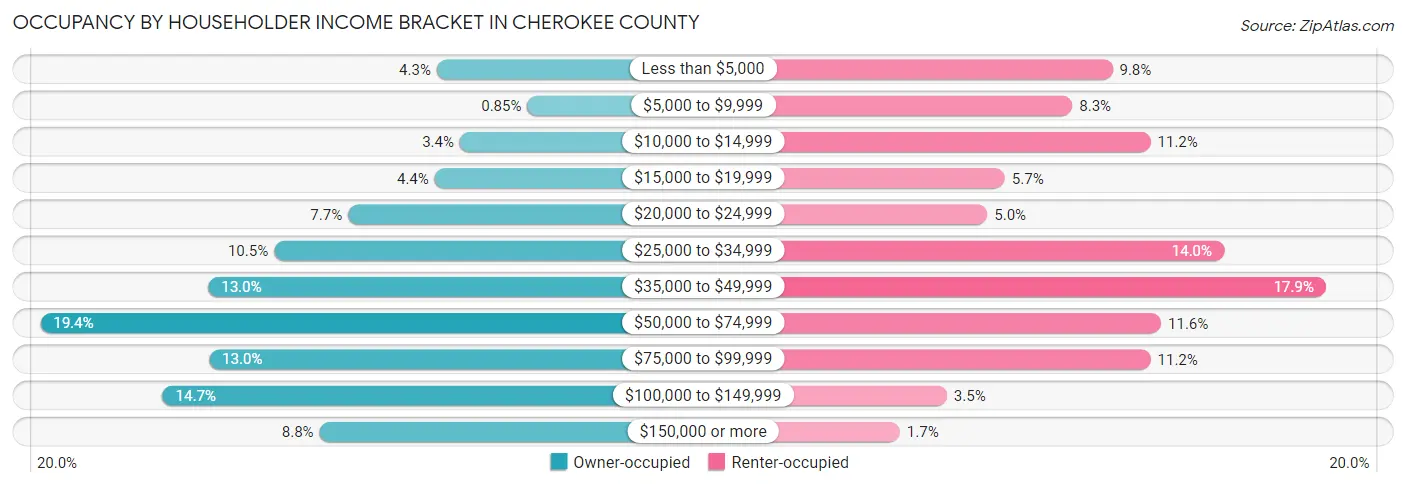
| Income Bracket | Owner-occupied | Renter-occupied |
| Less than $5,000 | 648 (4.3%) | 608 (9.8%) |
| $5,000 to $9,999 | 128 (0.9%) | 513 (8.3%) |
| $10,000 to $14,999 | 515 (3.4%) | 698 (11.2%) |
| $15,000 to $19,999 | 661 (4.4%) | 353 (5.7%) |
| $20,000 to $24,999 | 1,158 (7.7%) | 312 (5.0%) |
| $25,000 to $34,999 | 1,583 (10.5%) | 871 (14.0%) |
| $35,000 to $49,999 | 1,960 (13.0%) | 1,112 (17.9%) |
| $50,000 to $74,999 | 2,926 (19.4%) | 723 (11.6%) |
| $75,000 to $99,999 | 1,955 (13.0%) | 698 (11.2%) |
| $100,000 to $149,999 | 2,222 (14.7%) | 216 (3.5%) |
| $150,000 or more | 1,323 (8.8%) | 105 (1.7%) |
| Total | 15,079 (100.0%) | 6,209 (100.0%) |
Monthly Housing Cost Tiers in Cherokee County
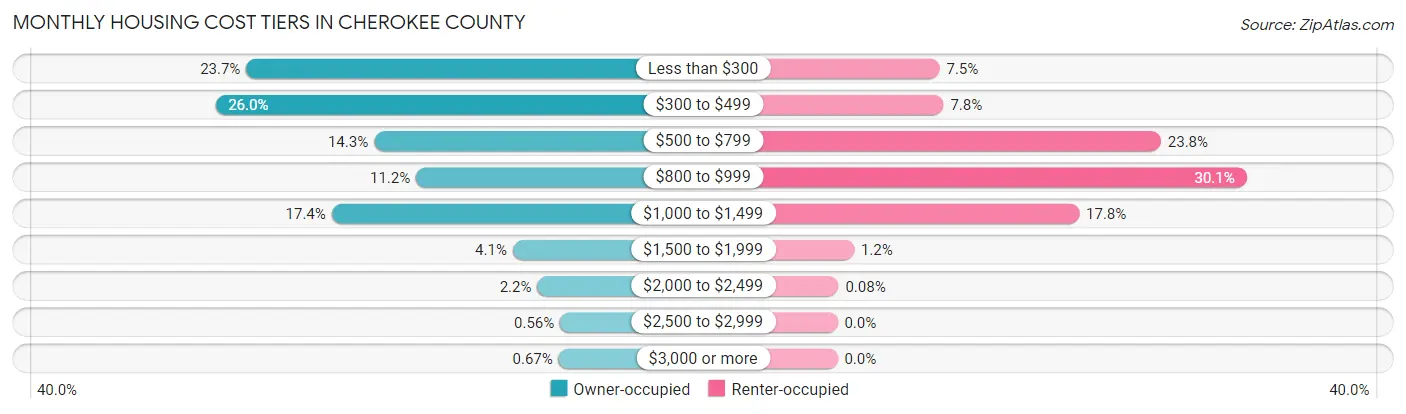
| Monthly Cost | Owner-occupied | Renter-occupied |
| Less than $300 | 3,571 (23.7%) | 467 (7.5%) |
| $300 to $499 | 3,915 (26.0%) | 485 (7.8%) |
| $500 to $799 | 2,152 (14.3%) | 1,479 (23.8%) |
| $800 to $999 | 1,685 (11.2%) | 1,871 (30.1%) |
| $1,000 to $1,499 | 2,622 (17.4%) | 1,105 (17.8%) |
| $1,500 to $1,999 | 611 (4.1%) | 76 (1.2%) |
| $2,000 to $2,499 | 338 (2.2%) | 5 (0.1%) |
| $2,500 to $2,999 | 84 (0.6%) | 0 (0.0%) |
| $3,000 or more | 101 (0.7%) | 0 (0.0%) |
| Total | 15,079 (100.0%) | 6,209 (100.0%) |
Physical Housing Characteristics in Cherokee County
Housing Structures in Cherokee County
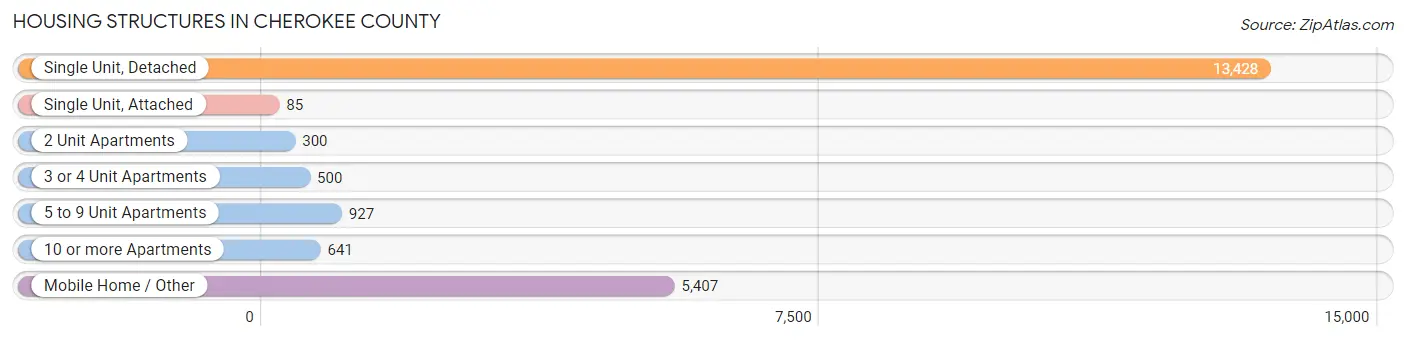
| Structure Type | # Housing Units | % Housing Units |
| Single Unit, Detached | 13,428 | 63.1% |
| Single Unit, Attached | 85 | 0.4% |
| 2 Unit Apartments | 300 | 1.4% |
| 3 or 4 Unit Apartments | 500 | 2.4% |
| 5 to 9 Unit Apartments | 927 | 4.3% |
| 10 or more Apartments | 641 | 3.0% |
| Mobile Home / Other | 5,407 | 25.4% |
| Total | 21,288 | 100.0% |
Housing Structures by Occupancy in Cherokee County
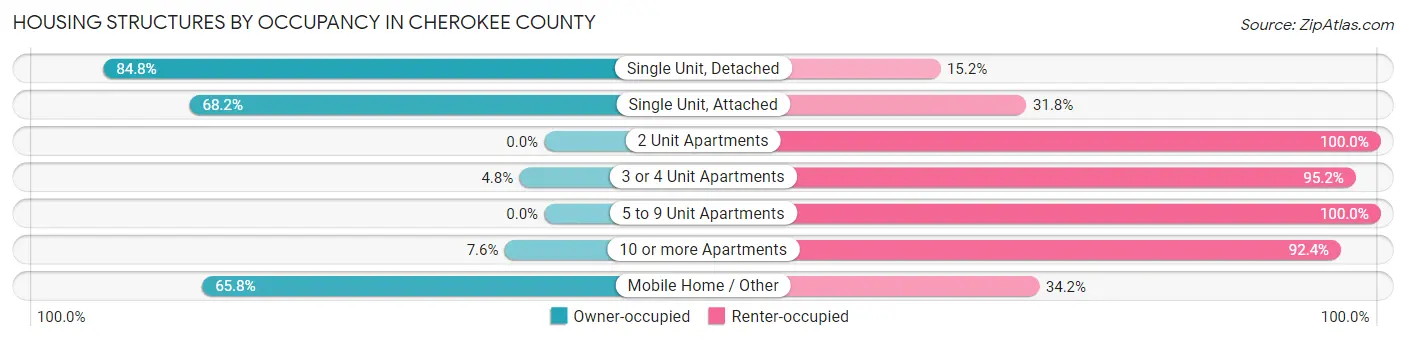
| Structure Type | Owner-occupied | Renter-occupied |
| Single Unit, Detached | 11,391 (84.8%) | 2,037 (15.2%) |
| Single Unit, Attached | 58 (68.2%) | 27 (31.8%) |
| 2 Unit Apartments | 0 (0.0%) | 300 (100.0%) |
| 3 or 4 Unit Apartments | 24 (4.8%) | 476 (95.2%) |
| 5 to 9 Unit Apartments | 0 (0.0%) | 927 (100.0%) |
| 10 or more Apartments | 49 (7.6%) | 592 (92.4%) |
| Mobile Home / Other | 3,557 (65.8%) | 1,850 (34.2%) |
| Total | 15,079 (70.8%) | 6,209 (29.2%) |
Housing Structures by Number of Rooms in Cherokee County
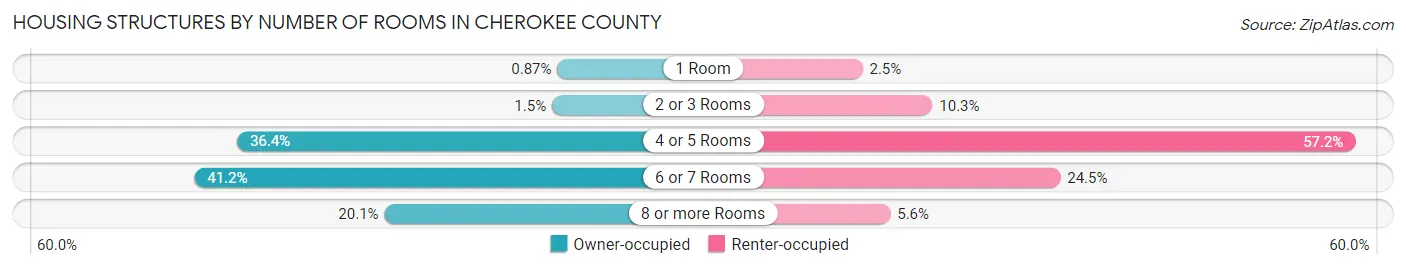
| Number of Rooms | Owner-occupied | Renter-occupied |
| 1 Room | 131 (0.9%) | 156 (2.5%) |
| 2 or 3 Rooms | 222 (1.5%) | 637 (10.3%) |
| 4 or 5 Rooms | 5,493 (36.4%) | 3,550 (57.2%) |
| 6 or 7 Rooms | 6,206 (41.2%) | 1,519 (24.5%) |
| 8 or more Rooms | 3,027 (20.1%) | 347 (5.6%) |
| Total | 15,079 (100.0%) | 6,209 (100.0%) |
Housing Structure by Heating Type in Cherokee County
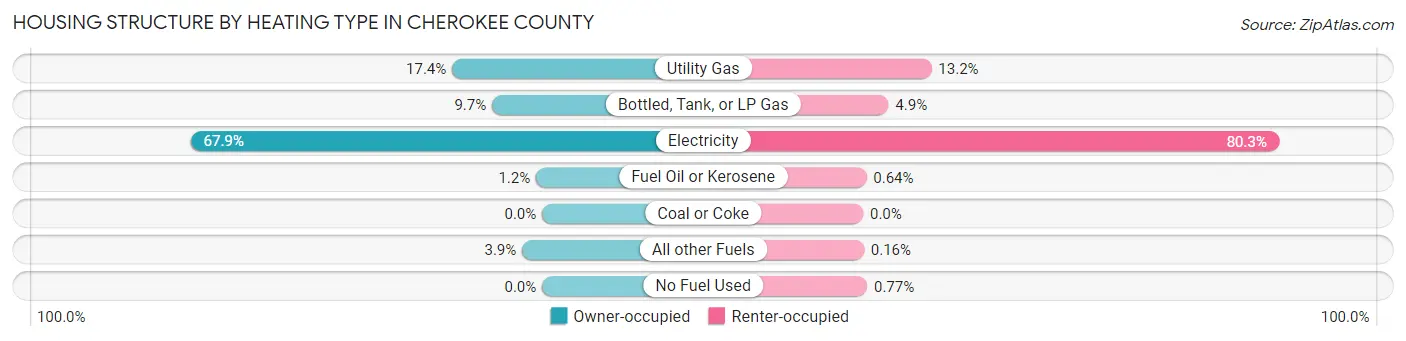
| Heating Type | Owner-occupied | Renter-occupied |
| Utility Gas | 2,622 (17.4%) | 820 (13.2%) |
| Bottled, Tank, or LP Gas | 1,458 (9.7%) | 304 (4.9%) |
| Electricity | 10,240 (67.9%) | 4,987 (80.3%) |
| Fuel Oil or Kerosene | 177 (1.2%) | 40 (0.6%) |
| Coal or Coke | 0 (0.0%) | 0 (0.0%) |
| All other Fuels | 582 (3.9%) | 10 (0.2%) |
| No Fuel Used | 0 (0.0%) | 48 (0.8%) |
| Total | 15,079 (100.0%) | 6,209 (100.0%) |
Household Vehicle Usage in Cherokee County
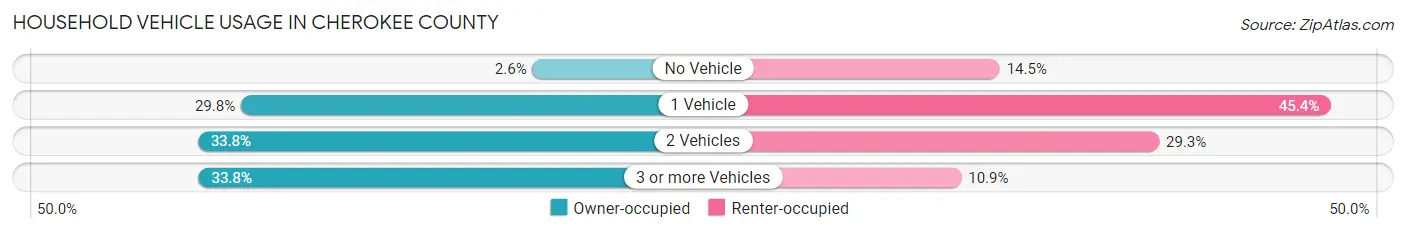
| Vehicles per Household | Owner-occupied | Renter-occupied |
| No Vehicle | 391 (2.6%) | 897 (14.4%) |
| 1 Vehicle | 4,494 (29.8%) | 2,817 (45.4%) |
| 2 Vehicles | 5,103 (33.8%) | 1,821 (29.3%) |
| 3 or more Vehicles | 5,091 (33.8%) | 674 (10.9%) |
| Total | 15,079 (100.0%) | 6,209 (100.0%) |
Real Estate & Mortgages in Cherokee County
Real Estate and Mortgage Overview in Cherokee County
| Characteristic | Without Mortgage | With Mortgage |
| Housing Units | 8,416 | 6,663 |
| Median Property Value | $101,100 | $151,300 |
| Median Household Income | $45,655 | $831 |
| Monthly Housing Costs | $332 | $91 |
| Real Estate Taxes | $466 | $451 |
Property Value by Mortgage Status in Cherokee County
| Property Value | Without Mortgage | With Mortgage |
| Less than $50,000 | 1,973 (23.4%) | 518 (7.8%) |
| $50,000 to $99,999 | 2,198 (26.1%) | 1,110 (16.7%) |
| $100,000 to $299,999 | 3,525 (41.9%) | 4,240 (63.6%) |
| $300,000 to $499,999 | 603 (7.2%) | 634 (9.5%) |
| $500,000 to $749,999 | 46 (0.5%) | 101 (1.5%) |
| $750,000 to $999,999 | 54 (0.6%) | 28 (0.4%) |
| $1,000,000 or more | 17 (0.2%) | 32 (0.5%) |
| Total | 8,416 (100.0%) | 6,663 (100.0%) |
Household Income by Mortgage Status in Cherokee County
| Household Income | Without Mortgage | With Mortgage |
| Less than $10,000 | 537 (6.4%) | 284 (4.3%) |
| $10,000 to $24,999 | 1,860 (22.1%) | 239 (3.6%) |
| $25,000 to $34,999 | 1,120 (13.3%) | 474 (7.1%) |
| $35,000 to $49,999 | 1,064 (12.6%) | 463 (7.0%) |
| $50,000 to $74,999 | 1,708 (20.3%) | 896 (13.5%) |
| $75,000 to $99,999 | 796 (9.5%) | 1,218 (18.3%) |
| $100,000 to $149,999 | 839 (10.0%) | 1,159 (17.4%) |
| $150,000 or more | 492 (5.9%) | 1,383 (20.8%) |
| Total | 8,416 (100.0%) | 6,663 (100.0%) |
Property Value to Household Income Ratio in Cherokee County
| Value-to-Income Ratio | Without Mortgage | With Mortgage |
| Less than 2.0x | 3,827 (45.5%) | 75,678 (1,135.8%) |
| 2.0x to 2.9x | 1,228 (14.6%) | 3,251 (48.8%) |
| 3.0x to 3.9x | 796 (9.5%) | 1,469 (22.1%) |
| 4.0x or more | 2,349 (27.9%) | 734 (11.0%) |
| Total | 8,416 (100.0%) | 6,663 (100.0%) |
Real Estate Taxes by Mortgage Status in Cherokee County
| Property Taxes | Without Mortgage | With Mortgage |
| Less than $800 | 4,869 (57.9%) | 69 (1.0%) |
| $800 to $1,499 | 1,454 (17.3%) | 3,729 (56.0%) |
| $800 to $1,499 | 556 (6.6%) | 1,774 (26.6%) |
| Total | 8,416 (100.0%) | 6,663 (100.0%) |
Health & Disability in Cherokee County
Health Insurance Coverage by Age in Cherokee County
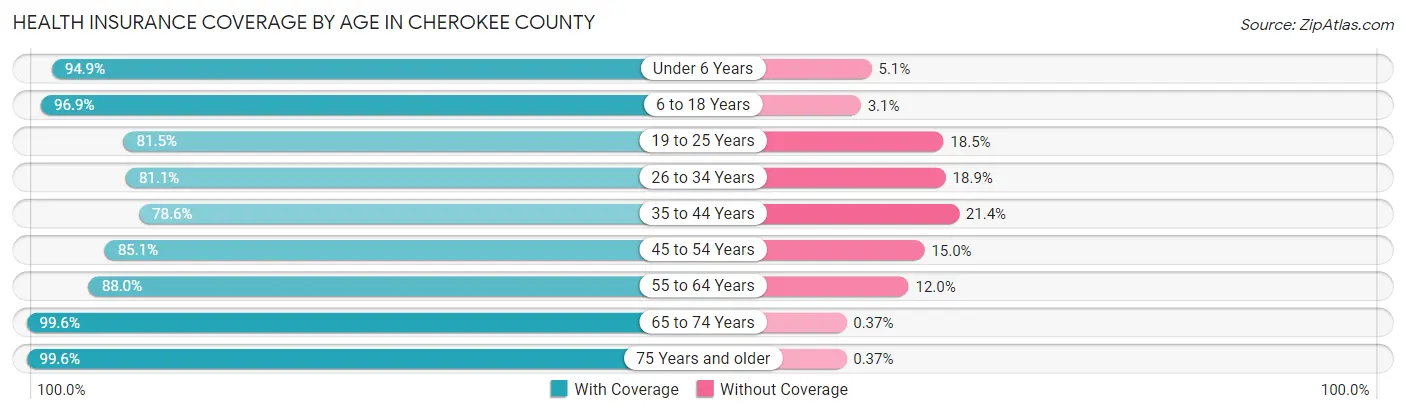
| Age Bracket | With Coverage | Without Coverage |
| Under 6 Years | 3,943 (94.9%) | 211 (5.1%) |
| 6 to 18 Years | 8,959 (96.9%) | 284 (3.1%) |
| 19 to 25 Years | 4,434 (81.5%) | 1,005 (18.5%) |
| 26 to 34 Years | 5,153 (81.1%) | 1,201 (18.9%) |
| 35 to 44 Years | 5,027 (78.6%) | 1,366 (21.4%) |
| 45 to 54 Years | 6,269 (85.1%) | 1,102 (14.9%) |
| 55 to 64 Years | 6,590 (88.0%) | 898 (12.0%) |
| 65 to 74 Years | 5,699 (99.6%) | 21 (0.4%) |
| 75 Years and older | 3,538 (99.6%) | 13 (0.4%) |
| Total | 49,612 (89.0%) | 6,101 (11.0%) |
Health Insurance Coverage by Citizenship Status in Cherokee County
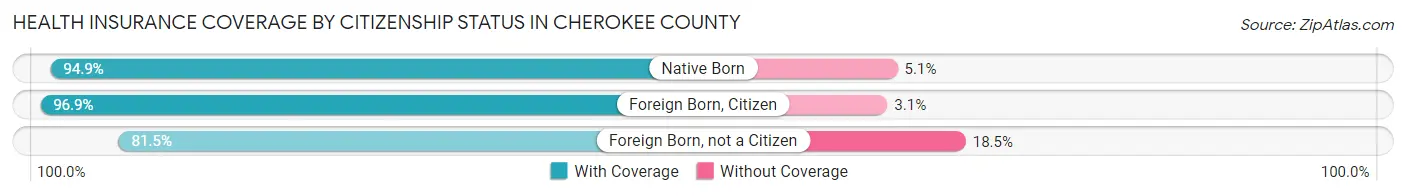
| Citizenship Status | With Coverage | Without Coverage |
| Native Born | 3,943 (94.9%) | 211 (5.1%) |
| Foreign Born, Citizen | 8,959 (96.9%) | 284 (3.1%) |
| Foreign Born, not a Citizen | 4,434 (81.5%) | 1,005 (18.5%) |
Health Insurance Coverage by Household Income in Cherokee County
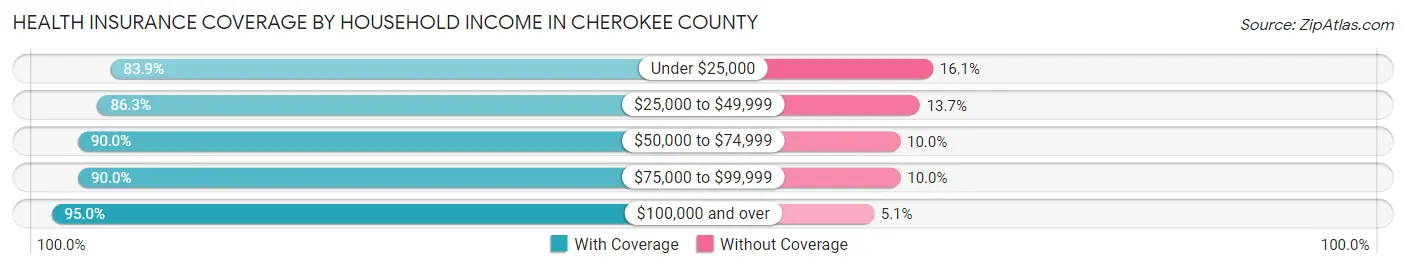
| Household Income | With Coverage | Without Coverage |
| Under $25,000 | 7,839 (83.9%) | 1,507 (16.1%) |
| $25,000 to $49,999 | 12,336 (86.3%) | 1,954 (13.7%) |
| $50,000 to $74,999 | 8,629 (90.0%) | 957 (10.0%) |
| $75,000 to $99,999 | 7,689 (90.0%) | 857 (10.0%) |
| $100,000 and over | 12,641 (95.0%) | 672 (5.1%) |
Public vs Private Health Insurance Coverage by Age in Cherokee County
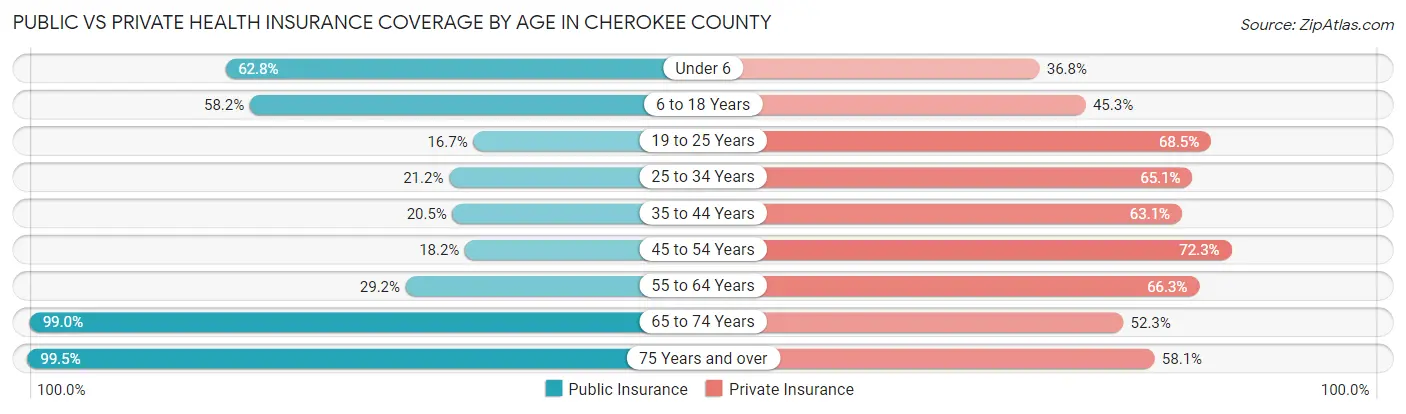
| Age Bracket | Public Insurance | Private Insurance |
| Under 6 | 2,607 (62.8%) | 1,527 (36.8%) |
| 6 to 18 Years | 5,376 (58.2%) | 4,190 (45.3%) |
| 19 to 25 Years | 907 (16.7%) | 3,728 (68.5%) |
| 25 to 34 Years | 1,346 (21.2%) | 4,135 (65.1%) |
| 35 to 44 Years | 1,313 (20.5%) | 4,035 (63.1%) |
| 45 to 54 Years | 1,343 (18.2%) | 5,330 (72.3%) |
| 55 to 64 Years | 2,189 (29.2%) | 4,967 (66.3%) |
| 65 to 74 Years | 5,665 (99.0%) | 2,992 (52.3%) |
| 75 Years and over | 3,533 (99.5%) | 2,064 (58.1%) |
| Total | 24,279 (43.6%) | 32,968 (59.2%) |
Disability Status by Sex by Age in Cherokee County
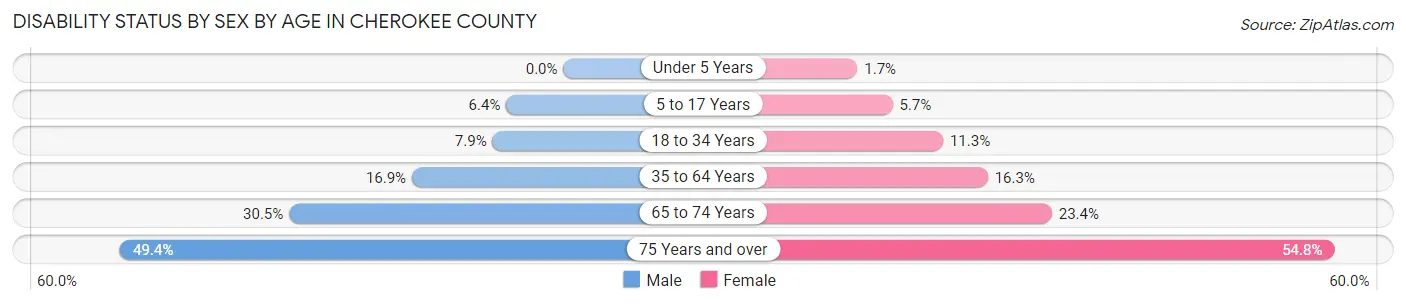
| Age Bracket | Male | Female |
| Under 5 Years | 0 (0.0%) | 30 (1.7%) |
| 5 to 17 Years | 300 (6.4%) | 263 (5.7%) |
| 18 to 34 Years | 494 (7.9%) | 699 (11.3%) |
| 35 to 64 Years | 1,761 (16.9%) | 1,757 (16.3%) |
| 65 to 74 Years | 838 (30.5%) | 696 (23.4%) |
| 75 Years and over | 708 (49.4%) | 1,161 (54.8%) |
Disability Class by Sex by Age in Cherokee County
Disability Class: Hearing Difficulty
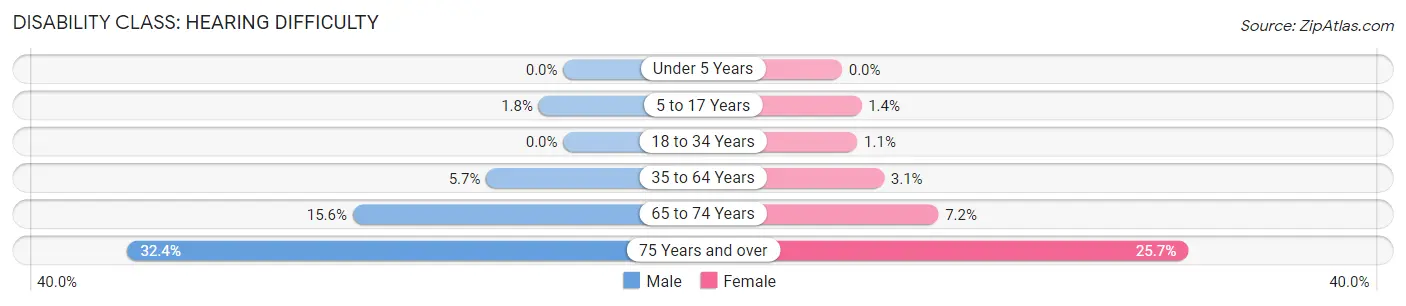
| Age Bracket | Male | Female |
| Under 5 Years | 0 (0.0%) | 0 (0.0%) |
| 5 to 17 Years | 86 (1.8%) | 67 (1.4%) |
| 18 to 34 Years | 0 (0.0%) | 71 (1.1%) |
| 35 to 64 Years | 597 (5.7%) | 337 (3.1%) |
| 65 to 74 Years | 429 (15.6%) | 213 (7.2%) |
| 75 Years and over | 464 (32.4%) | 544 (25.7%) |
Disability Class: Vision Difficulty
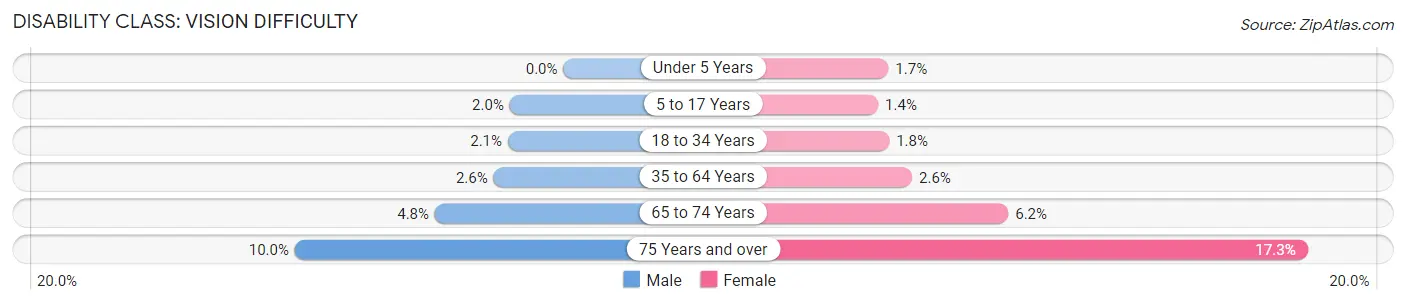
| Age Bracket | Male | Female |
| Under 5 Years | 0 (0.0%) | 30 (1.7%) |
| 5 to 17 Years | 94 (2.0%) | 63 (1.3%) |
| 18 to 34 Years | 129 (2.1%) | 109 (1.8%) |
| 35 to 64 Years | 270 (2.6%) | 282 (2.6%) |
| 65 to 74 Years | 131 (4.8%) | 184 (6.2%) |
| 75 Years and over | 143 (10.0%) | 366 (17.3%) |
Disability Class: Cognitive Difficulty
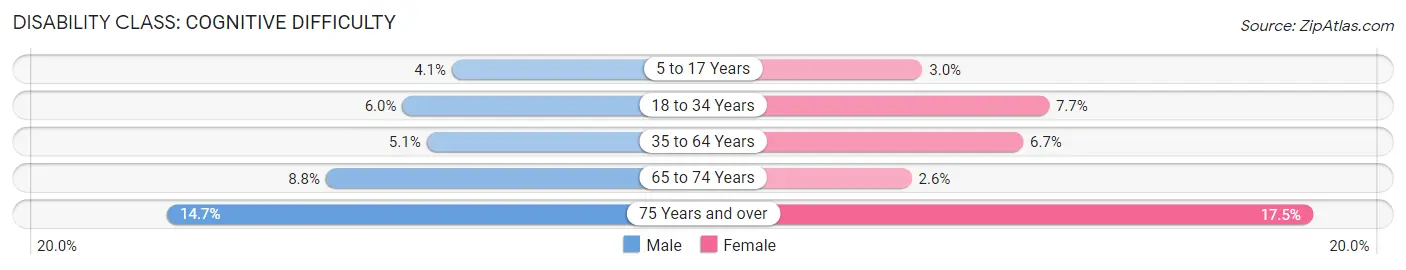
| Age Bracket | Male | Female |
| 5 to 17 Years | 195 (4.1%) | 139 (3.0%) |
| 18 to 34 Years | 374 (6.0%) | 477 (7.7%) |
| 35 to 64 Years | 531 (5.1%) | 727 (6.7%) |
| 65 to 74 Years | 242 (8.8%) | 77 (2.6%) |
| 75 Years and over | 211 (14.7%) | 370 (17.5%) |
Disability Class: Ambulatory Difficulty
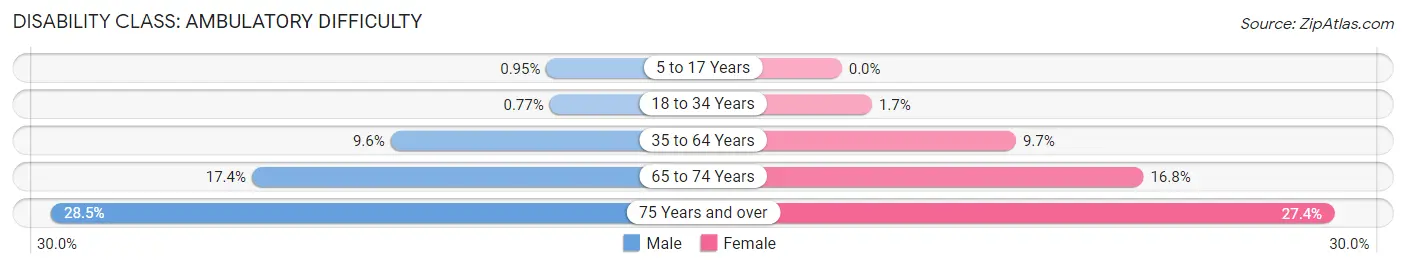
| Age Bracket | Male | Female |
| 5 to 17 Years | 45 (0.9%) | 0 (0.0%) |
| 18 to 34 Years | 48 (0.8%) | 104 (1.7%) |
| 35 to 64 Years | 1,005 (9.6%) | 1,049 (9.7%) |
| 65 to 74 Years | 476 (17.3%) | 500 (16.8%) |
| 75 Years and over | 409 (28.5%) | 580 (27.4%) |
Disability Class: Self-Care Difficulty
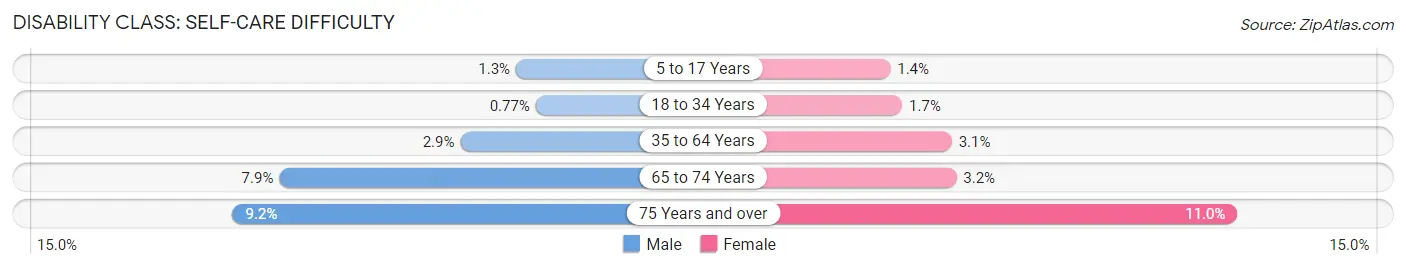
| Age Bracket | Male | Female |
| 5 to 17 Years | 62 (1.3%) | 63 (1.3%) |
| 18 to 34 Years | 48 (0.8%) | 104 (1.7%) |
| 35 to 64 Years | 300 (2.9%) | 331 (3.1%) |
| 65 to 74 Years | 217 (7.9%) | 95 (3.2%) |
| 75 Years and over | 132 (9.2%) | 233 (11.0%) |
Technology Access in Cherokee County
Computing Device Access in Cherokee County
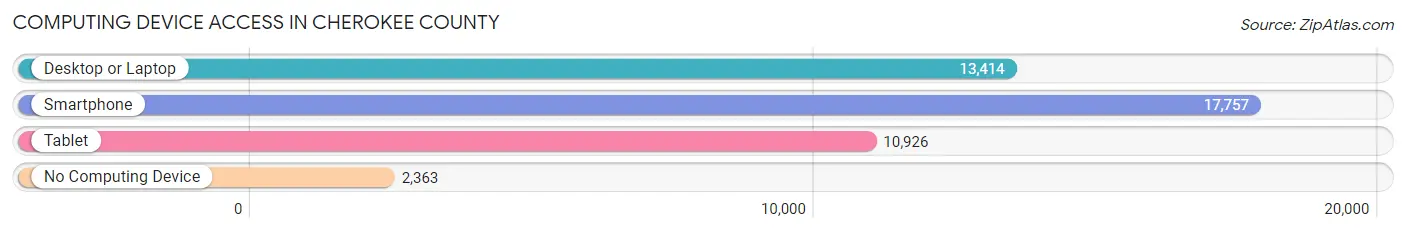
| Device Type | # Households | % Households |
| Desktop or Laptop | 13,414 | 63.0% |
| Smartphone | 17,757 | 83.4% |
| Tablet | 10,926 | 51.3% |
| No Computing Device | 2,363 | 11.1% |
| Total | 21,288 | 100.0% |
Internet Access in Cherokee County
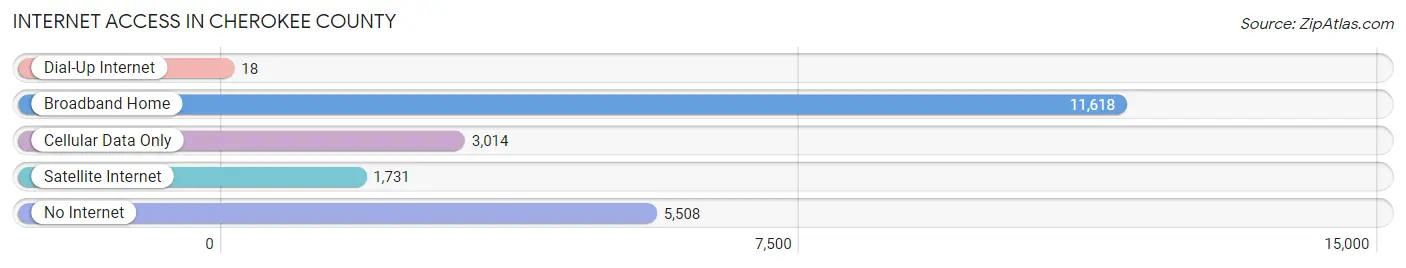
| Internet Type | # Households | % Households |
| Dial-Up Internet | 18 | 0.1% |
| Broadband Home | 11,618 | 54.6% |
| Cellular Data Only | 3,014 | 14.2% |
| Satellite Internet | 1,731 | 8.1% |
| No Internet | 5,508 | 25.9% |
| Total | 21,288 | 100.0% |
Cherokee County Summary
Cherokee County, South Carolina is located in the Upstate region of the state and is bordered by Spartanburg, Union, York, and Greenville counties. The county seat is Gaffney, and the county is home to approximately 55,000 people. Cherokee County is known for its rich history, diverse geography, and vibrant economy.
History
Cherokee County was established in 1897 from parts of York and Spartanburg counties. The county was named after the Cherokee Indians who once inhabited the area. The county was home to several prominent Cherokee leaders, including Chief Attakullakulla and Chief Oconostota. The county was also home to the Cherokee Path, a major trading route used by the Cherokee and other Native American tribes.
The county was home to several important historical sites, including the Cowpens National Battlefield, Kings Mountain National Military Park, and the Cowpens National Historic Site. The county was also home to several important Revolutionary War battles, including the Battle of Cowpens and the Battle of Kings Mountain.
Geography
Cherokee County is located in the foothills of the Blue Ridge Mountains. The county is home to several rivers, including the Broad, Pacolet, and Tyger rivers. The county is also home to several lakes, including Lake Bowen, Lake Blalock, and Lake Cherokee.
The county is home to several state parks, including Table Rock State Park, Jones Gap State Park, and Caesars Head State Park. The county is also home to several national forests, including the Sumter National Forest and the Nantahala National Forest.
Economy
Cherokee County is home to a diverse economy. The county is home to several major employers, including Duke Energy, Gaffney Manufacturing, and the Gaffney Premium Outlets. The county is also home to several small businesses, including restaurants, retail stores, and service providers.
The county is home to several agricultural operations, including poultry farms, dairy farms, and vegetable farms. The county is also home to several wineries and vineyards.
Demographics
As of the 2010 census, the population of Cherokee County was 54,981. The racial makeup of the county was 79.3% White, 16.2% African American, 0.4% Native American, 0.7% Asian, 0.1% Pacific Islander, 1.7% from other races, and 1.5% from two or more races. Hispanic or Latino of any race were 3.3% of the population.
The median income for a household in the county was $37,845, and the median income for a family was $45,945. The per capita income for the county was $19,945. About 15.2% of families and 19.2% of the population were below the poverty line, including 25.2% of those under age 18 and 14.2% of those age 65 or over.
Common Questions
What is Per Capita Income in Cherokee County?
Per Capita income in Cherokee County is $26,706.
What is the Median Family Income in Cherokee County?
Median Family Income in Cherokee County is $64,216.
What is the Median Household income in Cherokee County?
Median Household Income in Cherokee County is $47,011.
What is Income or Wage Gap in Cherokee County?
Income or Wage Gap in Cherokee County is 26.8%.
Women in Cherokee County earn 73.2 cents for every dollar earned by a man.
What is Family Income Deficit in Cherokee County?
Family Income Deficit in Cherokee County is $10,000.
Families that are below poverty line in Cherokee County earn $10,000 less on average than the poverty threshold level.
What is Inequality or Gini Index in Cherokee County?
Inequality or Gini Index in Cherokee County is 0.48.
What is the Total Population of Cherokee County?
Total Population of Cherokee County is 56,200.
What is the Total Male Population of Cherokee County?
Total Male Population of Cherokee County is 27,445.
What is the Total Female Population of Cherokee County?
Total Female Population of Cherokee County is 28,755.
What is the Ratio of Males per 100 Females in Cherokee County?
There are 95.44 Males per 100 Females in Cherokee County.
What is the Ratio of Females per 100 Males in Cherokee County?
There are 104.77 Females per 100 Males in Cherokee County.
What is the Median Population Age in Cherokee County?
Median Population Age in Cherokee County is 40.0 Years.
What is the Average Family Size in Cherokee County
Average Family Size in Cherokee County is 3.4 People.
What is the Average Household Size in Cherokee County
Average Household Size in Cherokee County is 2.6 People.
How Large is the Labor Force in Cherokee County?
There are 25,839 People in the Labor Forcein in Cherokee County.
What is the Percentage of People in the Labor Force in Cherokee County?
57.6% of People are in the Labor Force in Cherokee County.
What is the Unemployment Rate in Cherokee County?
Unemployment Rate in Cherokee County is 5.9%.