New Hampshire Map & Demographics
New Hampshire Map
New Hampshire Overview
Jun 21, 1788
INCORPORATED
9,348
TOTAL AREA [ SQ MI ]
8,952
LAND AREA [ SQ MI ]
396
WATER AREA [ SQ MI ]
1,000
ELEVATION AVG [ FT ]
6,288
ELEVATION HIGH [ FT ]
Sea Level
ELEVATION LOW [ FT ]
154.1
POP DENSITY [ PPL / SQ MI ]
$48,250
PER CAPITA INCOME
$113,605
AVG FAMILY INCOME
$90,845
AVG HOUSEHOLD INCOME
29.8%
WAGE / INCOME GAP [ % ]
70.2¢/ $1
WAGE / INCOME GAP [ $ ]
$10,615
FAMILY INCOME DEFICIT
0.44
INEQUALITY / GINI INDEX
03103
LARGEST ZIP CODE
Manchester
LARGEST CITY
Hillsborough County
LARGEST COUNTY
1,379,610
TOTAL POPULATION
689,725
MALE POPULATION
689,885
FEMALE POPULATION
99.98
MALES / 100 FEMALES
100.02
FEMALES / 100 MALES
43.1
MEDIAN AGE
3.0
AVG FAMILY SIZE
2.5
AVG HOUSEHOLD SIZE
769,933
LABOR FORCE [ PEOPLE ]
66.6%
PERCENT IN LABOR FORCE
3.6%
UNEMPLOYMENT RATE
New Hampshire Area Codes
Income in New Hampshire
Income Overview in New Hampshire
Per Capita Income in New Hampshire is $48,250, while median incomes of families and households are $113,605 and $90,845 respectively.
| Characteristic | Number | Measure |
| Per Capita Income | 1,379,610 | $48,250 |
| Median Family Income | 353,906 | $113,605 |
| Mean Family Income | 353,906 | $140,123 |
| Median Household Income | 545,116 | $90,845 |
| Mean Household Income | 545,116 | $118,118 |
| Income Deficit | 353,906 | $10,615 |
| Wage / Income Gap (%) | 1,379,610 | 29.81% |
| Wage / Income Gap ($) | 1,379,610 | 70.19¢ per $1 |
| Gini / Inequality Index | 1,379,610 | 0.44 |
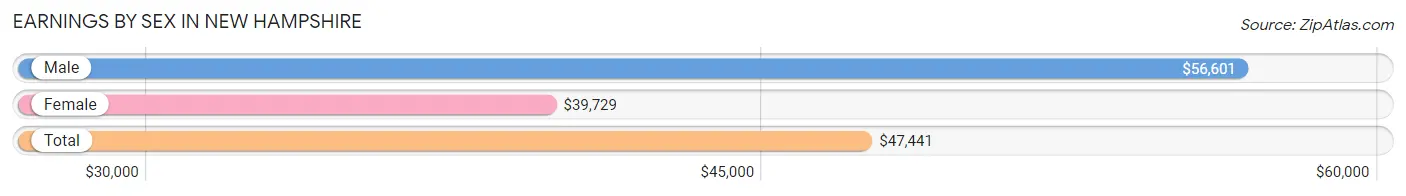
Earnings by Sex in New Hampshire
Average Earnings in New Hampshire are $47,441, $56,601 for men and $39,729 for women, a difference of 29.8%.
| Sex | Number | Average Earnings |
| Male | 430,559 (52.8%) | $56,601 |
| Female | 385,455 (47.2%) | $39,729 |
| Total | 816,014 (100.0%) | $47,441 |
Earnings by Sex by Income Bracket in New Hampshire
The most common earnings brackets in New Hampshire are $100,000+ for men (101,568 | 23.6%) and $100,000+ for women (39,177 | 10.2%).
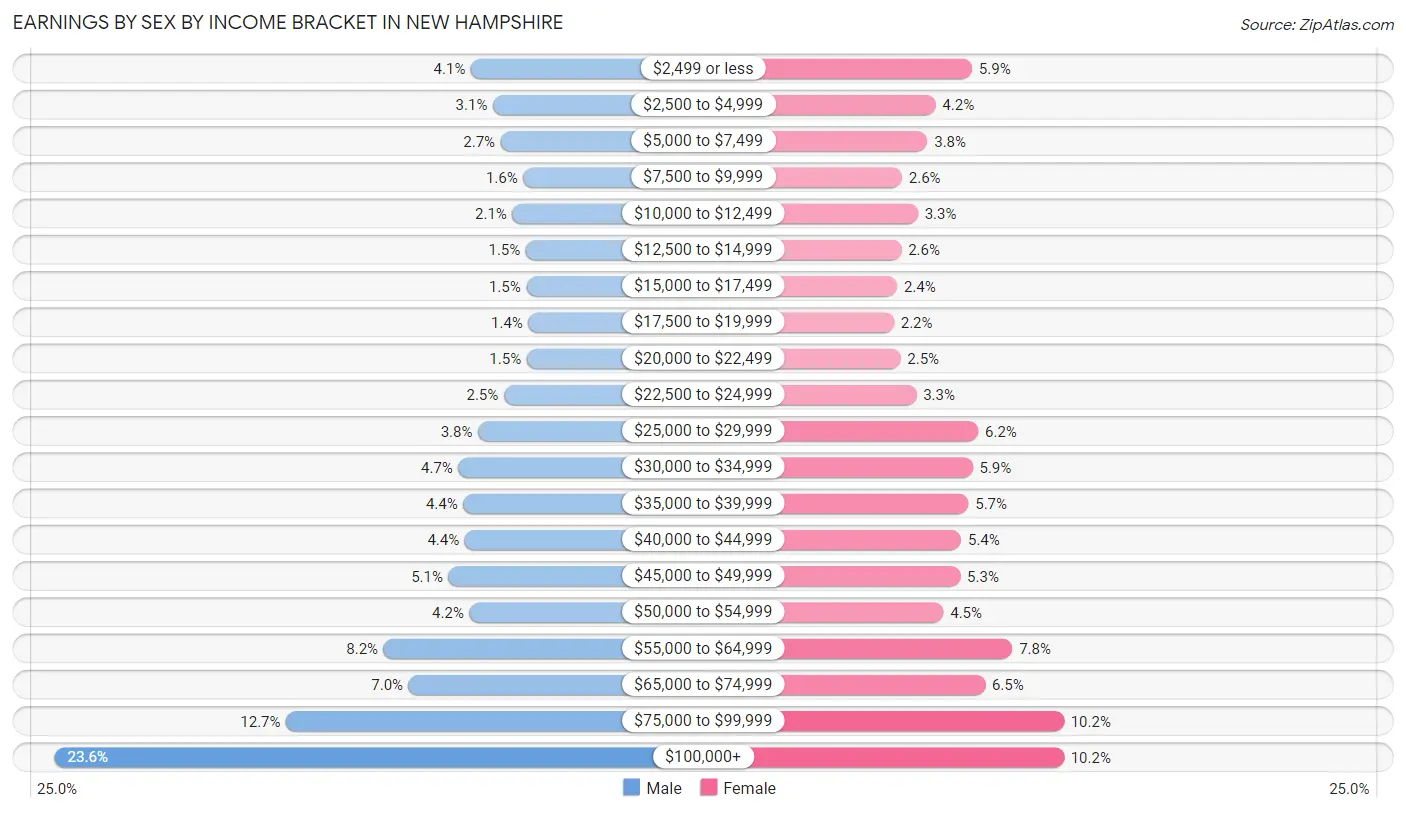
| Income | Male | Female |
| $2,499 or less | 17,550 (4.1%) | 22,585 (5.9%) |
| $2,500 to $4,999 | 13,123 (3.0%) | 15,981 (4.2%) |
| $5,000 to $7,499 | 11,579 (2.7%) | 14,520 (3.8%) |
| $7,500 to $9,999 | 7,032 (1.6%) | 9,964 (2.6%) |
| $10,000 to $12,499 | 9,213 (2.1%) | 12,785 (3.3%) |
| $12,500 to $14,999 | 6,484 (1.5%) | 9,844 (2.5%) |
| $15,000 to $17,499 | 6,402 (1.5%) | 9,067 (2.4%) |
| $17,500 to $19,999 | 5,986 (1.4%) | 8,497 (2.2%) |
| $20,000 to $22,499 | 6,320 (1.5%) | 9,689 (2.5%) |
| $22,500 to $24,999 | 10,931 (2.5%) | 12,523 (3.3%) |
| $25,000 to $29,999 | 16,162 (3.7%) | 23,708 (6.1%) |
| $30,000 to $34,999 | 20,127 (4.7%) | 22,712 (5.9%) |
| $35,000 to $39,999 | 19,112 (4.4%) | 21,945 (5.7%) |
| $40,000 to $44,999 | 18,822 (4.4%) | 20,614 (5.3%) |
| $45,000 to $49,999 | 22,094 (5.1%) | 20,474 (5.3%) |
| $50,000 to $54,999 | 17,887 (4.2%) | 17,417 (4.5%) |
| $55,000 to $64,999 | 35,187 (8.2%) | 29,882 (7.7%) |
| $65,000 to $74,999 | 30,124 (7.0%) | 24,922 (6.5%) |
| $75,000 to $99,999 | 54,856 (12.7%) | 39,149 (10.2%) |
| $100,000+ | 101,568 (23.6%) | 39,177 (10.2%) |
| Total | 430,559 (100.0%) | 385,455 (100.0%) |
Earnings by Sex by Educational Attainment in New Hampshire
Average earnings in New Hampshire are $65,089 for men and $45,991 for women, a difference of 29.3%. Men with an educational attainment of graduate degree enjoy the highest average annual earnings of $106,148, while those with less than high school education earn the least with $40,147. Women with an educational attainment of graduate degree earn the most with the average annual earnings of $72,708, while those with less than high school education have the smallest earnings of $28,091.
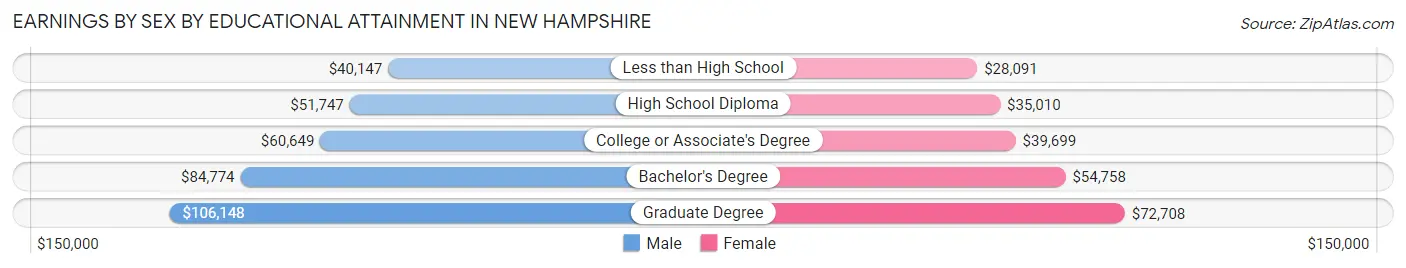
| Educational Attainment | Male Income | Female Income |
| Less than High School | $40,147 | $28,091 |
| High School Diploma | $51,747 | $35,010 |
| College or Associate's Degree | $60,649 | $39,699 |
| Bachelor's Degree | $84,774 | $54,758 |
| Graduate Degree | $106,148 | $72,708 |
| Total | $65,089 | $45,991 |
Family Income in New Hampshire
Family Income Brackets in New Hampshire
According to the New Hampshire family income data, there are 83,876 families falling into the $100,000 to $149,999 income range, which is the most common income bracket and makes up 23.7% of all families. Conversely, the $10,000 to $14,999 income bracket is the least frequent group with only 4,247 families (1.2%) belonging to this category.
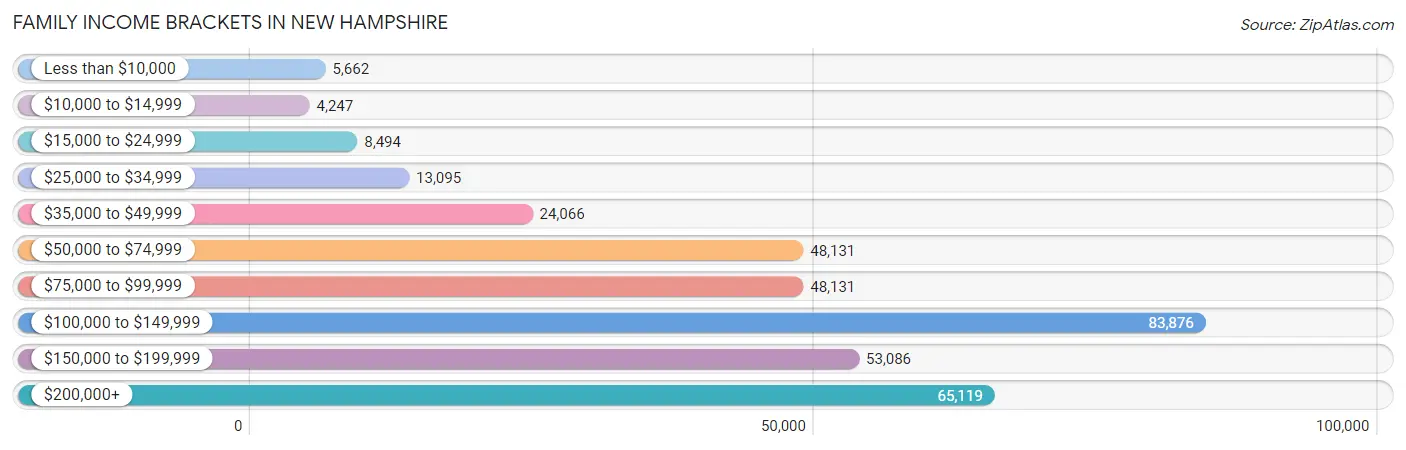
| Income Bracket | # Families | % Families |
| Less than $10,000 | 5,662 | 1.6% |
| $10,000 to $14,999 | 4,247 | 1.2% |
| $15,000 to $24,999 | 8,494 | 2.4% |
| $25,000 to $34,999 | 13,095 | 3.7% |
| $35,000 to $49,999 | 24,066 | 6.8% |
| $50,000 to $74,999 | 48,131 | 13.6% |
| $75,000 to $99,999 | 48,131 | 13.6% |
| $100,000 to $149,999 | 83,876 | 23.7% |
| $150,000 to $199,999 | 53,086 | 15.0% |
| $200,000+ | 65,119 | 18.4% |
Family Income by Famaliy Size in New Hampshire
5-person families (22,391 | 6.3%) account for the highest median family income in New Hampshire with $147,217 per family, while 2-person families (184,737 | 52.2%) have the highest median income of $47,922 per family member.
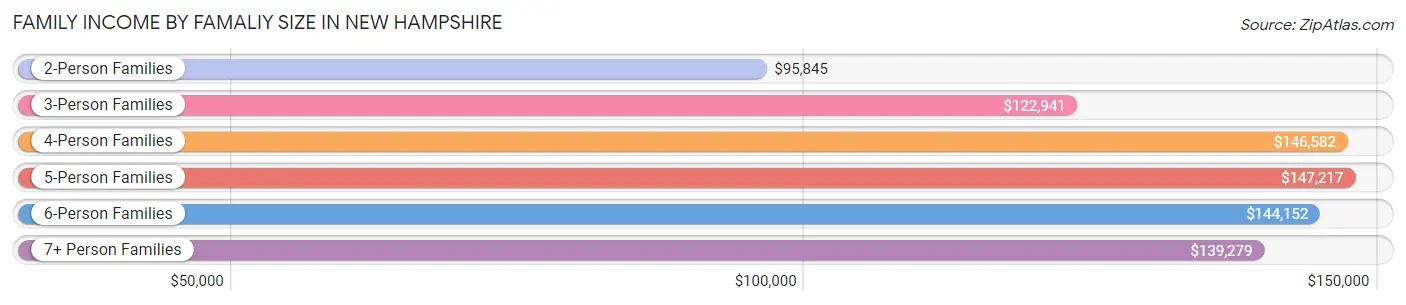
| Income Bracket | # Families | Median Income |
| 2-Person Families | 184,737 (52.2%) | $95,845 |
| 3-Person Families | 75,447 (21.3%) | $122,941 |
| 4-Person Families | 61,786 (17.5%) | $146,582 |
| 5-Person Families | 22,391 (6.3%) | $147,217 |
| 6-Person Families | 6,522 (1.8%) | $144,152 |
| 7+ Person Families | 3,023 (0.9%) | $139,279 |
| Total | 353,906 (100.0%) | $113,605 |
Family Income by Number of Earners in New Hampshire
The median family income in New Hampshire is $113,605, with families comprising 3+ earners (49,776) having the highest median family income of $172,549, while families with no earners (49,449) have the lowest median family income of $57,766, accounting for 14.1% and 14.0% of families, respectively.
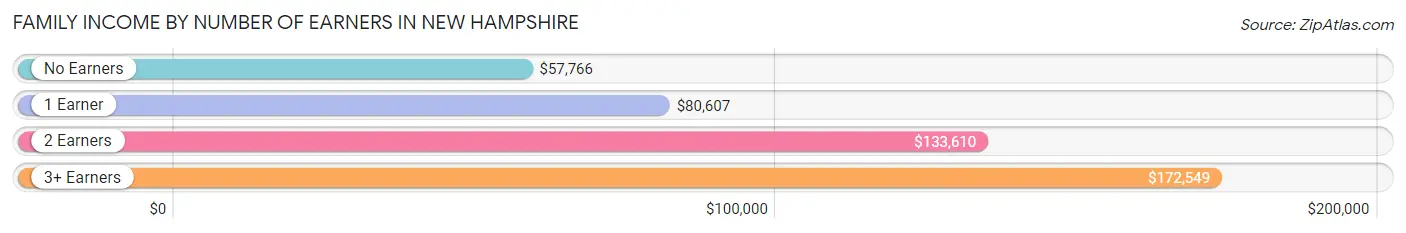
| Number of Earners | # Families | Median Income |
| No Earners | 49,449 (14.0%) | $57,766 |
| 1 Earner | 97,867 (27.7%) | $80,607 |
| 2 Earners | 156,814 (44.3%) | $133,610 |
| 3+ Earners | 49,776 (14.1%) | $172,549 |
| Total | 353,906 (100.0%) | $113,605 |
Household Income in New Hampshire
Household Income Brackets in New Hampshire
With 108,478 households falling in the category, the $100,000 to $149,999 income range is the most frequent in New Hampshire, accounting for 19.9% of all households. In contrast, only 15,263 households (2.8%) fall into the $10,000 to $14,999 income bracket, making it the least populous group.
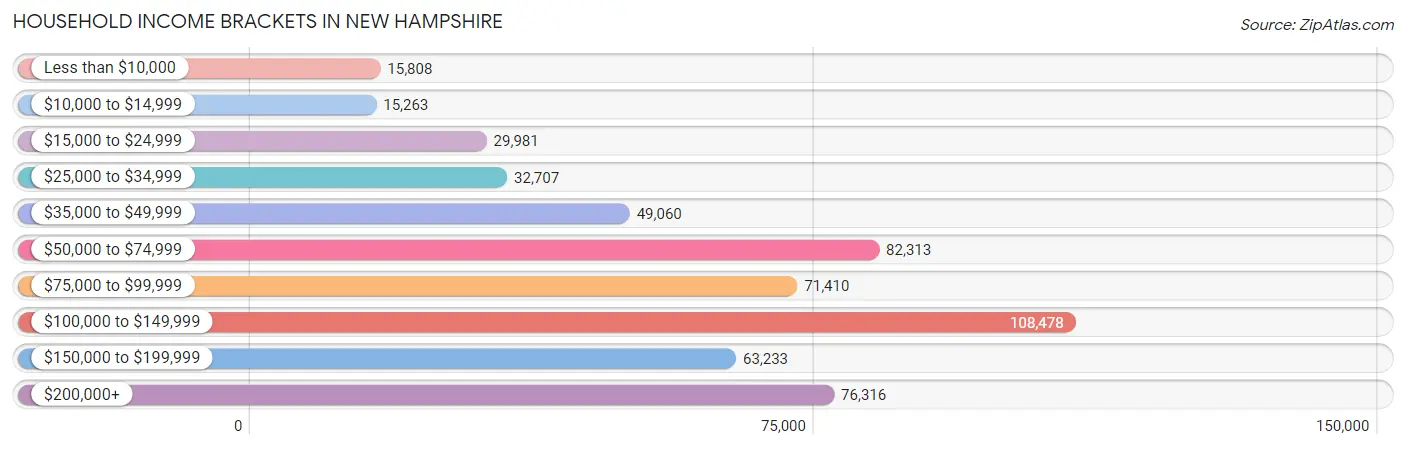
| Income Bracket | # Households | % Households |
| Less than $10,000 | 15,808 | 2.9% |
| $10,000 to $14,999 | 15,263 | 2.8% |
| $15,000 to $24,999 | 29,981 | 5.5% |
| $25,000 to $34,999 | 32,707 | 6.0% |
| $35,000 to $49,999 | 49,060 | 9.0% |
| $50,000 to $74,999 | 82,313 | 15.1% |
| $75,000 to $99,999 | 71,410 | 13.1% |
| $100,000 to $149,999 | 108,478 | 19.9% |
| $150,000 to $199,999 | 63,233 | 11.6% |
| $200,000+ | 76,316 | 14.0% |
Household Income by Householder Age in New Hampshire
The median household income in New Hampshire is $90,845, with the highest median household income of $111,608 found in the 45 to 64 years age bracket for the primary householder. A total of 220,605 households (40.5%) fall into this category. Meanwhile, the 15 to 24 years age bracket for the primary householder has the lowest median household income of $58,664, with 14,573 households (2.7%) in this group.
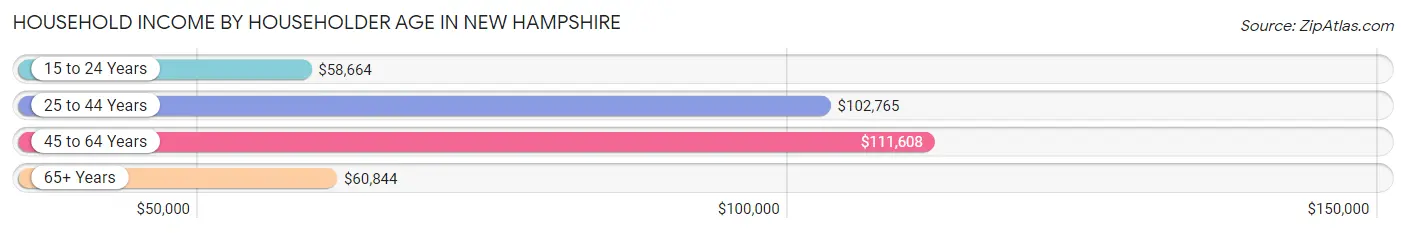
| Income Bracket | # Households | Median Income |
| 15 to 24 Years | 14,573 (2.7%) | $58,664 |
| 25 to 44 Years | 152,088 (27.9%) | $102,765 |
| 45 to 64 Years | 220,605 (40.5%) | $111,608 |
| 65+ Years | 157,850 (29.0%) | $60,844 |
| Total | 545,116 (100.0%) | $90,845 |
Poverty in New Hampshire
Income Below Poverty by Sex and Age in New Hampshire
With 6.4% poverty level for males and 8.3% for females among the residents of New Hampshire, 18 to 24 year old males and 18 to 24 year old females are the most vulnerable to poverty, with 5,718 males (10.4%) and 6,312 females (12.4%) in their respective age groups living below the poverty level.
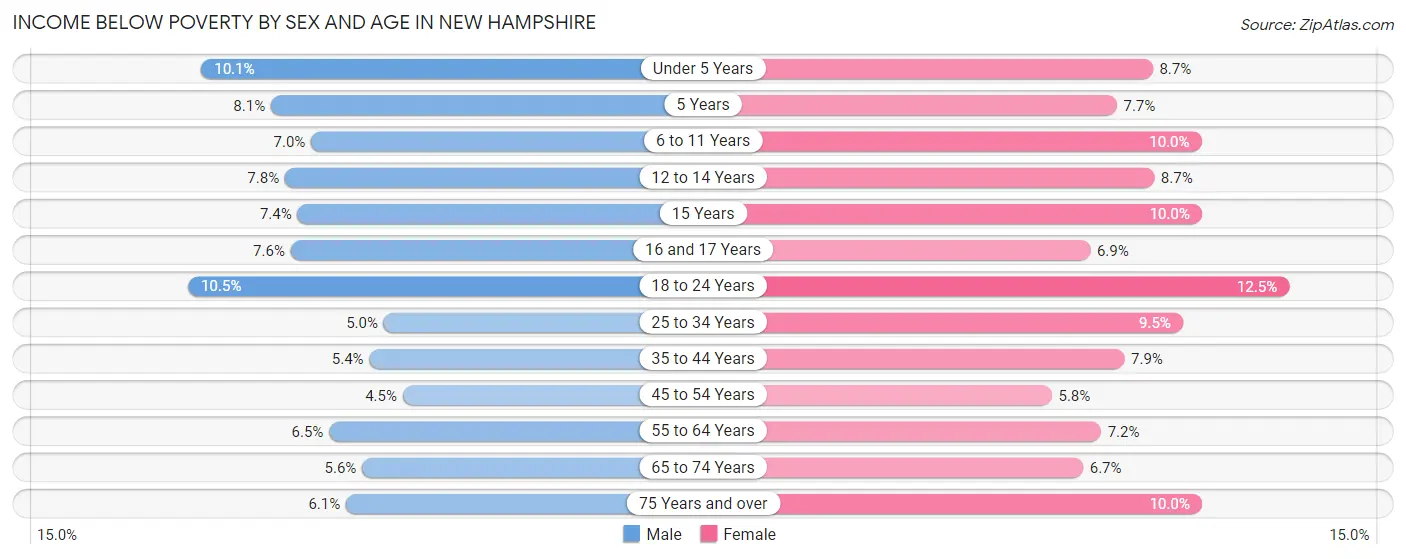
| Age Bracket | Male | Female |
| Under 5 Years | 3,153 (10.1%) | 2,635 (8.6%) |
| 5 Years | 553 (8.1%) | 463 (7.6%) |
| 6 to 11 Years | 3,055 (7.0%) | 4,055 (10.0%) |
| 12 to 14 Years | 1,733 (7.7%) | 1,888 (8.7%) |
| 15 Years | 606 (7.4%) | 802 (10.0%) |
| 16 and 17 Years | 1,275 (7.6%) | 1,073 (6.9%) |
| 18 to 24 Years | 5,718 (10.4%) | 6,312 (12.4%) |
| 25 to 34 Years | 4,466 (5.0%) | 7,863 (9.5%) |
| 35 to 44 Years | 4,430 (5.4%) | 6,284 (7.9%) |
| 45 to 54 Years | 4,043 (4.5%) | 5,266 (5.8%) |
| 55 to 64 Years | 6,990 (6.5%) | 7,818 (7.2%) |
| 65 to 74 Years | 4,287 (5.6%) | 5,409 (6.7%) |
| 75 Years and over | 2,503 (6.0%) | 5,482 (10.0%) |
| Total | 42,812 (6.4%) | 55,350 (8.3%) |
Income Above Poverty by Sex and Age in New Hampshire
According to the poverty statistics in New Hampshire, males aged 45 to 54 years and females aged 45 to 54 years are the age groups that are most secure financially, with 95.5% of males and 94.2% of females in these age groups living above the poverty line.
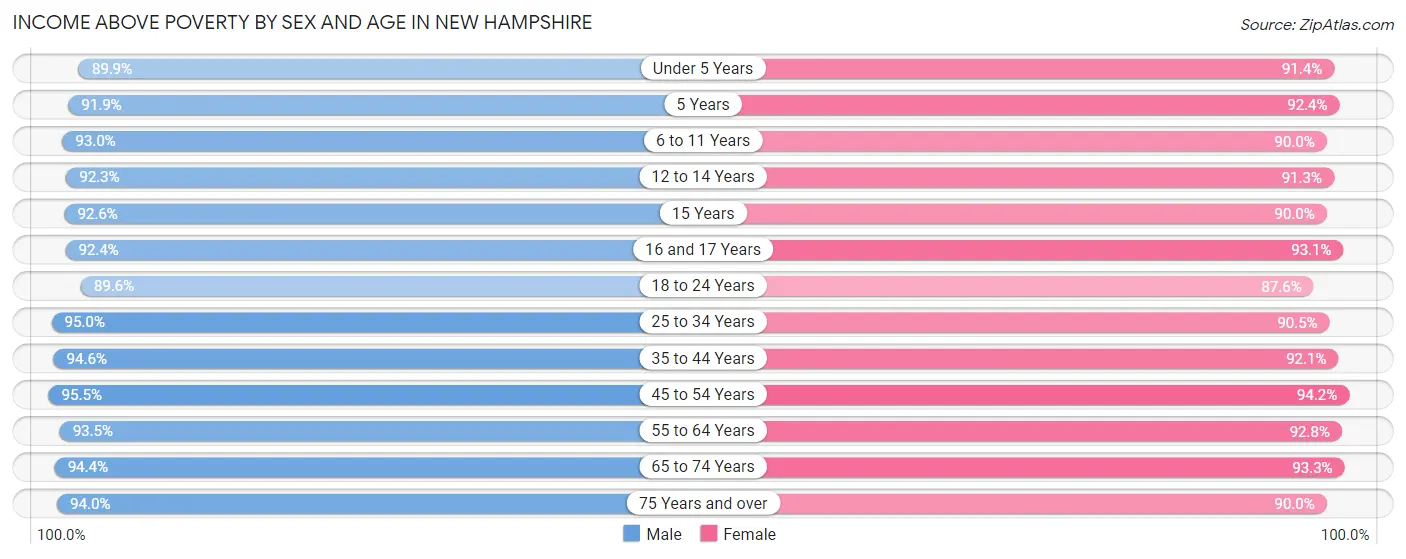
| Age Bracket | Male | Female |
| Under 5 Years | 28,113 (89.9%) | 27,842 (91.3%) |
| 5 Years | 6,241 (91.9%) | 5,592 (92.3%) |
| 6 to 11 Years | 40,443 (93.0%) | 36,461 (90.0%) |
| 12 to 14 Years | 20,633 (92.2%) | 19,842 (91.3%) |
| 15 Years | 7,583 (92.6%) | 7,200 (90.0%) |
| 16 and 17 Years | 15,530 (92.4%) | 14,449 (93.1%) |
| 18 to 24 Years | 48,981 (89.5%) | 44,373 (87.5%) |
| 25 to 34 Years | 84,786 (95.0%) | 75,024 (90.5%) |
| 35 to 44 Years | 77,575 (94.6%) | 73,681 (92.1%) |
| 45 to 54 Years | 86,492 (95.5%) | 84,833 (94.2%) |
| 55 to 64 Years | 100,183 (93.5%) | 100,540 (92.8%) |
| 65 to 74 Years | 72,271 (94.4%) | 75,170 (93.3%) |
| 75 Years and over | 38,869 (94.0%) | 49,205 (90.0%) |
| Total | 627,700 (93.6%) | 614,212 (91.7%) |
Income Below Poverty Among Married-Couple Families in New Hampshire
The poverty statistics for married-couple families in New Hampshire show that 2.1% or 5,897 of the total 284,046 families live below the poverty line. Families with 5 or more children have the highest poverty rate of 13.9%, comprising of 125 families. On the other hand, families with 1 or 2 children have the lowest poverty rate of 1.7%, which includes 1,398 families.
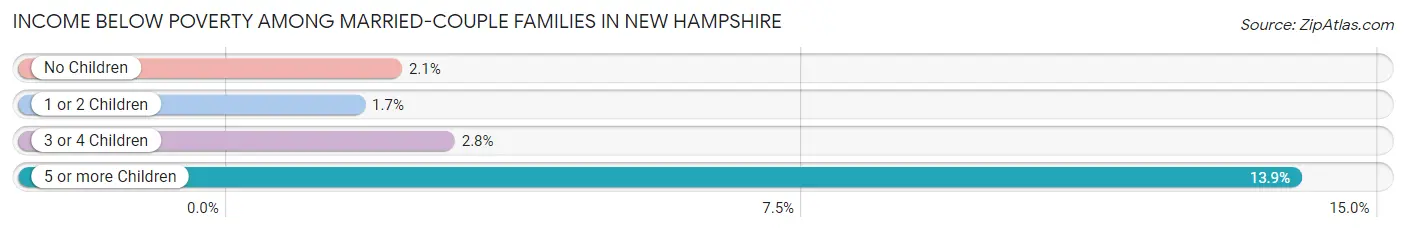
| Children | Above Poverty | Below Poverty |
| No Children | 178,895 (97.9%) | 3,911 (2.1%) |
| 1 or 2 Children | 82,605 (98.3%) | 1,398 (1.7%) |
| 3 or 4 Children | 15,874 (97.2%) | 463 (2.8%) |
| 5 or more Children | 775 (86.1%) | 125 (13.9%) |
| Total | 278,149 (97.9%) | 5,897 (2.1%) |
Income Below Poverty Among Single-Parent Households in New Hampshire
According to the poverty data in New Hampshire, 9.0% or 2,145 single-father households and 16.3% or 7,484 single-mother households are living below the poverty line. Among single-father households, those with 5 or more children have the highest poverty rate, with 11 households (36.7%) experiencing poverty. Likewise, among single-mother households, those with 5 or more children have the highest poverty rate, with 76 households (55.1%) falling below the poverty line.
| Children | Single Father | Single Mother |
| No Children | 411 (3.9%) | 813 (4.6%) |
| 1 or 2 Children | 1,523 (12.6%) | 4,795 (19.9%) |
| 3 or 4 Children | 200 (16.2%) | 1,800 (46.3%) |
| 5 or more Children | 11 (36.7%) | 76 (55.1%) |
| Total | 2,145 (9.0%) | 7,484 (16.3%) |
Income Below Poverty Among Married-Couple vs Single-Parent Households in New Hampshire
The poverty data for New Hampshire shows that 5,897 of the married-couple family households (2.1%) and 9,629 of the single-parent households (13.8%) are living below the poverty level. Within the married-couple family households, those with 5 or more children have the highest poverty rate, with 125 households (13.9%) falling below the poverty line. Among the single-parent households, those with 5 or more children have the highest poverty rate, with 87 household (51.8%) living below poverty.
| Children | Married-Couple Families | Single-Parent Households |
| No Children | 3,911 (2.1%) | 1,224 (4.3%) |
| 1 or 2 Children | 1,398 (1.7%) | 6,318 (17.4%) |
| 3 or 4 Children | 463 (2.8%) | 2,000 (39.1%) |
| 5 or more Children | 125 (13.9%) | 87 (51.8%) |
| Total | 5,897 (2.1%) | 9,629 (13.8%) |
Largest Zip Codes by Population in New Hampshire
The largest zip codes in New Hampshire by population are 03103 (37,093), 03104 (34,962), 03038 (34,506), 03301 (33,986), and 03102 (33,759).
1.03103
37,093 (2.69%)
2.03104
34,962 (2.53%)
3.03038
34,506 (2.50%)
4.03301
33,986 (2.46%)
5.03102
33,759 (2.45%)
6.03820
32,925 (2.39%)
7.03060
31,469 (2.28%)
8.03079
30,350 (2.20%)
9.03062
28,866 (2.09%)
10.03054
27,139 (1.97%)
11.03053
25,780 (1.87%)
12.03051
25,385 (1.84%)
13.03431
24,891 (1.80%)
14.03110
23,385 (1.70%)
15.03801
23,102 (1.67%)
16.03833
22,543 (1.63%)
17.03867
22,349 (1.62%)
18.03246
16,943 (1.23%)
19.03055
16,151 (1.17%)
20.03842
16,123 (1.17%)
21.03303
16,118 (1.17%)
22.03063
15,941 (1.16%)
23.03087
15,764 (1.14%)
24.03824
15,073 (1.09%)
25.03064
14,667 (1.06%)
26.03106
14,654 (1.06%)
27.03076
14,221 (1.03%)
28.03045
14,165 (1.03%)
29.03743
13,647 (0.99%)
30.03878
12,088 (0.88%)
Largest Cities by Population in New Hampshire
The largest cities in New Hampshire by population are Manchester (115,037), Nashua (90,943), Concord (44,049), Dover (32,849), and Rochester (32,573).
115,037 (8.34%)
2.Nashua
90,943 (6.59%)
3.Concord
44,049 (3.19%)
4.Dover
32,849 (2.38%)
32,573 (2.36%)
6.Derry
23,027 (1.67%)
7.Keene
22,907 (1.66%)
22,138 (1.60%)
9.Laconia
16,898 (1.22%)
10.Lebanon
14,515 (1.05%)
11.Claremont
13,018 (0.94%)
12.Londonderry
12,143 (0.88%)
13.Somersworth
11,994 (0.87%)
14.Durham
10,789 (0.78%)
15.Hampton
10,050 (0.73%)
16.Exeter
9,918 (0.72%)
17.Berlin
9,485 (0.69%)
18.Franklin
8,746 (0.63%)
19.Milford
8,530 (0.62%)
20.Hanover
8,234 (0.60%)
21.Hudson
7,003 (0.51%)
22.Newmarket
5,829 (0.42%)
5,808 (0.42%)
24.Hooksett
5,268 (0.38%)
25.Suncook
5,235 (0.38%)
26.Newport
5,228 (0.38%)
27.Pinardville
4,851 (0.35%)
4,643 (0.34%)
29.Littleton
4,587 (0.33%)
30.Plymouth
4,428 (0.32%)
Largest Counties by Population in New Hampshire
The largest counties in New Hampshire by population are Hillsborough County (422,733), Rockingham County (315,169), Merrimack County (153,918), Strafford County (130,965), and Grafton County (90,836).
422,733 (30.64%)
315,169 (22.84%)
153,918 (11.16%)
130,965 (9.49%)
90,836 (6.58%)
Race in New Hampshire
The most populous races in New Hampshire are White / Caucasian (1,241,594 | 90.0%), Two or more Races (63,317 | 4.6%), and Hispanic or Latino (58,654 | 4.3%).
| Race | # Population | % Population |
| Asian | 36,352 | 2.6% |
| Black / African American | 20,920 | 1.5% |
| Hawaiian / Pacific | 348 | 0.0% |
| Hispanic or Latino | 58,654 | 4.3% |
| Native / Alaskan | 2,070 | 0.2% |
| White / Caucasian | 1,241,594 | 90.0% |
| Two or more Races | 63,317 | 4.6% |
| Some other Race | 15,009 | 1.1% |
| Total | 1,379,610 | 100.0% |
Ancestry in New Hampshire
The most populous ancestries reported in New Hampshire are Irish (278,617 | 20.2%), English (239,286 | 17.3%), French (155,811 | 11.3%), Italian (136,326 | 9.9%), and German (117,239 | 8.5%), together accounting for 67.2% of all New Hampshire residents.
| Ancestry | # Population | % Population |
| Afghan | 80 | 0.0% |
| African | 3,061 | 0.2% |
| Alaska Native | 46 | 0.0% |
| Alaskan Athabascan | 61 | 0.0% |
| Albanian | 1,837 | 0.1% |
| Aleut | 29 | 0.0% |
| Alsatian | 49 | 0.0% |
| American | 61,486 | 4.5% |
| Apache | 47 | 0.0% |
| Arab | 8,081 | 0.6% |
| Argentinean | 321 | 0.0% |
| Armenian | 3,639 | 0.3% |
| Assyrian / Chaldean / Syriac | 34 | 0.0% |
| Australian | 429 | 0.0% |
| Austrian | 2,699 | 0.2% |
| Bahamian | 4 | 0.0% |
| Bangladeshi | 20 | 0.0% |
| Barbadian | 171 | 0.0% |
| Basque | 60 | 0.0% |
| Belgian | 1,768 | 0.1% |
| Belizean | 47 | 0.0% |
| Bermudan | 16 | 0.0% |
| Bhutanese | 3,386 | 0.3% |
| Blackfeet | 640 | 0.1% |
| Bolivian | 40 | 0.0% |
| Brazilian | 2,986 | 0.2% |
| British | 9,493 | 0.7% |
| British West Indian | 85 | 0.0% |
| Bulgarian | 614 | 0.0% |
| Burmese | 4,368 | 0.3% |
| Cajun | 144 | 0.0% |
| Cambodian | 12 | 0.0% |
| Canadian | 12,616 | 0.9% |
| Cape Verdean | 669 | 0.1% |
| Carpatho Rusyn | 50 | 0.0% |
| Celtic | 631 | 0.1% |
| Central American | 6,387 | 0.5% |
| Central American Indian | 425 | 0.0% |
| Cherokee | 1,036 | 0.1% |
| Chickasaw | 50 | 0.0% |
| Chilean | 262 | 0.0% |
| Chinese | 13 | 0.0% |
| Chippewa | 205 | 0.0% |
| Choctaw | 106 | 0.0% |
| Colombian | 2,313 | 0.2% |
| Comanche | 3 | 0.0% |
| Costa Rican | 347 | 0.0% |
| Cree | 74 | 0.0% |
| Creek | 30 | 0.0% |
| Croatian | 490 | 0.0% |
| Crow | 3 | 0.0% |
| Cuban | 2,063 | 0.2% |
| Cypriot | 31 | 0.0% |
| Czech | 2,574 | 0.2% |
| Czechoslovakian | 678 | 0.1% |
| Danish | 3,803 | 0.3% |
| Delaware | 57 | 0.0% |
| Dominican | 10,314 | 0.7% |
| Dutch | 10,733 | 0.8% |
| Dutch West Indian | 54 | 0.0% |
| Eastern European | 4,161 | 0.3% |
| Ecuadorian | 497 | 0.0% |
| Egyptian | 298 | 0.0% |
| English | 239,286 | 17.3% |
| Estonian | 215 | 0.0% |
| Ethiopian | 404 | 0.0% |
| European | 19,149 | 1.4% |
| Fijian | 12 | 0.0% |
| Filipino | 230 | 0.0% |
| Finnish | 7,198 | 0.5% |
| French | 155,811 | 11.3% |
| French American Indian | 414 | 0.0% |
| French Canadian | 110,670 | 8.0% |
| German | 117,239 | 8.5% |
| German Russian | 59 | 0.0% |
| Ghanaian | 278 | 0.0% |
| Greek | 19,659 | 1.4% |
| Guamanian / Chamorro | 275 | 0.0% |
| Guatemalan | 1,232 | 0.1% |
| Guyanese | 90 | 0.0% |
| Haitian | 1,753 | 0.1% |
| Honduran | 2,000 | 0.1% |
| Hopi | 148 | 0.0% |
| Hungarian | 4,124 | 0.3% |
| Icelander | 260 | 0.0% |
| Indian (Asian) | 10,056 | 0.7% |
| Indonesian | 364 | 0.0% |
| Inupiat | 90 | 0.0% |
| Iranian | 600 | 0.0% |
| Iraqi | 338 | 0.0% |
| Irish | 278,617 | 20.2% |
| Iroquois | 776 | 0.1% |
| Israeli | 178 | 0.0% |
| Italian | 136,326 | 9.9% |
| Jamaican | 1,780 | 0.1% |
| Japanese | 1,796 | 0.1% |
| Jordanian | 228 | 0.0% |
| Kenyan | 701 | 0.1% |
| Korean | 6,446 | 0.5% |
| Laotian | 934 | 0.1% |
| Latvian | 511 | 0.0% |
| Lebanese | 5,182 | 0.4% |
| Liberian | 373 | 0.0% |
| Lithuanian | 6,605 | 0.5% |
| Luxembourger | 86 | 0.0% |
| Macedonian | 7 | 0.0% |
| Malaysian | 1,103 | 0.1% |
| Maltese | 129 | 0.0% |
| Menominee | 5 | 0.0% |
| Mexican | 9,778 | 0.7% |
| Mexican American Indian | 133 | 0.0% |
| Mongolian | 23 | 0.0% |
| Moroccan | 636 | 0.1% |
| Native Hawaiian | 510 | 0.0% |
| Navajo | 107 | 0.0% |
| New Zealander | 69 | 0.0% |
| Nicaraguan | 620 | 0.0% |
| Nigerian | 345 | 0.0% |
| Northern European | 3,248 | 0.2% |
| Norwegian | 11,383 | 0.8% |
| Osage | 16 | 0.0% |
| Pakistani | 989 | 0.1% |
| Palestinian | 162 | 0.0% |
| Panamanian | 277 | 0.0% |
| Paraguayan | 5 | 0.0% |
| Pennsylvania German | 299 | 0.0% |
| Peruvian | 1,203 | 0.1% |
| Polish | 52,701 | 3.8% |
| Portuguese | 19,030 | 1.4% |
| Potawatomi | 43 | 0.0% |
| Pueblo | 2 | 0.0% |
| Puerto Rican | 19,763 | 1.4% |
| Romanian | 1,473 | 0.1% |
| Russian | 11,473 | 0.8% |
| Salvadoran | 1,911 | 0.1% |
| Samoan | 104 | 0.0% |
| Scandinavian | 4,230 | 0.3% |
| Scotch-Irish | 16,180 | 1.2% |
| Scottish | 53,444 | 3.9% |
| Seminole | 35 | 0.0% |
| Senegalese | 4 | 0.0% |
| Serbian | 550 | 0.0% |
| Sioux | 58 | 0.0% |
| Slavic | 369 | 0.0% |
| Slovak | 1,234 | 0.1% |
| Slovene | 193 | 0.0% |
| Somali | 415 | 0.0% |
| South African | 116 | 0.0% |
| South American | 5,315 | 0.4% |
| South American Indian | 64 | 0.0% |
| Spaniard | 1,305 | 0.1% |
| Spanish | 1,714 | 0.1% |
| Spanish American | 95 | 0.0% |
| Sri Lankan | 4,197 | 0.3% |
| Subsaharan African | 8,310 | 0.6% |
| Sudanese | 821 | 0.1% |
| Swedish | 23,516 | 1.7% |
| Swiss | 2,740 | 0.2% |
| Syrian | 782 | 0.1% |
| Taiwanese | 23 | 0.0% |
| Thai | 11,615 | 0.8% |
| Tlingit-Haida | 3 | 0.0% |
| Trinidadian and Tobagonian | 117 | 0.0% |
| Turkish | 772 | 0.1% |
| U.S. Virgin Islander | 9 | 0.0% |
| Ugandan | 83 | 0.0% |
| Ukrainian | 5,070 | 0.4% |
| Uruguayan | 333 | 0.0% |
| Ute | 2 | 0.0% |
| Venezuelan | 309 | 0.0% |
| Vietnamese | 230 | 0.0% |
| Welsh | 8,720 | 0.6% |
| West Indian | 569 | 0.0% |
| Yakama | 3 | 0.0% |
| Yaqui | 29 | 0.0% |
| Yugoslavian | 1,373 | 0.1% |
| Yuman | 32 | 0.0% |
| Yup'ik | 36 | 0.0% |
| Zimbabwean | 68 | 0.0% | View All 179 Rows |
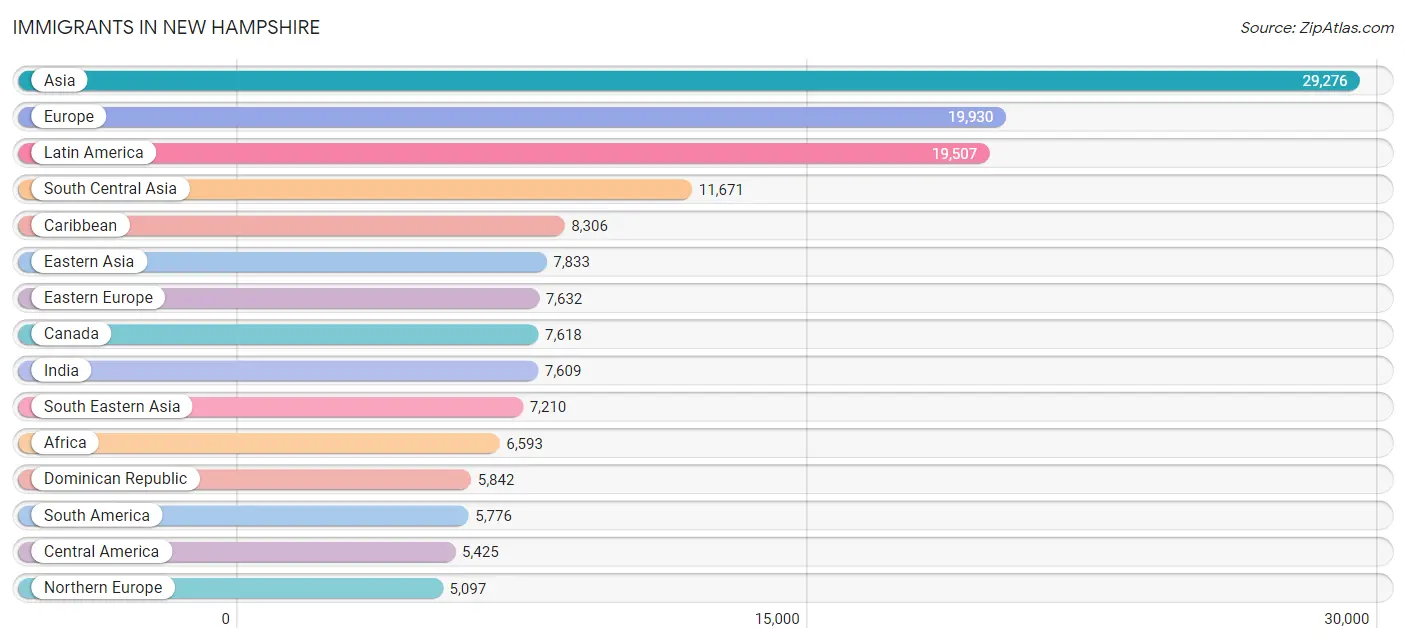
Immigrants in New Hampshire
The most numerous immigrant groups reported in New Hampshire came from Asia (29,276 | 2.1%), Europe (19,930 | 1.4%), Latin America (19,507 | 1.4%), South Central Asia (11,671 | 0.9%), and Caribbean (8,306 | 0.6%), together accounting for 6.4% of all New Hampshire residents.
| Immigration Origin | # Population | % Population |
| Afghanistan | 64 | 0.0% |
| Africa | 6,593 | 0.5% |
| Albania | 491 | 0.0% |
| Argentina | 134 | 0.0% |
| Armenia | 67 | 0.0% |
| Asia | 29,276 | 2.1% |
| Australia | 283 | 0.0% |
| Austria | 309 | 0.0% |
| Azores | 182 | 0.0% |
| Bahamas | 5 | 0.0% |
| Bangladesh | 104 | 0.0% |
| Barbados | 21 | 0.0% |
| Belarus | 18 | 0.0% |
| Belgium | 105 | 0.0% |
| Belize | 14 | 0.0% |
| Bosnia and Herzegovina | 1,068 | 0.1% |
| Brazil | 2,964 | 0.2% |
| Bulgaria | 246 | 0.0% |
| Cabo Verde | 26 | 0.0% |
| Cambodia | 419 | 0.0% |
| Cameroon | 207 | 0.0% |
| Canada | 7,618 | 0.5% |
| Caribbean | 8,306 | 0.6% |
| Central America | 5,425 | 0.4% |
| Chile | 97 | 0.0% |
| China | 4,893 | 0.4% |
| Colombia | 1,179 | 0.1% |
| Congo | 238 | 0.0% |
| Costa Rica | 82 | 0.0% |
| Croatia | 297 | 0.0% |
| Cuba | 410 | 0.0% |
| Czechoslovakia | 139 | 0.0% |
| Denmark | 131 | 0.0% |
| Dominica | 79 | 0.0% |
| Dominican Republic | 5,842 | 0.4% |
| Eastern Africa | 2,042 | 0.2% |
| Eastern Asia | 7,833 | 0.6% |
| Eastern Europe | 7,632 | 0.5% |
| Ecuador | 244 | 0.0% |
| Egypt | 300 | 0.0% |
| El Salvador | 1,066 | 0.1% |
| England | 1,607 | 0.1% |
| Ethiopia | 385 | 0.0% |
| Europe | 19,930 | 1.4% |
| Fiji | 2 | 0.0% |
| France | 705 | 0.1% |
| Germany | 2,742 | 0.2% |
| Ghana | 232 | 0.0% |
| Greece | 719 | 0.1% |
| Guatemala | 913 | 0.1% |
| Guyana | 73 | 0.0% |
| Haiti | 735 | 0.1% |
| Honduras | 1,270 | 0.1% |
| Hong Kong | 424 | 0.0% |
| Hungary | 332 | 0.0% |
| India | 7,609 | 0.5% |
| Indonesia | 460 | 0.0% |
| Iran | 382 | 0.0% |
| Iraq | 221 | 0.0% |
| Ireland | 728 | 0.1% |
| Israel | 311 | 0.0% |
| Italy | 661 | 0.1% |
| Jamaica | 897 | 0.1% |
| Japan | 729 | 0.1% |
| Jordan | 241 | 0.0% |
| Kazakhstan | 88 | 0.0% |
| Kenya | 447 | 0.0% |
| Korea | 2,211 | 0.2% |
| Kuwait | 10 | 0.0% |
| Laos | 512 | 0.0% |
| Latin America | 19,507 | 1.4% |
| Latvia | 30 | 0.0% |
| Lebanon | 654 | 0.1% |
| Liberia | 467 | 0.0% |
| Lithuania | 73 | 0.0% |
| Malaysia | 380 | 0.0% |
| Mexico | 1,650 | 0.1% |
| Middle Africa | 940 | 0.1% |
| Moldova | 71 | 0.0% |
| Morocco | 385 | 0.0% |
| Nepal | 2,112 | 0.2% |
| Netherlands | 431 | 0.0% |
| Nicaragua | 357 | 0.0% |
| Nigeria | 464 | 0.0% |
| North Macedonia | 78 | 0.0% |
| Northern Africa | 1,046 | 0.1% |
| Northern Europe | 5,097 | 0.4% |
| Norway | 124 | 0.0% |
| Oceania | 439 | 0.0% |
| Pakistan | 158 | 0.0% |
| Panama | 73 | 0.0% |
| Peru | 686 | 0.1% |
| Philippines | 2,768 | 0.2% |
| Poland | 743 | 0.1% |
| Portugal | 1,058 | 0.1% |
| Romania | 861 | 0.1% |
| Russia | 1,351 | 0.1% |
| Saudi Arabia | 103 | 0.0% |
| Scotland | 708 | 0.1% |
| Senegal | 12 | 0.0% |
| Serbia | 53 | 0.0% |
| Singapore | 9 | 0.0% |
| Somalia | 206 | 0.0% |
| South Africa | 358 | 0.0% |
| South America | 5,776 | 0.4% |
| South Central Asia | 11,671 | 0.9% |
| South Eastern Asia | 7,210 | 0.5% |
| Southern Europe | 2,590 | 0.2% |
| Spain | 146 | 0.0% |
| Sri Lanka | 181 | 0.0% |
| Sudan | 299 | 0.0% |
| Sweden | 244 | 0.0% |
| Switzerland | 319 | 0.0% |
| Syria | 197 | 0.0% |
| Taiwan | 694 | 0.1% |
| Thailand | 527 | 0.0% |
| Trinidad and Tobago | 146 | 0.0% |
| Turkey | 436 | 0.0% |
| Uganda | 127 | 0.0% |
| Ukraine | 936 | 0.1% |
| Uruguay | 131 | 0.0% |
| Uzbekistan | 113 | 0.0% |
| Venezuela | 161 | 0.0% |
| Vietnam | 1,838 | 0.1% |
| Western Africa | 1,493 | 0.1% |
| Western Asia | 2,475 | 0.2% |
| Western Europe | 4,611 | 0.3% |
| Yemen | 15 | 0.0% |
| Zaire | 437 | 0.0% |
| Zimbabwe | 112 | 0.0% | View All 130 Rows |
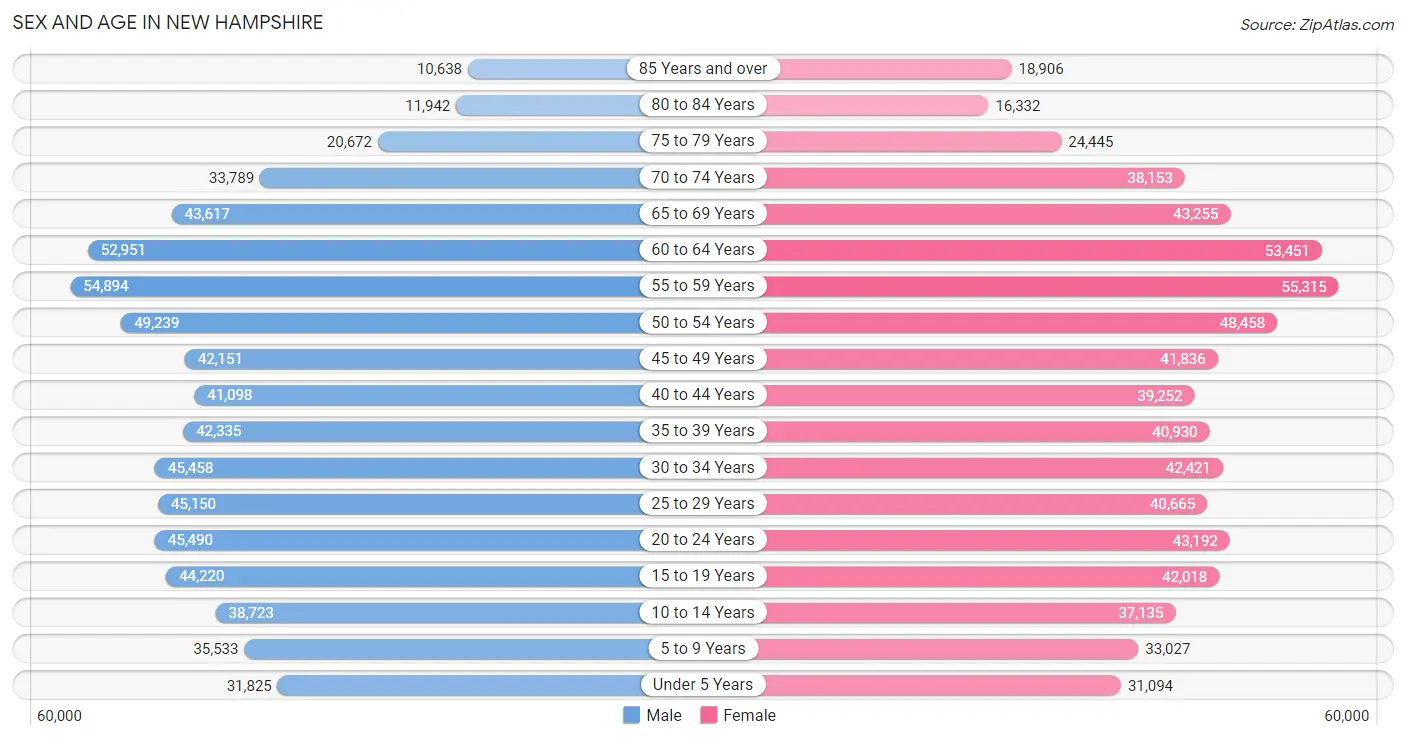
Sex and Age in New Hampshire
Sex and Age in New Hampshire
The most populous age groups in New Hampshire are 55 to 59 Years (54,894 | 8.0%) for men and 55 to 59 Years (55,315 | 8.0%) for women.
| Age Bracket | Male | Female |
| Under 5 Years | 31,825 (4.6%) | 31,094 (4.5%) |
| 5 to 9 Years | 35,533 (5.1%) | 33,027 (4.8%) |
| 10 to 14 Years | 38,723 (5.6%) | 37,135 (5.4%) |
| 15 to 19 Years | 44,220 (6.4%) | 42,018 (6.1%) |
| 20 to 24 Years | 45,490 (6.6%) | 43,192 (6.3%) |
| 25 to 29 Years | 45,150 (6.6%) | 40,665 (5.9%) |
| 30 to 34 Years | 45,458 (6.6%) | 42,421 (6.1%) |
| 35 to 39 Years | 42,335 (6.1%) | 40,930 (5.9%) |
| 40 to 44 Years | 41,098 (6.0%) | 39,252 (5.7%) |
| 45 to 49 Years | 42,151 (6.1%) | 41,836 (6.1%) |
| 50 to 54 Years | 49,239 (7.1%) | 48,458 (7.0%) |
| 55 to 59 Years | 54,894 (8.0%) | 55,315 (8.0%) |
| 60 to 64 Years | 52,951 (7.7%) | 53,451 (7.7%) |
| 65 to 69 Years | 43,617 (6.3%) | 43,255 (6.3%) |
| 70 to 74 Years | 33,789 (4.9%) | 38,153 (5.5%) |
| 75 to 79 Years | 20,672 (3.0%) | 24,445 (3.5%) |
| 80 to 84 Years | 11,942 (1.7%) | 16,332 (2.4%) |
| 85 Years and over | 10,638 (1.5%) | 18,906 (2.7%) |
| Total | 689,725 (100.0%) | 689,885 (100.0%) |
Families and Households in New Hampshire
Median Family Size in New Hampshire
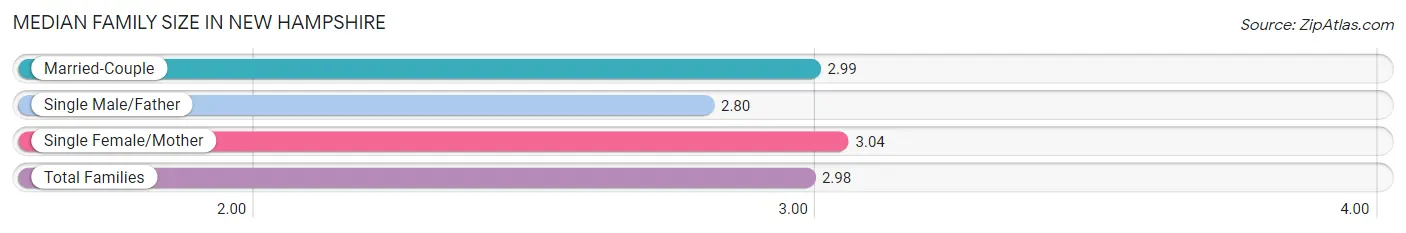
The median family size in New Hampshire is 2.98 persons per family, with single female/mother families (45,996 | 13.0%) accounting for the largest median family size of 3.04 persons per family. On the other hand, single male/father families (23,864 | 6.7%) represent the smallest median family size with 2.80 persons per family.
| Family Type | # Families | Family Size |
| Married-Couple | 284,046 (80.3%) | 2.99 |
| Single Male/Father | 23,864 (6.7%) | 2.80 |
| Single Female/Mother | 45,996 (13.0%) | 3.04 |
| Total Families | 353,906 (100.0%) | 2.98 |
Median Household Size in New Hampshire
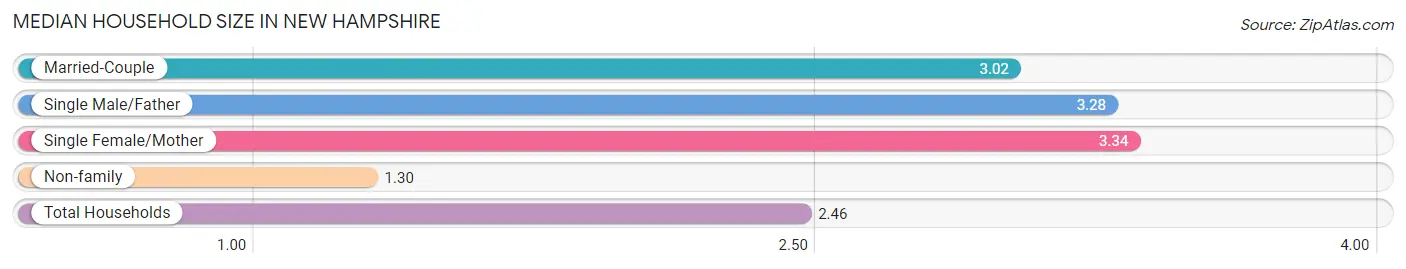
The median household size in New Hampshire is 2.46 persons per household, with single female/mother households (45,996 | 8.4%) accounting for the largest median household size of 3.34 persons per household. non-family households (191,210 | 35.1%) represent the smallest median household size with 1.30 persons per household.
| Household Type | # Households | Household Size |
| Married-Couple | 284,046 (52.1%) | 3.02 |
| Single Male/Father | 23,864 (4.4%) | 3.28 |
| Single Female/Mother | 45,996 (8.4%) | 3.34 |
| Non-family | 191,210 (35.1%) | 1.30 |
| Total Households | 545,116 (100.0%) | 2.46 |
Household Size by Marriage Status in New Hampshire
Out of a total of 545,116 households in New Hampshire, 353,906 (64.9%) are family households, while 191,210 (35.1%) are nonfamily households. The most numerous type of family households are 2-person households, comprising 171,959, and the most common type of nonfamily households are 1-person households, comprising 147,474.
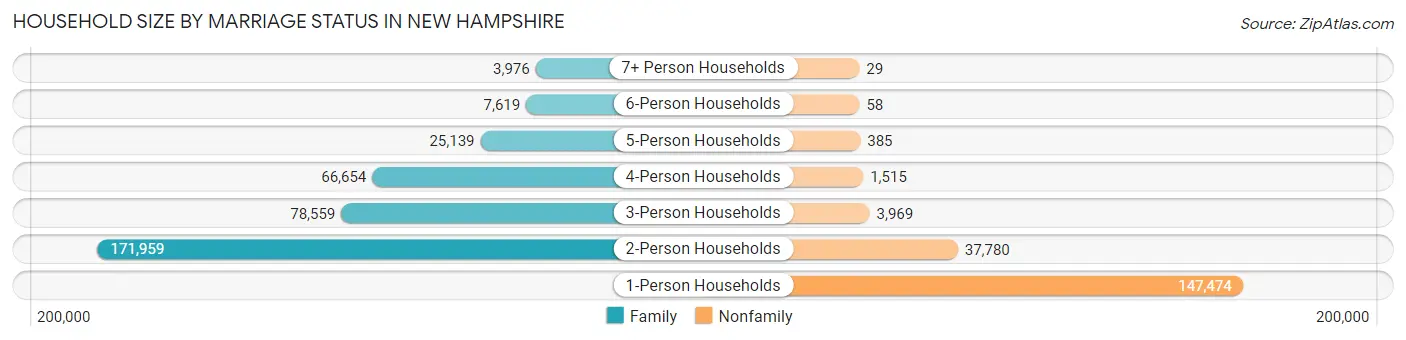
| Household Size | Family Households | Nonfamily Households |
| 1-Person Households | - | 147,474 (27.1%) |
| 2-Person Households | 171,959 (31.6%) | 37,780 (6.9%) |
| 3-Person Households | 78,559 (14.4%) | 3,969 (0.7%) |
| 4-Person Households | 66,654 (12.2%) | 1,515 (0.3%) |
| 5-Person Households | 25,139 (4.6%) | 385 (0.1%) |
| 6-Person Households | 7,619 (1.4%) | 58 (0.0%) |
| 7+ Person Households | 3,976 (0.7%) | 29 (0.0%) |
| Total | 353,906 (64.9%) | 191,210 (35.1%) |
Female Fertility in New Hampshire
Fertility by Age in New Hampshire
Average fertility rate in New Hampshire is 46.0 births per 1,000 women. Women in the age bracket of 20 to 34 years have the highest fertility rate with 75.0 births per 1,000 women. Women in the age bracket of 20 to 34 years acount for 68.5% of all women with births.
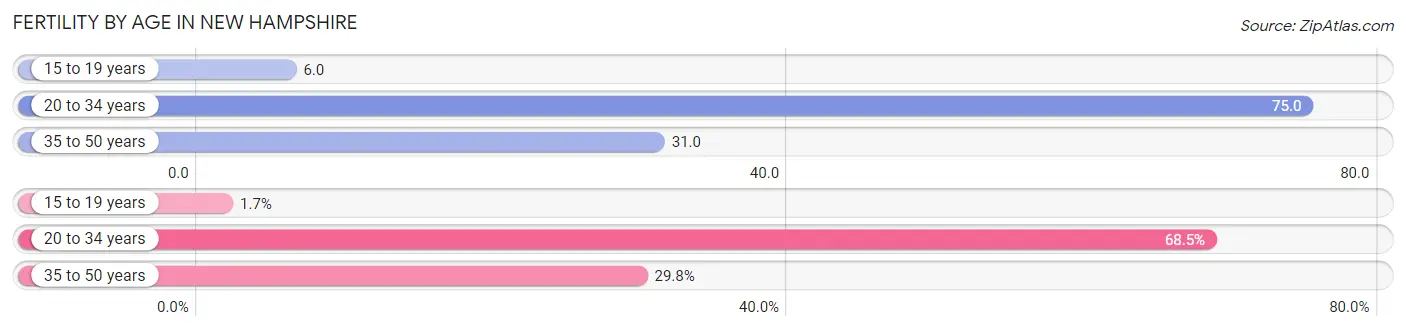
| Age Bracket | Women with Births | Births / 1,000 Women |
| 15 to 19 years | 235 (1.7%) | 6.0 |
| 20 to 34 years | 9,447 (68.5%) | 75.0 |
| 35 to 50 years | 4,116 (29.8%) | 31.0 |
| Total | 13,798 (100.0%) | 46.0 |
Fertility by Age by Marriage Status in New Hampshire
70.6% of women with births (13,798) in New Hampshire are married. The highest percentage of unmarried women with births falls into 15 to 19 years age bracket with 100.0% of them unmarried at the time of birth, while the lowest percentage of unmarried women with births belong to 35 to 50 years age bracket with 18.1% of them unmarried.
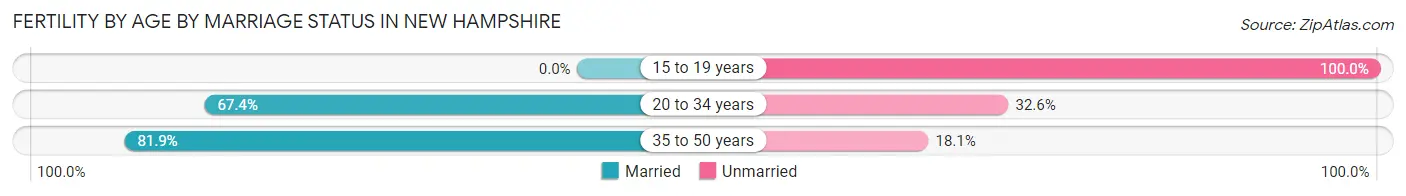
| Age Bracket | Married | Unmarried |
| 15 to 19 years | 0 (0.0%) | 235 (100.0%) |
| 20 to 34 years | 6,367 (67.4%) | 3,080 (32.6%) |
| 35 to 50 years | 3,371 (81.9%) | 745 (18.1%) |
| Total | 9,741 (70.6%) | 4,057 (29.4%) |
Fertility by Education in New Hampshire
Average fertility rate in New Hampshire is 46.0 births per 1,000 women. Women with the education attainment of graduate degree have the highest fertility rate of 60.0 births per 1,000 women, while women with the education attainment of less than high school have the lowest fertility at 22.0 births per 1,000 women. Women with the education attainment of bachelor's degree represent 28.1% of all women with births.
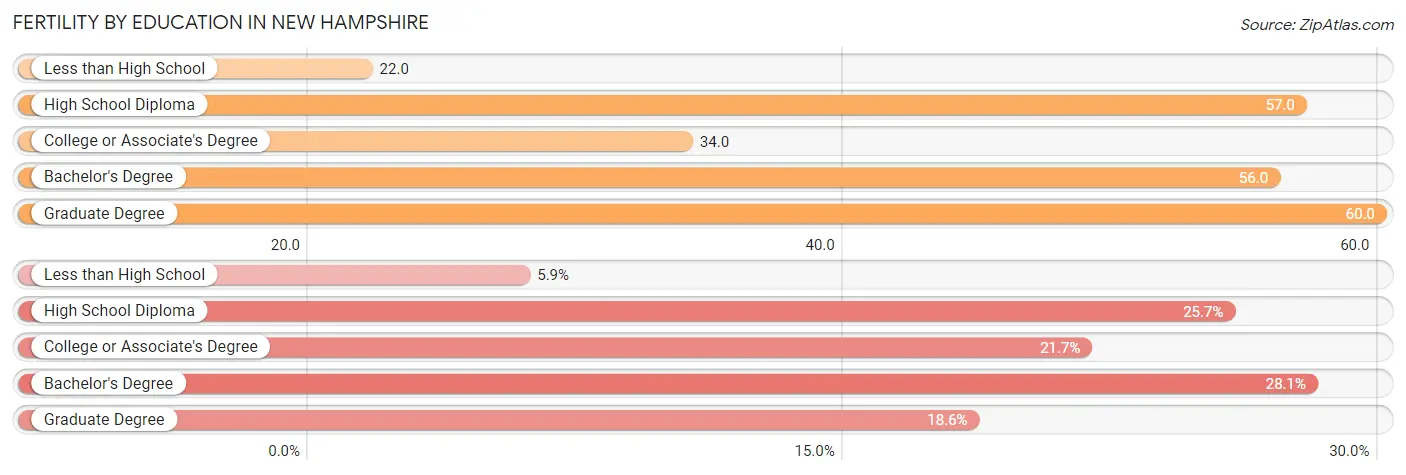
| Educational Attainment | Women with Births | Births / 1,000 Women |
| Less than High School | 818 (5.9%) | 22.0 |
| High School Diploma | 3,551 (25.7%) | 57.0 |
| College or Associate's Degree | 2,997 (21.7%) | 34.0 |
| Bachelor's Degree | 3,872 (28.1%) | 56.0 |
| Graduate Degree | 2,560 (18.5%) | 60.0 |
| Total | 13,798 (100.0%) | 46.0 |
Fertility by Education by Marriage Status in New Hampshire
29.4% of women with births in New Hampshire are unmarried. Women with the educational attainment of graduate degree are most likely to be married with 92.8% of them married at childbirth, while women with the educational attainment of high school diploma are least likely to be married with 51.3% of them unmarried at childbirth.
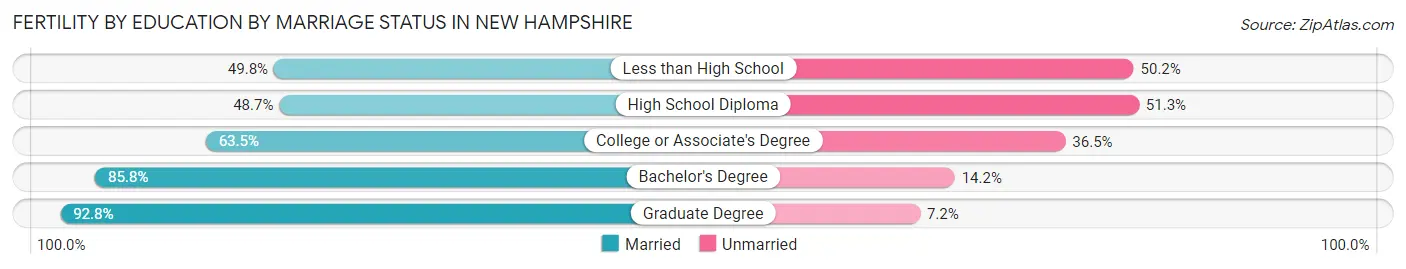
| Educational Attainment | Married | Unmarried |
| Less than High School | 407 (49.8%) | 411 (50.2%) |
| High School Diploma | 1,729 (48.7%) | 1,822 (51.3%) |
| College or Associate's Degree | 1,903 (63.5%) | 1,094 (36.5%) |
| Bachelor's Degree | 3,322 (85.8%) | 550 (14.2%) |
| Graduate Degree | 2,376 (92.8%) | 184 (7.2%) |
| Total | 9,741 (70.6%) | 4,057 (29.4%) |
Employment Characteristics in New Hampshire
Employment by Class of Employer in New Hampshire
Among the 726,246 employed individuals in New Hampshire, private company employees (477,802 | 65.8%), not-for-profit organizations (85,255 | 11.7%), and local government employees (52,157 | 7.2%) make up the most common classes of employment.
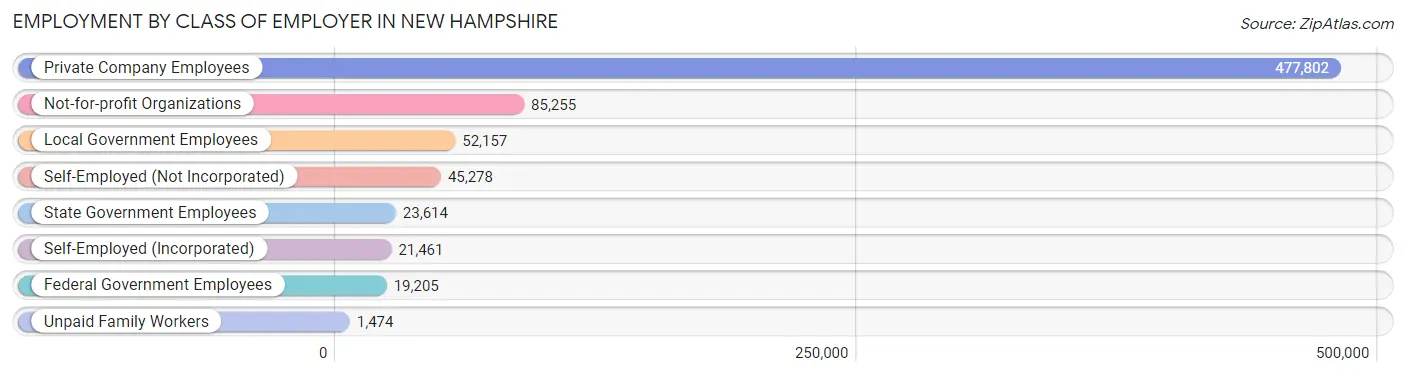
| Employer Class | # Employees | % Employees |
| Private Company Employees | 477,802 | 65.8% |
| Self-Employed (Incorporated) | 21,461 | 3.0% |
| Self-Employed (Not Incorporated) | 45,278 | 6.2% |
| Not-for-profit Organizations | 85,255 | 11.7% |
| Local Government Employees | 52,157 | 7.2% |
| State Government Employees | 23,614 | 3.3% |
| Federal Government Employees | 19,205 | 2.6% |
| Unpaid Family Workers | 1,474 | 0.2% |
| Total | 726,246 | 100.0% |
Employment Status by Age in New Hampshire
According to the labor force statistics for New Hampshire, out of the total population over 16 years of age (1,156,055), 66.6% or 769,933 individuals are in the labor force, with 3.6% or 27,718 of them unemployed. The age group with the highest labor force participation rate is 25 to 29 years, with 88.3% or 75,775 individuals in the labor force. Within the labor force, the 16 to 19 years age range has the highest percentage of unemployed individuals, with 8.2% or 2,894 of them being unemployed.
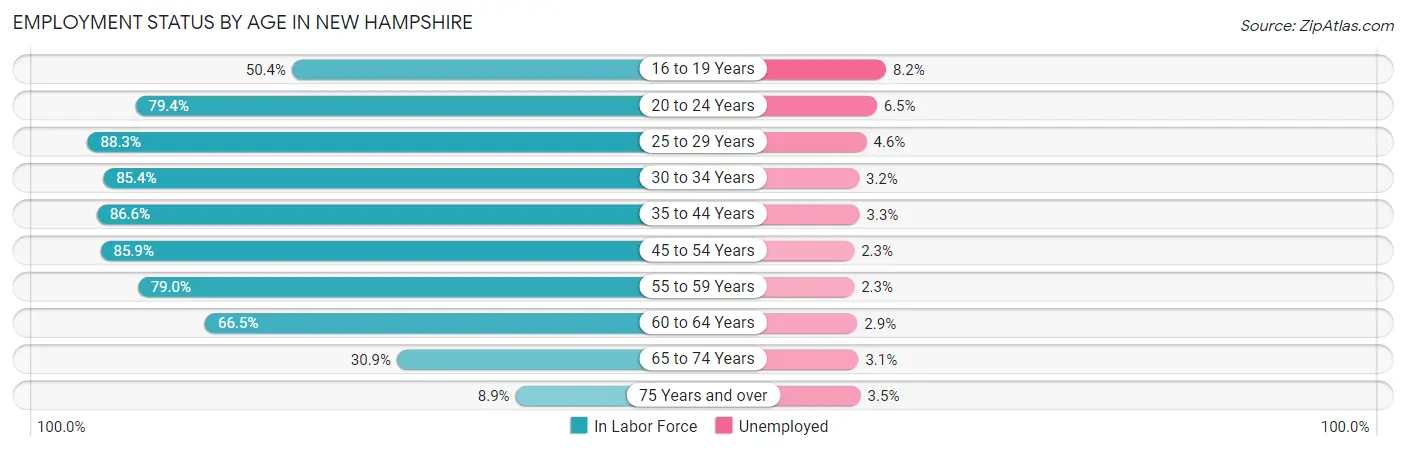
| Age Bracket | In Labor Force | Unemployed |
| 16 to 19 Years | 35,290 (50.4%) | 2,894 (8.2%) |
| 20 to 24 Years | 70,414 (79.4%) | 4,577 (6.5%) |
| 25 to 29 Years | 75,775 (88.3%) | 3,486 (4.6%) |
| 30 to 34 Years | 75,049 (85.4%) | 2,402 (3.2%) |
| 35 to 44 Years | 141,691 (86.6%) | 4,676 (3.3%) |
| 45 to 54 Years | 156,067 (85.9%) | 3,590 (2.3%) |
| 55 to 59 Years | 87,065 (79.0%) | 2,002 (2.3%) |
| 60 to 64 Years | 70,757 (66.5%) | 2,052 (2.9%) |
| 65 to 74 Years | 49,074 (30.9%) | 1,521 (3.1%) |
| 75 Years and over | 9,161 (8.9%) | 321 (3.5%) |
| Total | 769,933 (66.6%) | 27,718 (3.6%) |
Employment Status by Educational Attainment in New Hampshire
According to labor force statistics for New Hampshire, 82.4% of individuals (606,138) out of the total population between 25 and 64 years of age (735,604) are in the labor force, with 3.0% or 18,184 of them being unemployed. The group with the highest labor force participation rate are those with the educational attainment of bachelor's degree or higher, with 88.7% or 262,770 individuals in the labor force. Within the labor force, individuals with less than high school education have the highest percentage of unemployment, with 7.7% or 1,878 of them being unemployed.
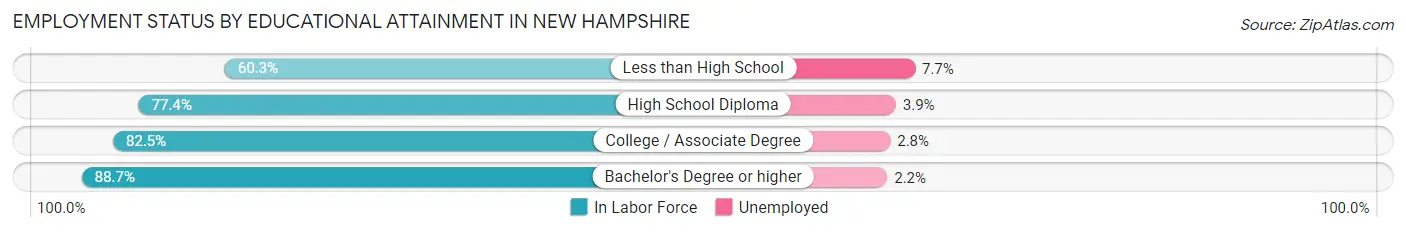
| Educational Attainment | In Labor Force | Unemployed |
| Less than High School | 24,390 (60.3%) | 3,114 (7.7%) |
| High School Diploma | 149,150 (77.4%) | 7,515 (3.9%) |
| College / Associate Degree | 170,123 (82.5%) | 5,774 (2.8%) |
| Bachelor's Degree or higher | 262,770 (88.7%) | 6,517 (2.2%) |
| Total | 606,138 (82.4%) | 22,068 (3.0%) |
Employment Occupations by Sex in New Hampshire
Management, Business, Science and Arts Occupations
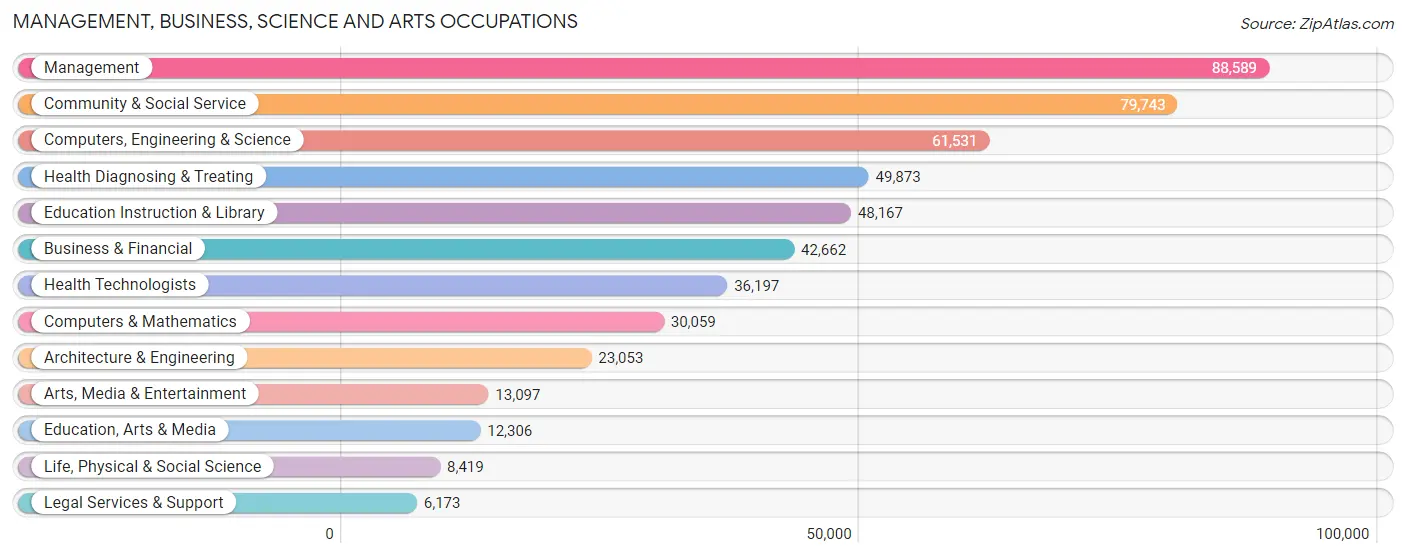
The most common Management, Business, Science and Arts occupations in New Hampshire are Management (88,589 | 12.0%), Community & Social Service (79,743 | 10.8%), Computers, Engineering & Science (61,531 | 8.3%), Health Diagnosing & Treating (49,873 | 6.7%), and Education Instruction & Library (48,167 | 6.5%).
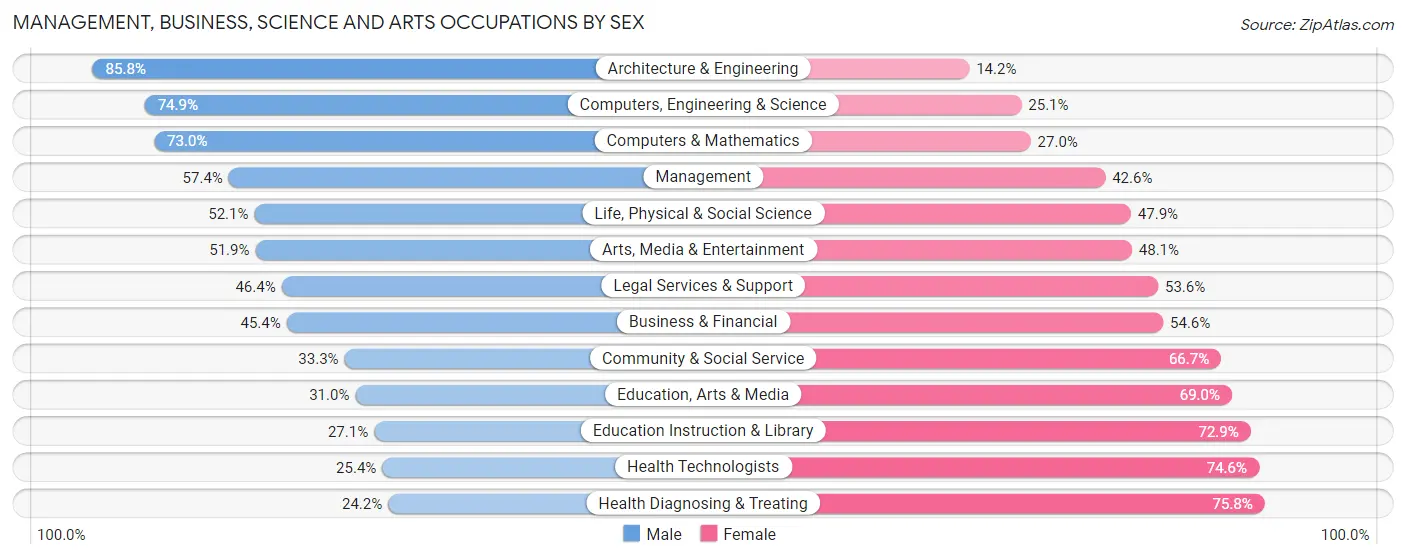
Management, Business, Science and Arts Occupations by Sex
Within the Management, Business, Science and Arts occupations in New Hampshire, the most male-oriented occupations are Architecture & Engineering (85.8%), Computers, Engineering & Science (74.9%), and Computers & Mathematics (73.0%), while the most female-oriented occupations are Health Diagnosing & Treating (75.8%), Health Technologists (74.6%), and Education Instruction & Library (72.9%).
| Occupation | Male | Female |
| Management | 50,881 (57.4%) | 37,708 (42.6%) |
| Business & Financial | 19,351 (45.4%) | 23,311 (54.6%) |
| Computers, Engineering & Science | 46,105 (74.9%) | 15,426 (25.1%) |
| Computers & Mathematics | 21,941 (73.0%) | 8,118 (27.0%) |
| Architecture & Engineering | 19,779 (85.8%) | 3,274 (14.2%) |
| Life, Physical & Social Science | 4,385 (52.1%) | 4,034 (47.9%) |
| Community & Social Service | 26,543 (33.3%) | 53,200 (66.7%) |
| Education, Arts & Media | 3,819 (31.0%) | 8,487 (69.0%) |
| Legal Services & Support | 2,865 (46.4%) | 3,308 (53.6%) |
| Education Instruction & Library | 13,064 (27.1%) | 35,103 (72.9%) |
| Arts, Media & Entertainment | 6,795 (51.9%) | 6,302 (48.1%) |
| Health Diagnosing & Treating | 12,059 (24.2%) | 37,814 (75.8%) |
| Health Technologists | 9,197 (25.4%) | 27,000 (74.6%) |
| Total (Category) | 154,939 (48.1%) | 167,459 (51.9%) |
| Total (Overall) | 390,961 (52.8%) | 350,027 (47.2%) |
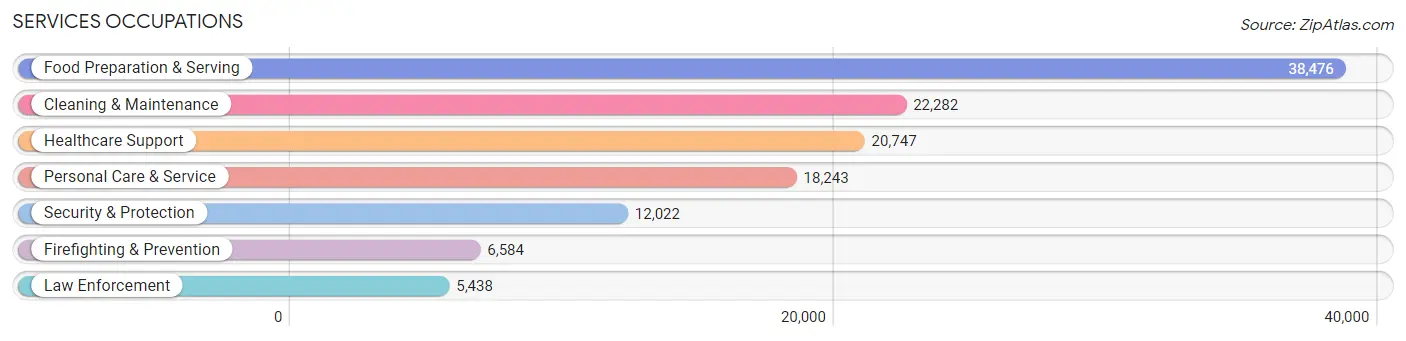
Services Occupations
The most common Services occupations in New Hampshire are Food Preparation & Serving (38,476 | 5.2%), Cleaning & Maintenance (22,282 | 3.0%), Healthcare Support (20,747 | 2.8%), Personal Care & Service (18,243 | 2.5%), and Security & Protection (12,022 | 1.6%).
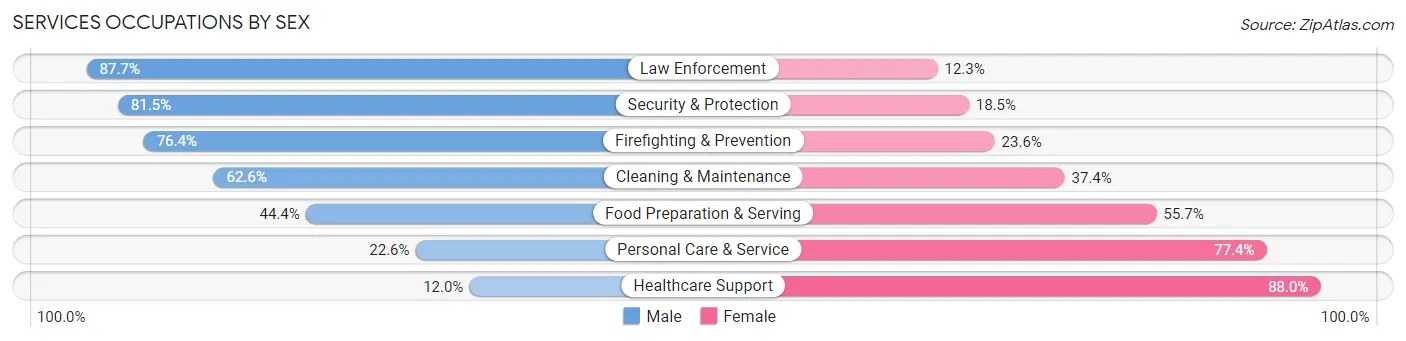
Services Occupations by Sex
Within the Services occupations in New Hampshire, the most male-oriented occupations are Law Enforcement (87.7%), Security & Protection (81.5%), and Firefighting & Prevention (76.4%), while the most female-oriented occupations are Healthcare Support (88.0%), Personal Care & Service (77.4%), and Food Preparation & Serving (55.6%).
| Occupation | Male | Female |
| Healthcare Support | 2,481 (12.0%) | 18,266 (88.0%) |
| Security & Protection | 9,801 (81.5%) | 2,221 (18.5%) |
| Firefighting & Prevention | 5,031 (76.4%) | 1,553 (23.6%) |
| Law Enforcement | 4,770 (87.7%) | 668 (12.3%) |
| Food Preparation & Serving | 17,063 (44.4%) | 21,413 (55.6%) |
| Cleaning & Maintenance | 13,941 (62.6%) | 8,341 (37.4%) |
| Personal Care & Service | 4,127 (22.6%) | 14,116 (77.4%) |
| Total (Category) | 47,413 (42.4%) | 64,357 (57.6%) |
| Total (Overall) | 390,961 (52.8%) | 350,027 (47.2%) |
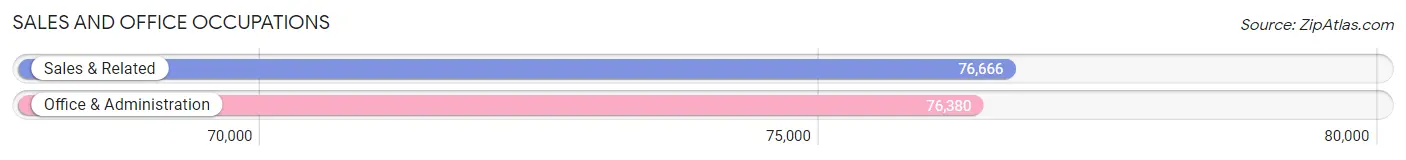
Sales and Office Occupations
The most common Sales and Office occupations in New Hampshire are Sales & Related (76,666 | 10.3%), and Office & Administration (76,380 | 10.3%).
Sales and Office Occupations by Sex
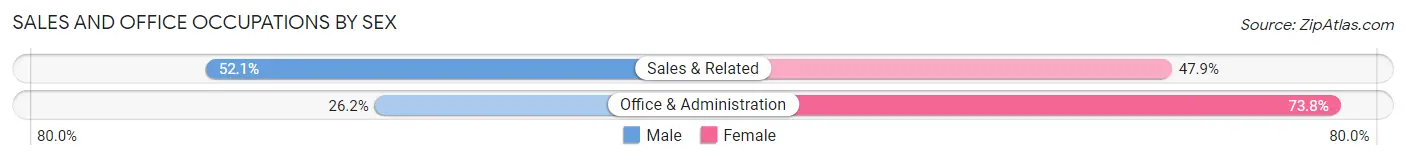
| Occupation | Male | Female |
| Sales & Related | 39,960 (52.1%) | 36,706 (47.9%) |
| Office & Administration | 19,982 (26.2%) | 56,398 (73.8%) |
| Total (Category) | 59,942 (39.2%) | 93,104 (60.8%) |
| Total (Overall) | 390,961 (52.8%) | 350,027 (47.2%) |
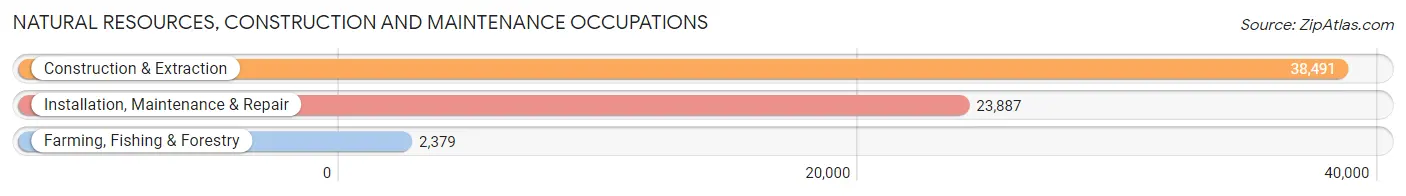
Natural Resources, Construction and Maintenance Occupations
The most common Natural Resources, Construction and Maintenance occupations in New Hampshire are Construction & Extraction (38,491 | 5.2%), Installation, Maintenance & Repair (23,887 | 3.2%), and Farming, Fishing & Forestry (2,379 | 0.3%).
Natural Resources, Construction and Maintenance Occupations by Sex
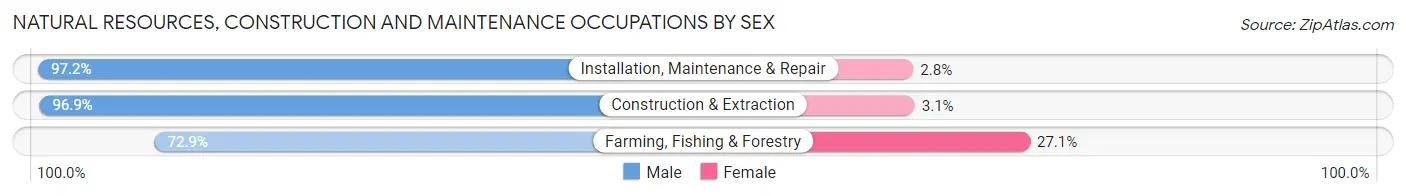
| Occupation | Male | Female |
| Farming, Fishing & Forestry | 1,735 (72.9%) | 644 (27.1%) |
| Construction & Extraction | 37,299 (96.9%) | 1,192 (3.1%) |
| Installation, Maintenance & Repair | 23,217 (97.2%) | 670 (2.8%) |
| Total (Category) | 62,251 (96.1%) | 2,506 (3.9%) |
| Total (Overall) | 390,961 (52.8%) | 350,027 (47.2%) |
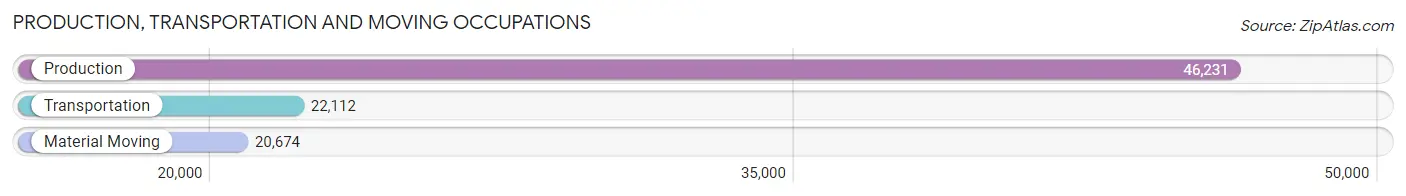
Production, Transportation and Moving Occupations
The most common Production, Transportation and Moving occupations in New Hampshire are Production (46,231 | 6.2%), Transportation (22,112 | 3.0%), and Material Moving (20,674 | 2.8%).
Production, Transportation and Moving Occupations by Sex
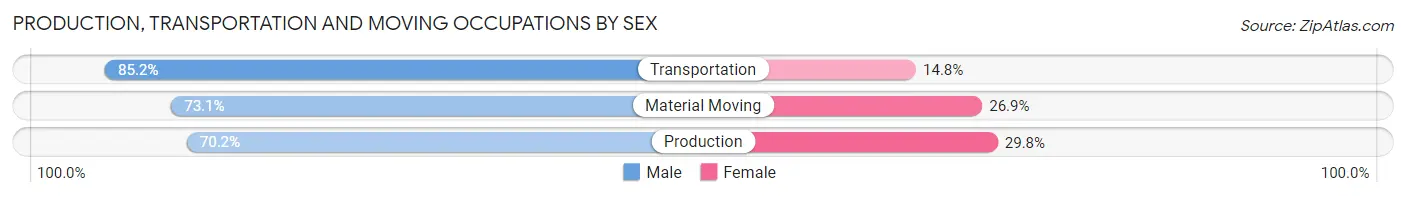
| Occupation | Male | Female |
| Production | 32,465 (70.2%) | 13,766 (29.8%) |
| Transportation | 18,844 (85.2%) | 3,268 (14.8%) |
| Material Moving | 15,107 (73.1%) | 5,567 (26.9%) |
| Total (Category) | 66,416 (74.6%) | 22,601 (25.4%) |
| Total (Overall) | 390,961 (52.8%) | 350,027 (47.2%) |
Employment Industries by Sex in New Hampshire
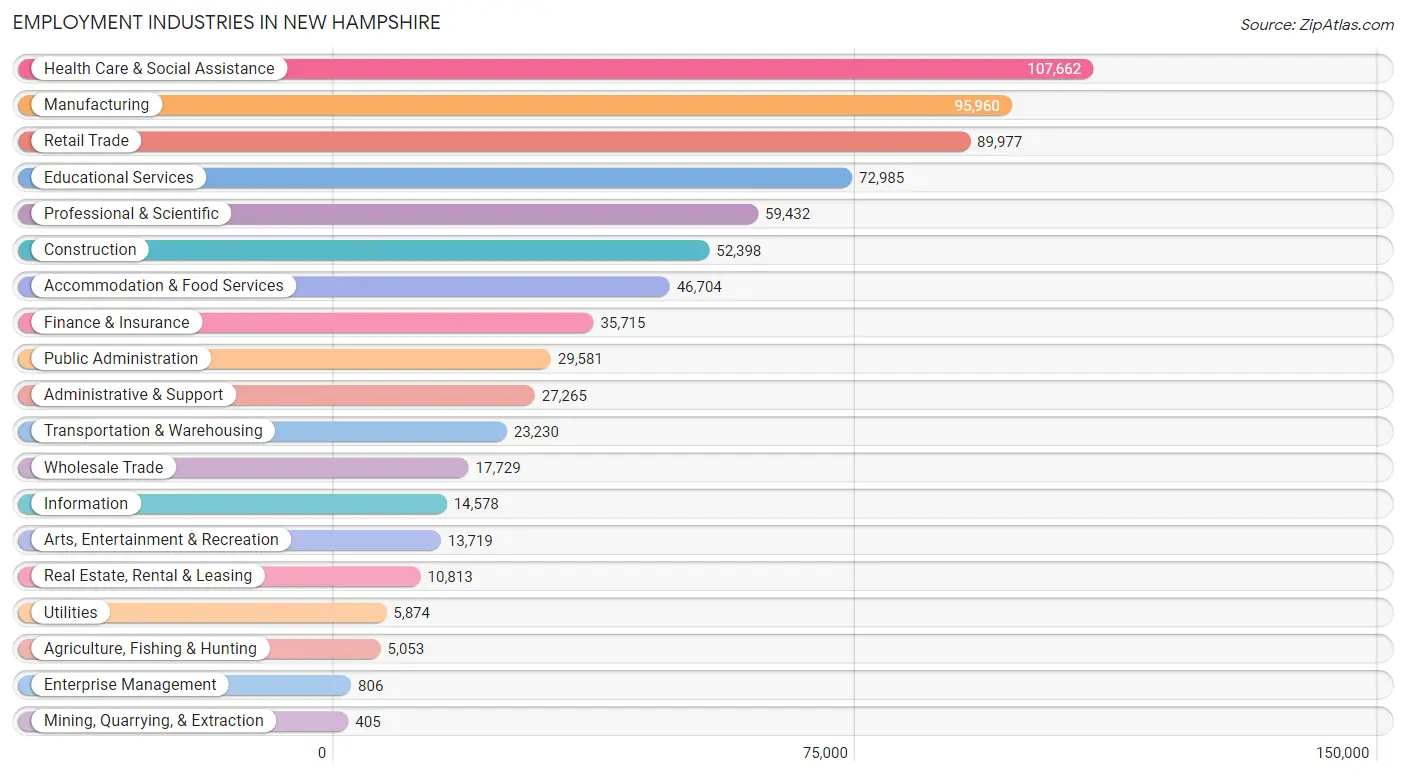
Employment Industries in New Hampshire
The major employment industries in New Hampshire include Health Care & Social Assistance (107,662 | 14.5%), Manufacturing (95,960 | 13.0%), Retail Trade (89,977 | 12.1%), Educational Services (72,985 | 9.9%), and Professional & Scientific (59,432 | 8.0%).
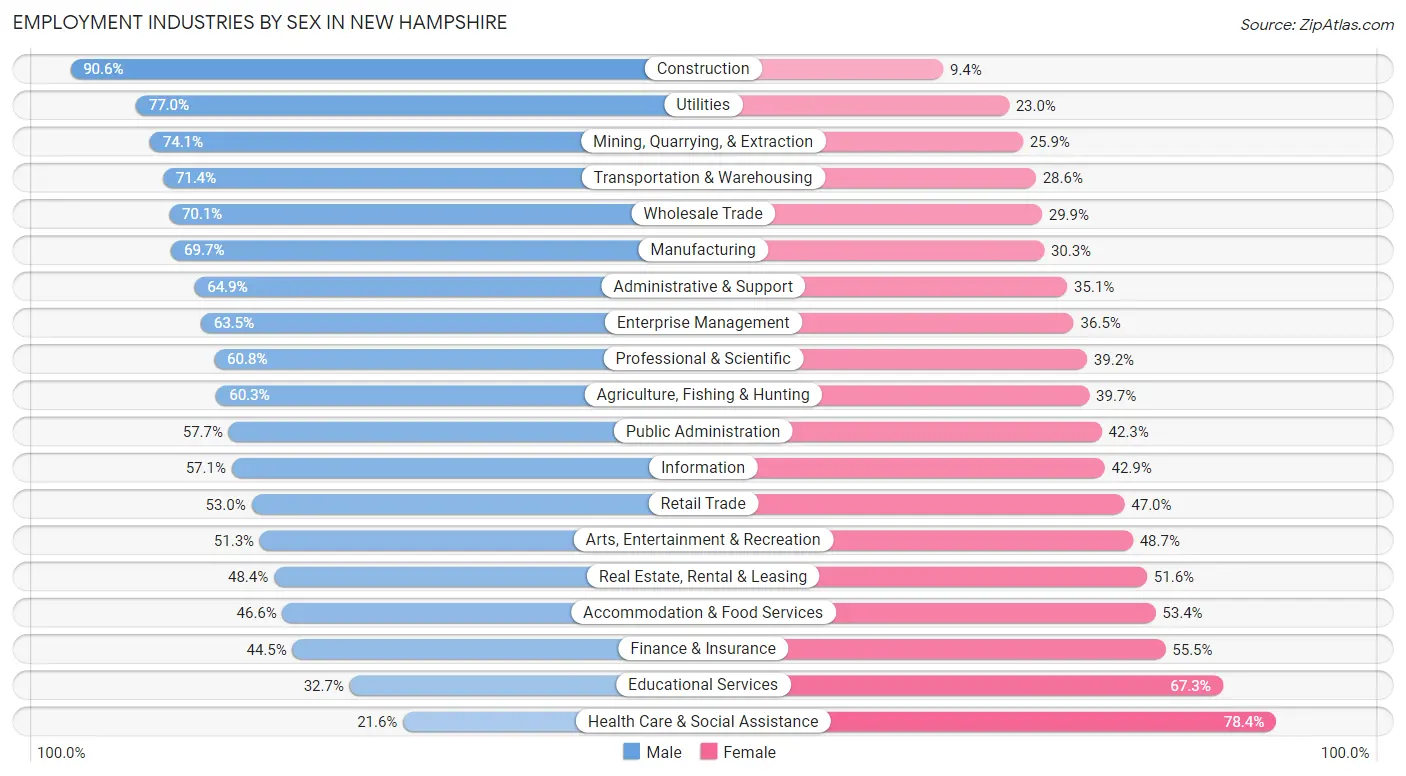
Employment Industries by Sex in New Hampshire
The New Hampshire industries that see more men than women are Construction (90.6%), Utilities (77.0%), and Mining, Quarrying, & Extraction (74.1%), whereas the industries that tend to have a higher number of women are Health Care & Social Assistance (78.4%), Educational Services (67.3%), and Finance & Insurance (55.5%).
| Industry | Male | Female |
| Agriculture, Fishing & Hunting | 3,048 (60.3%) | 2,005 (39.7%) |
| Mining, Quarrying, & Extraction | 300 (74.1%) | 105 (25.9%) |
| Construction | 47,452 (90.6%) | 4,946 (9.4%) |
| Manufacturing | 66,856 (69.7%) | 29,104 (30.3%) |
| Wholesale Trade | 12,432 (70.1%) | 5,297 (29.9%) |
| Retail Trade | 47,718 (53.0%) | 42,259 (47.0%) |
| Transportation & Warehousing | 16,580 (71.4%) | 6,650 (28.6%) |
| Utilities | 4,521 (77.0%) | 1,353 (23.0%) |
| Information | 8,329 (57.1%) | 6,249 (42.9%) |
| Finance & Insurance | 15,906 (44.5%) | 19,809 (55.5%) |
| Real Estate, Rental & Leasing | 5,229 (48.4%) | 5,584 (51.6%) |
| Professional & Scientific | 36,122 (60.8%) | 23,310 (39.2%) |
| Enterprise Management | 512 (63.5%) | 294 (36.5%) |
| Administrative & Support | 17,688 (64.9%) | 9,577 (35.1%) |
| Educational Services | 23,867 (32.7%) | 49,118 (67.3%) |
| Health Care & Social Assistance | 23,297 (21.6%) | 84,365 (78.4%) |
| Arts, Entertainment & Recreation | 7,036 (51.3%) | 6,683 (48.7%) |
| Accommodation & Food Services | 21,763 (46.6%) | 24,941 (53.4%) |
| Public Administration | 17,077 (57.7%) | 12,504 (42.3%) |
| Total | 390,961 (52.8%) | 350,027 (47.2%) |
Education in New Hampshire
School Enrollment in New Hampshire
The most common levels of schooling among the 294,770 students in New Hampshire are college / undergraduate (66,391 | 22.5%), high school (64,906 | 22.0%), and middle school (59,504 | 20.2%).
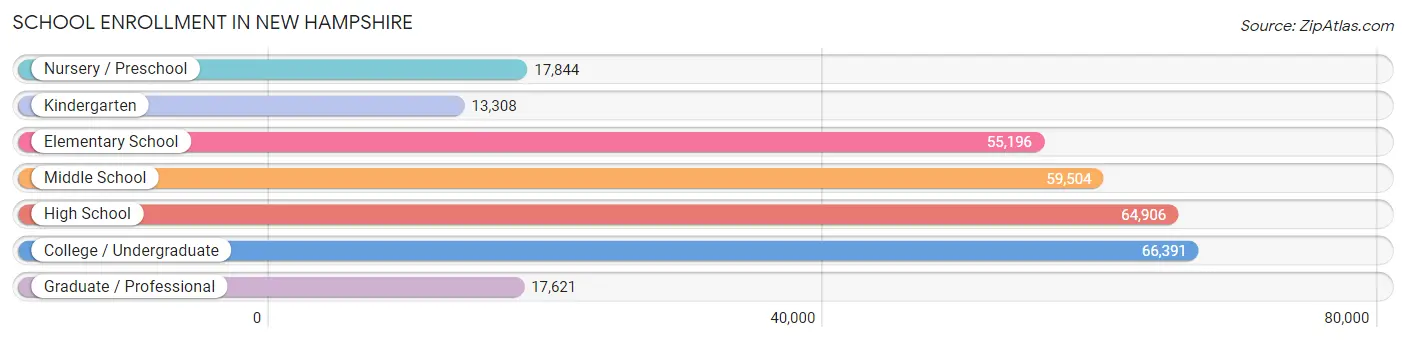
| School Level | # Students | % Students |
| Nursery / Preschool | 17,844 | 6.0% |
| Kindergarten | 13,308 | 4.5% |
| Elementary School | 55,196 | 18.7% |
| Middle School | 59,504 | 20.2% |
| High School | 64,906 | 22.0% |
| College / Undergraduate | 66,391 | 22.5% |
| Graduate / Professional | 17,621 | 6.0% |
| Total | 294,770 | 100.0% |
School Enrollment by Age by Funding Source in New Hampshire
Out of a total of 294,770 students who are enrolled in schools in New Hampshire, 64,260 (21.8%) attend a private institution, while the remaining 230,510 (78.2%) are enrolled in public schools. The age group of 3 to 4 year olds has the highest likelihood of being enrolled in private schools, with 8,348 (58.6% in the age bracket) enrolled. Conversely, the age group of 10 to 14 year olds has the lowest likelihood of being enrolled in a private school, with 66,591 (89.6% in the age bracket) attending a public institution.
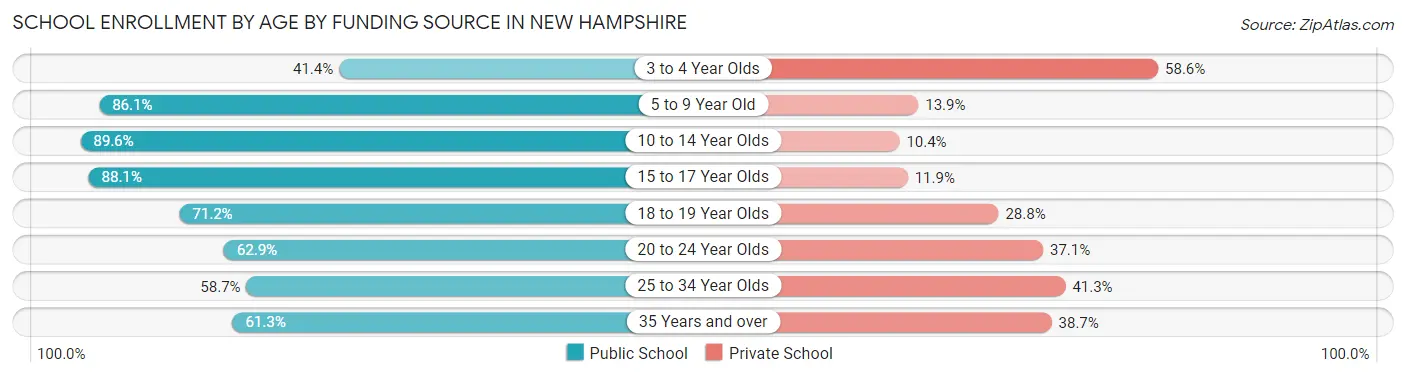
| Age Bracket | Public School | Private School |
| 3 to 4 Year Olds | 5,906 (41.4%) | 8,348 (58.6%) |
| 5 to 9 Year Old | 55,362 (86.1%) | 8,941 (13.9%) |
| 10 to 14 Year Olds | 66,591 (89.6%) | 7,724 (10.4%) |
| 15 to 17 Year Olds | 41,947 (88.1%) | 5,680 (11.9%) |
| 18 to 19 Year Olds | 20,345 (71.2%) | 8,244 (28.8%) |
| 20 to 24 Year Olds | 21,500 (62.9%) | 12,697 (37.1%) |
| 25 to 34 Year Olds | 9,141 (58.7%) | 6,433 (41.3%) |
| 35 Years and over | 9,749 (61.3%) | 6,162 (38.7%) |
| Total | 230,510 (78.2%) | 64,260 (21.8%) |
Educational Attainment by Field of Study in New Hampshire
Business (76,993 | 18.2%), education (43,931 | 10.4%), science & technology (40,114 | 9.5%), engineering (36,243 | 8.6%), and social sciences (33,002 | 7.8%) are the most common fields of study among 422,634 individuals in New Hampshire who have obtained a bachelor's degree or higher.
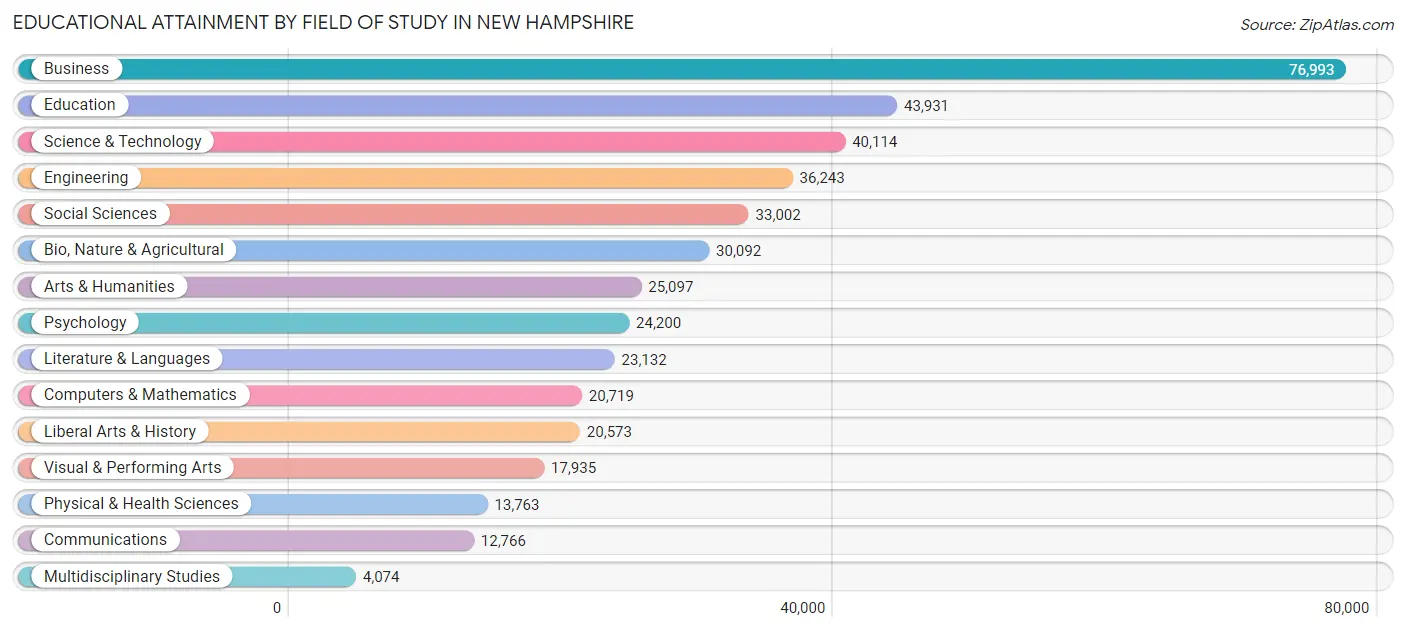
| Field of Study | # Graduates | % Graduates |
| Computers & Mathematics | 20,719 | 4.9% |
| Bio, Nature & Agricultural | 30,092 | 7.1% |
| Physical & Health Sciences | 13,763 | 3.3% |
| Psychology | 24,200 | 5.7% |
| Social Sciences | 33,002 | 7.8% |
| Engineering | 36,243 | 8.6% |
| Multidisciplinary Studies | 4,074 | 1.0% |
| Science & Technology | 40,114 | 9.5% |
| Business | 76,993 | 18.2% |
| Education | 43,931 | 10.4% |
| Literature & Languages | 23,132 | 5.5% |
| Liberal Arts & History | 20,573 | 4.9% |
| Visual & Performing Arts | 17,935 | 4.2% |
| Communications | 12,766 | 3.0% |
| Arts & Humanities | 25,097 | 5.9% |
| Total | 422,634 | 100.0% |
Transportation & Commute in New Hampshire
Vehicle Availability by Sex in New Hampshire
The most prevalent vehicle ownership categories in New Hampshire are males with 2 vehicles (171,984, accounting for 44.9%) and females with 2 vehicles (145,572, making up 51.1%).
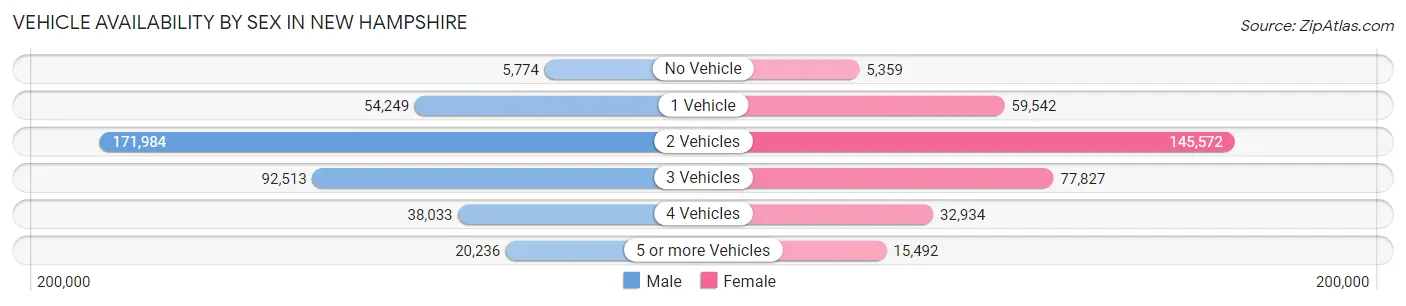
| Vehicles Available | Male | Female |
| No Vehicle | 5,774 (1.5%) | 5,359 (1.6%) |
| 1 Vehicle | 54,249 (14.2%) | 59,542 (17.7%) |
| 2 Vehicles | 171,984 (44.9%) | 145,572 (43.2%) |
| 3 Vehicles | 92,513 (24.2%) | 77,827 (23.1%) |
| 4 Vehicles | 38,033 (9.9%) | 32,934 (9.8%) |
| 5 or more Vehicles | 20,236 (5.3%) | 15,492 (4.6%) |
| Total | 382,789 (100.0%) | 336,726 (100.0%) |
Commute Time in New Hampshire
The most frequently occuring commute durations in New Hampshire are 10 to 14 minutes (87,146 commuters, 13.8%), 15 to 19 minutes (86,763 commuters, 13.8%), and 20 to 24 minutes (83,891 commuters, 13.3%).
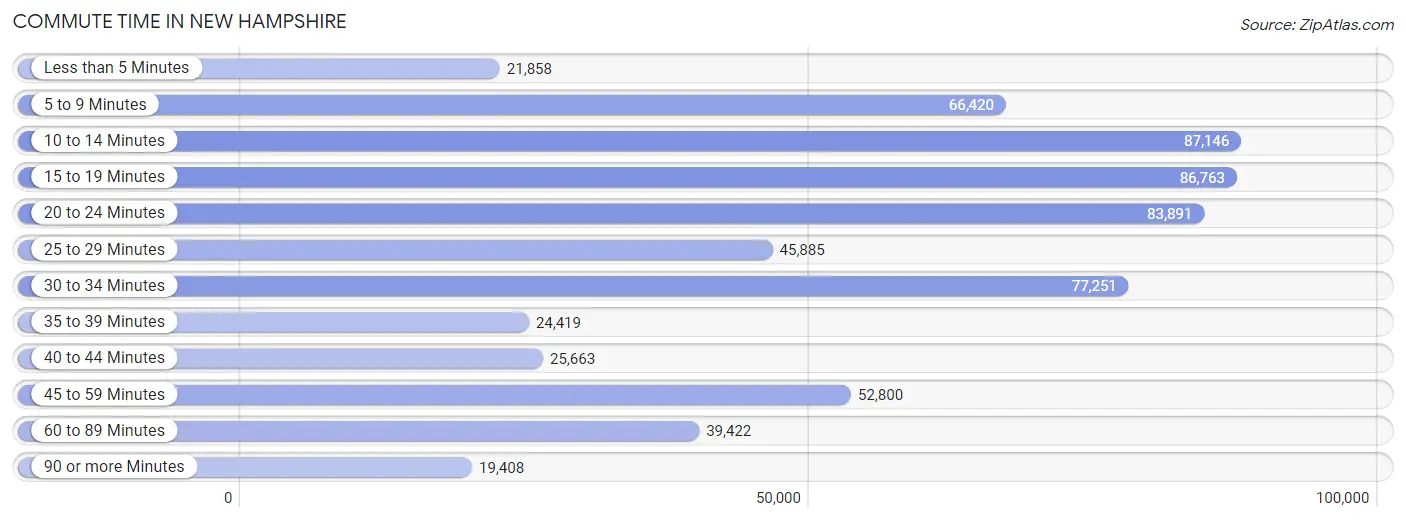
| Commute Time | # Commuters | % Commuters |
| Less than 5 Minutes | 21,858 | 3.5% |
| 5 to 9 Minutes | 66,420 | 10.5% |
| 10 to 14 Minutes | 87,146 | 13.8% |
| 15 to 19 Minutes | 86,763 | 13.8% |
| 20 to 24 Minutes | 83,891 | 13.3% |
| 25 to 29 Minutes | 45,885 | 7.3% |
| 30 to 34 Minutes | 77,251 | 12.2% |
| 35 to 39 Minutes | 24,419 | 3.9% |
| 40 to 44 Minutes | 25,663 | 4.1% |
| 45 to 59 Minutes | 52,800 | 8.4% |
| 60 to 89 Minutes | 39,422 | 6.2% |
| 90 or more Minutes | 19,408 | 3.1% |
Commute Time by Sex in New Hampshire
The most common commute times in New Hampshire are 20 to 24 minutes (43,071 commuters, 12.9%) for males and 15 to 19 minutes (44,482 commuters, 15.0%) for females.
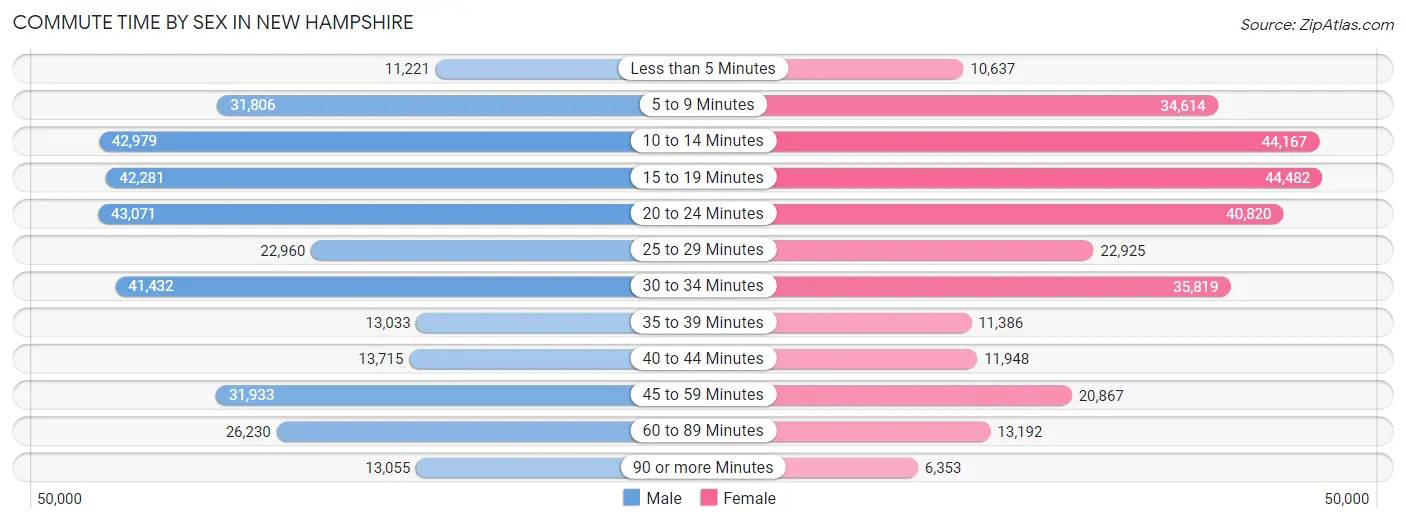
| Commute Time | Male | Female |
| Less than 5 Minutes | 11,221 (3.4%) | 10,637 (3.6%) |
| 5 to 9 Minutes | 31,806 (9.5%) | 34,614 (11.7%) |
| 10 to 14 Minutes | 42,979 (12.9%) | 44,167 (14.9%) |
| 15 to 19 Minutes | 42,281 (12.7%) | 44,482 (15.0%) |
| 20 to 24 Minutes | 43,071 (12.9%) | 40,820 (13.7%) |
| 25 to 29 Minutes | 22,960 (6.9%) | 22,925 (7.7%) |
| 30 to 34 Minutes | 41,432 (12.4%) | 35,819 (12.0%) |
| 35 to 39 Minutes | 13,033 (3.9%) | 11,386 (3.8%) |
| 40 to 44 Minutes | 13,715 (4.1%) | 11,948 (4.0%) |
| 45 to 59 Minutes | 31,933 (9.6%) | 20,867 (7.0%) |
| 60 to 89 Minutes | 26,230 (7.9%) | 13,192 (4.4%) |
| 90 or more Minutes | 13,055 (3.9%) | 6,353 (2.1%) |
Time of Departure to Work by Sex in New Hampshire
The most frequent times of departure to work in New Hampshire are 7:00 AM to 7:29 AM (46,420, 13.9%) for males and 7:00 AM to 7:29 AM (46,080, 15.5%) for females.
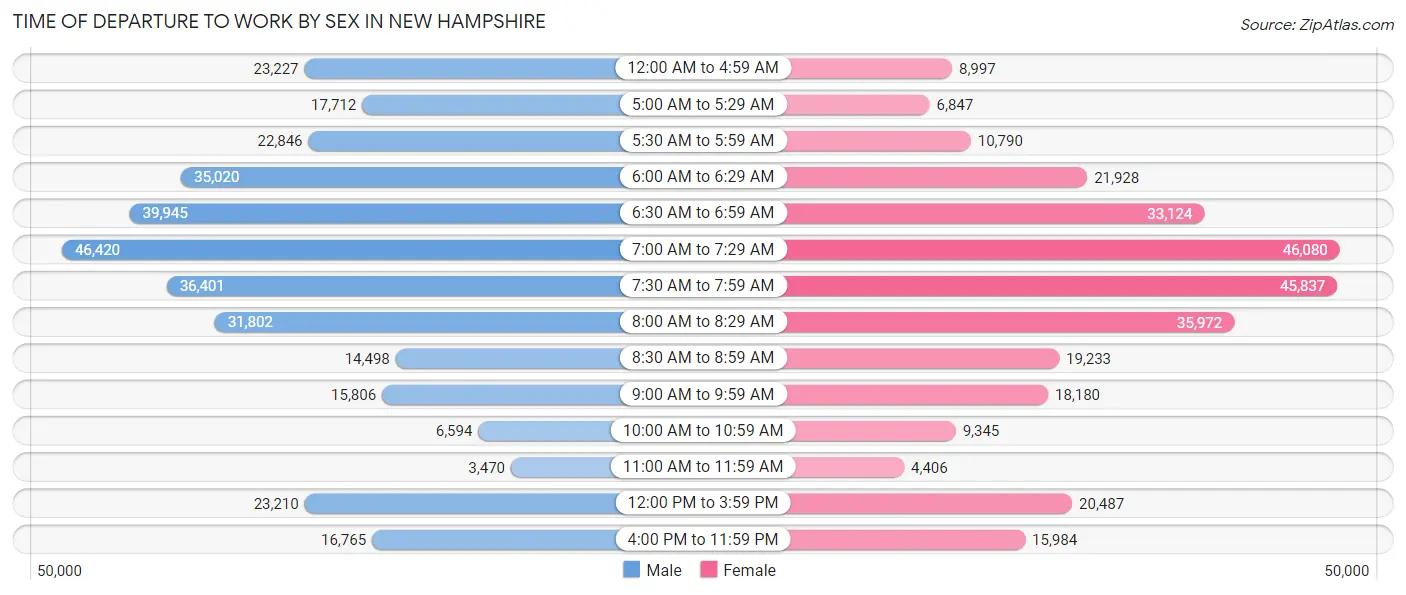
| Time of Departure | Male | Female |
| 12:00 AM to 4:59 AM | 23,227 (7.0%) | 8,997 (3.0%) |
| 5:00 AM to 5:29 AM | 17,712 (5.3%) | 6,847 (2.3%) |
| 5:30 AM to 5:59 AM | 22,846 (6.9%) | 10,790 (3.6%) |
| 6:00 AM to 6:29 AM | 35,020 (10.5%) | 21,928 (7.4%) |
| 6:30 AM to 6:59 AM | 39,945 (12.0%) | 33,124 (11.1%) |
| 7:00 AM to 7:29 AM | 46,420 (13.9%) | 46,080 (15.5%) |
| 7:30 AM to 7:59 AM | 36,401 (10.9%) | 45,837 (15.4%) |
| 8:00 AM to 8:29 AM | 31,802 (9.5%) | 35,972 (12.1%) |
| 8:30 AM to 8:59 AM | 14,498 (4.3%) | 19,233 (6.5%) |
| 9:00 AM to 9:59 AM | 15,806 (4.7%) | 18,180 (6.1%) |
| 10:00 AM to 10:59 AM | 6,594 (2.0%) | 9,345 (3.1%) |
| 11:00 AM to 11:59 AM | 3,470 (1.0%) | 4,406 (1.5%) |
| 12:00 PM to 3:59 PM | 23,210 (7.0%) | 20,487 (6.9%) |
| 4:00 PM to 11:59 PM | 16,765 (5.0%) | 15,984 (5.4%) |
| Total | 333,716 (100.0%) | 297,210 (100.0%) |
Housing Occupancy in New Hampshire
Occupancy by Ownership in New Hampshire
Of the total 545,116 dwellings in New Hampshire, owner-occupied units account for 393,945 (72.3%), while renter-occupied units make up 151,171 (27.7%).
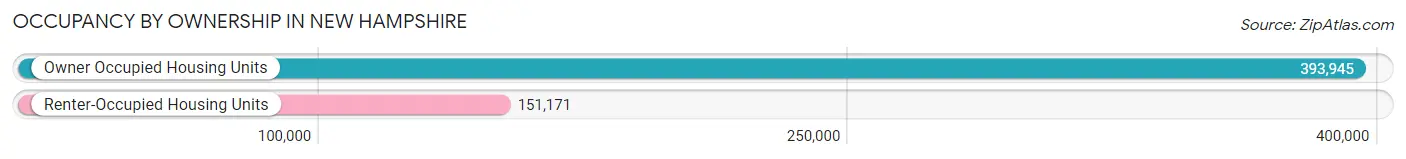
| Occupancy | # Housing Units | % Housing Units |
| Owner Occupied Housing Units | 393,945 | 72.3% |
| Renter-Occupied Housing Units | 151,171 | 27.7% |
| Total Occupied Housing Units | 545,116 | 100.0% |
Occupancy by Household Size in New Hampshire
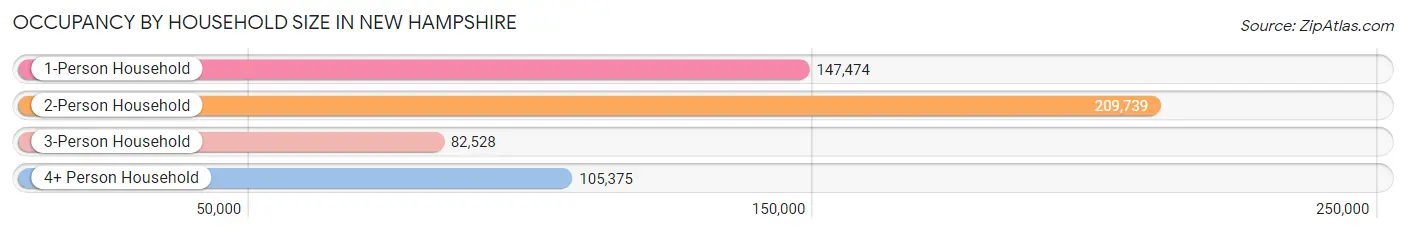
| Household Size | # Housing Units | % Housing Units |
| 1-Person Household | 147,474 | 27.1% |
| 2-Person Household | 209,739 | 38.5% |
| 3-Person Household | 82,528 | 15.1% |
| 4+ Person Household | 105,375 | 19.3% |
| Total Housing Units | 545,116 | 100.0% |
Occupancy by Ownership by Household Size in New Hampshire
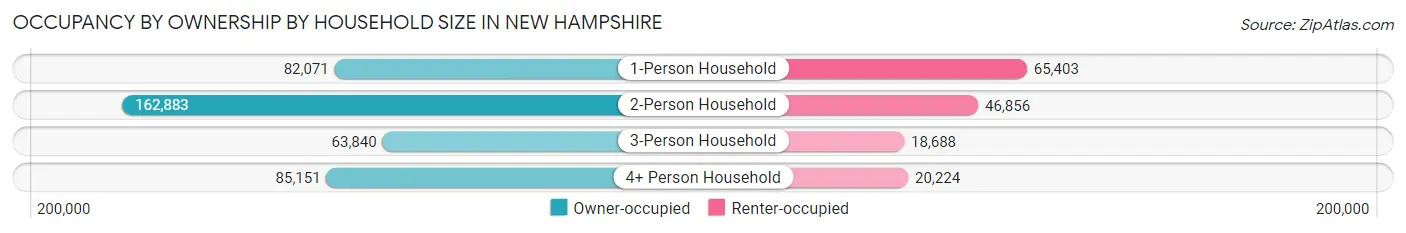
| Household Size | Owner-occupied | Renter-occupied |
| 1-Person Household | 82,071 (55.6%) | 65,403 (44.4%) |
| 2-Person Household | 162,883 (77.7%) | 46,856 (22.3%) |
| 3-Person Household | 63,840 (77.4%) | 18,688 (22.6%) |
| 4+ Person Household | 85,151 (80.8%) | 20,224 (19.2%) |
| Total Housing Units | 393,945 (72.3%) | 151,171 (27.7%) |
Occupancy by Educational Attainment in New Hampshire
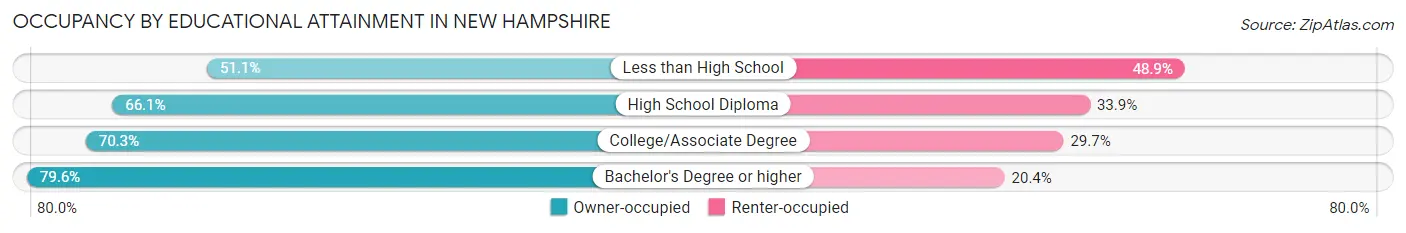
| Household Size | Owner-occupied | Renter-occupied |
| Less than High School | 13,779 (51.1%) | 13,208 (48.9%) |
| High School Diploma | 85,071 (66.1%) | 43,641 (33.9%) |
| College/Associate Degree | 112,994 (70.3%) | 47,749 (29.7%) |
| Bachelor's Degree or higher | 182,101 (79.6%) | 46,573 (20.4%) |
Occupancy by Age of Householder in New Hampshire
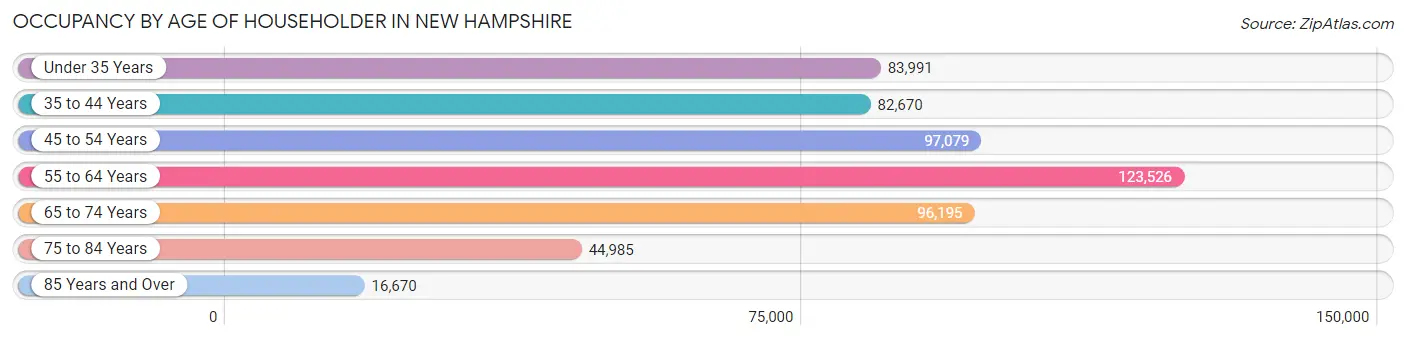
| Age Bracket | # Households | % Households |
| Under 35 Years | 83,991 | 15.4% |
| 35 to 44 Years | 82,670 | 15.2% |
| 45 to 54 Years | 97,079 | 17.8% |
| 55 to 64 Years | 123,526 | 22.7% |
| 65 to 74 Years | 96,195 | 17.6% |
| 75 to 84 Years | 44,985 | 8.3% |
| 85 Years and Over | 16,670 | 3.1% |
| Total | 545,116 | 100.0% |
Housing Finances in New Hampshire
Median Income by Occupancy in New Hampshire
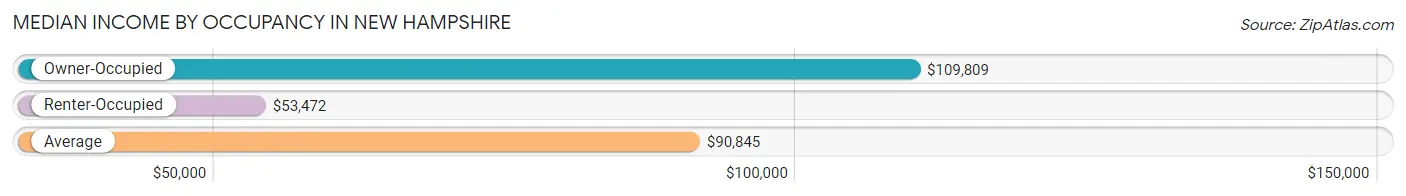
| Occupancy Type | # Households | Median Income |
| Owner-Occupied | 393,945 (72.3%) | $109,809 |
| Renter-Occupied | 151,171 (27.7%) | $53,472 |
| Average | 545,116 (100.0%) | $90,845 |
Occupancy by Householder Income Bracket in New Hampshire
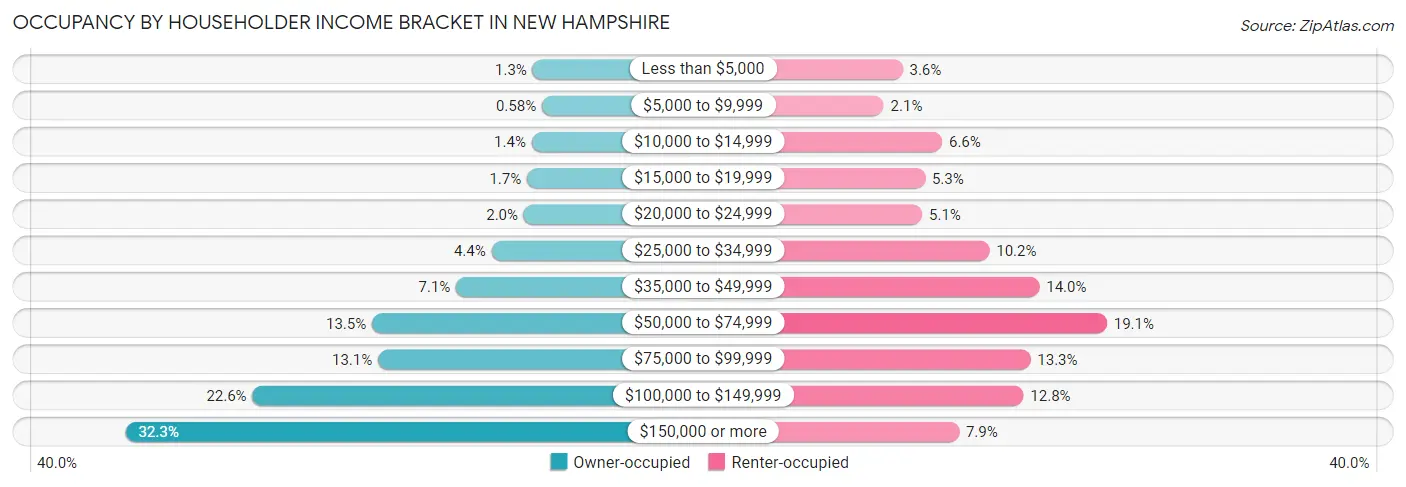
| Income Bracket | Owner-occupied | Renter-occupied |
| Less than $5,000 | 5,099 (1.3%) | 5,408 (3.6%) |
| $5,000 to $9,999 | 2,278 (0.6%) | 3,240 (2.1%) |
| $10,000 to $14,999 | 5,367 (1.4%) | 9,967 (6.6%) |
| $15,000 to $19,999 | 6,759 (1.7%) | 8,002 (5.3%) |
| $20,000 to $24,999 | 7,716 (2.0%) | 7,669 (5.1%) |
| $25,000 to $34,999 | 17,405 (4.4%) | 15,409 (10.2%) |
| $35,000 to $49,999 | 28,037 (7.1%) | 21,166 (14.0%) |
| $50,000 to $74,999 | 53,293 (13.5%) | 28,934 (19.1%) |
| $75,000 to $99,999 | 51,503 (13.1%) | 20,139 (13.3%) |
| $100,000 to $149,999 | 89,201 (22.6%) | 19,330 (12.8%) |
| $150,000 or more | 127,287 (32.3%) | 11,907 (7.9%) |
| Total | 393,945 (100.0%) | 151,171 (100.0%) |
Monthly Housing Cost Tiers in New Hampshire
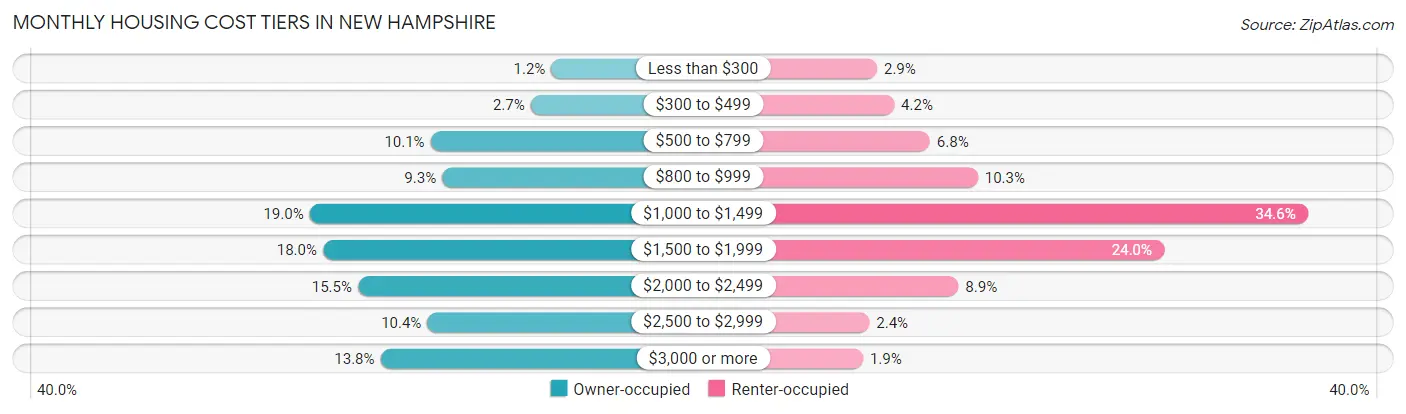
| Monthly Cost | Owner-occupied | Renter-occupied |
| Less than $300 | 4,789 (1.2%) | 4,421 (2.9%) |
| $300 to $499 | 10,813 (2.7%) | 6,316 (4.2%) |
| $500 to $799 | 39,830 (10.1%) | 10,288 (6.8%) |
| $800 to $999 | 36,494 (9.3%) | 15,626 (10.3%) |
| $1,000 to $1,499 | 74,915 (19.0%) | 52,333 (34.6%) |
| $1,500 to $1,999 | 71,085 (18.0%) | 36,344 (24.0%) |
| $2,000 to $2,499 | 60,904 (15.5%) | 13,465 (8.9%) |
| $2,500 to $2,999 | 40,760 (10.3%) | 3,553 (2.4%) |
| $3,000 or more | 54,355 (13.8%) | 2,836 (1.9%) |
| Total | 393,945 (100.0%) | 151,171 (100.0%) |
Physical Housing Characteristics in New Hampshire
Housing Structures in New Hampshire
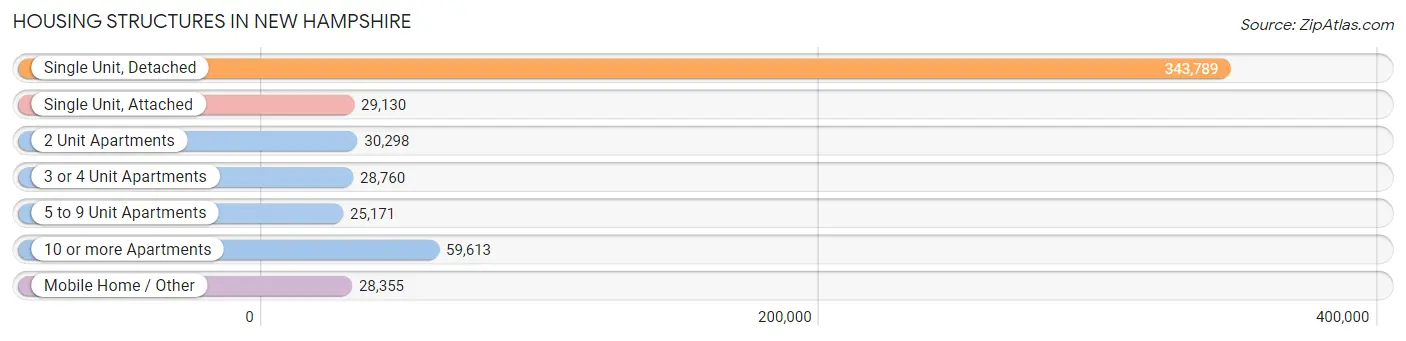
| Structure Type | # Housing Units | % Housing Units |
| Single Unit, Detached | 343,789 | 63.1% |
| Single Unit, Attached | 29,130 | 5.3% |
| 2 Unit Apartments | 30,298 | 5.6% |
| 3 or 4 Unit Apartments | 28,760 | 5.3% |
| 5 to 9 Unit Apartments | 25,171 | 4.6% |
| 10 or more Apartments | 59,613 | 10.9% |
| Mobile Home / Other | 28,355 | 5.2% |
| Total | 545,116 | 100.0% |
Housing Structures by Occupancy in New Hampshire
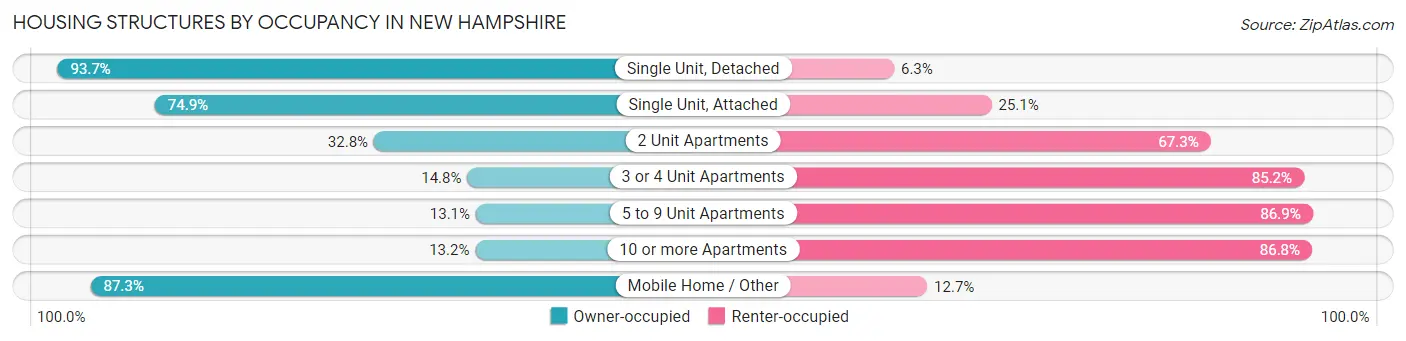
| Structure Type | Owner-occupied | Renter-occupied |
| Single Unit, Detached | 322,016 (93.7%) | 21,773 (6.3%) |
| Single Unit, Attached | 21,818 (74.9%) | 7,312 (25.1%) |
| 2 Unit Apartments | 9,923 (32.8%) | 20,375 (67.2%) |
| 3 or 4 Unit Apartments | 4,248 (14.8%) | 24,512 (85.2%) |
| 5 to 9 Unit Apartments | 3,301 (13.1%) | 21,870 (86.9%) |
| 10 or more Apartments | 7,889 (13.2%) | 51,724 (86.8%) |
| Mobile Home / Other | 24,750 (87.3%) | 3,605 (12.7%) |
| Total | 393,945 (72.3%) | 151,171 (27.7%) |
Housing Structures by Number of Rooms in New Hampshire
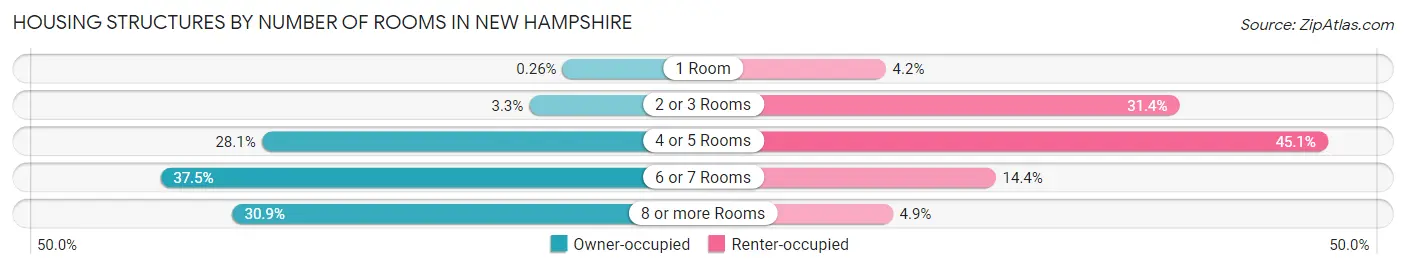
| Number of Rooms | Owner-occupied | Renter-occupied |
| 1 Room | 1,042 (0.3%) | 6,390 (4.2%) |
| 2 or 3 Rooms | 13,163 (3.3%) | 47,450 (31.4%) |
| 4 or 5 Rooms | 110,655 (28.1%) | 68,193 (45.1%) |
| 6 or 7 Rooms | 147,523 (37.4%) | 21,776 (14.4%) |
| 8 or more Rooms | 121,562 (30.9%) | 7,362 (4.9%) |
| Total | 393,945 (100.0%) | 151,171 (100.0%) |
Housing Structure by Heating Type in New Hampshire
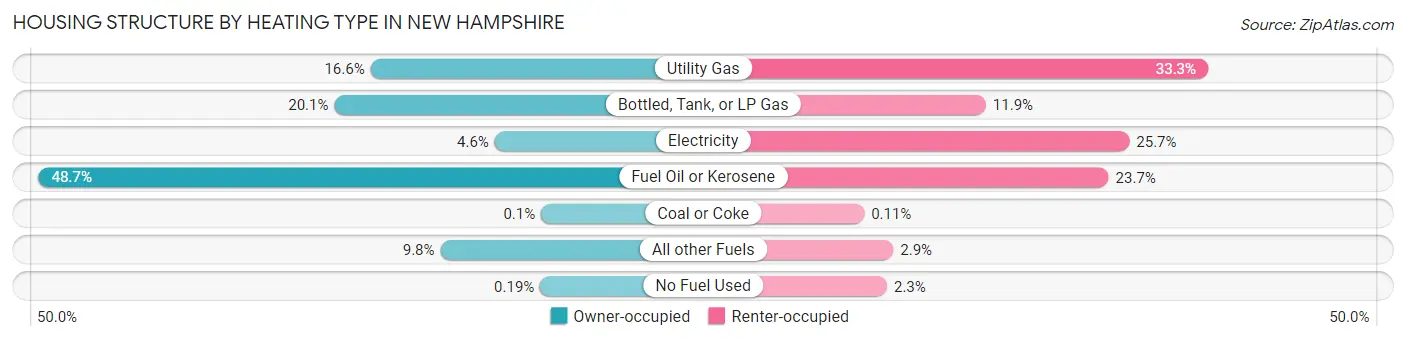
| Heating Type | Owner-occupied | Renter-occupied |
| Utility Gas | 65,327 (16.6%) | 50,350 (33.3%) |
| Bottled, Tank, or LP Gas | 79,094 (20.1%) | 17,948 (11.9%) |
| Electricity | 18,045 (4.6%) | 38,897 (25.7%) |
| Fuel Oil or Kerosene | 191,636 (48.6%) | 35,875 (23.7%) |
| Coal or Coke | 376 (0.1%) | 173 (0.1%) |
| All other Fuels | 38,714 (9.8%) | 4,425 (2.9%) |
| No Fuel Used | 753 (0.2%) | 3,503 (2.3%) |
| Total | 393,945 (100.0%) | 151,171 (100.0%) |
Household Vehicle Usage in New Hampshire
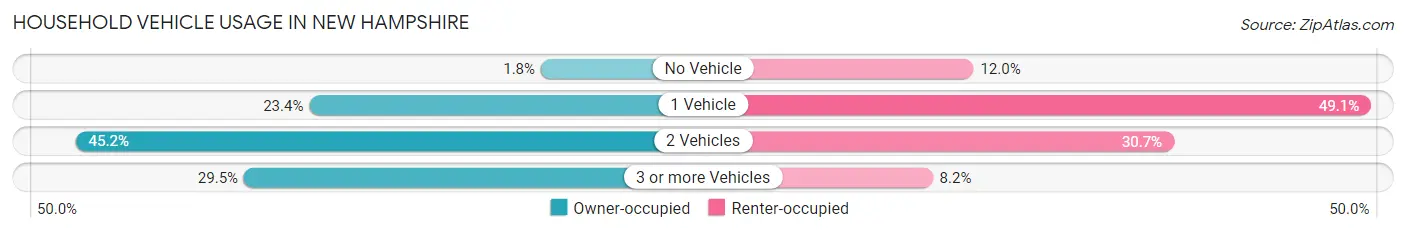
| Vehicles per Household | Owner-occupied | Renter-occupied |
| No Vehicle | 7,127 (1.8%) | 18,134 (12.0%) |
| 1 Vehicle | 92,291 (23.4%) | 74,235 (49.1%) |
| 2 Vehicles | 178,195 (45.2%) | 46,428 (30.7%) |
| 3 or more Vehicles | 116,332 (29.5%) | 12,374 (8.2%) |
| Total | 393,945 (100.0%) | 151,171 (100.0%) |
Real Estate & Mortgages in New Hampshire
Real Estate and Mortgage Overview in New Hampshire
| Characteristic | Without Mortgage | With Mortgage |
| Housing Units | 143,569 | 250,376 |
| Median Property Value | $307,500 | $350,900 |
| Median Household Income | $77,334 | $96,935 |
| Monthly Housing Costs | $926 | $53,425 |
| Real Estate Taxes | $5,921 | $2,023 |
Property Value by Mortgage Status in New Hampshire
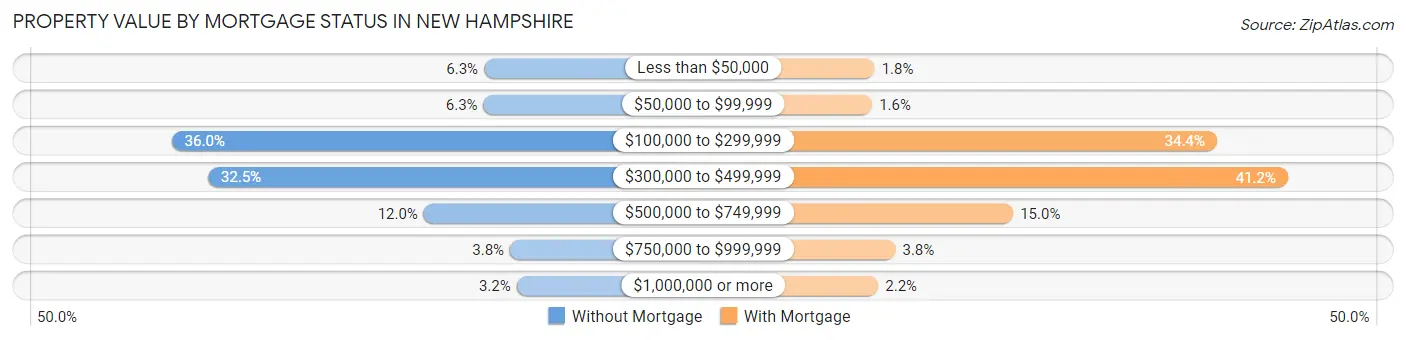
| Property Value | Without Mortgage | With Mortgage |
| Less than $50,000 | 8,972 (6.2%) | 4,588 (1.8%) |
| $50,000 to $99,999 | 9,042 (6.3%) | 3,987 (1.6%) |
| $100,000 to $299,999 | 51,674 (36.0%) | 86,144 (34.4%) |
| $300,000 to $499,999 | 46,712 (32.5%) | 103,064 (41.2%) |
| $500,000 to $749,999 | 17,218 (12.0%) | 37,615 (15.0%) |
| $750,000 to $999,999 | 5,434 (3.8%) | 9,549 (3.8%) |
| $1,000,000 or more | 4,517 (3.2%) | 5,429 (2.2%) |
| Total | 143,569 (100.0%) | 250,376 (100.0%) |
Household Income by Mortgage Status in New Hampshire
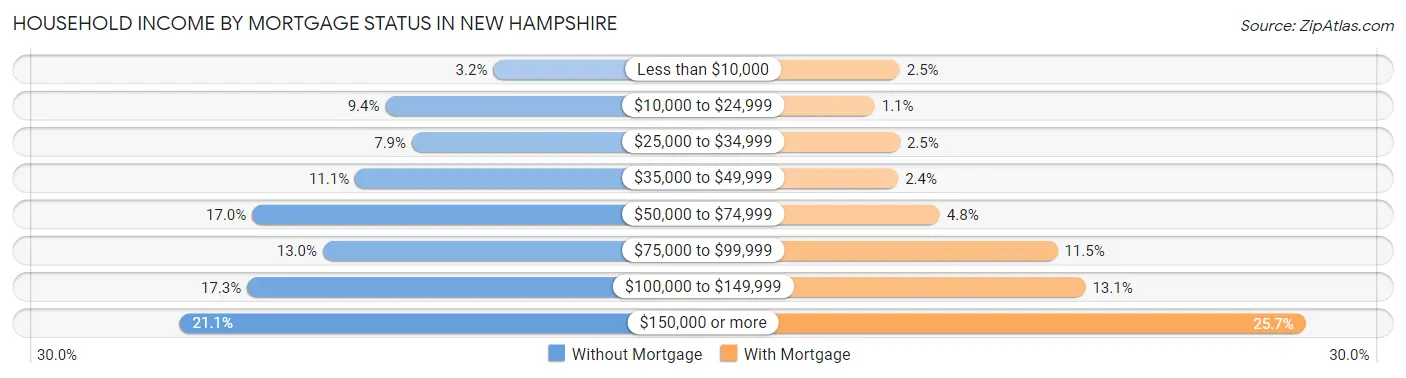
| Household Income | Without Mortgage | With Mortgage |
| Less than $10,000 | 4,628 (3.2%) | 6,342 (2.5%) |
| $10,000 to $24,999 | 13,485 (9.4%) | 2,749 (1.1%) |
| $25,000 to $34,999 | 11,304 (7.9%) | 6,357 (2.5%) |
| $35,000 to $49,999 | 15,963 (11.1%) | 6,101 (2.4%) |
| $50,000 to $74,999 | 24,400 (17.0%) | 12,074 (4.8%) |
| $75,000 to $99,999 | 18,612 (13.0%) | 28,893 (11.5%) |
| $100,000 to $149,999 | 24,825 (17.3%) | 32,891 (13.1%) |
| $150,000 or more | 30,352 (21.1%) | 64,376 (25.7%) |
| Total | 143,569 (100.0%) | 250,376 (100.0%) |
Property Value to Household Income Ratio in New Hampshire
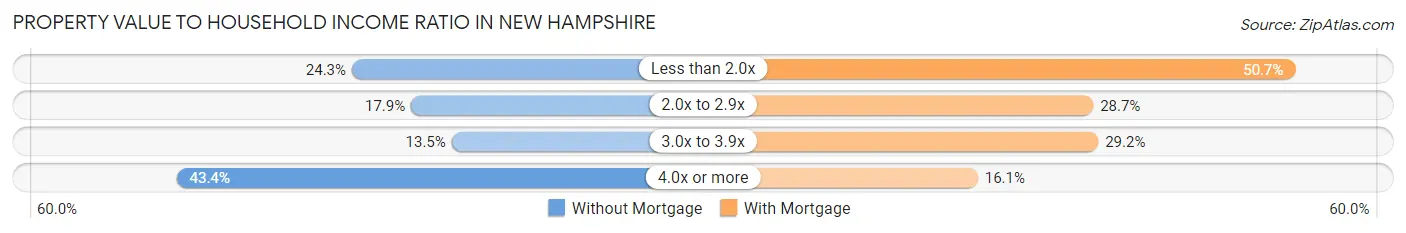
| Value-to-Income Ratio | Without Mortgage | With Mortgage |
| Less than 2.0x | 34,948 (24.3%) | 126,962 (50.7%) |
| 2.0x to 2.9x | 25,689 (17.9%) | 71,827 (28.7%) |
| 3.0x to 3.9x | 19,343 (13.5%) | 73,206 (29.2%) |
| 4.0x or more | 62,347 (43.4%) | 40,345 (16.1%) |
| Total | 143,569 (100.0%) | 250,376 (100.0%) |
Real Estate Taxes by Mortgage Status in New Hampshire
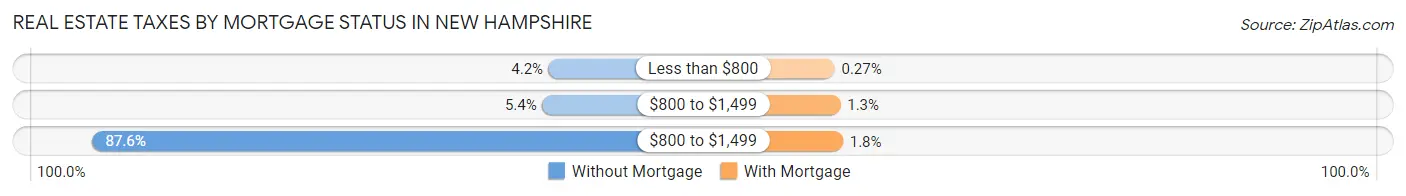
| Property Taxes | Without Mortgage | With Mortgage |
| Less than $800 | 6,072 (4.2%) | 672 (0.3%) |
| $800 to $1,499 | 7,746 (5.4%) | 3,312 (1.3%) |
| $800 to $1,499 | 125,737 (87.6%) | 4,453 (1.8%) |
| Total | 143,569 (100.0%) | 250,376 (100.0%) |
Health & Disability in New Hampshire
Health Insurance Coverage by Age in New Hampshire
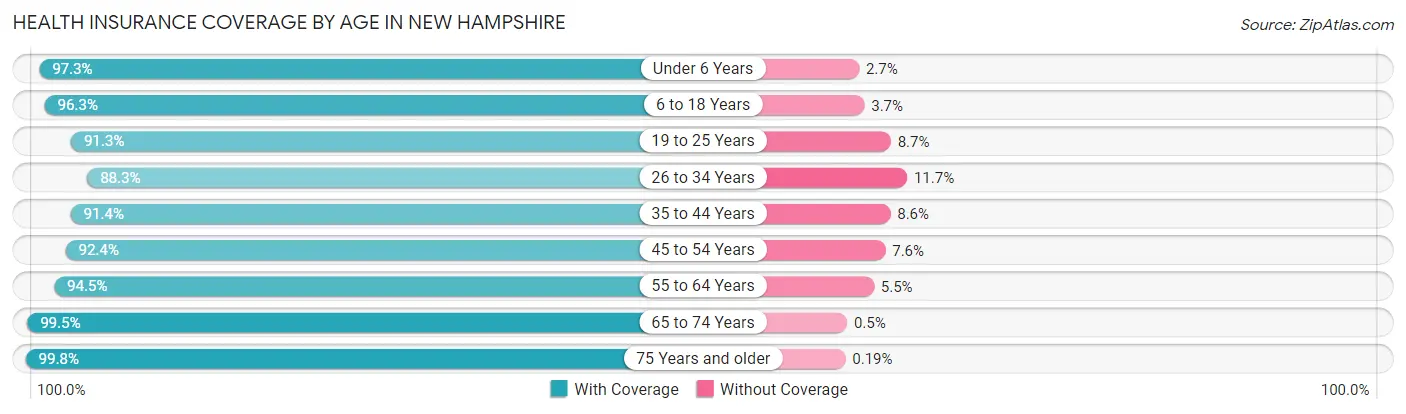
| Age Bracket | With Coverage | Without Coverage |
| Under 6 Years | 74,009 (97.3%) | 2,079 (2.7%) |
| 6 to 18 Years | 190,829 (96.3%) | 7,388 (3.7%) |
| 19 to 25 Years | 111,975 (91.3%) | 10,616 (8.7%) |
| 26 to 34 Years | 137,131 (88.3%) | 18,154 (11.7%) |
| 35 to 44 Years | 147,860 (91.4%) | 13,873 (8.6%) |
| 45 to 54 Years | 166,790 (92.4%) | 13,805 (7.6%) |
| 55 to 64 Years | 203,646 (94.5%) | 11,885 (5.5%) |
| 65 to 74 Years | 156,353 (99.5%) | 784 (0.5%) |
| 75 Years and older | 95,875 (99.8%) | 184 (0.2%) |
| Total | 1,284,468 (94.2%) | 78,768 (5.8%) |
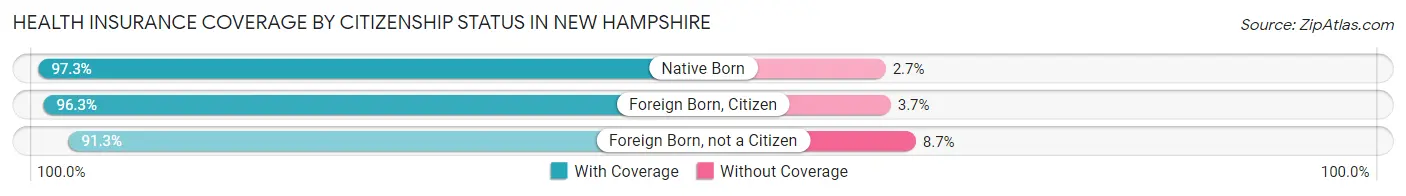
Health Insurance Coverage by Citizenship Status in New Hampshire
| Citizenship Status | With Coverage | Without Coverage |
| Native Born | 74,009 (97.3%) | 2,079 (2.7%) |
| Foreign Born, Citizen | 190,829 (96.3%) | 7,388 (3.7%) |
| Foreign Born, not a Citizen | 111,975 (91.3%) | 10,616 (8.7%) |
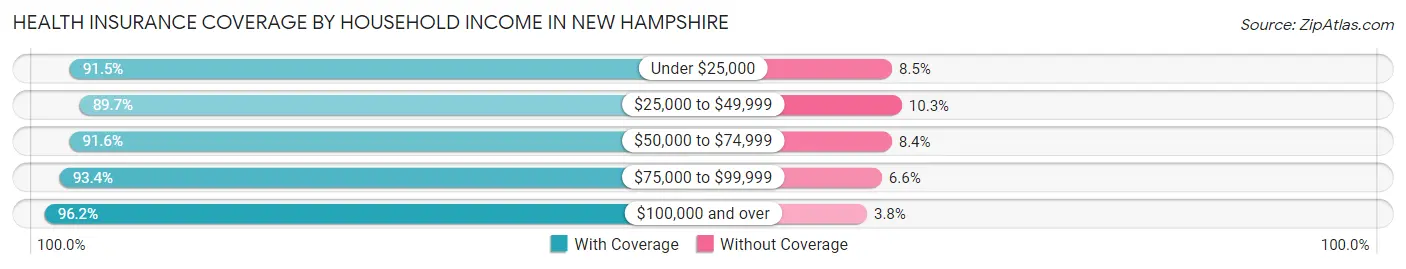
Health Insurance Coverage by Household Income in New Hampshire
| Household Income | With Coverage | Without Coverage |
| Under $25,000 | 84,414 (91.5%) | 7,833 (8.5%) |
| $25,000 to $49,999 | 130,509 (89.7%) | 15,041 (10.3%) |
| $50,000 to $74,999 | 163,268 (91.6%) | 15,029 (8.4%) |
| $75,000 to $99,999 | 164,779 (93.4%) | 11,601 (6.6%) |
| $100,000 and over | 716,489 (96.2%) | 28,200 (3.8%) |
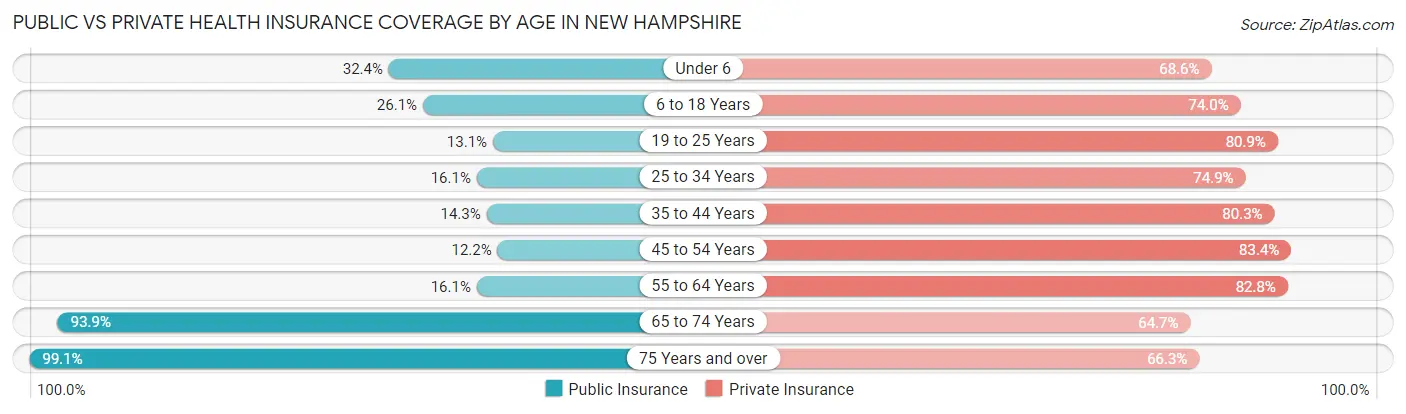
Public vs Private Health Insurance Coverage by Age in New Hampshire
| Age Bracket | Public Insurance | Private Insurance |
| Under 6 | 24,654 (32.4%) | 52,183 (68.6%) |
| 6 to 18 Years | 51,679 (26.1%) | 146,686 (74.0%) |
| 19 to 25 Years | 16,038 (13.1%) | 99,172 (80.9%) |
| 25 to 34 Years | 24,971 (16.1%) | 116,330 (74.9%) |
| 35 to 44 Years | 23,043 (14.2%) | 129,851 (80.3%) |
| 45 to 54 Years | 22,043 (12.2%) | 150,611 (83.4%) |
| 55 to 64 Years | 34,662 (16.1%) | 178,381 (82.8%) |
| 65 to 74 Years | 147,498 (93.9%) | 101,648 (64.7%) |
| 75 Years and over | 95,215 (99.1%) | 63,712 (66.3%) |
| Total | 439,803 (32.3%) | 1,038,574 (76.2%) |
Disability Status by Sex by Age in New Hampshire
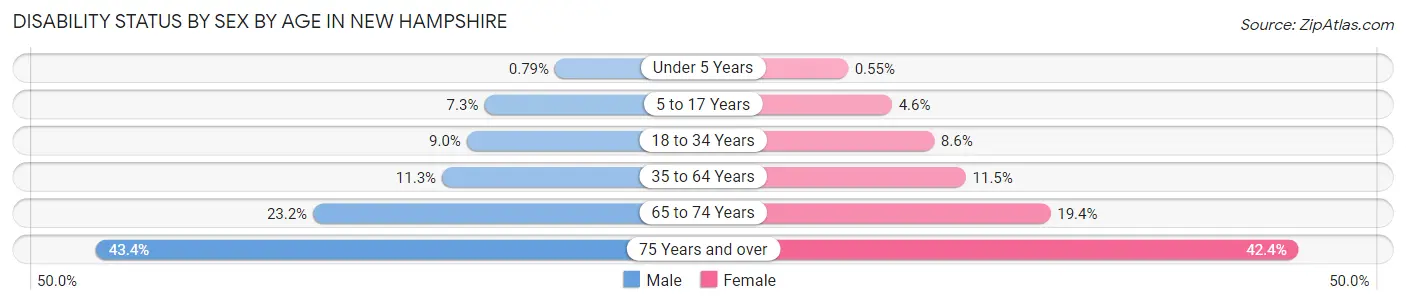
| Age Bracket | Male | Female |
| Under 5 Years | 252 (0.8%) | 171 (0.5%) |
| 5 to 17 Years | 7,278 (7.3%) | 4,341 (4.6%) |
| 18 to 34 Years | 13,648 (9.0%) | 12,329 (8.6%) |
| 35 to 64 Years | 31,490 (11.3%) | 32,012 (11.5%) |
| 65 to 74 Years | 17,794 (23.2%) | 15,594 (19.4%) |
| 75 Years and over | 17,949 (43.4%) | 23,174 (42.4%) |
Disability Class by Sex by Age in New Hampshire
Disability Class: Hearing Difficulty
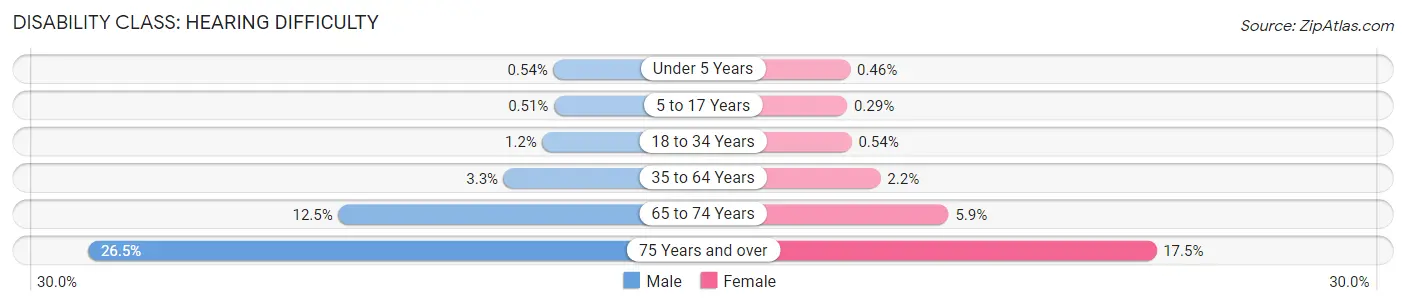
| Age Bracket | Male | Female |
| Under 5 Years | 171 (0.5%) | 144 (0.5%) |
| 5 to 17 Years | 507 (0.5%) | 274 (0.3%) |
| 18 to 34 Years | 1,751 (1.1%) | 776 (0.5%) |
| 35 to 64 Years | 9,246 (3.3%) | 5,976 (2.1%) |
| 65 to 74 Years | 9,587 (12.5%) | 4,787 (5.9%) |
| 75 Years and over | 10,950 (26.5%) | 9,576 (17.5%) |
Disability Class: Vision Difficulty
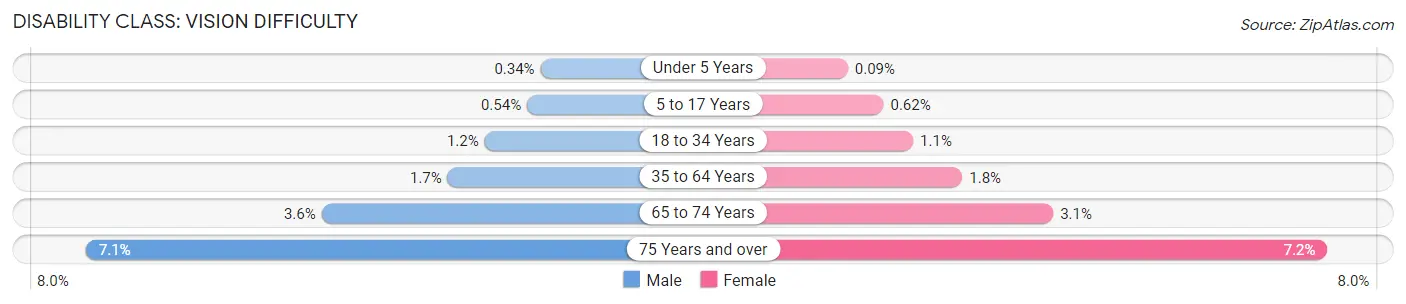
| Age Bracket | Male | Female |
| Under 5 Years | 107 (0.3%) | 27 (0.1%) |
| 5 to 17 Years | 540 (0.5%) | 582 (0.6%) |
| 18 to 34 Years | 1,787 (1.2%) | 1,528 (1.1%) |
| 35 to 64 Years | 4,799 (1.7%) | 4,992 (1.8%) |
| 65 to 74 Years | 2,750 (3.6%) | 2,533 (3.1%) |
| 75 Years and over | 2,933 (7.1%) | 3,944 (7.2%) |
Disability Class: Cognitive Difficulty
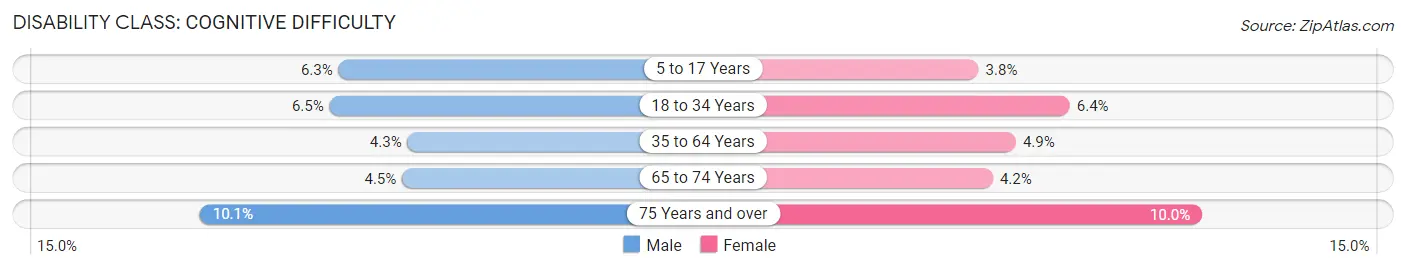
| Age Bracket | Male | Female |
| 5 to 17 Years | 6,205 (6.3%) | 3,572 (3.8%) |
| 18 to 34 Years | 9,902 (6.5%) | 9,160 (6.4%) |
| 35 to 64 Years | 12,130 (4.3%) | 13,516 (4.9%) |
| 65 to 74 Years | 3,435 (4.5%) | 3,389 (4.2%) |
| 75 Years and over | 4,185 (10.1%) | 5,484 (10.0%) |
Disability Class: Ambulatory Difficulty
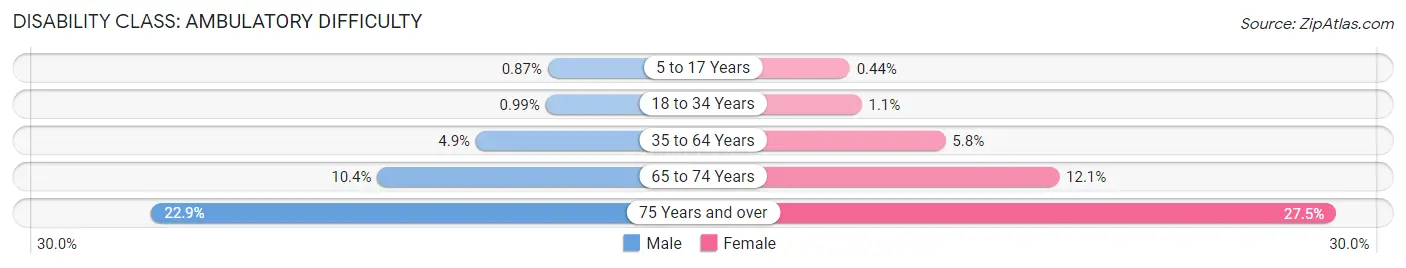
| Age Bracket | Male | Female |
| 5 to 17 Years | 862 (0.9%) | 417 (0.4%) |
| 18 to 34 Years | 1,505 (1.0%) | 1,587 (1.1%) |
| 35 to 64 Years | 13,592 (4.9%) | 16,073 (5.8%) |
| 65 to 74 Years | 7,933 (10.4%) | 9,752 (12.1%) |
| 75 Years and over | 9,491 (22.9%) | 15,051 (27.5%) |
Disability Class: Self-Care Difficulty
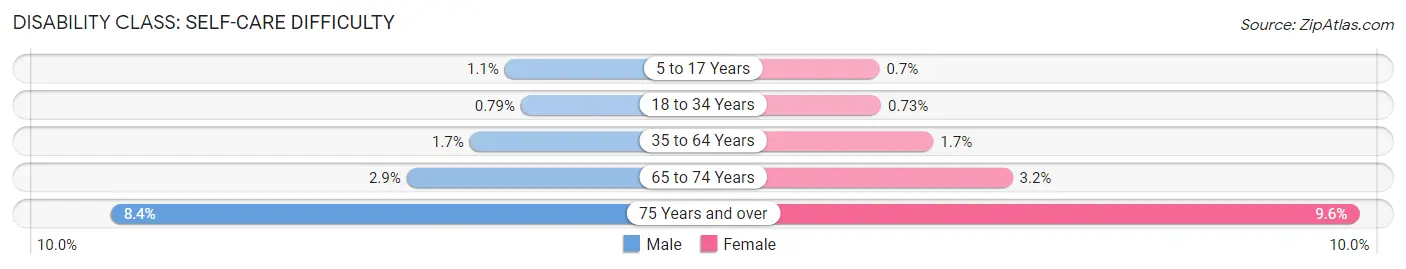
| Age Bracket | Male | Female |
| 5 to 17 Years | 1,084 (1.1%) | 653 (0.7%) |
| 18 to 34 Years | 1,198 (0.8%) | 1,054 (0.7%) |
| 35 to 64 Years | 4,863 (1.7%) | 4,739 (1.7%) |
| 65 to 74 Years | 2,230 (2.9%) | 2,554 (3.2%) |
| 75 Years and over | 3,477 (8.4%) | 5,251 (9.6%) |
Technology Access in New Hampshire
Computing Device Access in New Hampshire
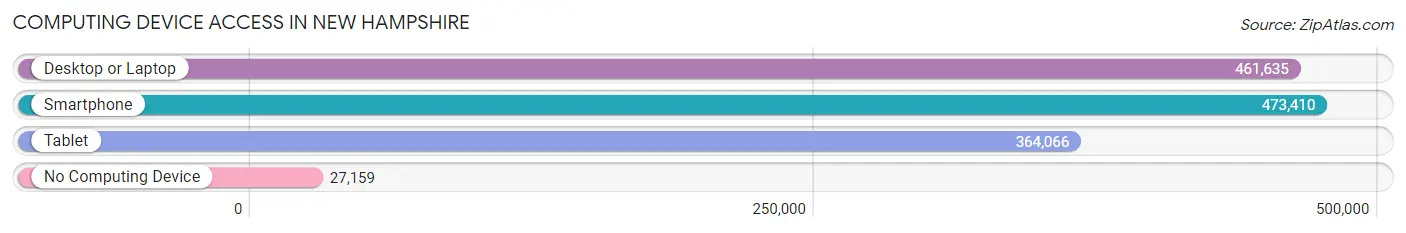
| Device Type | # Households | % Households |
| Desktop or Laptop | 461,635 | 84.7% |
| Smartphone | 473,410 | 86.9% |
| Tablet | 364,066 | 66.8% |
| No Computing Device | 27,159 | 5.0% |
| Total | 545,116 | 100.0% |
Internet Access in New Hampshire
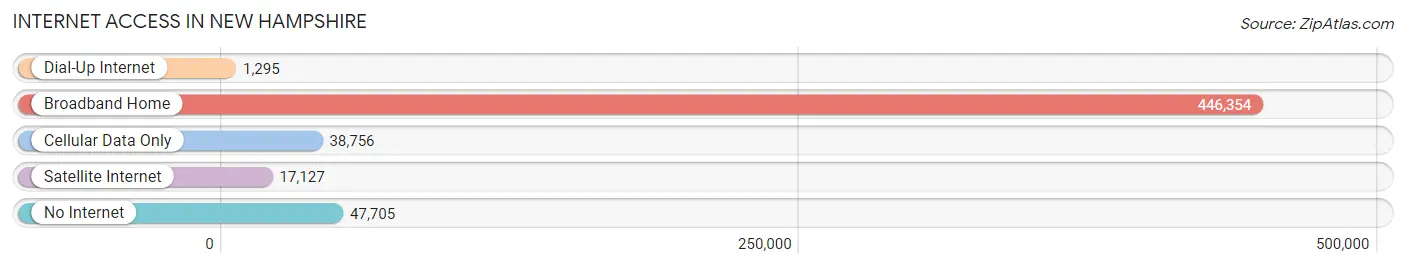
| Internet Type | # Households | % Households |
| Dial-Up Internet | 1,295 | 0.2% |
| Broadband Home | 446,354 | 81.9% |
| Cellular Data Only | 38,756 | 7.1% |
| Satellite Internet | 17,127 | 3.1% |
| No Internet | 47,705 | 8.7% |
| Total | 545,116 | 100.0% |
New Hampshire Summary
New Hampshire is a state located in the New England region of the northeastern United States. It is bordered by Massachusetts to the south, Vermont to the west, Maine and the Atlantic Ocean to the east, and the Canadian province of Quebec to the north. New Hampshire is the 5th smallest by area and the 10th least populous of the 50 states.
History
The first known inhabitants of New Hampshire were the Abenaki and other Algonquian-speaking tribes. The first European to explore the area was Martin Pring in 1603. The first permanent settlement was established in 1623 at Odiorne's Point near present-day Rye. The first English settlers arrived in 1629 and established the town of Dover.
In 1641, the Massachusetts Bay Colony and the Province of Maine combined to form the Massachusetts Bay Province, which included all of present-day New Hampshire. The Province of New Hampshire was established in 1679, and the first royal governor, John Cutt, was appointed in 1680.
During the American Revolution, New Hampshire was the first of the Thirteen Colonies to declare its independence from Great Britain. The state was the ninth to ratify the United States Constitution on June 21, 1788.
Geography
New Hampshire is located in the New England region of the northeastern United States. It is bordered by Massachusetts to the south, Vermont to the west, Maine and the Atlantic Ocean to the east, and the Canadian province of Quebec to the north.
The state has a total area of 9,349 square miles, making it the 5th smallest state in the country. The highest point in the state is Mount Washington, which stands at 6,288 feet above sea level. The state is home to numerous rivers, including the Merrimack, Connecticut, and Pemigewasset.
Economy
New Hampshire's economy is largely based on services, manufacturing, and tourism. The state's largest industries include manufacturing, health care, retail trade, and finance.
The state's largest employers include Dartmouth-Hitchcock Medical Center, the University of New Hampshire, and the state government. The state's largest private employers are BAE Systems, Fidelity Investments, and St. Joseph Hospital.
Tourism is a major industry in New Hampshire, with visitors spending over $4 billion annually. The state is home to numerous attractions, including the White Mountains, the Kancamagus Highway, and the Mount Washington Cog Railway.
Demographics
As of the 2010 census, the population of New Hampshire was 1,316,470. The state's population is predominantly white (94.2%), with small percentages of African Americans (1.6%), Asians (2.2%), and Native Americans (0.5%).
The median household income in New Hampshire is $68,485, and the median family income is $81,717. The state's poverty rate is 8.3%.
New Hampshire is home to numerous colleges and universities, including Dartmouth College, the University of New Hampshire, and the University of New Hampshire at Manchester. The state is also home to numerous private schools, including Phillips Exeter Academy and St. Paul's School.
Common Questions
When was New Hampshire Incorporated?
New Hampshire was Incorporated into the Union on Jun 21, 1788.
What is the Total Area of New Hampshire?
Total Area of New Hampshire is 9,348 Square Miles.
What is the Total Land Area of New Hampshire?
Total Land Area of New Hampshire is 8,952 Square Miles.
What is the Total Water Area of New Hampshire?
Total Water Area of New Hampshire is 396 Square Miles.
What is the Average Elevation in New Hampshire?
Average Elevation in New Hampshire is 1,000 Feet.
What is the Highest Elevation in New Hampshire?
Highest Elevation in New Hampshire is 6,288 Feet.
What is the Lowest Elevation in New Hampshire?
Lowest Elevation in New Hampshire is 0 Feet.
What is the Population Density in New Hampshire?
Population Density in New Hampshire is 154.1 People per Square Mile.
What is Per Capita Income in New Hampshire?
Per Capita income in New Hampshire is $48,250.
What is the Median Family Income in New Hampshire?
Median Family Income in New Hampshire is $113,605.
What is the Median Household income in New Hampshire?
Median Household Income in New Hampshire is $90,845.
What is Income or Wage Gap in New Hampshire?
Income or Wage Gap in New Hampshire is 29.8%.
Women in New Hampshire earn 70.2 cents for every dollar earned by a man.
What is Family Income Deficit in New Hampshire?
Family Income Deficit in New Hampshire is $10,615.
Families that are below poverty line in New Hampshire earn $10,615 less on average than the poverty threshold level.
What is Inequality or Gini Index in New Hampshire?
Inequality or Gini Index in New Hampshire is 0.44.
What is the Total Population of New Hampshire?
Total Population of New Hampshire is 1,379,610.
What is the Total Male Population of New Hampshire?
Total Male Population of New Hampshire is 689,725.
What is the Total Female Population of New Hampshire?
Total Female Population of New Hampshire is 689,885.
What is the Ratio of Males per 100 Females in New Hampshire?
There are 99.98 Males per 100 Females in New Hampshire.
What is the Ratio of Females per 100 Males in New Hampshire?
There are 100.02 Females per 100 Males in New Hampshire.
What is the Median Population Age in New Hampshire?
Median Population Age in New Hampshire is 43.1 Years.
What is the Average Family Size in New Hampshire
Average Family Size in New Hampshire is 3.0 People.
What is the Average Household Size in New Hampshire
Average Household Size in New Hampshire is 2.5 People.
How Large is the Labor Force in New Hampshire?
There are 769,933 People in the Labor Forcein in New Hampshire.
What is the Percentage of People in the Labor Force in New Hampshire?
66.6% of People are in the Labor Force in New Hampshire.
What is the Unemployment Rate in New Hampshire?
Unemployment Rate in New Hampshire is 3.6%.