Beaufort County, SC Map & Demographics
Beaufort County Map
Beaufort County Overview
$48,132
PER CAPITA INCOME
$94,307
AVG FAMILY INCOME
$81,260
AVG HOUSEHOLD INCOME
21.6%
WAGE / INCOME GAP [ % ]
78.4¢/ $1
WAGE / INCOME GAP [ $ ]
$10,522
FAMILY INCOME DEFICIT
0.48
INEQUALITY / GINI INDEX
189,071
TOTAL POPULATION
93,987
MALE POPULATION
95,084
FEMALE POPULATION
98.85
MALES / 100 FEMALES
101.17
FEMALES / 100 MALES
46.8
MEDIAN AGE
2.9
AVG FAMILY SIZE
2.4
AVG HOUSEHOLD SIZE
88,521
LABOR FORCE [ PEOPLE ]
55.4%
PERCENT IN LABOR FORCE
3.1%
UNEMPLOYMENT RATE
Beaufort County Area Codes
Income in Beaufort County
Income Overview in Beaufort County
Per Capita Income in Beaufort County is $48,132, while median incomes of families and households are $94,307 and $81,260 respectively.
| Characteristic | Number | Measure |
| Per Capita Income | 189,071 | $48,132 |
| Median Family Income | 52,586 | $94,307 |
| Mean Family Income | 52,586 | $132,628 |
| Median Household Income | 76,113 | $81,260 |
| Mean Household Income | 76,113 | $115,345 |
| Income Deficit | 52,586 | $10,522 |
| Wage / Income Gap (%) | 189,071 | 21.59% |
| Wage / Income Gap ($) | 189,071 | 78.41¢ per $1 |
| Gini / Inequality Index | 189,071 | 0.48 |
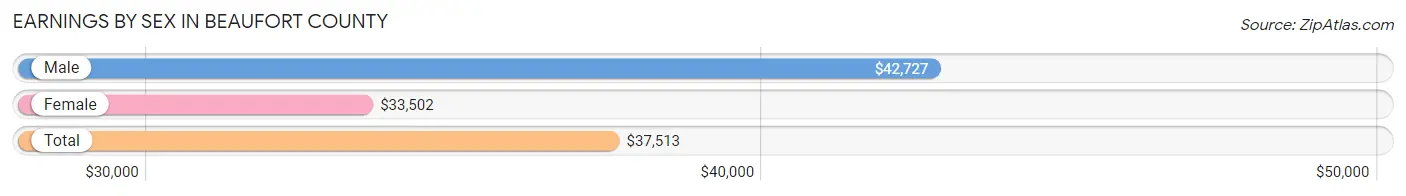
Earnings by Sex in Beaufort County
Average Earnings in Beaufort County are $37,513, $42,727 for men and $33,502 for women, a difference of 21.6%.
| Sex | Number | Average Earnings |
| Male | 51,902 (55.4%) | $42,727 |
| Female | 41,728 (44.6%) | $33,502 |
| Total | 93,630 (100.0%) | $37,513 |
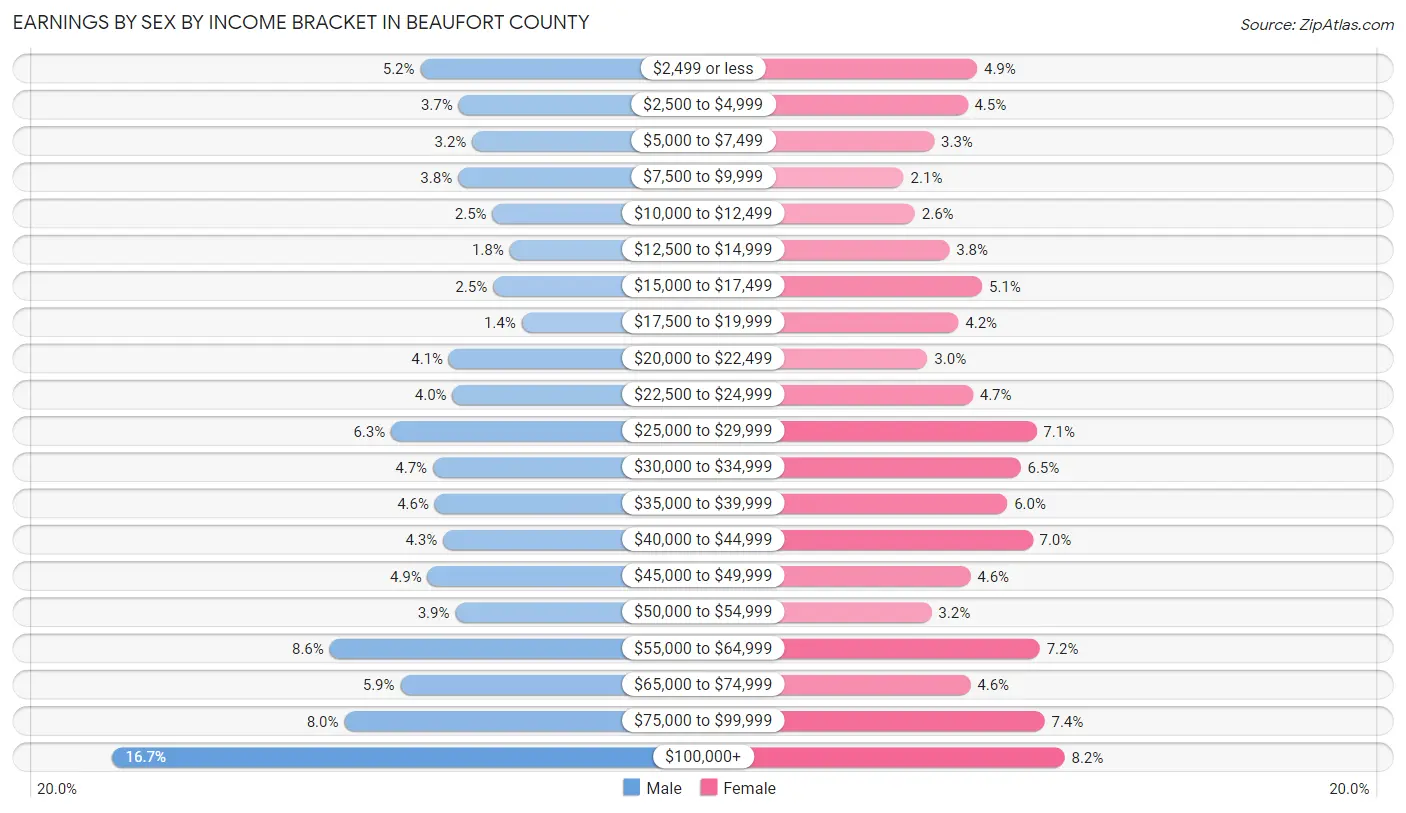
Earnings by Sex by Income Bracket in Beaufort County
The most common earnings brackets in Beaufort County are $100,000+ for men (8,670 | 16.7%) and $100,000+ for women (3,405 | 8.2%).
| Income | Male | Female |
| $2,499 or less | 2,684 (5.2%) | 2,035 (4.9%) |
| $2,500 to $4,999 | 1,940 (3.7%) | 1,887 (4.5%) |
| $5,000 to $7,499 | 1,678 (3.2%) | 1,366 (3.3%) |
| $7,500 to $9,999 | 1,951 (3.8%) | 889 (2.1%) |
| $10,000 to $12,499 | 1,283 (2.5%) | 1,062 (2.5%) |
| $12,500 to $14,999 | 951 (1.8%) | 1,603 (3.8%) |
| $15,000 to $17,499 | 1,273 (2.5%) | 2,116 (5.1%) |
| $17,500 to $19,999 | 715 (1.4%) | 1,743 (4.2%) |
| $20,000 to $22,499 | 2,129 (4.1%) | 1,261 (3.0%) |
| $22,500 to $24,999 | 2,059 (4.0%) | 1,971 (4.7%) |
| $25,000 to $29,999 | 3,254 (6.3%) | 2,964 (7.1%) |
| $30,000 to $34,999 | 2,440 (4.7%) | 2,716 (6.5%) |
| $35,000 to $39,999 | 2,404 (4.6%) | 2,506 (6.0%) |
| $40,000 to $44,999 | 2,240 (4.3%) | 2,904 (7.0%) |
| $45,000 to $49,999 | 2,544 (4.9%) | 1,933 (4.6%) |
| $50,000 to $54,999 | 2,003 (3.9%) | 1,324 (3.2%) |
| $55,000 to $64,999 | 4,449 (8.6%) | 3,016 (7.2%) |
| $65,000 to $74,999 | 3,073 (5.9%) | 1,933 (4.6%) |
| $75,000 to $99,999 | 4,162 (8.0%) | 3,094 (7.4%) |
| $100,000+ | 8,670 (16.7%) | 3,405 (8.2%) |
| Total | 51,902 (100.0%) | 41,728 (100.0%) |
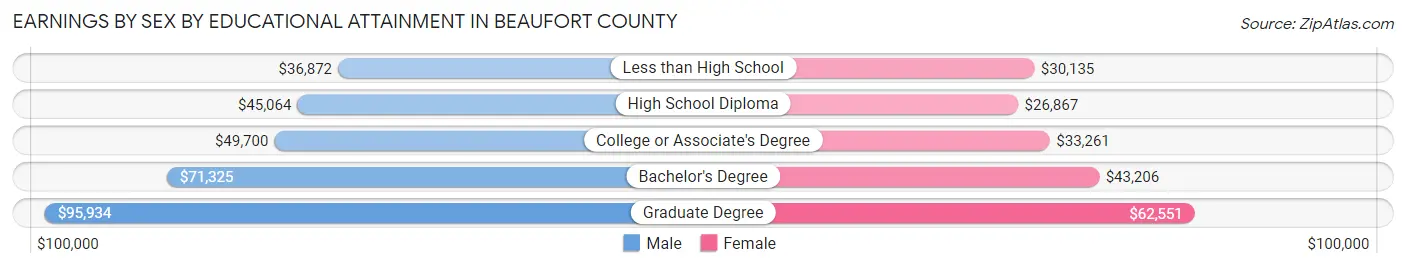
Earnings by Sex by Educational Attainment in Beaufort County
Average earnings in Beaufort County are $54,369 for men and $38,715 for women, a difference of 28.8%. Men with an educational attainment of graduate degree enjoy the highest average annual earnings of $95,934, while those with less than high school education earn the least with $36,872. Women with an educational attainment of graduate degree earn the most with the average annual earnings of $62,551, while those with high school diploma education have the smallest earnings of $26,867.
| Educational Attainment | Male Income | Female Income |
| Less than High School | $36,872 | $30,135 |
| High School Diploma | $45,064 | $26,867 |
| College or Associate's Degree | $49,700 | $33,261 |
| Bachelor's Degree | $71,325 | $43,206 |
| Graduate Degree | $95,934 | $62,551 |
| Total | $54,369 | $38,715 |
Family Income in Beaufort County
Family Income Brackets in Beaufort County
According to the Beaufort County family income data, there are 10,780 families falling into the $100,000 to $149,999 income range, which is the most common income bracket and makes up 20.5% of all families. Conversely, the $10,000 to $14,999 income bracket is the least frequent group with only 736 families (1.4%) belonging to this category.
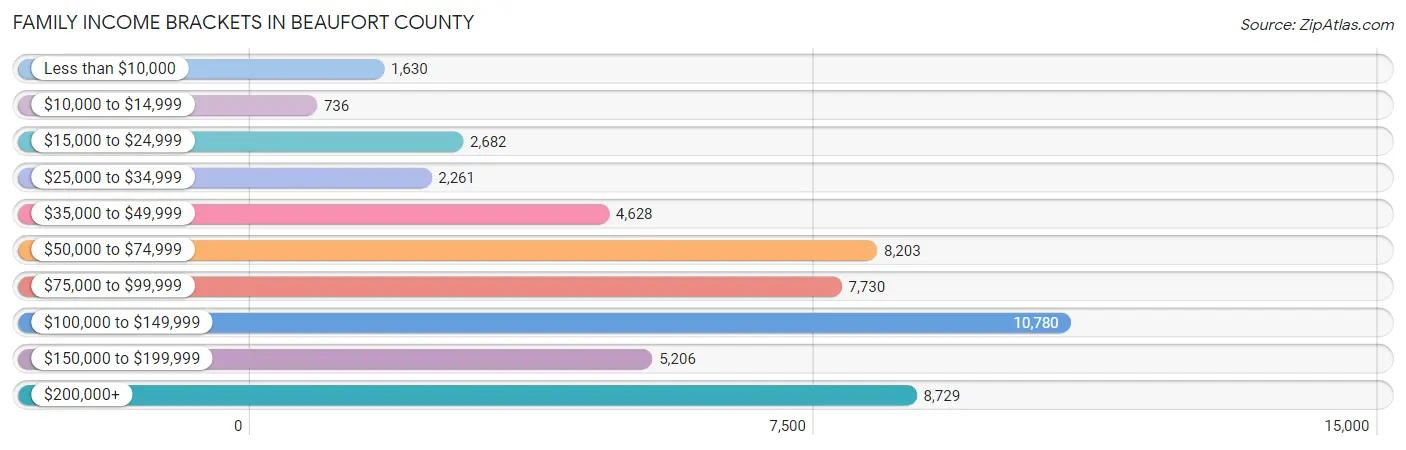
| Income Bracket | # Families | % Families |
| Less than $10,000 | 1,630 | 3.1% |
| $10,000 to $14,999 | 736 | 1.4% |
| $15,000 to $24,999 | 2,682 | 5.1% |
| $25,000 to $34,999 | 2,261 | 4.3% |
| $35,000 to $49,999 | 4,628 | 8.8% |
| $50,000 to $74,999 | 8,203 | 15.6% |
| $75,000 to $99,999 | 7,730 | 14.7% |
| $100,000 to $149,999 | 10,780 | 20.5% |
| $150,000 to $199,999 | 5,206 | 9.9% |
| $200,000+ | 8,729 | 16.6% |
Family Income by Famaliy Size in Beaufort County
7+ person families (497 | 0.9%) account for the highest median family income in Beaufort County with $150,707 per family, while 2-person families (32,592 | 62.0%) have the highest median income of $46,865 per family member.
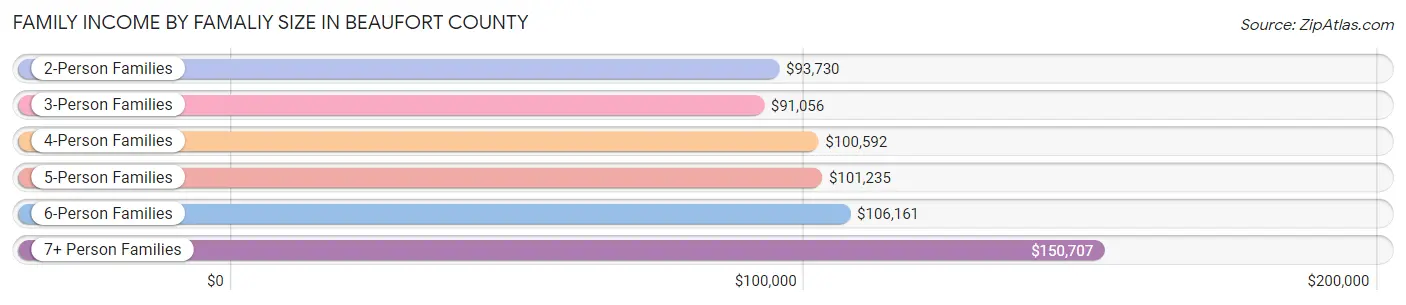
| Income Bracket | # Families | Median Income |
| 2-Person Families | 32,592 (62.0%) | $93,730 |
| 3-Person Families | 9,363 (17.8%) | $91,056 |
| 4-Person Families | 6,687 (12.7%) | $100,592 |
| 5-Person Families | 2,656 (5.1%) | $101,235 |
| 6-Person Families | 791 (1.5%) | $106,161 |
| 7+ Person Families | 497 (0.9%) | $150,707 |
| Total | 52,586 (100.0%) | $94,307 |
Family Income by Number of Earners in Beaufort County
The median family income in Beaufort County is $94,307, with families comprising 3+ earners (3,884) having the highest median family income of $131,445, while families with 1 earner (16,238) have the lowest median family income of $73,361, accounting for 7.4% and 30.9% of families, respectively.
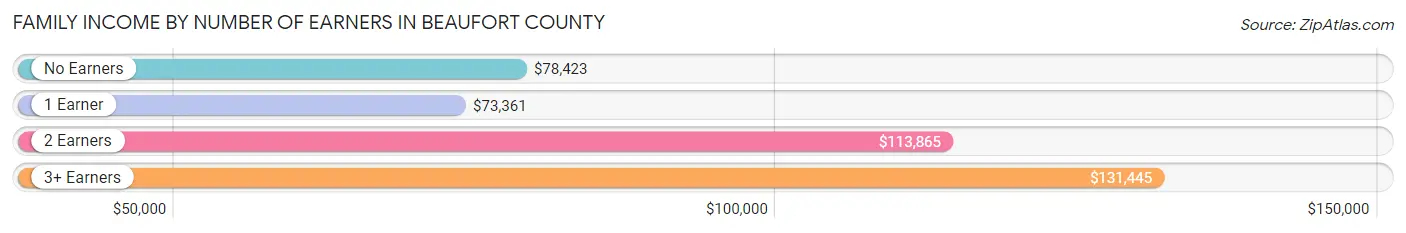
| Number of Earners | # Families | Median Income |
| No Earners | 14,740 (28.0%) | $78,423 |
| 1 Earner | 16,238 (30.9%) | $73,361 |
| 2 Earners | 17,724 (33.7%) | $113,865 |
| 3+ Earners | 3,884 (7.4%) | $131,445 |
| Total | 52,586 (100.0%) | $94,307 |
Household Income in Beaufort County
Household Income Brackets in Beaufort County
With 13,624 households falling in the category, the $100,000 to $149,999 income range is the most frequent in Beaufort County, accounting for 17.9% of all households. In contrast, only 1,979 households (2.6%) fall into the $10,000 to $14,999 income bracket, making it the least populous group.
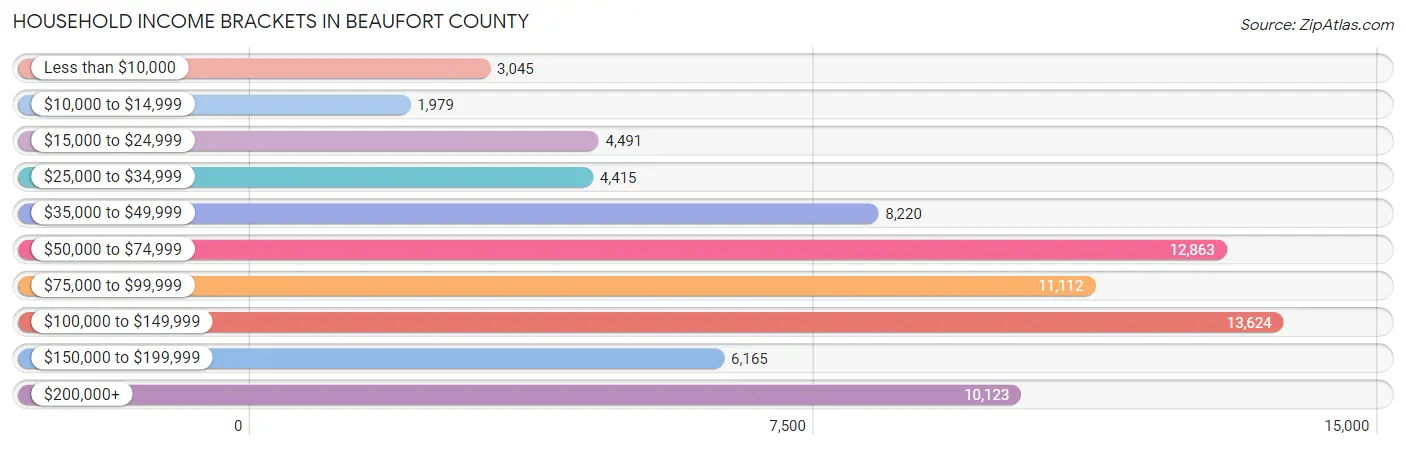
| Income Bracket | # Households | % Households |
| Less than $10,000 | 3,045 | 4.0% |
| $10,000 to $14,999 | 1,979 | 2.6% |
| $15,000 to $24,999 | 4,491 | 5.9% |
| $25,000 to $34,999 | 4,415 | 5.8% |
| $35,000 to $49,999 | 8,220 | 10.8% |
| $50,000 to $74,999 | 12,863 | 16.9% |
| $75,000 to $99,999 | 11,112 | 14.6% |
| $100,000 to $149,999 | 13,624 | 17.9% |
| $150,000 to $199,999 | 6,165 | 8.1% |
| $200,000+ | 10,123 | 13.3% |
Household Income by Householder Age in Beaufort County
The median household income in Beaufort County is $81,260, with the highest median household income of $96,122 found in the 45 to 64 years age bracket for the primary householder. A total of 24,795 households (32.6%) fall into this category. Meanwhile, the 15 to 24 years age bracket for the primary householder has the lowest median household income of $45,517, with 2,452 households (3.2%) in this group.
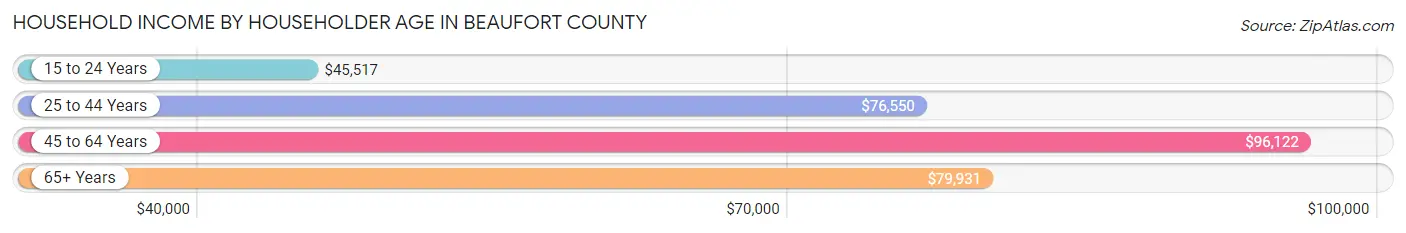
| Income Bracket | # Households | Median Income |
| 15 to 24 Years | 2,452 (3.2%) | $45,517 |
| 25 to 44 Years | 17,686 (23.2%) | $76,550 |
| 45 to 64 Years | 24,795 (32.6%) | $96,122 |
| 65+ Years | 31,180 (41.0%) | $79,931 |
| Total | 76,113 (100.0%) | $81,260 |
Poverty in Beaufort County
Income Below Poverty by Sex and Age in Beaufort County
With 9.1% poverty level for males and 11.5% for females among the residents of Beaufort County, 5 year old males and under 5 year old females are the most vulnerable to poverty, with 242 males (27.5%) and 1,079 females (24.6%) in their respective age groups living below the poverty level.
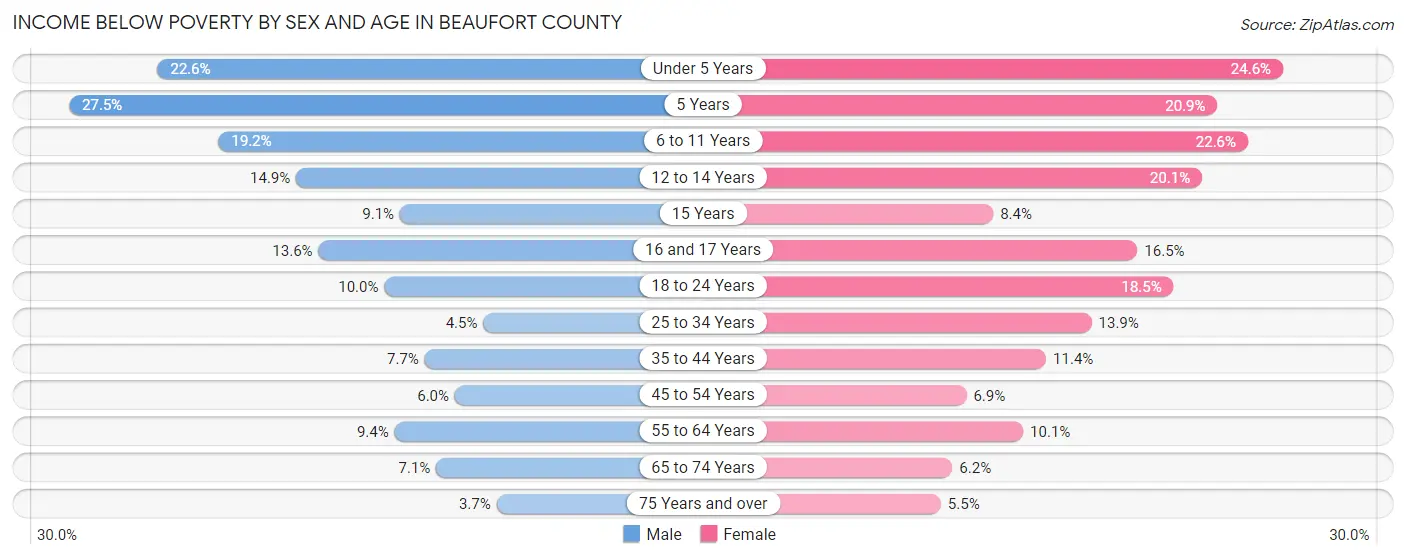
| Age Bracket | Male | Female |
| Under 5 Years | 1,031 (22.6%) | 1,079 (24.6%) |
| 5 Years | 242 (27.5%) | 161 (20.9%) |
| 6 to 11 Years | 1,076 (19.2%) | 1,093 (22.6%) |
| 12 to 14 Years | 448 (14.9%) | 692 (20.1%) |
| 15 Years | 62 (9.1%) | 66 (8.4%) |
| 16 and 17 Years | 311 (13.6%) | 331 (16.5%) |
| 18 to 24 Years | 821 (10.0%) | 1,204 (18.5%) |
| 25 to 34 Years | 446 (4.5%) | 1,368 (13.9%) |
| 35 to 44 Years | 712 (7.7%) | 1,073 (11.4%) |
| 45 to 54 Years | 544 (6.0%) | 698 (6.9%) |
| 55 to 64 Years | 1,112 (9.4%) | 1,430 (10.1%) |
| 65 to 74 Years | 991 (7.1%) | 1,003 (6.2%) |
| 75 Years and over | 385 (3.7%) | 624 (5.5%) |
| Total | 8,181 (9.1%) | 10,822 (11.5%) |
Income Above Poverty by Sex and Age in Beaufort County
According to the poverty statistics in Beaufort County, males aged 75 years and over and females aged 75 years and over are the age groups that are most secure financially, with 96.3% of males and 94.5% of females in these age groups living above the poverty line.
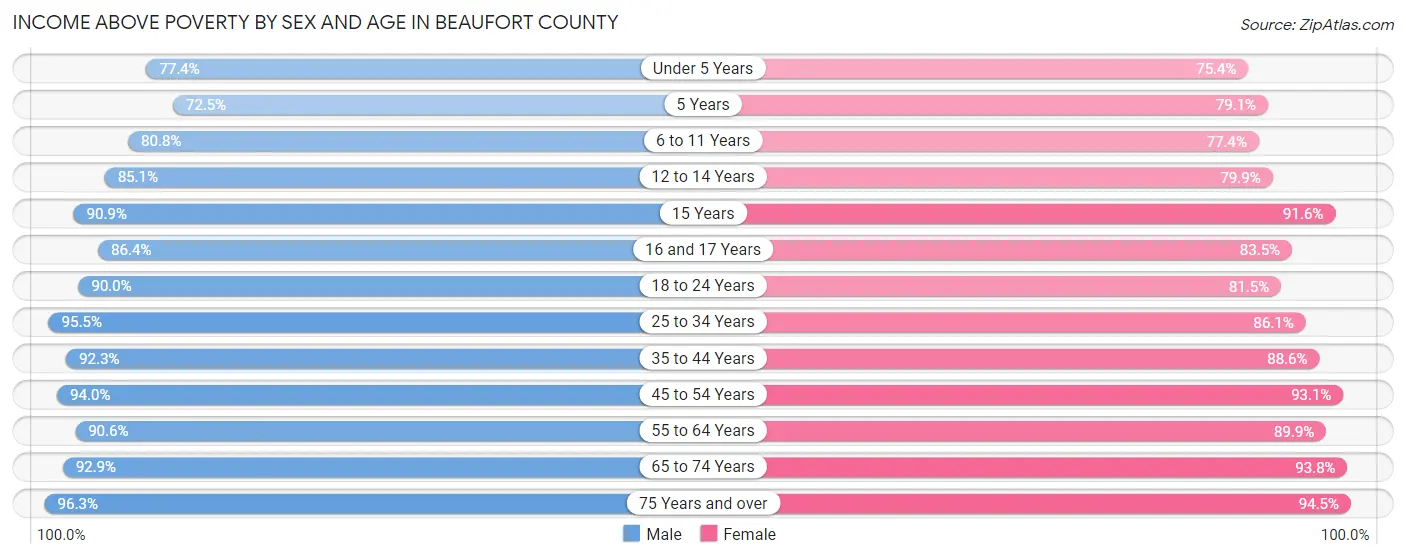
| Age Bracket | Male | Female |
| Under 5 Years | 3,529 (77.4%) | 3,314 (75.4%) |
| 5 Years | 637 (72.5%) | 609 (79.1%) |
| 6 to 11 Years | 4,525 (80.8%) | 3,742 (77.4%) |
| 12 to 14 Years | 2,563 (85.1%) | 2,758 (79.9%) |
| 15 Years | 619 (90.9%) | 717 (91.6%) |
| 16 and 17 Years | 1,969 (86.4%) | 1,680 (83.5%) |
| 18 to 24 Years | 7,410 (90.0%) | 5,314 (81.5%) |
| 25 to 34 Years | 9,551 (95.5%) | 8,464 (86.1%) |
| 35 to 44 Years | 8,508 (92.3%) | 8,352 (88.6%) |
| 45 to 54 Years | 8,459 (94.0%) | 9,361 (93.1%) |
| 55 to 64 Years | 10,717 (90.6%) | 12,724 (89.9%) |
| 65 to 74 Years | 13,013 (92.9%) | 15,292 (93.8%) |
| 75 Years and over | 9,957 (96.3%) | 10,685 (94.5%) |
| Total | 81,457 (90.9%) | 83,012 (88.5%) |
Income Below Poverty Among Married-Couple Families in Beaufort County
The poverty statistics for married-couple families in Beaufort County show that 4.5% or 1,953 of the total 43,213 families live below the poverty line. Families with 3 or 4 children have the highest poverty rate of 7.9%, comprising of 125 families. On the other hand, families with 5 or more children have the lowest poverty rate of 0.0%, which includes 0 families.
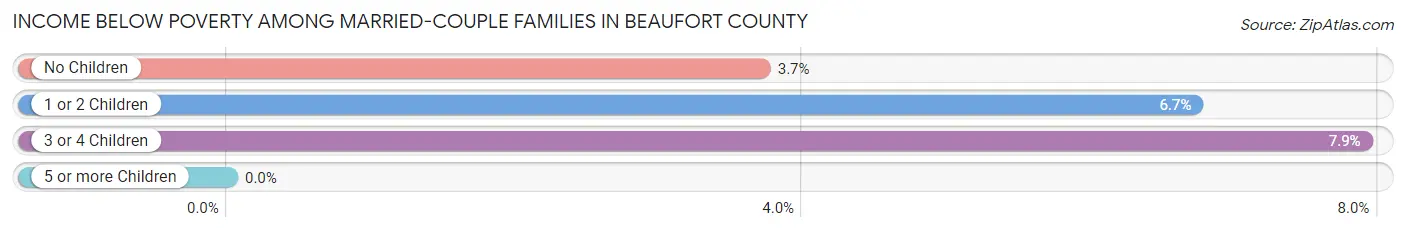
| Children | Above Poverty | Below Poverty |
| No Children | 30,464 (96.3%) | 1,175 (3.7%) |
| 1 or 2 Children | 9,061 (93.3%) | 653 (6.7%) |
| 3 or 4 Children | 1,458 (92.1%) | 125 (7.9%) |
| 5 or more Children | 277 (100.0%) | 0 (0.0%) |
| Total | 41,260 (95.5%) | 1,953 (4.5%) |
Income Below Poverty Among Single-Parent Households in Beaufort County
According to the poverty data in Beaufort County, 12.5% or 285 single-father households and 30.5% or 2,165 single-mother households are living below the poverty line. Among single-father households, those with 3 or 4 children have the highest poverty rate, with 58 households (45.3%) experiencing poverty. Likewise, among single-mother households, those with 5 or more children have the highest poverty rate, with 71 households (83.5%) falling below the poverty line.
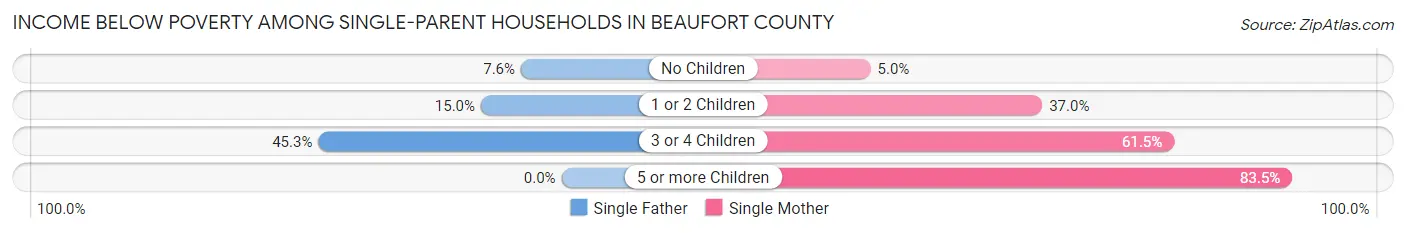
| Children | Single Father | Single Mother |
| No Children | 96 (7.6%) | 114 (5.0%) |
| 1 or 2 Children | 131 (15.0%) | 1,404 (37.0%) |
| 3 or 4 Children | 58 (45.3%) | 576 (61.5%) |
| 5 or more Children | 0 (0.0%) | 71 (83.5%) |
| Total | 285 (12.5%) | 2,165 (30.5%) |
Income Below Poverty Among Married-Couple vs Single-Parent Households in Beaufort County
The poverty data for Beaufort County shows that 1,953 of the married-couple family households (4.5%) and 2,450 of the single-parent households (26.1%) are living below the poverty level. Within the married-couple family households, those with 3 or 4 children have the highest poverty rate, with 125 households (7.9%) falling below the poverty line. Among the single-parent households, those with 5 or more children have the highest poverty rate, with 71 household (74.7%) living below poverty.
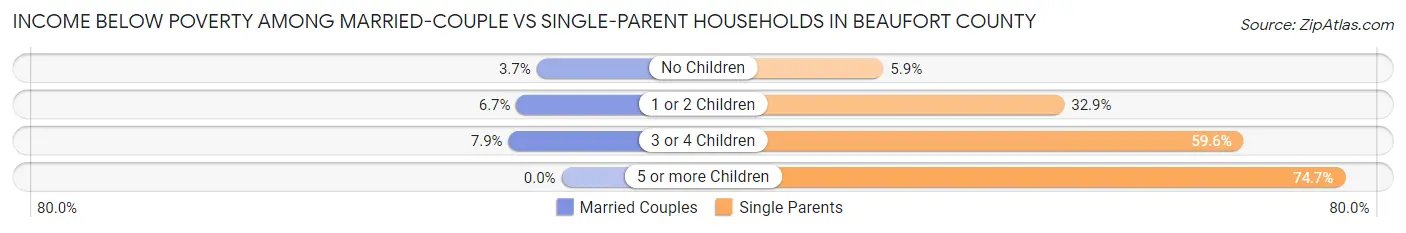
| Children | Married-Couple Families | Single-Parent Households |
| No Children | 1,175 (3.7%) | 210 (5.9%) |
| 1 or 2 Children | 653 (6.7%) | 1,535 (32.9%) |
| 3 or 4 Children | 125 (7.9%) | 634 (59.6%) |
| 5 or more Children | 0 (0.0%) | 71 (74.7%) |
| Total | 1,953 (4.5%) | 2,450 (26.1%) |
Race in Beaufort County
The most populous races in Beaufort County are White / Caucasian (134,379 | 71.1%), Black / African American (30,700 | 16.2%), and Hispanic or Latino (21,259 | 11.2%).
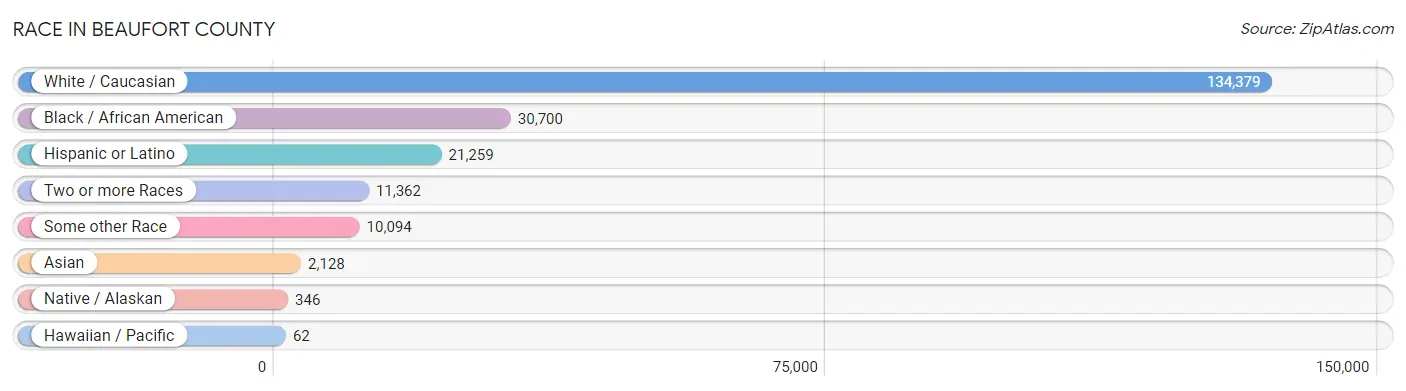
| Race | # Population | % Population |
| Asian | 2,128 | 1.1% |
| Black / African American | 30,700 | 16.2% |
| Hawaiian / Pacific | 62 | 0.0% |
| Hispanic or Latino | 21,259 | 11.2% |
| Native / Alaskan | 346 | 0.2% |
| White / Caucasian | 134,379 | 71.1% |
| Two or more Races | 11,362 | 6.0% |
| Some other Race | 10,094 | 5.3% |
| Total | 189,071 | 100.0% |
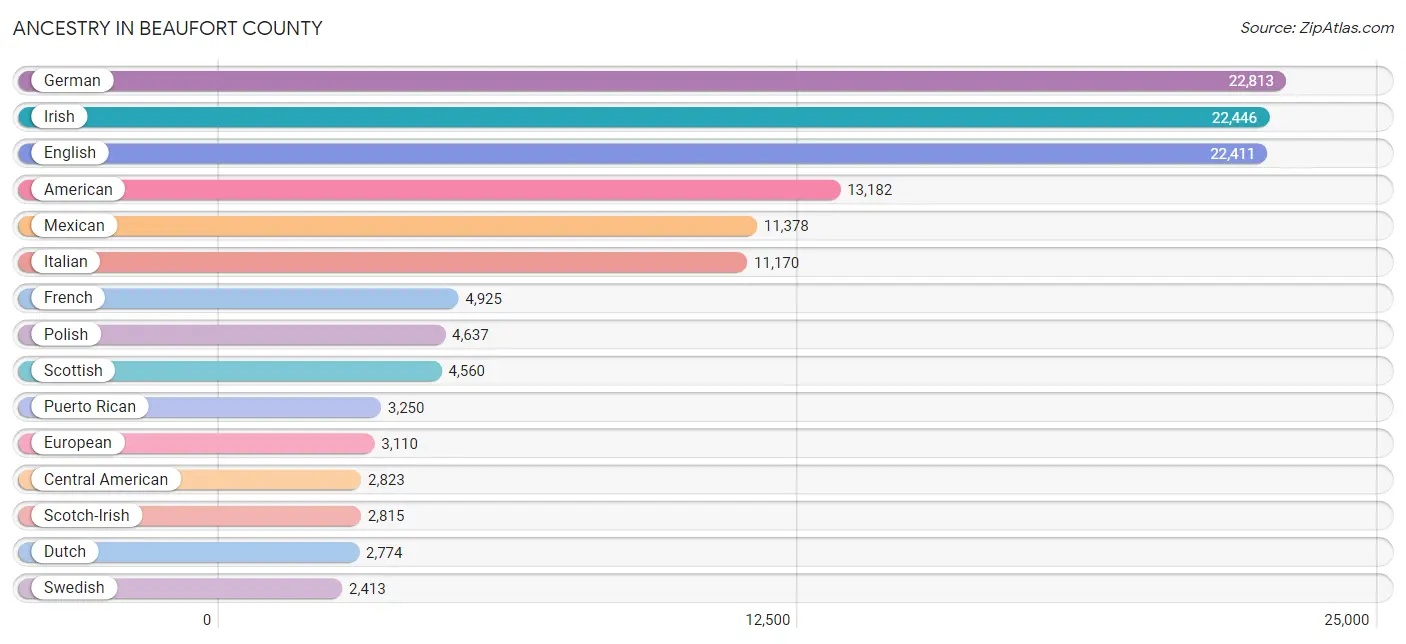
Ancestry in Beaufort County
The most populous ancestries reported in Beaufort County are German (22,813 | 12.1%), Irish (22,446 | 11.9%), English (22,411 | 11.8%), American (13,182 | 7.0%), and Mexican (11,378 | 6.0%), together accounting for 48.8% of all Beaufort County residents.
| Ancestry | # Population | % Population |
| African | 433 | 0.2% |
| Albanian | 8 | 0.0% |
| Alsatian | 42 | 0.0% |
| American | 13,182 | 7.0% |
| Arab | 550 | 0.3% |
| Argentinean | 368 | 0.2% |
| Armenian | 216 | 0.1% |
| Australian | 19 | 0.0% |
| Austrian | 427 | 0.2% |
| Bahamian | 66 | 0.0% |
| Bangladeshi | 54 | 0.0% |
| Barbadian | 36 | 0.0% |
| Belgian | 74 | 0.0% |
| Bermudan | 16 | 0.0% |
| Bhutanese | 495 | 0.3% |
| Blackfeet | 233 | 0.1% |
| Bolivian | 49 | 0.0% |
| Brazilian | 88 | 0.1% |
| British | 1,528 | 0.8% |
| Bulgarian | 20 | 0.0% |
| Burmese | 302 | 0.2% |
| Canadian | 410 | 0.2% |
| Cape Verdean | 10 | 0.0% |
| Celtic | 39 | 0.0% |
| Central American | 2,823 | 1.5% |
| Central American Indian | 101 | 0.1% |
| Cherokee | 838 | 0.4% |
| Chickasaw | 2 | 0.0% |
| Chilean | 57 | 0.0% |
| Chippewa | 2 | 0.0% |
| Choctaw | 113 | 0.1% |
| Colombian | 748 | 0.4% |
| Comanche | 13 | 0.0% |
| Costa Rican | 335 | 0.2% |
| Croatian | 155 | 0.1% |
| Crow | 12 | 0.0% |
| Cuban | 429 | 0.2% |
| Czech | 503 | 0.3% |
| Czechoslovakian | 126 | 0.1% |
| Danish | 460 | 0.2% |
| Delaware | 26 | 0.0% |
| Dominican | 301 | 0.2% |
| Dutch | 2,774 | 1.5% |
| Eastern European | 681 | 0.4% |
| Ecuadorian | 80 | 0.0% |
| English | 22,411 | 11.8% |
| Ethiopian | 113 | 0.1% |
| European | 3,110 | 1.6% |
| Filipino | 16 | 0.0% |
| Finnish | 364 | 0.2% |
| French | 4,925 | 2.6% |
| French Canadian | 869 | 0.5% |
| German | 22,813 | 12.1% |
| Ghanaian | 14 | 0.0% |
| Greek | 763 | 0.4% |
| Guamanian / Chamorro | 89 | 0.1% |
| Guatemalan | 386 | 0.2% |
| Guyanese | 181 | 0.1% |
| Haitian | 92 | 0.1% |
| Honduran | 1,514 | 0.8% |
| Hopi | 56 | 0.0% |
| Hungarian | 962 | 0.5% |
| Icelander | 53 | 0.0% |
| Indian (Asian) | 284 | 0.2% |
| Inupiat | 102 | 0.1% |
| Iranian | 122 | 0.1% |
| Irish | 22,446 | 11.9% |
| Iroquois | 47 | 0.0% |
| Israeli | 5 | 0.0% |
| Italian | 11,170 | 5.9% |
| Jamaican | 722 | 0.4% |
| Japanese | 5 | 0.0% |
| Korean | 1,073 | 0.6% |
| Laotian | 32 | 0.0% |
| Latvian | 29 | 0.0% |
| Lebanese | 438 | 0.2% |
| Lithuanian | 378 | 0.2% |
| Lumbee | 5 | 0.0% |
| Luxembourger | 6 | 0.0% |
| Macedonian | 59 | 0.0% |
| Maltese | 34 | 0.0% |
| Mexican | 11,378 | 6.0% |
| Native Hawaiian | 166 | 0.1% |
| Navajo | 3 | 0.0% |
| New Zealander | 19 | 0.0% |
| Nicaraguan | 157 | 0.1% |
| Northern European | 214 | 0.1% |
| Norwegian | 1,827 | 1.0% |
| Pakistani | 156 | 0.1% |
| Panamanian | 119 | 0.1% |
| Pennsylvania German | 74 | 0.0% |
| Peruvian | 77 | 0.0% |
| Polish | 4,637 | 2.5% |
| Portuguese | 569 | 0.3% |
| Pueblo | 55 | 0.0% |
| Puerto Rican | 3,250 | 1.7% |
| Romanian | 191 | 0.1% |
| Russian | 1,345 | 0.7% |
| Salvadoran | 303 | 0.2% |
| Samoan | 8 | 0.0% |
| Scandinavian | 649 | 0.3% |
| Scotch-Irish | 2,815 | 1.5% |
| Scottish | 4,560 | 2.4% |
| Seminole | 4 | 0.0% |
| Serbian | 88 | 0.1% |
| Sioux | 3 | 0.0% |
| Slavic | 61 | 0.0% |
| Slovak | 584 | 0.3% |
| Slovene | 97 | 0.1% |
| South African | 64 | 0.0% |
| South American | 1,980 | 1.1% |
| Spaniard | 323 | 0.2% |
| Spanish | 161 | 0.1% |
| Sri Lankan | 532 | 0.3% |
| Subsaharan African | 676 | 0.4% |
| Sudanese | 34 | 0.0% |
| Swedish | 2,413 | 1.3% |
| Swiss | 339 | 0.2% |
| Syrian | 49 | 0.0% |
| Thai | 435 | 0.2% |
| Trinidadian and Tobagonian | 73 | 0.0% |
| Turkish | 57 | 0.0% |
| Ukrainian | 587 | 0.3% |
| Uruguayan | 129 | 0.1% |
| Venezuelan | 213 | 0.1% |
| Welsh | 1,058 | 0.6% |
| West Indian | 200 | 0.1% |
| Yugoslavian | 92 | 0.1% | View All 128 Rows |
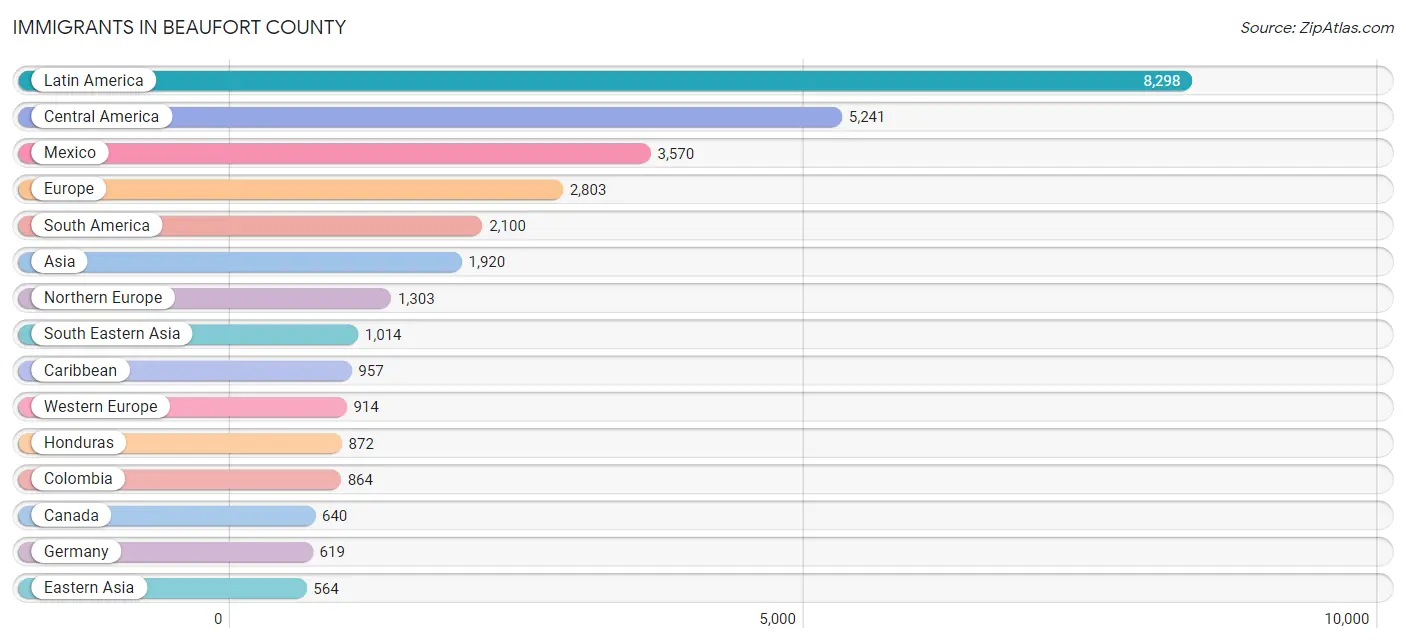
Immigrants in Beaufort County
The most numerous immigrant groups reported in Beaufort County came from Latin America (8,298 | 4.4%), Central America (5,241 | 2.8%), Mexico (3,570 | 1.9%), Europe (2,803 | 1.5%), and South America (2,100 | 1.1%), together accounting for 11.6% of all Beaufort County residents.
| Immigration Origin | # Population | % Population |
| Africa | 405 | 0.2% |
| Argentina | 237 | 0.1% |
| Asia | 1,920 | 1.0% |
| Australia | 25 | 0.0% |
| Austria | 71 | 0.0% |
| Bahamas | 62 | 0.0% |
| Barbados | 36 | 0.0% |
| Belgium | 8 | 0.0% |
| Belize | 9 | 0.0% |
| Bolivia | 355 | 0.2% |
| Brazil | 62 | 0.0% |
| Cameroon | 8 | 0.0% |
| Canada | 640 | 0.3% |
| Caribbean | 957 | 0.5% |
| Central America | 5,241 | 2.8% |
| Chile | 77 | 0.0% |
| China | 207 | 0.1% |
| Colombia | 864 | 0.5% |
| Costa Rica | 68 | 0.0% |
| Croatia | 8 | 0.0% |
| Cuba | 163 | 0.1% |
| Czechoslovakia | 39 | 0.0% |
| Denmark | 25 | 0.0% |
| Dominican Republic | 244 | 0.1% |
| Eastern Africa | 105 | 0.1% |
| Eastern Asia | 564 | 0.3% |
| Eastern Europe | 404 | 0.2% |
| Ecuador | 80 | 0.0% |
| Egypt | 6 | 0.0% |
| El Salvador | 205 | 0.1% |
| England | 364 | 0.2% |
| Ethiopia | 76 | 0.0% |
| Europe | 2,803 | 1.5% |
| France | 53 | 0.0% |
| Germany | 619 | 0.3% |
| Ghana | 18 | 0.0% |
| Greece | 10 | 0.0% |
| Guatemala | 230 | 0.1% |
| Guyana | 51 | 0.0% |
| Haiti | 26 | 0.0% |
| Honduras | 872 | 0.5% |
| Hong Kong | 23 | 0.0% |
| Hungary | 49 | 0.0% |
| India | 142 | 0.1% |
| Indonesia | 9 | 0.0% |
| Iran | 86 | 0.1% |
| Ireland | 249 | 0.1% |
| Italy | 44 | 0.0% |
| Jamaica | 365 | 0.2% |
| Japan | 261 | 0.1% |
| Korea | 96 | 0.1% |
| Latin America | 8,298 | 4.4% |
| Lithuania | 38 | 0.0% |
| Malaysia | 2 | 0.0% |
| Mexico | 3,570 | 1.9% |
| Middle Africa | 8 | 0.0% |
| Nepal | 8 | 0.0% |
| Netherlands | 148 | 0.1% |
| Nicaragua | 74 | 0.0% |
| Nigeria | 22 | 0.0% |
| Northern Africa | 40 | 0.0% |
| Northern Europe | 1,303 | 0.7% |
| Norway | 56 | 0.0% |
| Oceania | 77 | 0.0% |
| Pakistan | 32 | 0.0% |
| Panama | 114 | 0.1% |
| Peru | 19 | 0.0% |
| Philippines | 495 | 0.3% |
| Poland | 46 | 0.0% |
| Portugal | 31 | 0.0% |
| Romania | 121 | 0.1% |
| Russia | 26 | 0.0% |
| Saudi Arabia | 7 | 0.0% |
| Scotland | 128 | 0.1% |
| Serbia | 9 | 0.0% |
| Singapore | 12 | 0.0% |
| South Africa | 96 | 0.1% |
| South America | 2,100 | 1.1% |
| South Central Asia | 268 | 0.1% |
| South Eastern Asia | 1,014 | 0.5% |
| Southern Europe | 162 | 0.1% |
| Spain | 77 | 0.0% |
| Sudan | 34 | 0.0% |
| Sweden | 43 | 0.0% |
| Switzerland | 15 | 0.0% |
| Taiwan | 29 | 0.0% |
| Thailand | 10 | 0.0% |
| Trinidad and Tobago | 61 | 0.0% |
| Turkey | 67 | 0.0% |
| Uganda | 20 | 0.0% |
| Ukraine | 17 | 0.0% |
| Uruguay | 183 | 0.1% |
| Venezuela | 143 | 0.1% |
| Vietnam | 486 | 0.3% |
| Western Africa | 66 | 0.0% |
| Western Asia | 74 | 0.0% |
| Western Europe | 914 | 0.5% |
| Zimbabwe | 9 | 0.0% | View All 98 Rows |
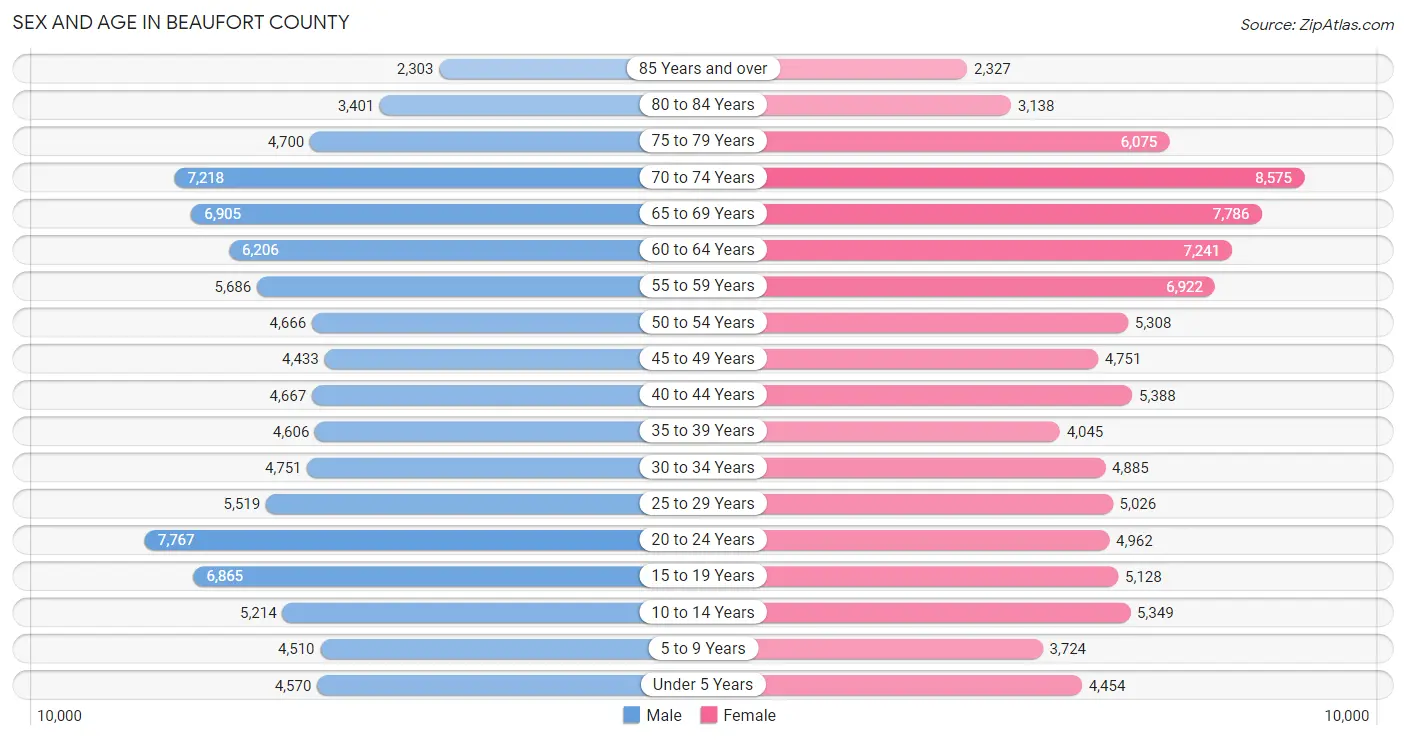
Sex and Age in Beaufort County
Sex and Age in Beaufort County
The most populous age groups in Beaufort County are 20 to 24 Years (7,767 | 8.3%) for men and 70 to 74 Years (8,575 | 9.0%) for women.
| Age Bracket | Male | Female |
| Under 5 Years | 4,570 (4.9%) | 4,454 (4.7%) |
| 5 to 9 Years | 4,510 (4.8%) | 3,724 (3.9%) |
| 10 to 14 Years | 5,214 (5.6%) | 5,349 (5.6%) |
| 15 to 19 Years | 6,865 (7.3%) | 5,128 (5.4%) |
| 20 to 24 Years | 7,767 (8.3%) | 4,962 (5.2%) |
| 25 to 29 Years | 5,519 (5.9%) | 5,026 (5.3%) |
| 30 to 34 Years | 4,751 (5.1%) | 4,885 (5.1%) |
| 35 to 39 Years | 4,606 (4.9%) | 4,045 (4.3%) |
| 40 to 44 Years | 4,667 (5.0%) | 5,388 (5.7%) |
| 45 to 49 Years | 4,433 (4.7%) | 4,751 (5.0%) |
| 50 to 54 Years | 4,666 (5.0%) | 5,308 (5.6%) |
| 55 to 59 Years | 5,686 (6.0%) | 6,922 (7.3%) |
| 60 to 64 Years | 6,206 (6.6%) | 7,241 (7.6%) |
| 65 to 69 Years | 6,905 (7.3%) | 7,786 (8.2%) |
| 70 to 74 Years | 7,218 (7.7%) | 8,575 (9.0%) |
| 75 to 79 Years | 4,700 (5.0%) | 6,075 (6.4%) |
| 80 to 84 Years | 3,401 (3.6%) | 3,138 (3.3%) |
| 85 Years and over | 2,303 (2.5%) | 2,327 (2.5%) |
| Total | 93,987 (100.0%) | 95,084 (100.0%) |
Families and Households in Beaufort County
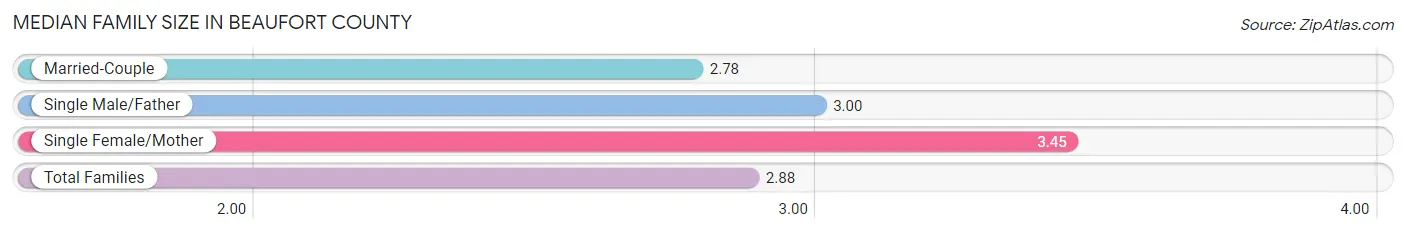
Median Family Size in Beaufort County
The median family size in Beaufort County is 2.88 persons per family, with single female/mother families (7,095 | 13.5%) accounting for the largest median family size of 3.45 persons per family. On the other hand, married-couple families (43,213 | 82.2%) represent the smallest median family size with 2.78 persons per family.
| Family Type | # Families | Family Size |
| Married-Couple | 43,213 (82.2%) | 2.78 |
| Single Male/Father | 2,278 (4.3%) | 3.00 |
| Single Female/Mother | 7,095 (13.5%) | 3.45 |
| Total Families | 52,586 (100.0%) | 2.88 |
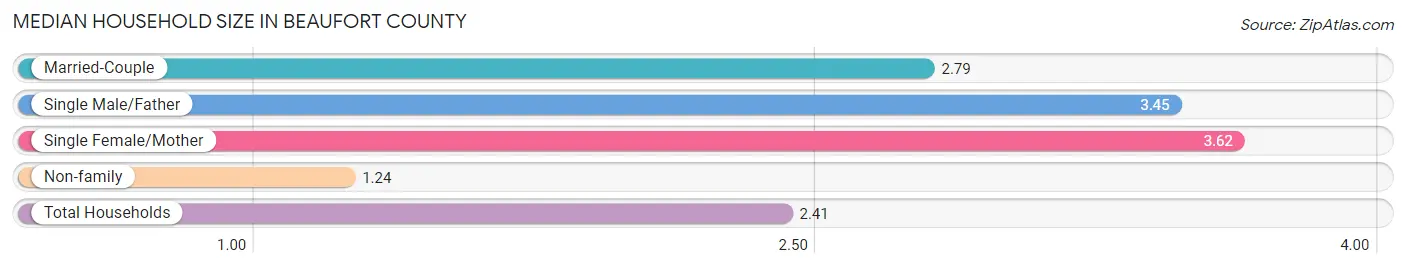
Median Household Size in Beaufort County
The median household size in Beaufort County is 2.41 persons per household, with single female/mother households (7,095 | 9.3%) accounting for the largest median household size of 3.62 persons per household. non-family households (23,527 | 30.9%) represent the smallest median household size with 1.24 persons per household.
| Household Type | # Households | Household Size |
| Married-Couple | 43,213 (56.8%) | 2.79 |
| Single Male/Father | 2,278 (3.0%) | 3.45 |
| Single Female/Mother | 7,095 (9.3%) | 3.62 |
| Non-family | 23,527 (30.9%) | 1.24 |
| Total Households | 76,113 (100.0%) | 2.41 |
Household Size by Marriage Status in Beaufort County
Out of a total of 76,113 households in Beaufort County, 52,586 (69.1%) are family households, while 23,527 (30.9%) are nonfamily households. The most numerous type of family households are 2-person households, comprising 31,569, and the most common type of nonfamily households are 1-person households, comprising 19,559.
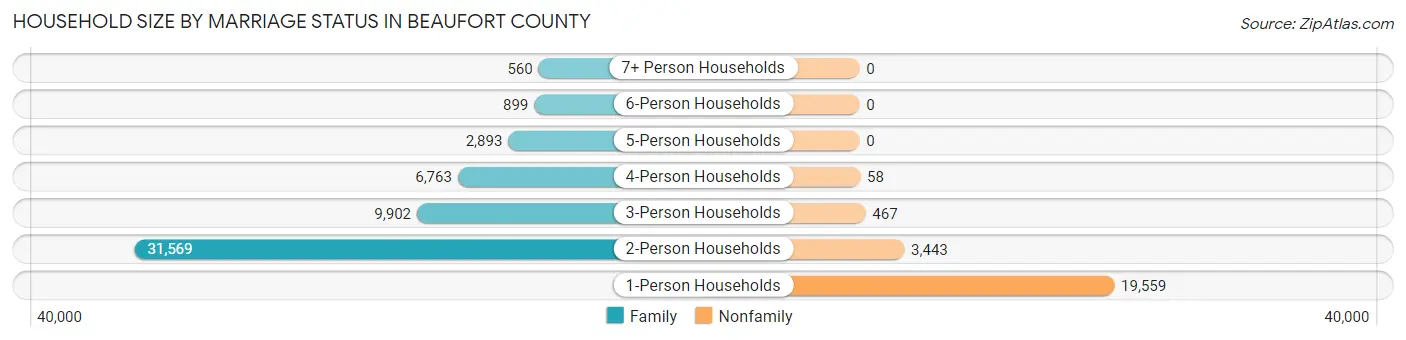
| Household Size | Family Households | Nonfamily Households |
| 1-Person Households | - | 19,559 (25.7%) |
| 2-Person Households | 31,569 (41.5%) | 3,443 (4.5%) |
| 3-Person Households | 9,902 (13.0%) | 467 (0.6%) |
| 4-Person Households | 6,763 (8.9%) | 58 (0.1%) |
| 5-Person Households | 2,893 (3.8%) | 0 (0.0%) |
| 6-Person Households | 899 (1.2%) | 0 (0.0%) |
| 7+ Person Households | 560 (0.7%) | 0 (0.0%) |
| Total | 52,586 (69.1%) | 23,527 (30.9%) |
Female Fertility in Beaufort County
Fertility by Age in Beaufort County
Average fertility rate in Beaufort County is 42.0 births per 1,000 women. Women in the age bracket of 20 to 34 years have the highest fertility rate with 73.0 births per 1,000 women. Women in the age bracket of 20 to 34 years acount for 72.7% of all women with births.
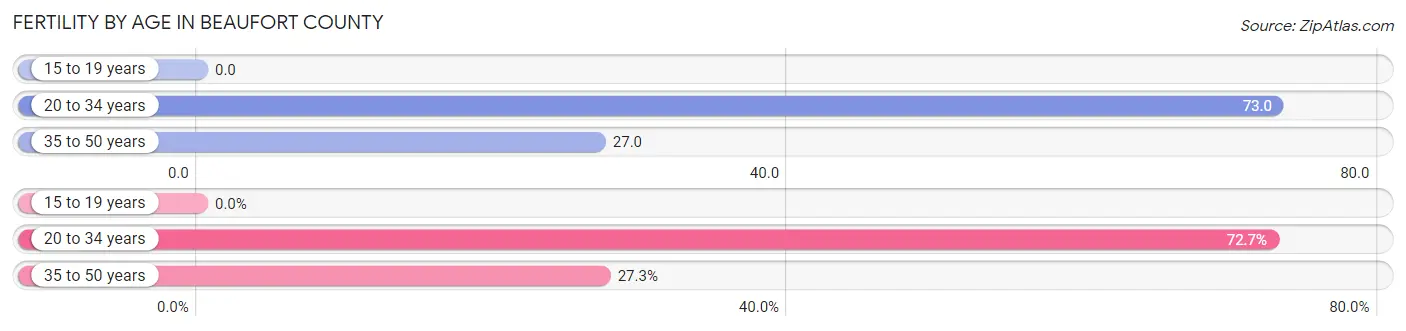
| Age Bracket | Women with Births | Births / 1,000 Women |
| 15 to 19 years | 0 (0.0%) | 0.0 |
| 20 to 34 years | 1,093 (72.7%) | 73.0 |
| 35 to 50 years | 411 (27.3%) | 27.0 |
| Total | 1,504 (100.0%) | 42.0 |
Fertility by Age by Marriage Status in Beaufort County
74.6% of women with births (1,504) in Beaufort County are married. The highest percentage of unmarried women with births falls into 20 to 34 years age bracket with 33.6% of them unmarried at the time of birth, while the lowest percentage of unmarried women with births belong to 35 to 50 years age bracket with 3.6% of them unmarried.
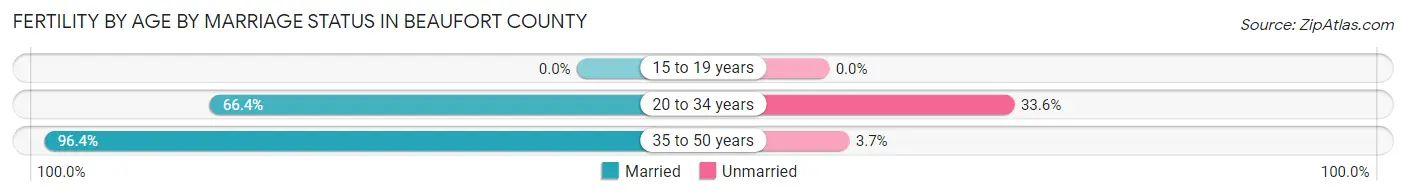
| Age Bracket | Married | Unmarried |
| 15 to 19 years | 0 (0.0%) | 0 (0.0%) |
| 20 to 34 years | 726 (66.4%) | 367 (33.6%) |
| 35 to 50 years | 396 (96.4%) | 15 (3.6%) |
| Total | 1,122 (74.6%) | 382 (25.4%) |
Fertility by Education in Beaufort County
Average fertility rate in Beaufort County is 42.0 births per 1,000 women. Women with the education attainment of college or associate's degree have the highest fertility rate of 67.0 births per 1,000 women, while women with the education attainment of high school diploma have the lowest fertility at 20.0 births per 1,000 women. Women with the education attainment of college or associate's degree represent 49.5% of all women with births.
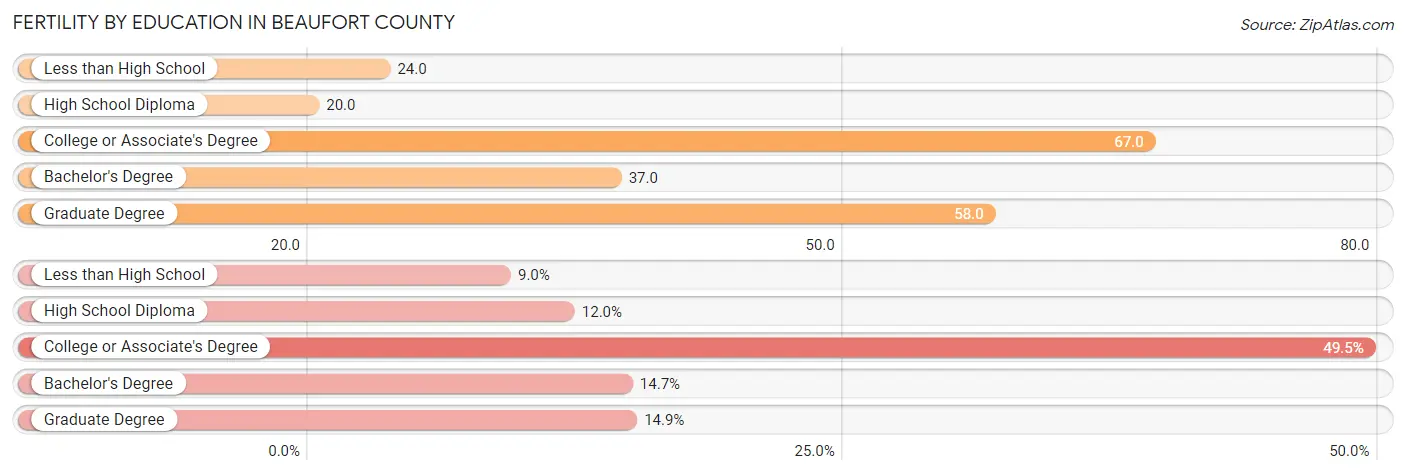
| Educational Attainment | Women with Births | Births / 1,000 Women |
| Less than High School | 135 (9.0%) | 24.0 |
| High School Diploma | 180 (12.0%) | 20.0 |
| College or Associate's Degree | 744 (49.5%) | 67.0 |
| Bachelor's Degree | 221 (14.7%) | 37.0 |
| Graduate Degree | 224 (14.9%) | 58.0 |
| Total | 1,504 (100.0%) | 42.0 |
Fertility by Education by Marriage Status in Beaufort County
25.4% of women with births in Beaufort County are unmarried. Women with the educational attainment of bachelor's degree are most likely to be married with 100.0% of them married at childbirth, while women with the educational attainment of high school diploma are least likely to be married with 53.9% of them unmarried at childbirth.
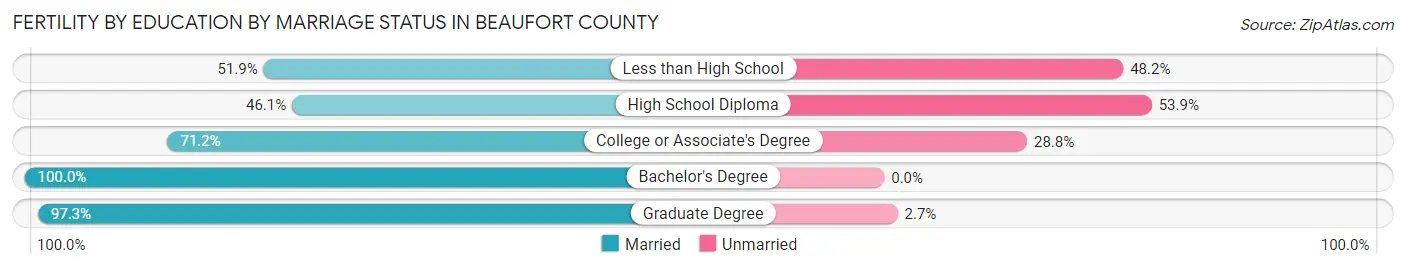
| Educational Attainment | Married | Unmarried |
| Less than High School | 70 (51.8%) | 65 (48.1%) |
| High School Diploma | 83 (46.1%) | 97 (53.9%) |
| College or Associate's Degree | 530 (71.2%) | 214 (28.8%) |
| Bachelor's Degree | 221 (100.0%) | 0 (0.0%) |
| Graduate Degree | 218 (97.3%) | 6 (2.7%) |
| Total | 1,122 (74.6%) | 382 (25.4%) |
Employment Characteristics in Beaufort County
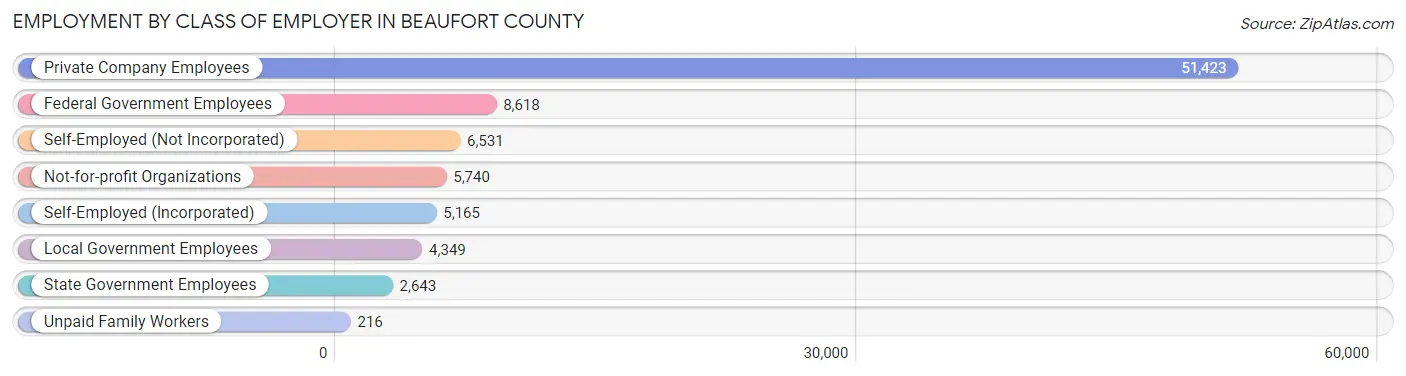
Employment by Class of Employer in Beaufort County
Among the 84,685 employed individuals in Beaufort County, private company employees (51,423 | 60.7%), federal government employees (8,618 | 10.2%), and self-employed (not incorporated) (6,531 | 7.7%) make up the most common classes of employment.
| Employer Class | # Employees | % Employees |
| Private Company Employees | 51,423 | 60.7% |
| Self-Employed (Incorporated) | 5,165 | 6.1% |
| Self-Employed (Not Incorporated) | 6,531 | 7.7% |
| Not-for-profit Organizations | 5,740 | 6.8% |
| Local Government Employees | 4,349 | 5.1% |
| State Government Employees | 2,643 | 3.1% |
| Federal Government Employees | 8,618 | 10.2% |
| Unpaid Family Workers | 216 | 0.3% |
| Total | 84,685 | 100.0% |
Employment Status by Age in Beaufort County
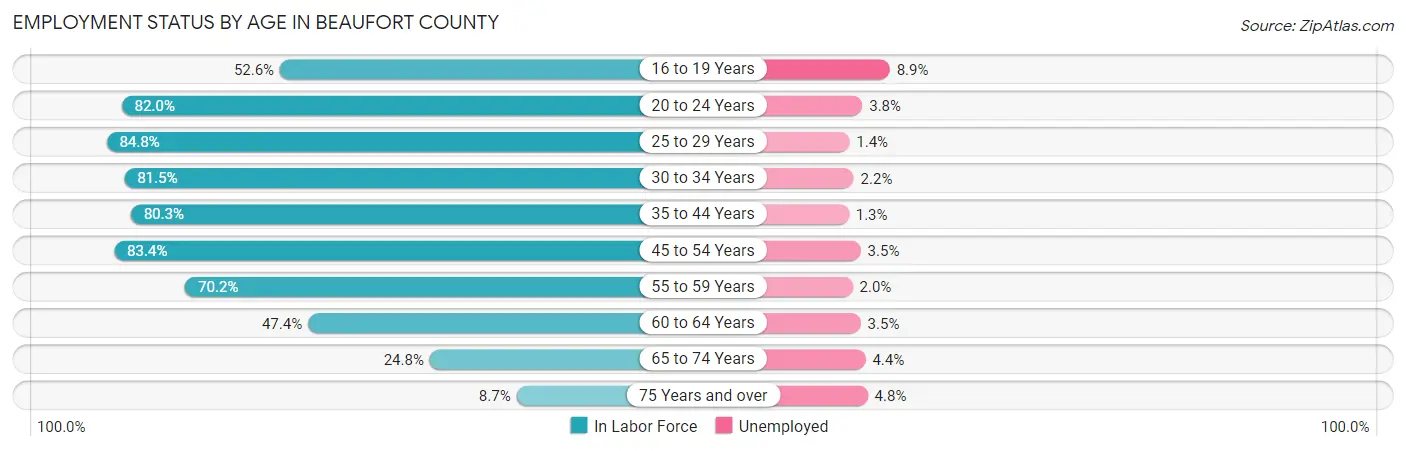
According to the labor force statistics for Beaufort County, out of the total population over 16 years of age (159,786), 55.4% or 88,521 individuals are in the labor force, with 3.1% or 2,744 of them unemployed. The age group with the highest labor force participation rate is 25 to 29 years, with 84.8% or 8,942 individuals in the labor force. Within the labor force, the 16 to 19 years age range has the highest percentage of unemployed individuals, with 8.9% or 493 of them being unemployed.
| Age Bracket | In Labor Force | Unemployed |
| 16 to 19 Years | 5,538 (52.6%) | 493 (8.9%) |
| 20 to 24 Years | 10,438 (82.0%) | 397 (3.8%) |
| 25 to 29 Years | 8,942 (84.8%) | 125 (1.4%) |
| 30 to 34 Years | 7,853 (81.5%) | 173 (2.2%) |
| 35 to 44 Years | 15,021 (80.3%) | 195 (1.3%) |
| 45 to 54 Years | 15,978 (83.4%) | 559 (3.5%) |
| 55 to 59 Years | 8,851 (70.2%) | 177 (2.0%) |
| 60 to 64 Years | 6,374 (47.4%) | 223 (3.5%) |
| 65 to 74 Years | 7,560 (24.8%) | 333 (4.4%) |
| 75 Years and over | 1,909 (8.7%) | 92 (4.8%) |
| Total | 88,521 (55.4%) | 2,744 (3.1%) |
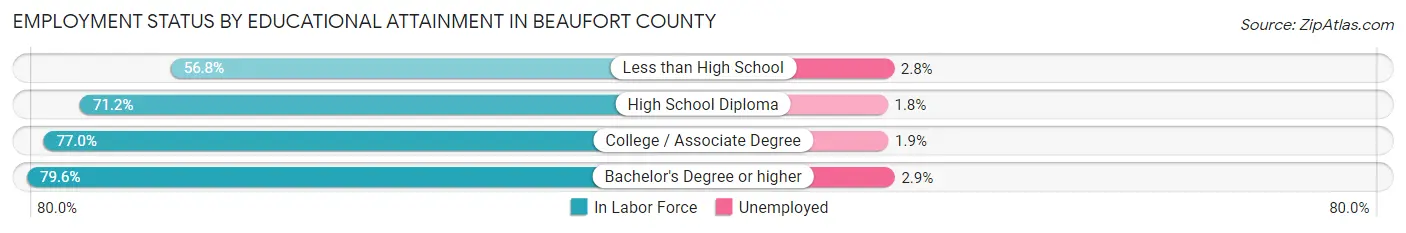
Employment Status by Educational Attainment in Beaufort County
According to labor force statistics for Beaufort County, 74.9% of individuals (62,991) out of the total population between 25 and 64 years of age (84,100) are in the labor force, with 2.3% or 1,449 of them being unemployed. The group with the highest labor force participation rate are those with the educational attainment of bachelor's degree or higher, with 79.6% or 24,381 individuals in the labor force. Within the labor force, individuals with bachelor's degree or higher education have the highest percentage of unemployment, with 2.9% or 707 of them being unemployed.
| Educational Attainment | In Labor Force | Unemployed |
| Less than High School | 3,615 (56.8%) | 178 (2.8%) |
| High School Diploma | 15,156 (71.2%) | 383 (1.8%) |
| College / Associate Degree | 19,881 (77.0%) | 491 (1.9%) |
| Bachelor's Degree or higher | 24,381 (79.6%) | 888 (2.9%) |
| Total | 62,991 (74.9%) | 1,934 (2.3%) |
Employment Occupations by Sex in Beaufort County
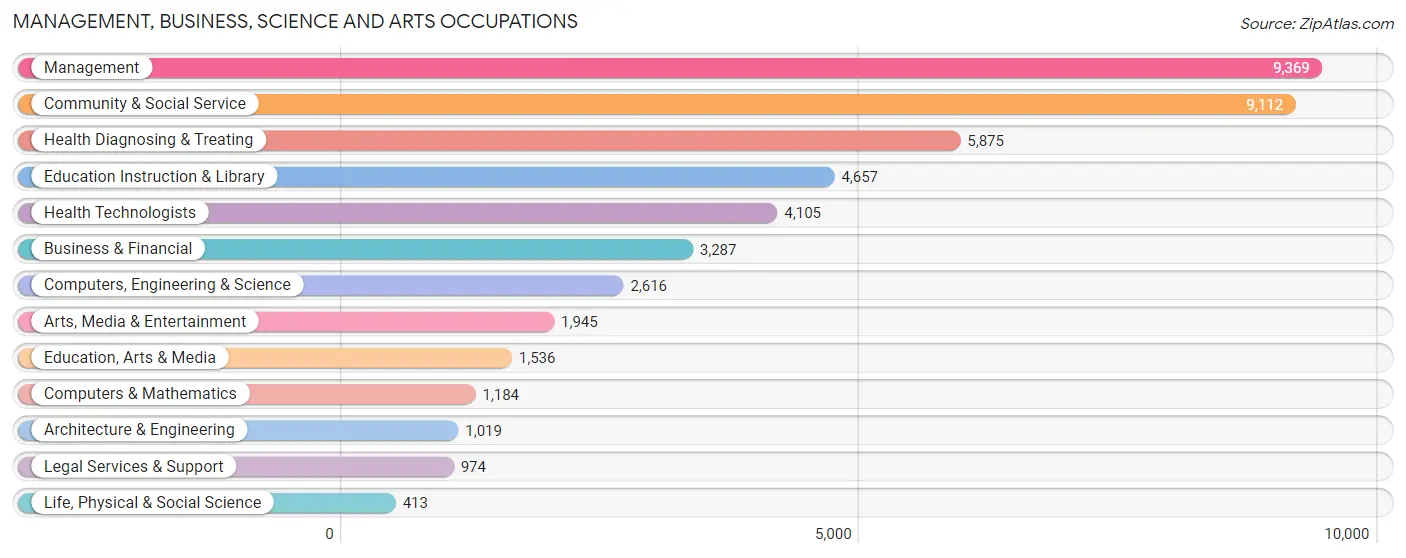
Management, Business, Science and Arts Occupations
The most common Management, Business, Science and Arts occupations in Beaufort County are Management (9,369 | 11.8%), Community & Social Service (9,112 | 11.5%), Health Diagnosing & Treating (5,875 | 7.4%), Education Instruction & Library (4,657 | 5.9%), and Health Technologists (4,105 | 5.2%).
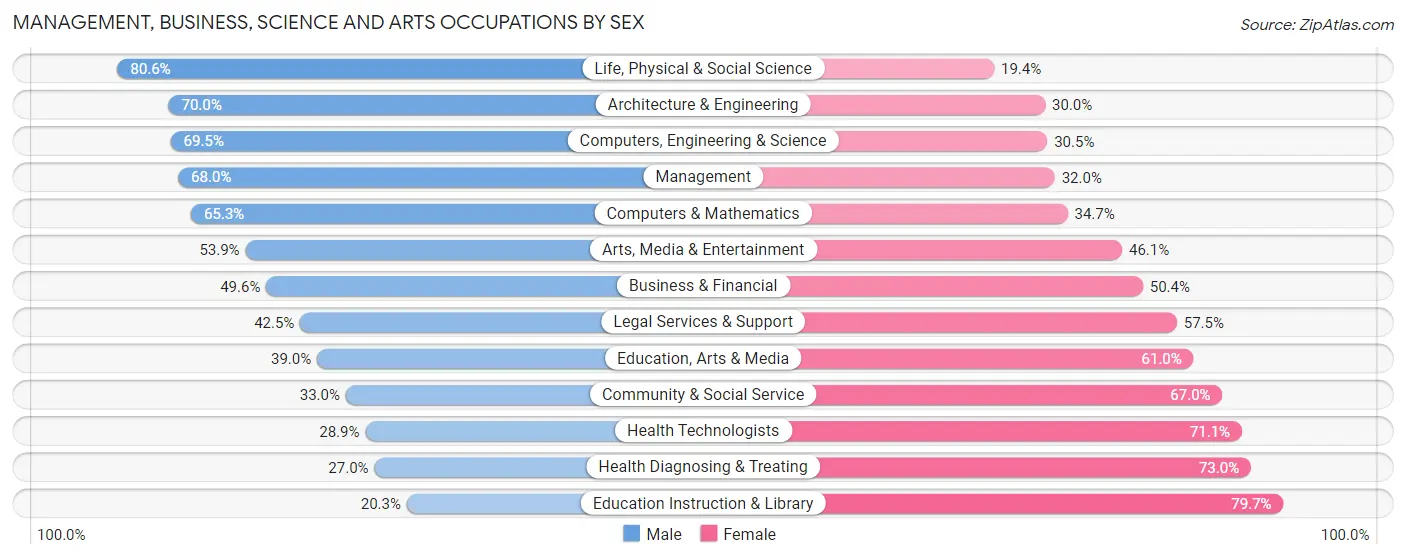
Management, Business, Science and Arts Occupations by Sex
Within the Management, Business, Science and Arts occupations in Beaufort County, the most male-oriented occupations are Life, Physical & Social Science (80.6%), Architecture & Engineering (70.0%), and Computers, Engineering & Science (69.5%), while the most female-oriented occupations are Education Instruction & Library (79.7%), Health Diagnosing & Treating (73.0%), and Health Technologists (71.1%).
| Occupation | Male | Female |
| Management | 6,368 (68.0%) | 3,001 (32.0%) |
| Business & Financial | 1,630 (49.6%) | 1,657 (50.4%) |
| Computers, Engineering & Science | 1,819 (69.5%) | 797 (30.5%) |
| Computers & Mathematics | 773 (65.3%) | 411 (34.7%) |
| Architecture & Engineering | 713 (70.0%) | 306 (30.0%) |
| Life, Physical & Social Science | 333 (80.6%) | 80 (19.4%) |
| Community & Social Service | 3,006 (33.0%) | 6,106 (67.0%) |
| Education, Arts & Media | 599 (39.0%) | 937 (61.0%) |
| Legal Services & Support | 414 (42.5%) | 560 (57.5%) |
| Education Instruction & Library | 944 (20.3%) | 3,713 (79.7%) |
| Arts, Media & Entertainment | 1,049 (53.9%) | 896 (46.1%) |
| Health Diagnosing & Treating | 1,588 (27.0%) | 4,287 (73.0%) |
| Health Technologists | 1,187 (28.9%) | 2,918 (71.1%) |
| Total (Category) | 14,411 (47.6%) | 15,848 (52.4%) |
| Total (Overall) | 42,665 (53.6%) | 36,863 (46.4%) |
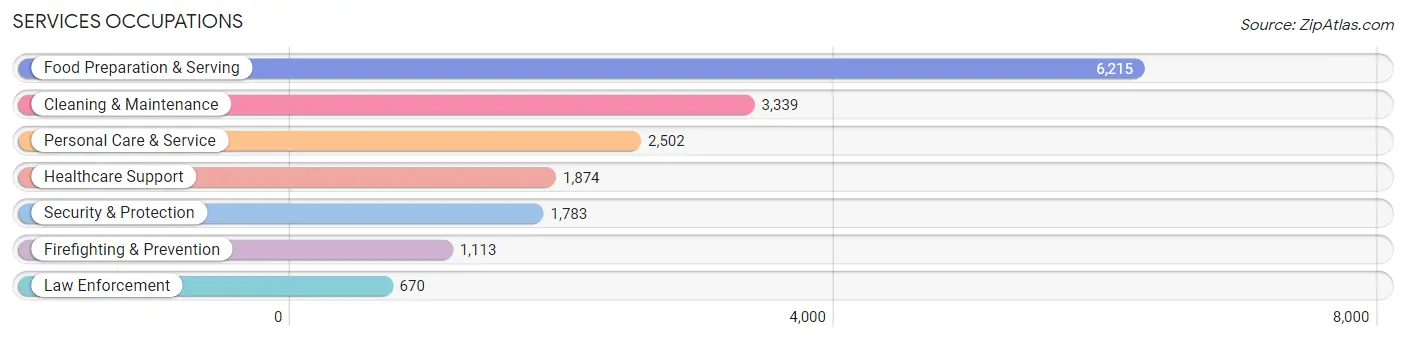
Services Occupations
The most common Services occupations in Beaufort County are Food Preparation & Serving (6,215 | 7.8%), Cleaning & Maintenance (3,339 | 4.2%), Personal Care & Service (2,502 | 3.2%), Healthcare Support (1,874 | 2.4%), and Security & Protection (1,783 | 2.2%).
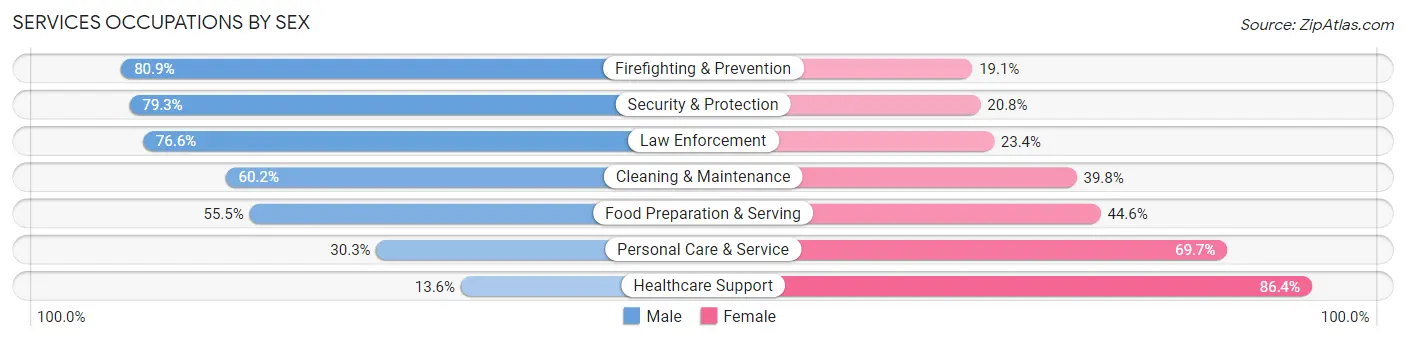
Services Occupations by Sex
Within the Services occupations in Beaufort County, the most male-oriented occupations are Firefighting & Prevention (80.9%), Security & Protection (79.2%), and Law Enforcement (76.6%), while the most female-oriented occupations are Healthcare Support (86.4%), Personal Care & Service (69.7%), and Food Preparation & Serving (44.6%).
| Occupation | Male | Female |
| Healthcare Support | 255 (13.6%) | 1,619 (86.4%) |
| Security & Protection | 1,413 (79.2%) | 370 (20.7%) |
| Firefighting & Prevention | 900 (80.9%) | 213 (19.1%) |
| Law Enforcement | 513 (76.6%) | 157 (23.4%) |
| Food Preparation & Serving | 3,446 (55.4%) | 2,769 (44.6%) |
| Cleaning & Maintenance | 2,010 (60.2%) | 1,329 (39.8%) |
| Personal Care & Service | 759 (30.3%) | 1,743 (69.7%) |
| Total (Category) | 7,883 (50.2%) | 7,830 (49.8%) |
| Total (Overall) | 42,665 (53.6%) | 36,863 (46.4%) |
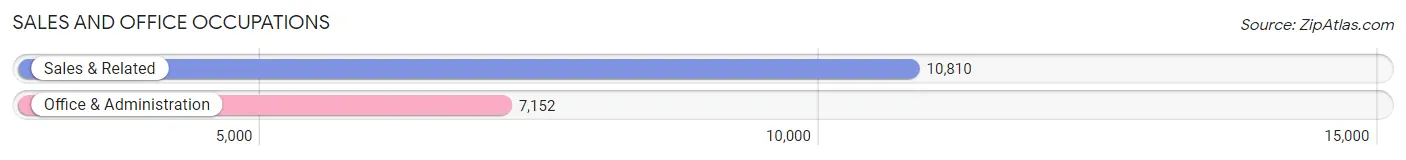
Sales and Office Occupations
The most common Sales and Office occupations in Beaufort County are Sales & Related (10,810 | 13.6%), and Office & Administration (7,152 | 9.0%).
Sales and Office Occupations by Sex
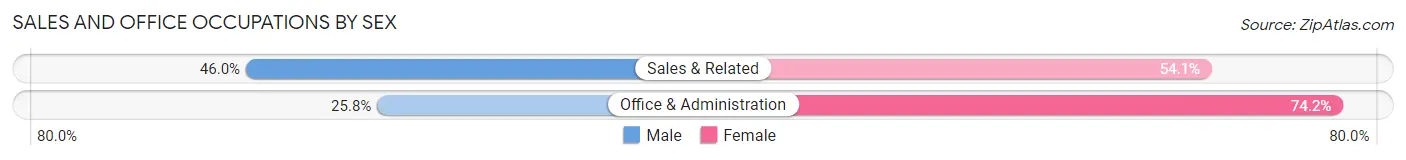
| Occupation | Male | Female |
| Sales & Related | 4,967 (46.0%) | 5,843 (54.0%) |
| Office & Administration | 1,842 (25.8%) | 5,310 (74.2%) |
| Total (Category) | 6,809 (37.9%) | 11,153 (62.1%) |
| Total (Overall) | 42,665 (53.6%) | 36,863 (46.4%) |
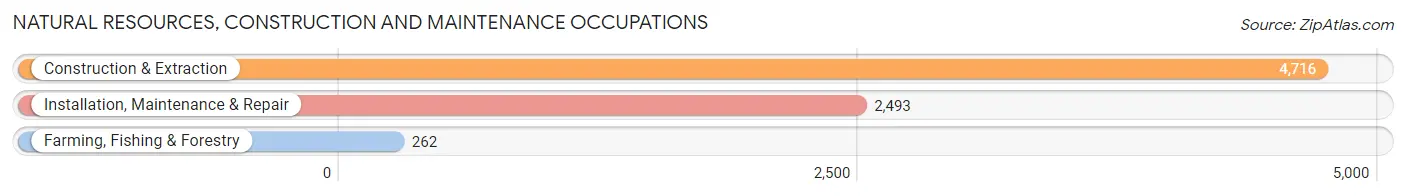
Natural Resources, Construction and Maintenance Occupations
The most common Natural Resources, Construction and Maintenance occupations in Beaufort County are Construction & Extraction (4,716 | 5.9%), Installation, Maintenance & Repair (2,493 | 3.1%), and Farming, Fishing & Forestry (262 | 0.3%).
Natural Resources, Construction and Maintenance Occupations by Sex
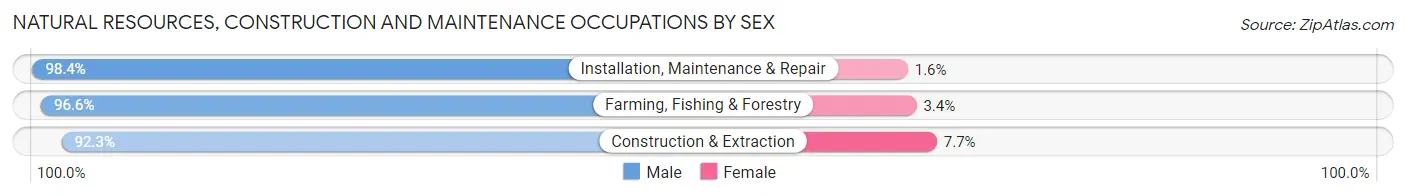
| Occupation | Male | Female |
| Farming, Fishing & Forestry | 253 (96.6%) | 9 (3.4%) |
| Construction & Extraction | 4,354 (92.3%) | 362 (7.7%) |
| Installation, Maintenance & Repair | 2,452 (98.4%) | 41 (1.6%) |
| Total (Category) | 7,059 (94.5%) | 412 (5.5%) |
| Total (Overall) | 42,665 (53.6%) | 36,863 (46.4%) |
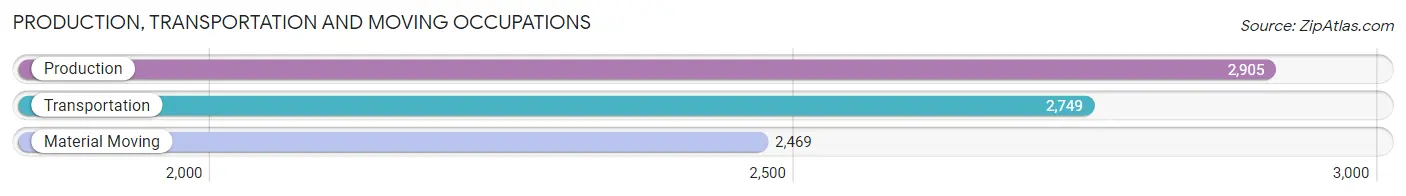
Production, Transportation and Moving Occupations
The most common Production, Transportation and Moving occupations in Beaufort County are Production (2,905 | 3.6%), Transportation (2,749 | 3.5%), and Material Moving (2,469 | 3.1%).
Production, Transportation and Moving Occupations by Sex
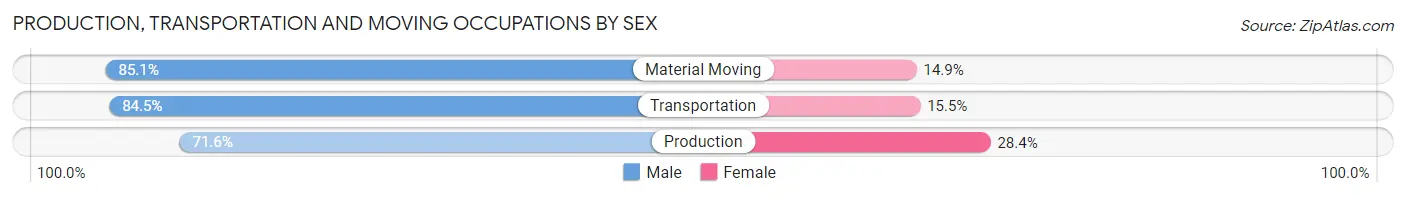
| Occupation | Male | Female |
| Production | 2,079 (71.6%) | 826 (28.4%) |
| Transportation | 2,322 (84.5%) | 427 (15.5%) |
| Material Moving | 2,102 (85.1%) | 367 (14.9%) |
| Total (Category) | 6,503 (80.1%) | 1,620 (19.9%) |
| Total (Overall) | 42,665 (53.6%) | 36,863 (46.4%) |
Employment Industries by Sex in Beaufort County
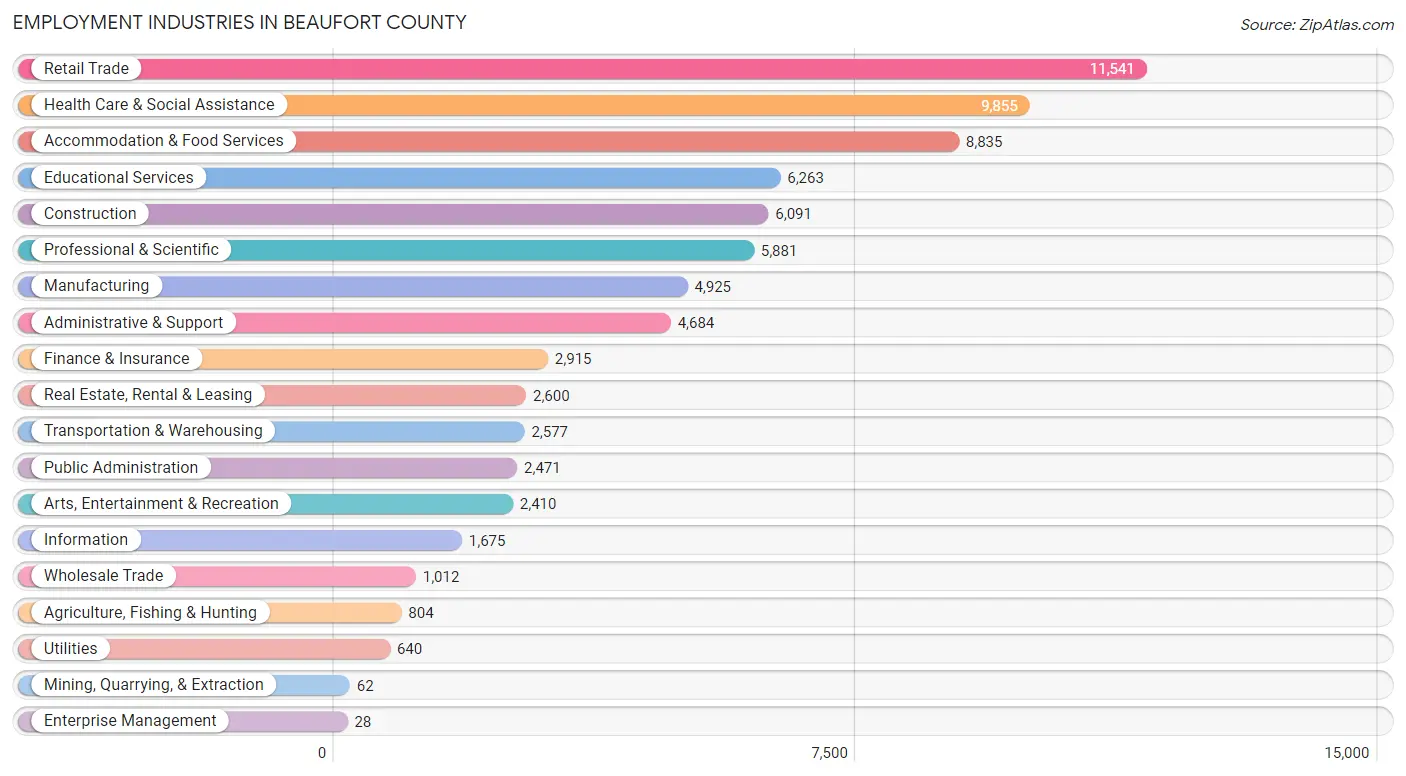
Employment Industries in Beaufort County
The major employment industries in Beaufort County include Retail Trade (11,541 | 14.5%), Health Care & Social Assistance (9,855 | 12.4%), Accommodation & Food Services (8,835 | 11.1%), Educational Services (6,263 | 7.9%), and Construction (6,091 | 7.7%).
Employment Industries by Sex in Beaufort County
The Beaufort County industries that see more men than women are Mining, Quarrying, & Extraction (100.0%), Enterprise Management (100.0%), and Construction (86.5%), whereas the industries that tend to have a higher number of women are Health Care & Social Assistance (76.8%), Educational Services (74.7%), and Real Estate, Rental & Leasing (55.7%).
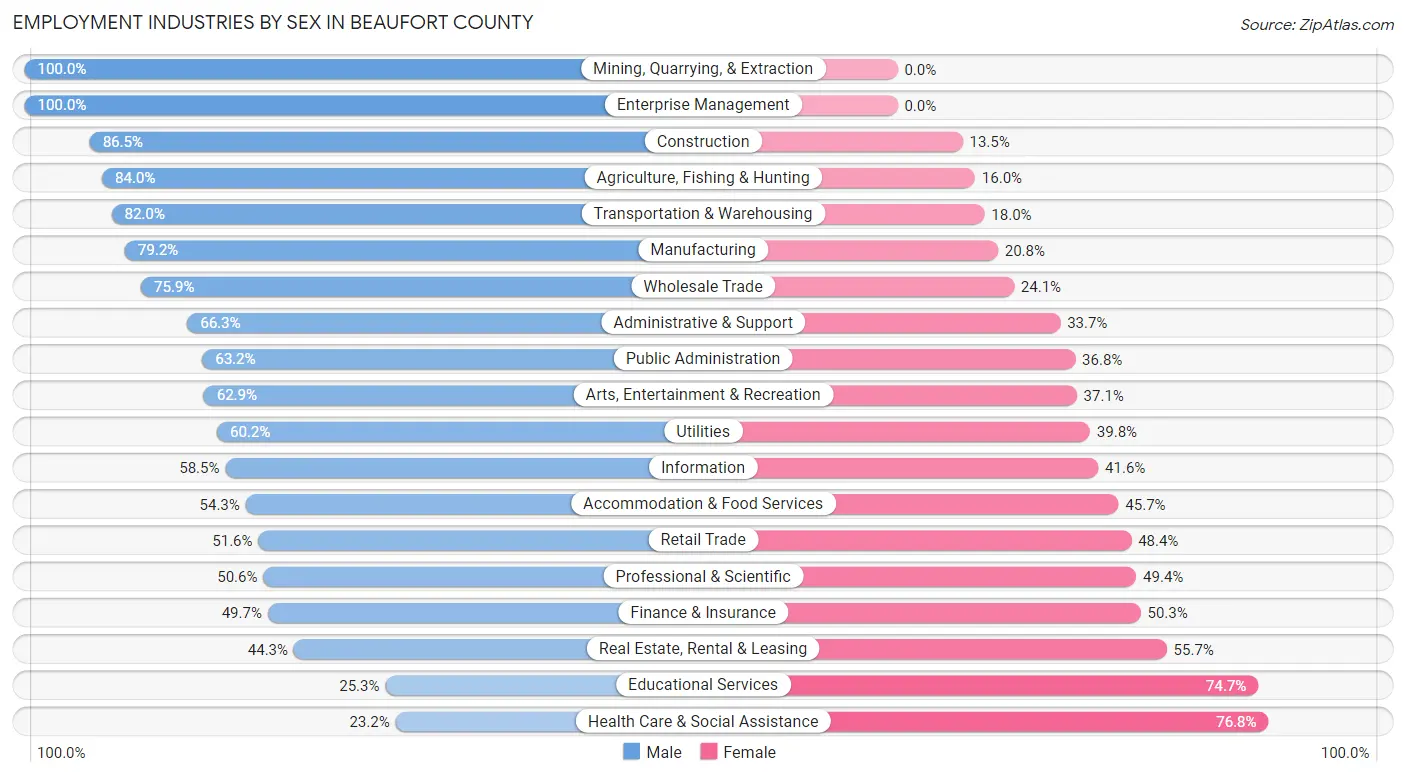
| Industry | Male | Female |
| Agriculture, Fishing & Hunting | 675 (84.0%) | 129 (16.0%) |
| Mining, Quarrying, & Extraction | 62 (100.0%) | 0 (0.0%) |
| Construction | 5,270 (86.5%) | 821 (13.5%) |
| Manufacturing | 3,902 (79.2%) | 1,023 (20.8%) |
| Wholesale Trade | 768 (75.9%) | 244 (24.1%) |
| Retail Trade | 5,956 (51.6%) | 5,585 (48.4%) |
| Transportation & Warehousing | 2,113 (82.0%) | 464 (18.0%) |
| Utilities | 385 (60.2%) | 255 (39.8%) |
| Information | 979 (58.5%) | 696 (41.5%) |
| Finance & Insurance | 1,448 (49.7%) | 1,467 (50.3%) |
| Real Estate, Rental & Leasing | 1,151 (44.3%) | 1,449 (55.7%) |
| Professional & Scientific | 2,975 (50.6%) | 2,906 (49.4%) |
| Enterprise Management | 28 (100.0%) | 0 (0.0%) |
| Administrative & Support | 3,106 (66.3%) | 1,578 (33.7%) |
| Educational Services | 1,587 (25.3%) | 4,676 (74.7%) |
| Health Care & Social Assistance | 2,289 (23.2%) | 7,566 (76.8%) |
| Arts, Entertainment & Recreation | 1,516 (62.9%) | 894 (37.1%) |
| Accommodation & Food Services | 4,794 (54.3%) | 4,041 (45.7%) |
| Public Administration | 1,562 (63.2%) | 909 (36.8%) |
| Total | 42,665 (53.6%) | 36,863 (46.4%) |
Education in Beaufort County
School Enrollment in Beaufort County
The most common levels of schooling among the 34,538 students in Beaufort County are high school (8,197 | 23.7%), middle school (8,135 | 23.5%), and college / undergraduate (6,691 | 19.4%).
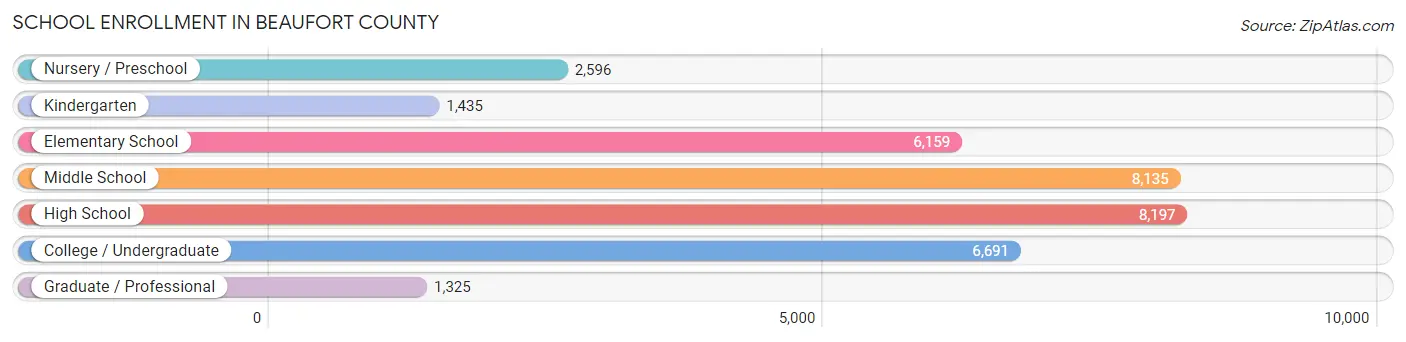
| School Level | # Students | % Students |
| Nursery / Preschool | 2,596 | 7.5% |
| Kindergarten | 1,435 | 4.2% |
| Elementary School | 6,159 | 17.8% |
| Middle School | 8,135 | 23.5% |
| High School | 8,197 | 23.7% |
| College / Undergraduate | 6,691 | 19.4% |
| Graduate / Professional | 1,325 | 3.8% |
| Total | 34,538 | 100.0% |
School Enrollment by Age by Funding Source in Beaufort County
Out of a total of 34,538 students who are enrolled in schools in Beaufort County, 6,424 (18.6%) attend a private institution, while the remaining 28,114 (81.4%) are enrolled in public schools. The age group of 35 years and over has the highest likelihood of being enrolled in private schools, with 738 (33.0% in the age bracket) enrolled. Conversely, the age group of 18 to 19 year olds has the lowest likelihood of being enrolled in a private school, with 3,213 (86.4% in the age bracket) attending a public institution.
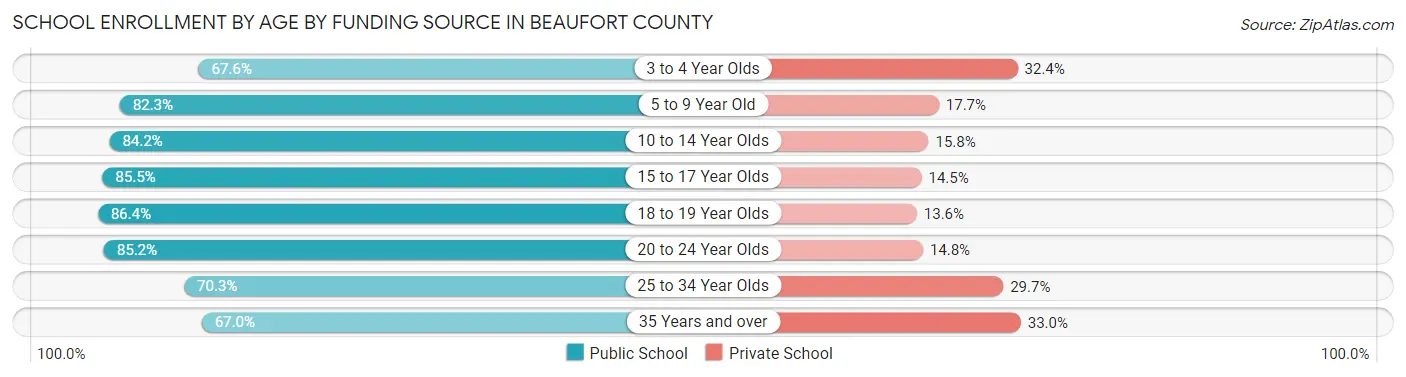
| Age Bracket | Public School | Private School |
| 3 to 4 Year Olds | 1,406 (67.6%) | 674 (32.4%) |
| 5 to 9 Year Old | 6,065 (82.3%) | 1,307 (17.7%) |
| 10 to 14 Year Olds | 8,367 (84.2%) | 1,571 (15.8%) |
| 15 to 17 Year Olds | 4,612 (85.5%) | 782 (14.5%) |
| 18 to 19 Year Olds | 3,213 (86.4%) | 507 (13.6%) |
| 20 to 24 Year Olds | 1,696 (85.2%) | 294 (14.8%) |
| 25 to 34 Year Olds | 1,270 (70.3%) | 537 (29.7%) |
| 35 Years and over | 1,499 (67.0%) | 738 (33.0%) |
| Total | 28,114 (81.4%) | 6,424 (18.6%) |
Educational Attainment by Field of Study in Beaufort County
Business (14,295 | 22.5%), education (9,647 | 15.2%), science & technology (6,039 | 9.5%), social sciences (5,800 | 9.1%), and engineering (4,256 | 6.7%) are the most common fields of study among 63,616 individuals in Beaufort County who have obtained a bachelor's degree or higher.
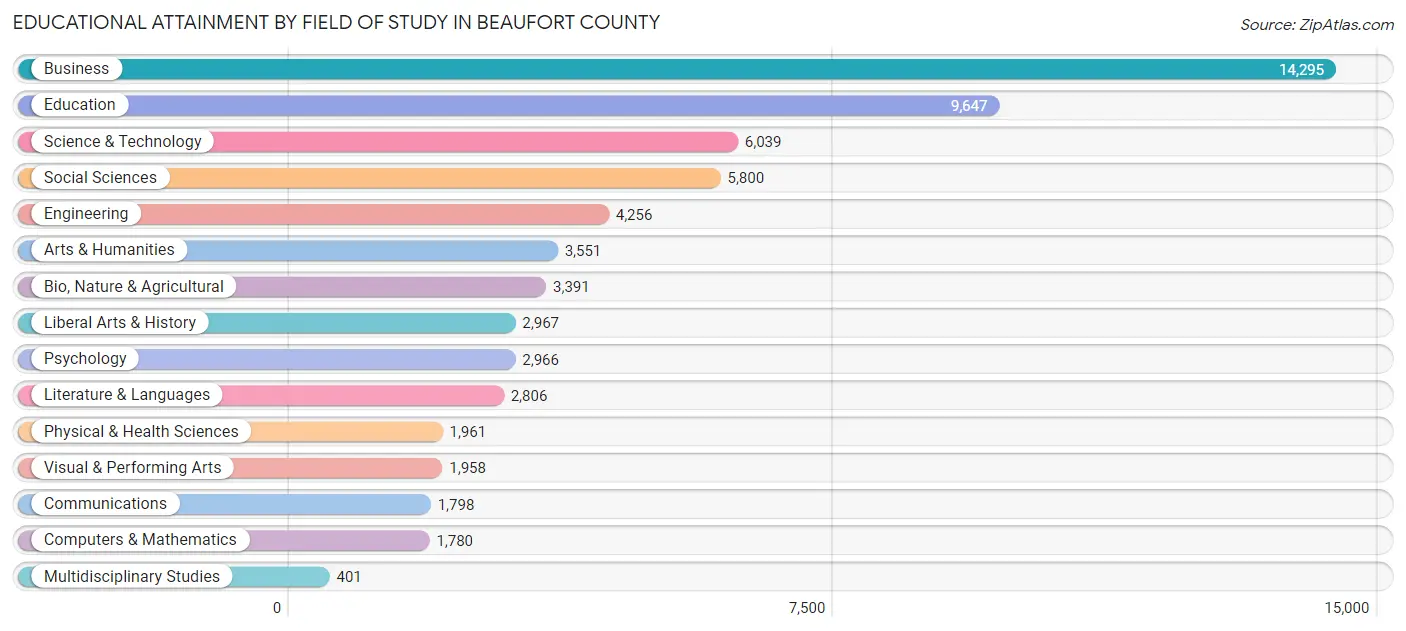
| Field of Study | # Graduates | % Graduates |
| Computers & Mathematics | 1,780 | 2.8% |
| Bio, Nature & Agricultural | 3,391 | 5.3% |
| Physical & Health Sciences | 1,961 | 3.1% |
| Psychology | 2,966 | 4.7% |
| Social Sciences | 5,800 | 9.1% |
| Engineering | 4,256 | 6.7% |
| Multidisciplinary Studies | 401 | 0.6% |
| Science & Technology | 6,039 | 9.5% |
| Business | 14,295 | 22.5% |
| Education | 9,647 | 15.2% |
| Literature & Languages | 2,806 | 4.4% |
| Liberal Arts & History | 2,967 | 4.7% |
| Visual & Performing Arts | 1,958 | 3.1% |
| Communications | 1,798 | 2.8% |
| Arts & Humanities | 3,551 | 5.6% |
| Total | 63,616 | 100.0% |
Transportation & Commute in Beaufort County
Vehicle Availability by Sex in Beaufort County
The most prevalent vehicle ownership categories in Beaufort County are males with 2 vehicles (21,617, accounting for 49.1%) and females with 2 vehicles (17,093, making up 59.2%).
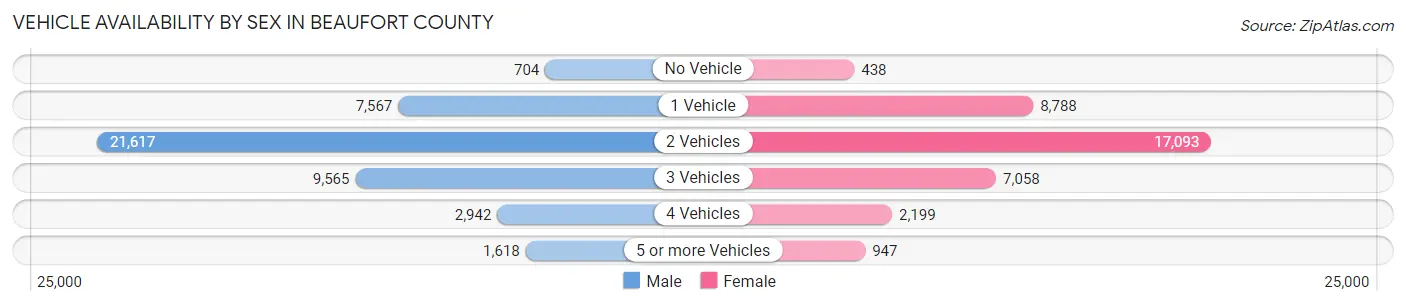
| Vehicles Available | Male | Female |
| No Vehicle | 704 (1.6%) | 438 (1.2%) |
| 1 Vehicle | 7,567 (17.2%) | 8,788 (24.1%) |
| 2 Vehicles | 21,617 (49.1%) | 17,093 (46.8%) |
| 3 Vehicles | 9,565 (21.7%) | 7,058 (19.3%) |
| 4 Vehicles | 2,942 (6.7%) | 2,199 (6.0%) |
| 5 or more Vehicles | 1,618 (3.7%) | 947 (2.6%) |
| Total | 44,013 (100.0%) | 36,523 (100.0%) |
Commute Time in Beaufort County
The most frequently occuring commute durations in Beaufort County are 30 to 34 minutes (13,821 commuters, 18.3%), 15 to 19 minutes (13,595 commuters, 18.0%), and 10 to 14 minutes (10,977 commuters, 14.6%).
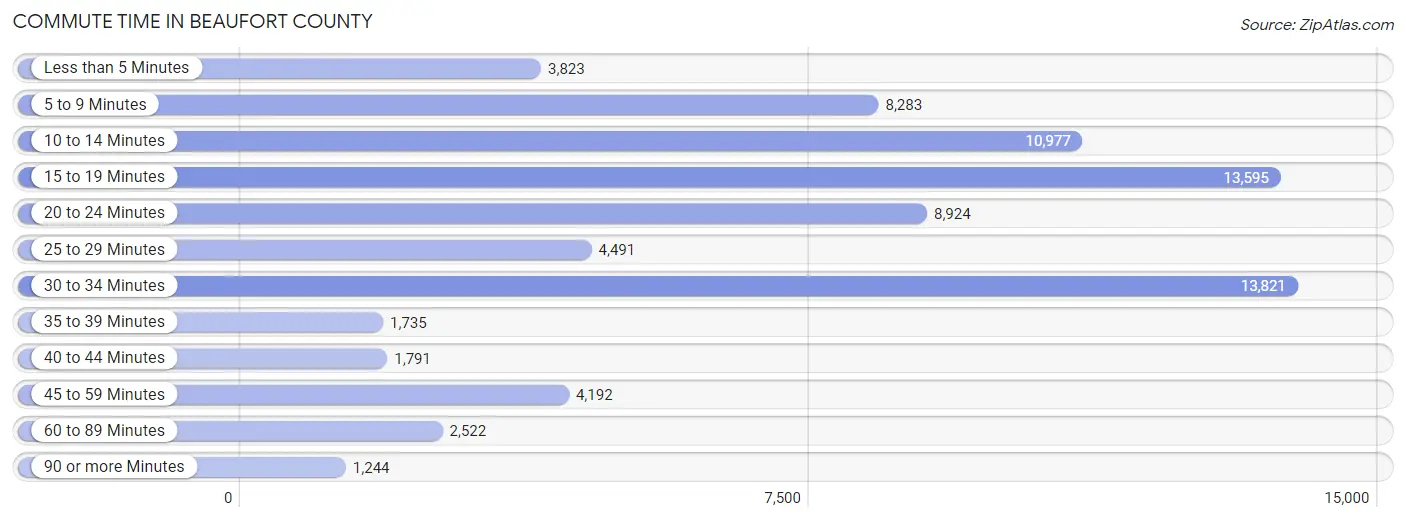
| Commute Time | # Commuters | % Commuters |
| Less than 5 Minutes | 3,823 | 5.1% |
| 5 to 9 Minutes | 8,283 | 11.0% |
| 10 to 14 Minutes | 10,977 | 14.6% |
| 15 to 19 Minutes | 13,595 | 18.0% |
| 20 to 24 Minutes | 8,924 | 11.8% |
| 25 to 29 Minutes | 4,491 | 6.0% |
| 30 to 34 Minutes | 13,821 | 18.3% |
| 35 to 39 Minutes | 1,735 | 2.3% |
| 40 to 44 Minutes | 1,791 | 2.4% |
| 45 to 59 Minutes | 4,192 | 5.6% |
| 60 to 89 Minutes | 2,522 | 3.3% |
| 90 or more Minutes | 1,244 | 1.7% |
Commute Time by Sex in Beaufort County
The most common commute times in Beaufort County are 30 to 34 minutes (8,006 commuters, 18.8%) for males and 15 to 19 minutes (5,894 commuters, 18.0%) for females.
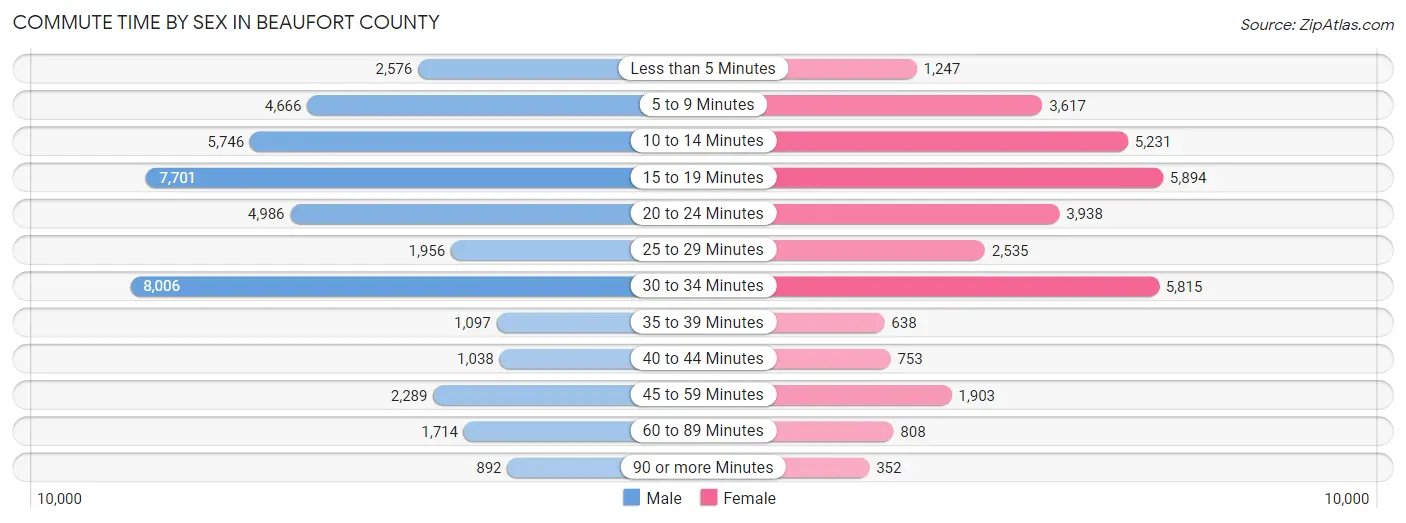
| Commute Time | Male | Female |
| Less than 5 Minutes | 2,576 (6.0%) | 1,247 (3.8%) |
| 5 to 9 Minutes | 4,666 (10.9%) | 3,617 (11.1%) |
| 10 to 14 Minutes | 5,746 (13.5%) | 5,231 (16.0%) |
| 15 to 19 Minutes | 7,701 (18.0%) | 5,894 (18.0%) |
| 20 to 24 Minutes | 4,986 (11.7%) | 3,938 (12.0%) |
| 25 to 29 Minutes | 1,956 (4.6%) | 2,535 (7.7%) |
| 30 to 34 Minutes | 8,006 (18.8%) | 5,815 (17.8%) |
| 35 to 39 Minutes | 1,097 (2.6%) | 638 (1.9%) |
| 40 to 44 Minutes | 1,038 (2.4%) | 753 (2.3%) |
| 45 to 59 Minutes | 2,289 (5.4%) | 1,903 (5.8%) |
| 60 to 89 Minutes | 1,714 (4.0%) | 808 (2.5%) |
| 90 or more Minutes | 892 (2.1%) | 352 (1.1%) |
Time of Departure to Work by Sex in Beaufort County
The most frequent times of departure to work in Beaufort County are 6:30 AM to 6:59 AM (6,476, 15.2%) for males and 7:30 AM to 7:59 AM (5,572, 17.0%) for females.
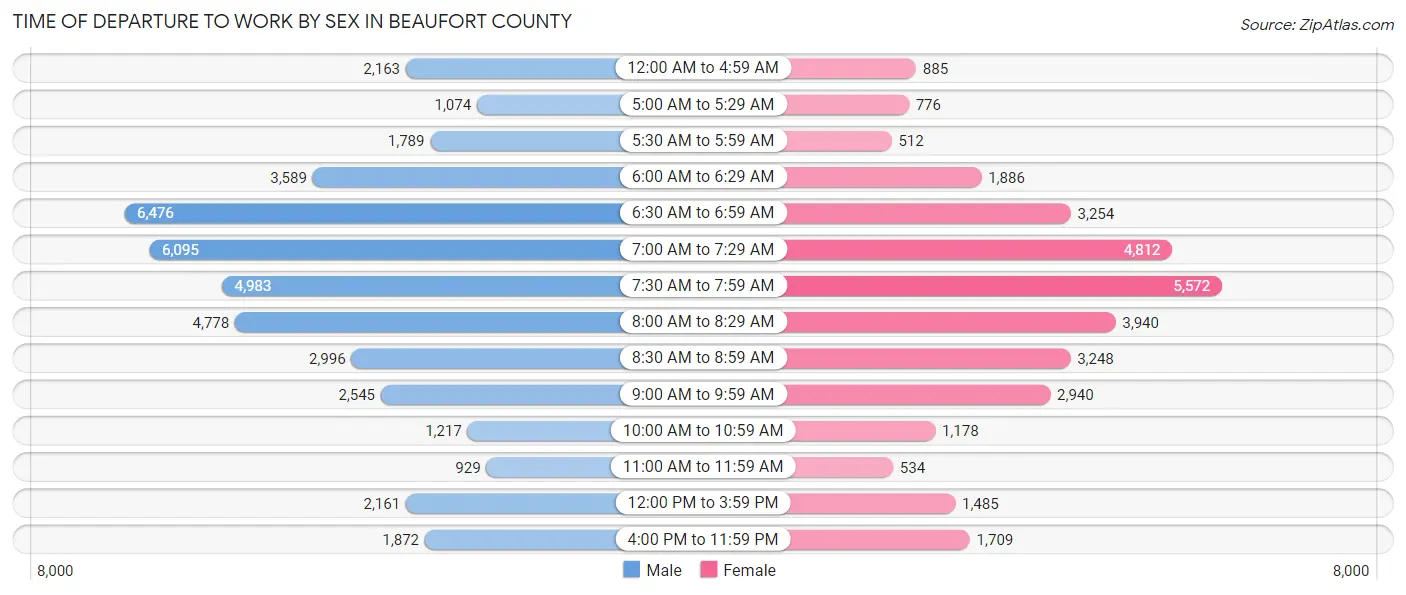
| Time of Departure | Male | Female |
| 12:00 AM to 4:59 AM | 2,163 (5.1%) | 885 (2.7%) |
| 5:00 AM to 5:29 AM | 1,074 (2.5%) | 776 (2.4%) |
| 5:30 AM to 5:59 AM | 1,789 (4.2%) | 512 (1.6%) |
| 6:00 AM to 6:29 AM | 3,589 (8.4%) | 1,886 (5.8%) |
| 6:30 AM to 6:59 AM | 6,476 (15.2%) | 3,254 (9.9%) |
| 7:00 AM to 7:29 AM | 6,095 (14.3%) | 4,812 (14.7%) |
| 7:30 AM to 7:59 AM | 4,983 (11.7%) | 5,572 (17.0%) |
| 8:00 AM to 8:29 AM | 4,778 (11.2%) | 3,940 (12.0%) |
| 8:30 AM to 8:59 AM | 2,996 (7.0%) | 3,248 (9.9%) |
| 9:00 AM to 9:59 AM | 2,545 (6.0%) | 2,940 (9.0%) |
| 10:00 AM to 10:59 AM | 1,217 (2.9%) | 1,178 (3.6%) |
| 11:00 AM to 11:59 AM | 929 (2.2%) | 534 (1.6%) |
| 12:00 PM to 3:59 PM | 2,161 (5.1%) | 1,485 (4.5%) |
| 4:00 PM to 11:59 PM | 1,872 (4.4%) | 1,709 (5.2%) |
| Total | 42,667 (100.0%) | 32,731 (100.0%) |
Housing Occupancy in Beaufort County
Occupancy by Ownership in Beaufort County
Of the total 76,113 dwellings in Beaufort County, owner-occupied units account for 57,501 (75.5%), while renter-occupied units make up 18,612 (24.4%).
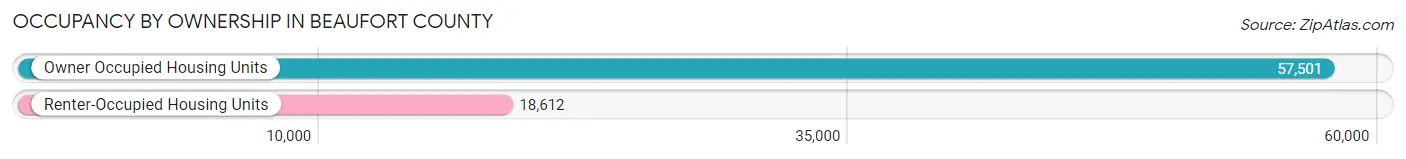
| Occupancy | # Housing Units | % Housing Units |
| Owner Occupied Housing Units | 57,501 | 75.5% |
| Renter-Occupied Housing Units | 18,612 | 24.4% |
| Total Occupied Housing Units | 76,113 | 100.0% |
Occupancy by Household Size in Beaufort County
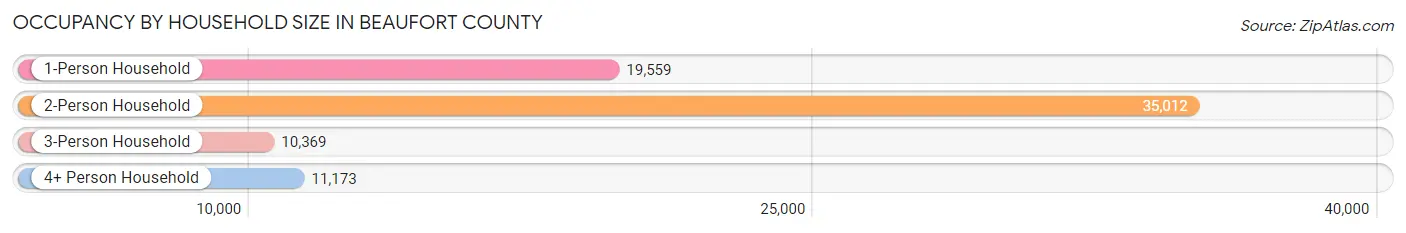
| Household Size | # Housing Units | % Housing Units |
| 1-Person Household | 19,559 | 25.7% |
| 2-Person Household | 35,012 | 46.0% |
| 3-Person Household | 10,369 | 13.6% |
| 4+ Person Household | 11,173 | 14.7% |
| Total Housing Units | 76,113 | 100.0% |
Occupancy by Ownership by Household Size in Beaufort County
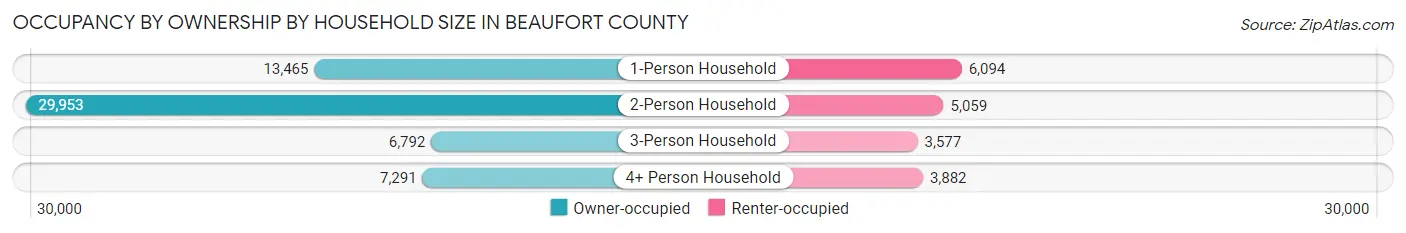
| Household Size | Owner-occupied | Renter-occupied |
| 1-Person Household | 13,465 (68.8%) | 6,094 (31.2%) |
| 2-Person Household | 29,953 (85.6%) | 5,059 (14.4%) |
| 3-Person Household | 6,792 (65.5%) | 3,577 (34.5%) |
| 4+ Person Household | 7,291 (65.3%) | 3,882 (34.7%) |
| Total Housing Units | 57,501 (75.5%) | 18,612 (24.4%) |
Occupancy by Educational Attainment in Beaufort County
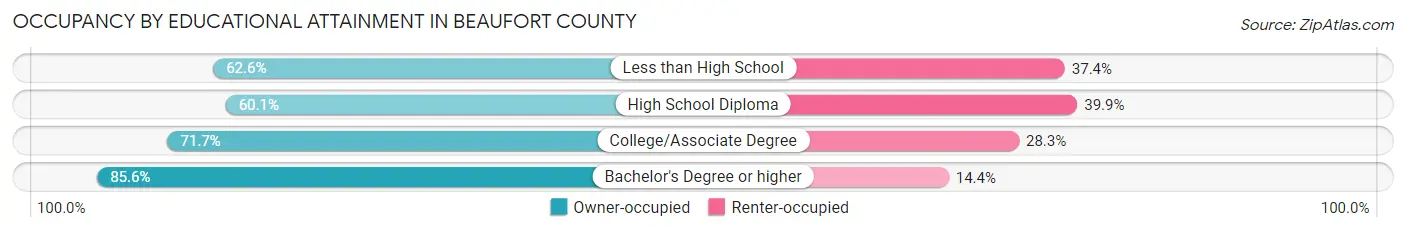
| Household Size | Owner-occupied | Renter-occupied |
| Less than High School | 2,439 (62.6%) | 1,458 (37.4%) |
| High School Diploma | 8,595 (60.1%) | 5,702 (39.9%) |
| College/Associate Degree | 16,030 (71.7%) | 6,332 (28.3%) |
| Bachelor's Degree or higher | 30,437 (85.6%) | 5,120 (14.4%) |
Occupancy by Age of Householder in Beaufort County
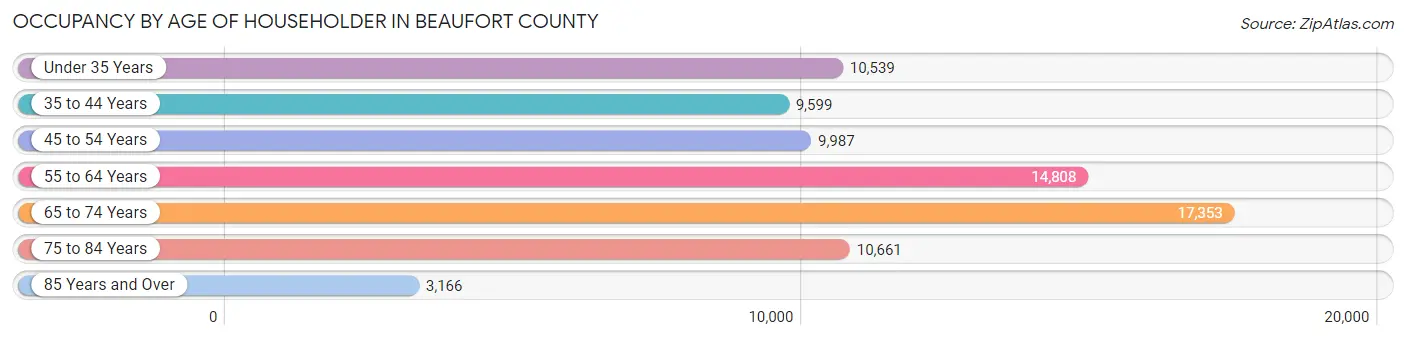
| Age Bracket | # Households | % Households |
| Under 35 Years | 10,539 | 13.9% |
| 35 to 44 Years | 9,599 | 12.6% |
| 45 to 54 Years | 9,987 | 13.1% |
| 55 to 64 Years | 14,808 | 19.5% |
| 65 to 74 Years | 17,353 | 22.8% |
| 75 to 84 Years | 10,661 | 14.0% |
| 85 Years and Over | 3,166 | 4.2% |
| Total | 76,113 | 100.0% |
Housing Finances in Beaufort County
Median Income by Occupancy in Beaufort County
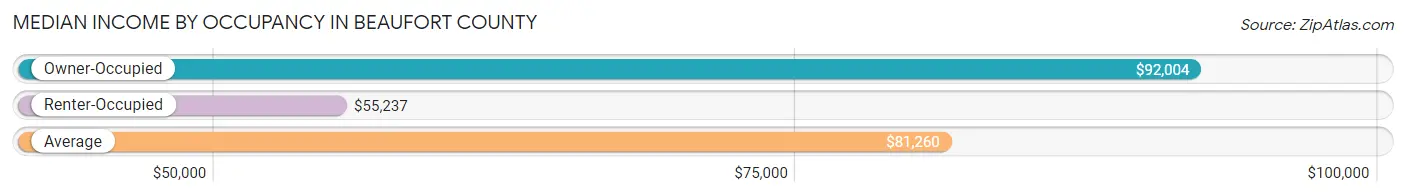
| Occupancy Type | # Households | Median Income |
| Owner-Occupied | 57,501 (75.5%) | $92,004 |
| Renter-Occupied | 18,612 (24.4%) | $55,237 |
| Average | 76,113 (100.0%) | $81,260 |
Occupancy by Householder Income Bracket in Beaufort County
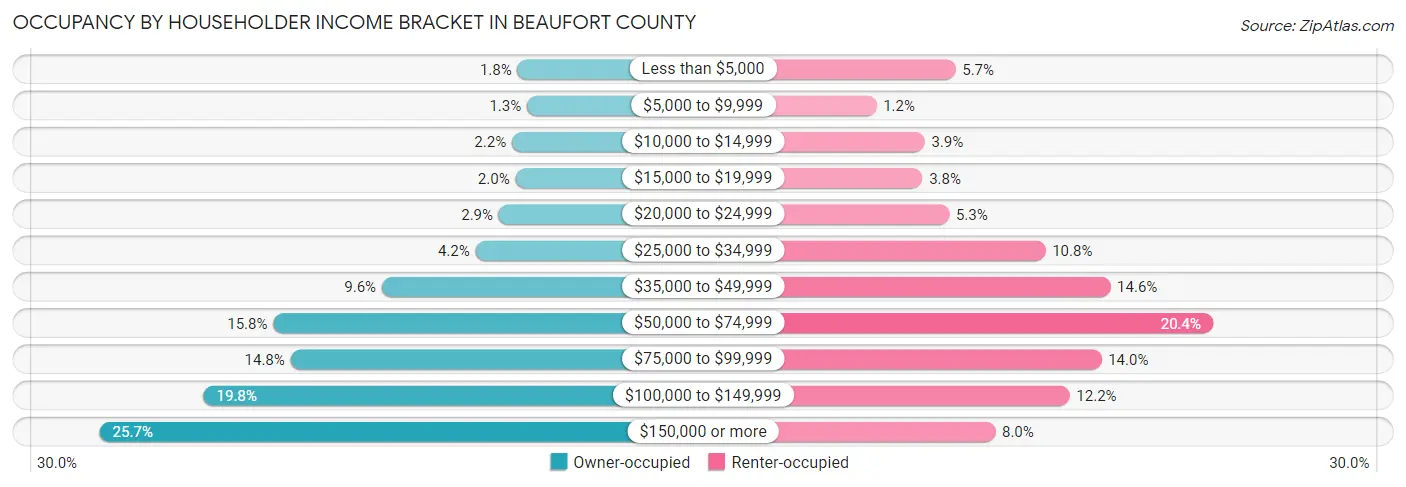
| Income Bracket | Owner-occupied | Renter-occupied |
| Less than $5,000 | 1,055 (1.8%) | 1,061 (5.7%) |
| $5,000 to $9,999 | 742 (1.3%) | 219 (1.2%) |
| $10,000 to $14,999 | 1,234 (2.1%) | 733 (3.9%) |
| $15,000 to $19,999 | 1,120 (1.9%) | 710 (3.8%) |
| $20,000 to $24,999 | 1,667 (2.9%) | 993 (5.3%) |
| $25,000 to $34,999 | 2,434 (4.2%) | 2,017 (10.8%) |
| $35,000 to $49,999 | 5,506 (9.6%) | 2,708 (14.5%) |
| $50,000 to $74,999 | 9,077 (15.8%) | 3,799 (20.4%) |
| $75,000 to $99,999 | 8,512 (14.8%) | 2,614 (14.0%) |
| $100,000 to $149,999 | 11,369 (19.8%) | 2,275 (12.2%) |
| $150,000 or more | 14,785 (25.7%) | 1,483 (8.0%) |
| Total | 57,501 (100.0%) | 18,612 (100.0%) |
Monthly Housing Cost Tiers in Beaufort County
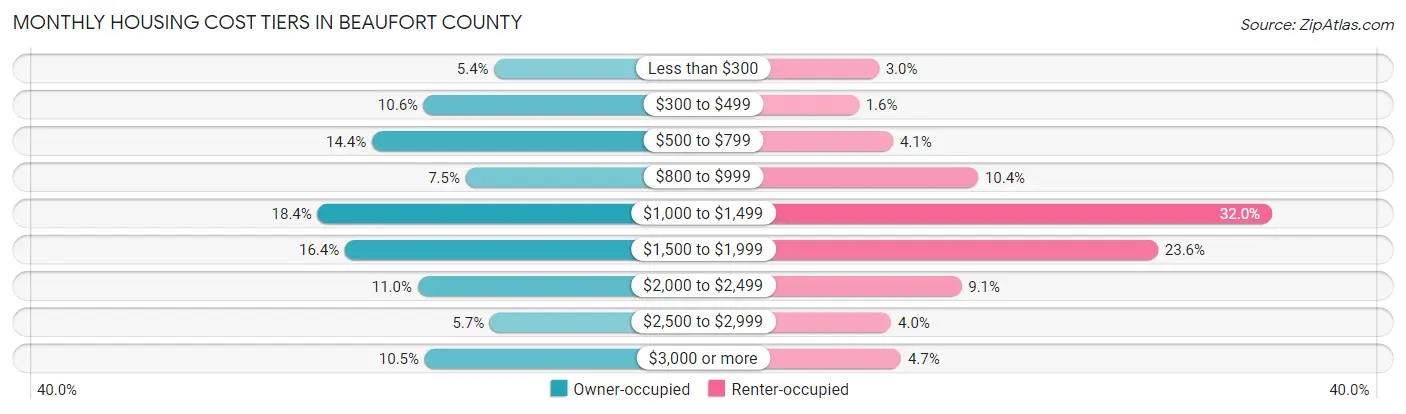
| Monthly Cost | Owner-occupied | Renter-occupied |
| Less than $300 | 3,104 (5.4%) | 565 (3.0%) |
| $300 to $499 | 6,088 (10.6%) | 292 (1.6%) |
| $500 to $799 | 8,284 (14.4%) | 762 (4.1%) |
| $800 to $999 | 4,319 (7.5%) | 1,926 (10.3%) |
| $1,000 to $1,499 | 10,589 (18.4%) | 5,955 (32.0%) |
| $1,500 to $1,999 | 9,428 (16.4%) | 4,393 (23.6%) |
| $2,000 to $2,499 | 6,350 (11.0%) | 1,697 (9.1%) |
| $2,500 to $2,999 | 3,291 (5.7%) | 735 (4.0%) |
| $3,000 or more | 6,048 (10.5%) | 871 (4.7%) |
| Total | 57,501 (100.0%) | 18,612 (100.0%) |
Physical Housing Characteristics in Beaufort County
Housing Structures in Beaufort County
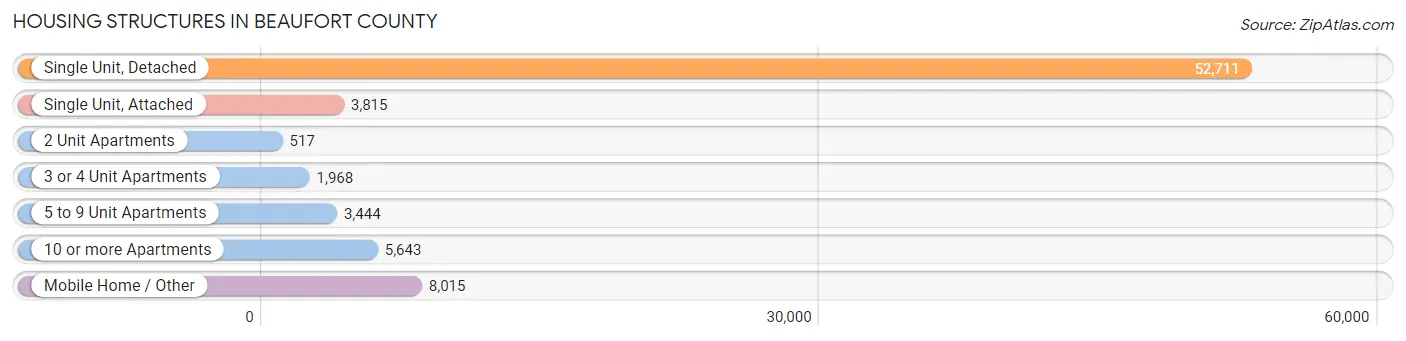
| Structure Type | # Housing Units | % Housing Units |
| Single Unit, Detached | 52,711 | 69.3% |
| Single Unit, Attached | 3,815 | 5.0% |
| 2 Unit Apartments | 517 | 0.7% |
| 3 or 4 Unit Apartments | 1,968 | 2.6% |
| 5 to 9 Unit Apartments | 3,444 | 4.5% |
| 10 or more Apartments | 5,643 | 7.4% |
| Mobile Home / Other | 8,015 | 10.5% |
| Total | 76,113 | 100.0% |
Housing Structures by Occupancy in Beaufort County
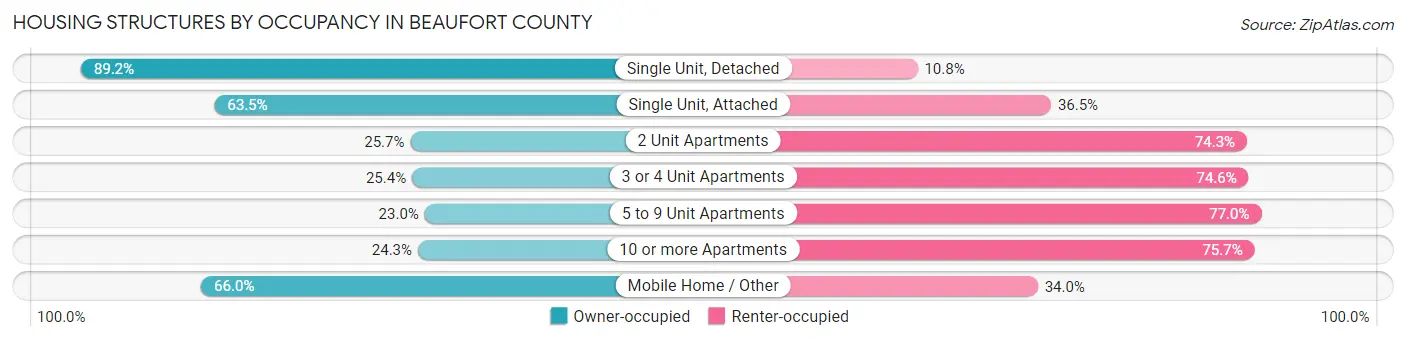
| Structure Type | Owner-occupied | Renter-occupied |
| Single Unit, Detached | 46,995 (89.2%) | 5,716 (10.8%) |
| Single Unit, Attached | 2,421 (63.5%) | 1,394 (36.5%) |
| 2 Unit Apartments | 133 (25.7%) | 384 (74.3%) |
| 3 or 4 Unit Apartments | 500 (25.4%) | 1,468 (74.6%) |
| 5 to 9 Unit Apartments | 791 (23.0%) | 2,653 (77.0%) |
| 10 or more Apartments | 1,370 (24.3%) | 4,273 (75.7%) |
| Mobile Home / Other | 5,291 (66.0%) | 2,724 (34.0%) |
| Total | 57,501 (75.5%) | 18,612 (24.4%) |
Housing Structures by Number of Rooms in Beaufort County
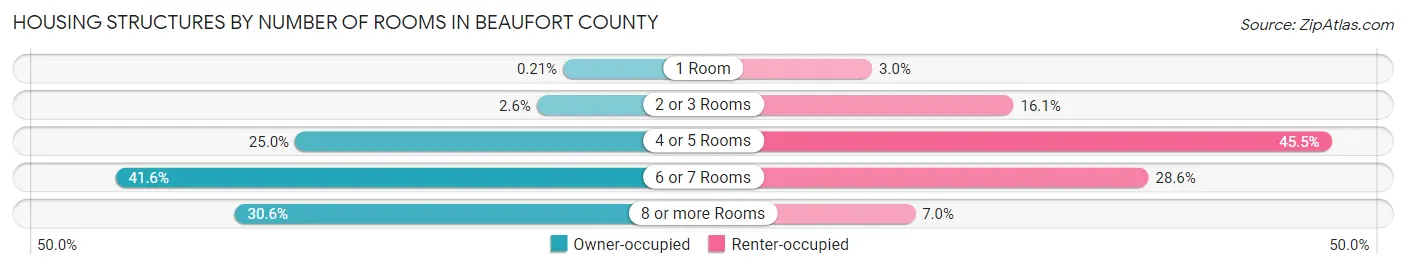
| Number of Rooms | Owner-occupied | Renter-occupied |
| 1 Room | 118 (0.2%) | 555 (3.0%) |
| 2 or 3 Rooms | 1,518 (2.6%) | 2,989 (16.1%) |
| 4 or 5 Rooms | 14,378 (25.0%) | 8,459 (45.5%) |
| 6 or 7 Rooms | 23,910 (41.6%) | 5,314 (28.5%) |
| 8 or more Rooms | 17,577 (30.6%) | 1,295 (7.0%) |
| Total | 57,501 (100.0%) | 18,612 (100.0%) |
Housing Structure by Heating Type in Beaufort County
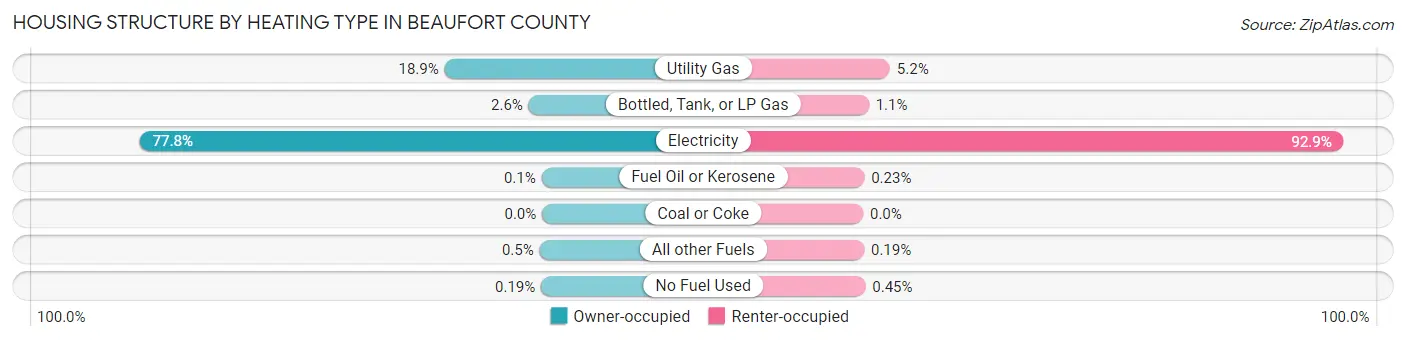
| Heating Type | Owner-occupied | Renter-occupied |
| Utility Gas | 10,839 (18.9%) | 966 (5.2%) |
| Bottled, Tank, or LP Gas | 1,494 (2.6%) | 204 (1.1%) |
| Electricity | 44,710 (77.8%) | 17,282 (92.8%) |
| Fuel Oil or Kerosene | 60 (0.1%) | 42 (0.2%) |
| Coal or Coke | 0 (0.0%) | 0 (0.0%) |
| All other Fuels | 289 (0.5%) | 35 (0.2%) |
| No Fuel Used | 109 (0.2%) | 83 (0.4%) |
| Total | 57,501 (100.0%) | 18,612 (100.0%) |
Household Vehicle Usage in Beaufort County
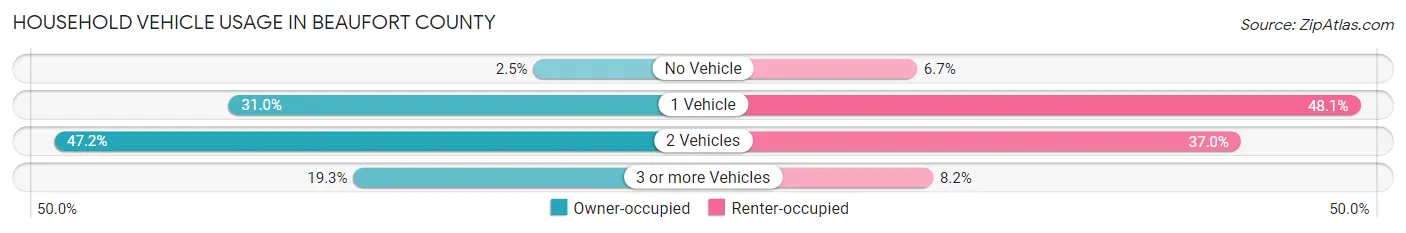
| Vehicles per Household | Owner-occupied | Renter-occupied |
| No Vehicle | 1,437 (2.5%) | 1,251 (6.7%) |
| 1 Vehicle | 17,794 (30.9%) | 8,953 (48.1%) |
| 2 Vehicles | 27,165 (47.2%) | 6,879 (37.0%) |
| 3 or more Vehicles | 11,105 (19.3%) | 1,529 (8.2%) |
| Total | 57,501 (100.0%) | 18,612 (100.0%) |
Real Estate & Mortgages in Beaufort County
Real Estate and Mortgage Overview in Beaufort County
| Characteristic | Without Mortgage | With Mortgage |
| Housing Units | 24,380 | 33,121 |
| Median Property Value | $375,000 | $379,400 |
| Median Household Income | $75,830 | $9,733 |
| Monthly Housing Costs | $592 | $5,719 |
| Real Estate Taxes | $1,834 | $758 |
Property Value by Mortgage Status in Beaufort County
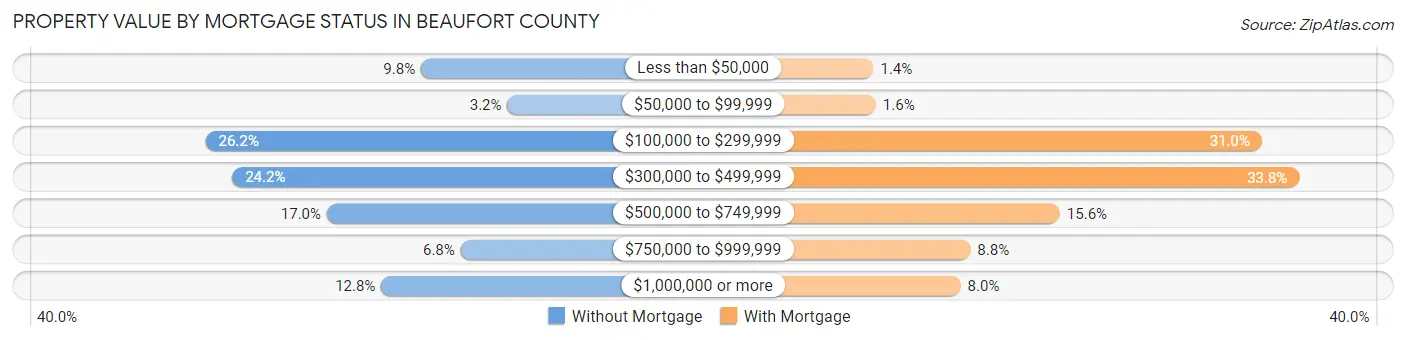
| Property Value | Without Mortgage | With Mortgage |
| Less than $50,000 | 2,390 (9.8%) | 455 (1.4%) |
| $50,000 to $99,999 | 785 (3.2%) | 512 (1.5%) |
| $100,000 to $299,999 | 6,391 (26.2%) | 10,251 (30.9%) |
| $300,000 to $499,999 | 5,896 (24.2%) | 11,194 (33.8%) |
| $500,000 to $749,999 | 4,137 (17.0%) | 5,156 (15.6%) |
| $750,000 to $999,999 | 1,652 (6.8%) | 2,899 (8.7%) |
| $1,000,000 or more | 3,129 (12.8%) | 2,654 (8.0%) |
| Total | 24,380 (100.0%) | 33,121 (100.0%) |
Household Income by Mortgage Status in Beaufort County
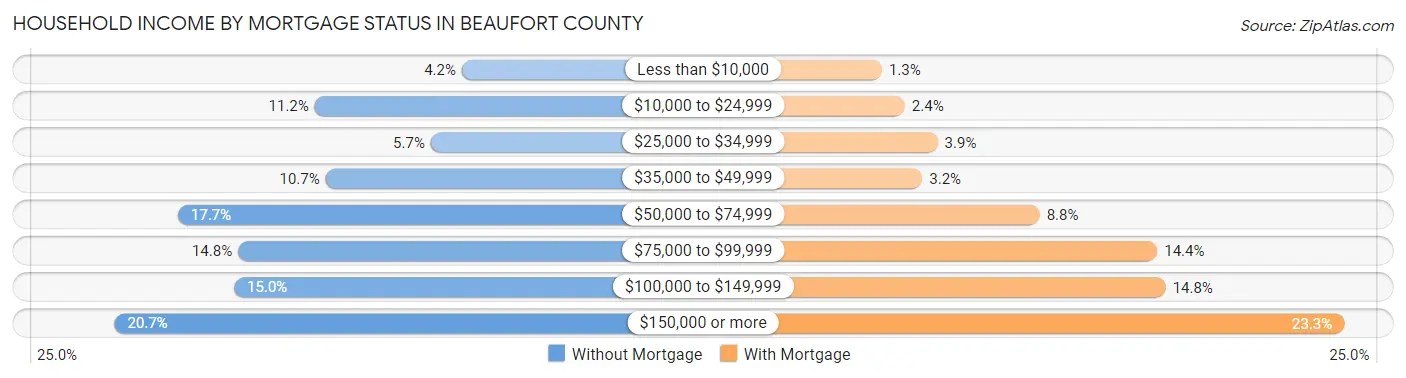
| Household Income | Without Mortgage | With Mortgage |
| Less than $10,000 | 1,019 (4.2%) | 417 (1.3%) |
| $10,000 to $24,999 | 2,727 (11.2%) | 778 (2.4%) |
| $25,000 to $34,999 | 1,381 (5.7%) | 1,294 (3.9%) |
| $35,000 to $49,999 | 2,601 (10.7%) | 1,053 (3.2%) |
| $50,000 to $74,999 | 4,316 (17.7%) | 2,905 (8.8%) |
| $75,000 to $99,999 | 3,619 (14.8%) | 4,761 (14.4%) |
| $100,000 to $149,999 | 3,665 (15.0%) | 4,893 (14.8%) |
| $150,000 or more | 5,052 (20.7%) | 7,704 (23.3%) |
| Total | 24,380 (100.0%) | 33,121 (100.0%) |
Property Value to Household Income Ratio in Beaufort County
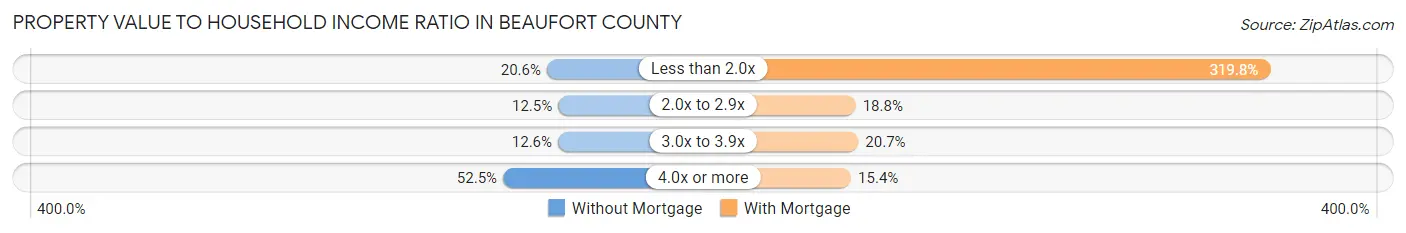
| Value-to-Income Ratio | Without Mortgage | With Mortgage |
| Less than 2.0x | 5,031 (20.6%) | 105,915 (319.8%) |
| 2.0x to 2.9x | 3,047 (12.5%) | 6,209 (18.8%) |
| 3.0x to 3.9x | 3,077 (12.6%) | 6,861 (20.7%) |
| 4.0x or more | 12,807 (52.5%) | 5,107 (15.4%) |
| Total | 24,380 (100.0%) | 33,121 (100.0%) |
Real Estate Taxes by Mortgage Status in Beaufort County
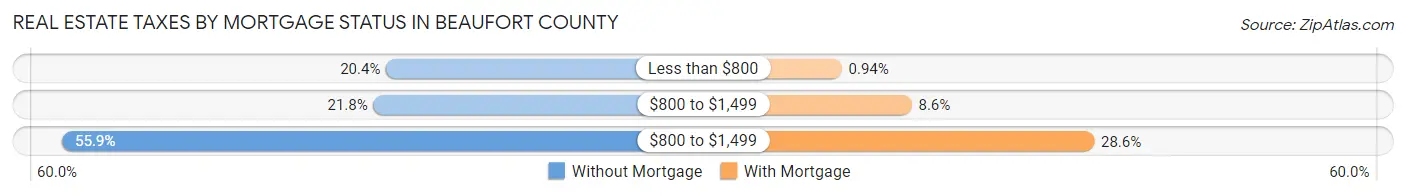
| Property Taxes | Without Mortgage | With Mortgage |
| Less than $800 | 4,967 (20.4%) | 312 (0.9%) |
| $800 to $1,499 | 5,305 (21.8%) | 2,847 (8.6%) |
| $800 to $1,499 | 13,625 (55.9%) | 9,471 (28.6%) |
| Total | 24,380 (100.0%) | 33,121 (100.0%) |
Health & Disability in Beaufort County
Health Insurance Coverage by Age in Beaufort County
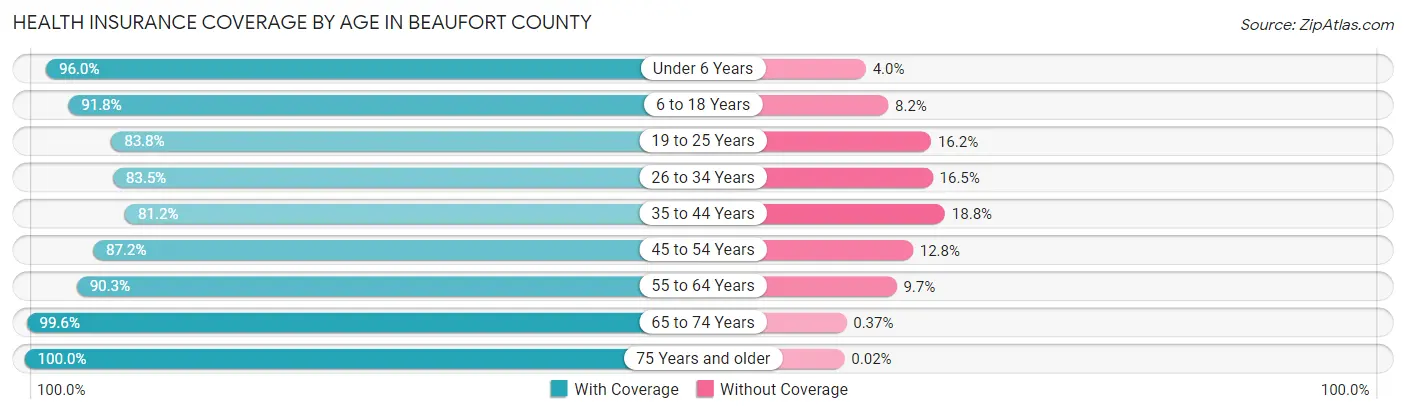
| Age Bracket | With Coverage | Without Coverage |
| Under 6 Years | 10,408 (96.0%) | 434 (4.0%) |
| 6 to 18 Years | 23,540 (91.8%) | 2,095 (8.2%) |
| 19 to 25 Years | 11,102 (83.8%) | 2,141 (16.2%) |
| 26 to 34 Years | 13,960 (83.5%) | 2,752 (16.5%) |
| 35 to 44 Years | 14,798 (81.2%) | 3,418 (18.8%) |
| 45 to 54 Years | 16,545 (87.2%) | 2,423 (12.8%) |
| 55 to 64 Years | 23,400 (90.3%) | 2,522 (9.7%) |
| 65 to 74 Years | 30,186 (99.6%) | 113 (0.4%) |
| 75 Years and older | 21,646 (100.0%) | 5 (0.0%) |
| Total | 165,585 (91.2%) | 15,903 (8.8%) |
Health Insurance Coverage by Citizenship Status in Beaufort County
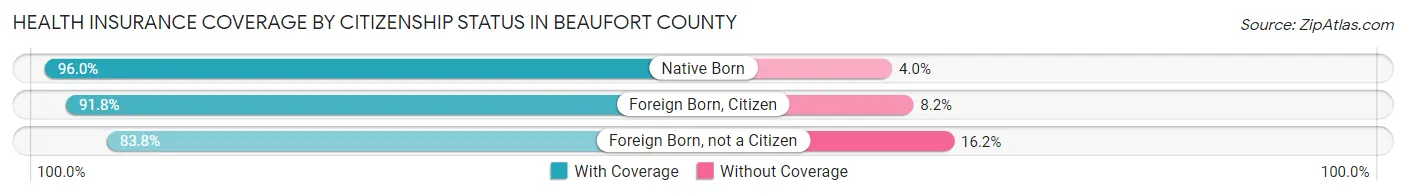
| Citizenship Status | With Coverage | Without Coverage |
| Native Born | 10,408 (96.0%) | 434 (4.0%) |
| Foreign Born, Citizen | 23,540 (91.8%) | 2,095 (8.2%) |
| Foreign Born, not a Citizen | 11,102 (83.8%) | 2,141 (16.2%) |
Health Insurance Coverage by Household Income in Beaufort County
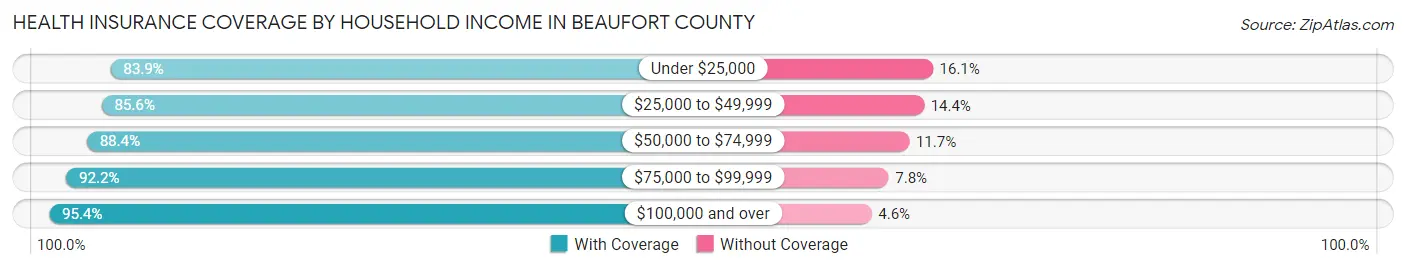
| Household Income | With Coverage | Without Coverage |
| Under $25,000 | 14,910 (83.9%) | 2,857 (16.1%) |
| $25,000 to $49,999 | 22,159 (85.6%) | 3,732 (14.4%) |
| $50,000 to $74,999 | 25,909 (88.3%) | 3,418 (11.7%) |
| $75,000 to $99,999 | 25,737 (92.2%) | 2,175 (7.8%) |
| $100,000 and over | 76,036 (95.4%) | 3,664 (4.6%) |
Public vs Private Health Insurance Coverage by Age in Beaufort County
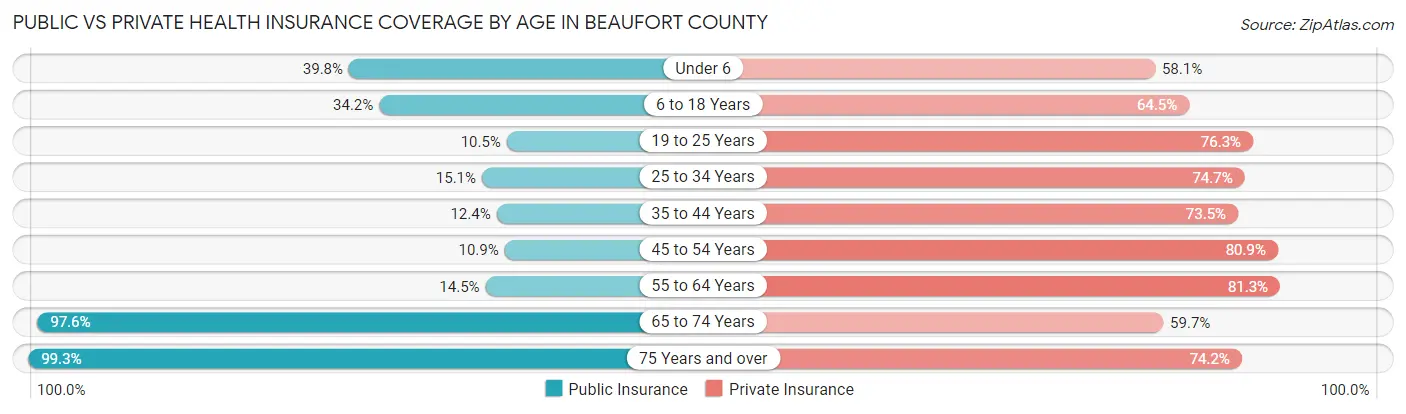
| Age Bracket | Public Insurance | Private Insurance |
| Under 6 | 4,316 (39.8%) | 6,302 (58.1%) |
| 6 to 18 Years | 8,767 (34.2%) | 16,524 (64.5%) |
| 19 to 25 Years | 1,393 (10.5%) | 10,104 (76.3%) |
| 25 to 34 Years | 2,529 (15.1%) | 12,491 (74.7%) |
| 35 to 44 Years | 2,260 (12.4%) | 13,393 (73.5%) |
| 45 to 54 Years | 2,070 (10.9%) | 15,347 (80.9%) |
| 55 to 64 Years | 3,752 (14.5%) | 21,080 (81.3%) |
| 65 to 74 Years | 29,580 (97.6%) | 18,073 (59.7%) |
| 75 Years and over | 21,503 (99.3%) | 16,070 (74.2%) |
| Total | 76,170 (42.0%) | 129,384 (71.3%) |
Disability Status by Sex by Age in Beaufort County
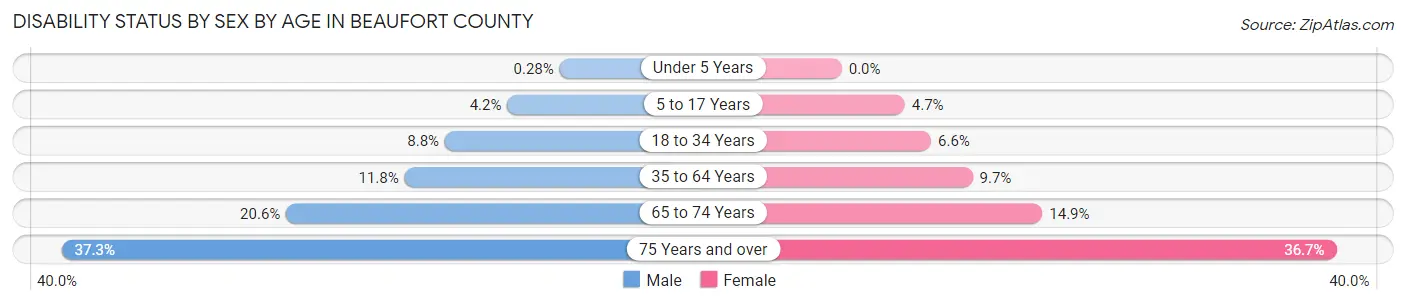
| Age Bracket | Male | Female |
| Under 5 Years | 13 (0.3%) | 0 (0.0%) |
| 5 to 17 Years | 528 (4.2%) | 555 (4.7%) |
| 18 to 34 Years | 1,456 (8.8%) | 1,080 (6.6%) |
| 35 to 64 Years | 3,487 (11.8%) | 3,255 (9.7%) |
| 65 to 74 Years | 2,882 (20.6%) | 2,426 (14.9%) |
| 75 Years and over | 3,852 (37.2%) | 4,152 (36.7%) |
Disability Class by Sex by Age in Beaufort County
Disability Class: Hearing Difficulty
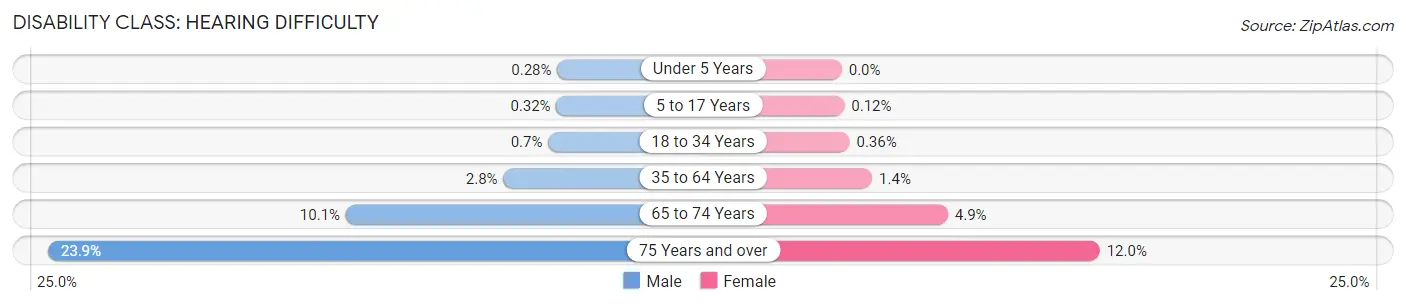
| Age Bracket | Male | Female |
| Under 5 Years | 13 (0.3%) | 0 (0.0%) |
| 5 to 17 Years | 40 (0.3%) | 14 (0.1%) |
| 18 to 34 Years | 116 (0.7%) | 59 (0.4%) |
| 35 to 64 Years | 821 (2.8%) | 472 (1.4%) |
| 65 to 74 Years | 1,413 (10.1%) | 802 (4.9%) |
| 75 Years and over | 2,474 (23.9%) | 1,354 (12.0%) |
Disability Class: Vision Difficulty
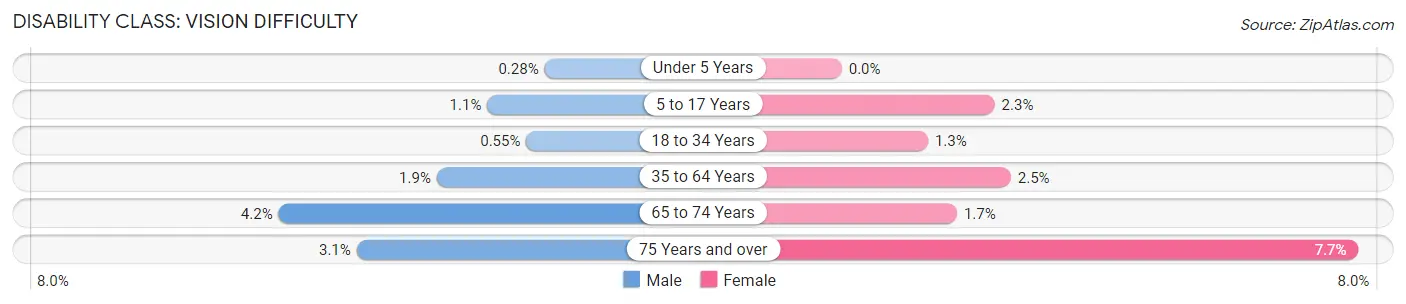
| Age Bracket | Male | Female |
| Under 5 Years | 13 (0.3%) | 0 (0.0%) |
| 5 to 17 Years | 143 (1.1%) | 269 (2.3%) |
| 18 to 34 Years | 91 (0.5%) | 208 (1.3%) |
| 35 to 64 Years | 556 (1.9%) | 841 (2.5%) |
| 65 to 74 Years | 592 (4.2%) | 279 (1.7%) |
| 75 Years and over | 318 (3.1%) | 867 (7.7%) |
Disability Class: Cognitive Difficulty
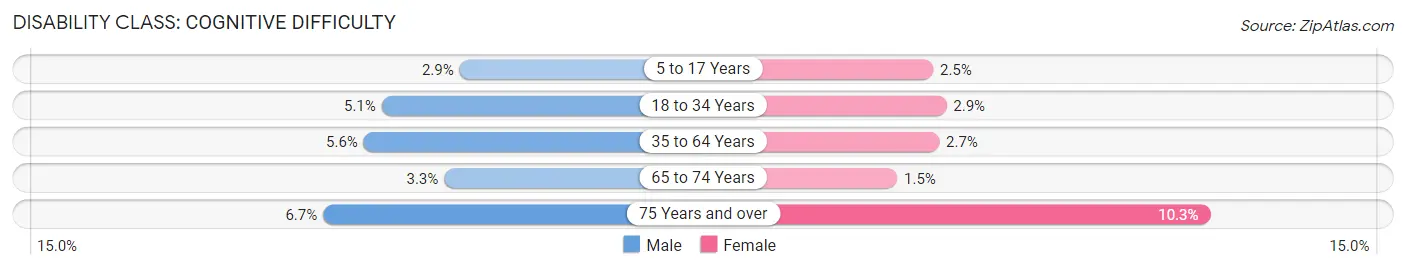
| Age Bracket | Male | Female |
| 5 to 17 Years | 366 (2.9%) | 302 (2.5%) |
| 18 to 34 Years | 837 (5.1%) | 474 (2.9%) |
| 35 to 64 Years | 1,645 (5.6%) | 910 (2.7%) |
| 65 to 74 Years | 465 (3.3%) | 251 (1.5%) |
| 75 Years and over | 692 (6.7%) | 1,160 (10.3%) |
Disability Class: Ambulatory Difficulty
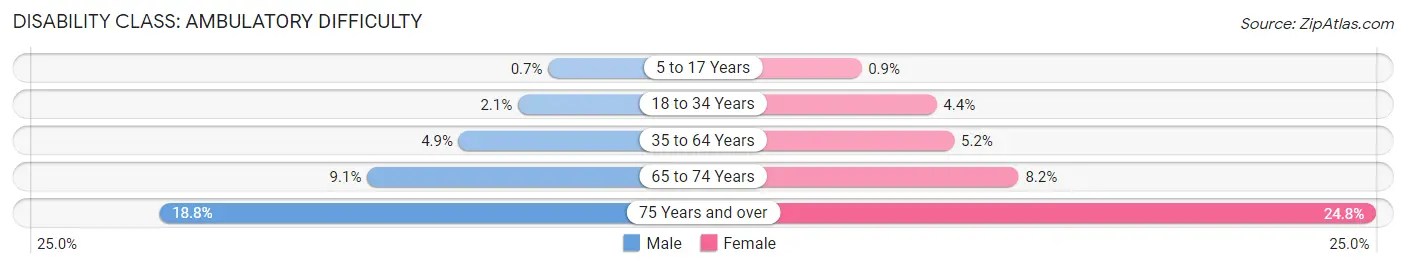
| Age Bracket | Male | Female |
| 5 to 17 Years | 89 (0.7%) | 107 (0.9%) |
| 18 to 34 Years | 347 (2.1%) | 716 (4.4%) |
| 35 to 64 Years | 1,435 (4.9%) | 1,745 (5.2%) |
| 65 to 74 Years | 1,275 (9.1%) | 1,337 (8.2%) |
| 75 Years and over | 1,939 (18.8%) | 2,804 (24.8%) |
Disability Class: Self-Care Difficulty
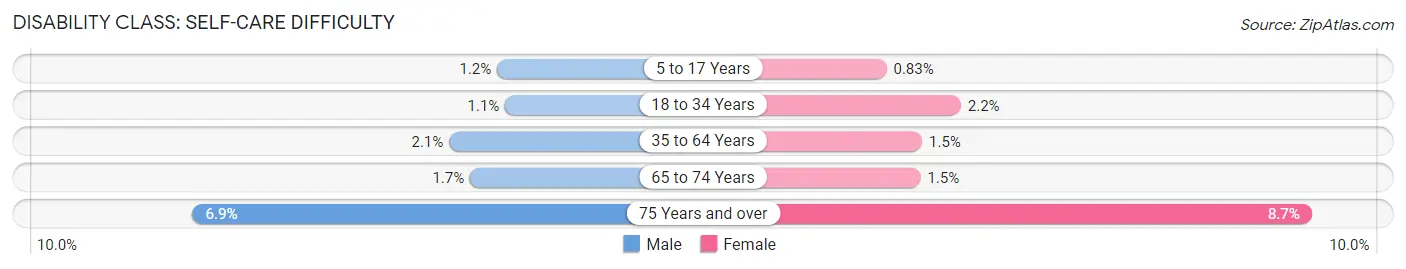
| Age Bracket | Male | Female |
| 5 to 17 Years | 156 (1.2%) | 98 (0.8%) |
| 18 to 34 Years | 178 (1.1%) | 361 (2.2%) |
| 35 to 64 Years | 627 (2.1%) | 500 (1.5%) |
| 65 to 74 Years | 242 (1.7%) | 238 (1.5%) |
| 75 Years and over | 712 (6.9%) | 986 (8.7%) |
Technology Access in Beaufort County
Computing Device Access in Beaufort County
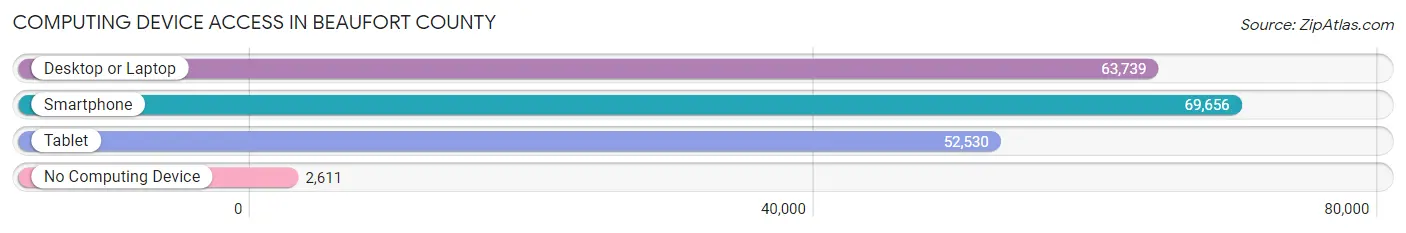
| Device Type | # Households | % Households |
| Desktop or Laptop | 63,739 | 83.7% |
| Smartphone | 69,656 | 91.5% |
| Tablet | 52,530 | 69.0% |
| No Computing Device | 2,611 | 3.4% |
| Total | 76,113 | 100.0% |
Internet Access in Beaufort County
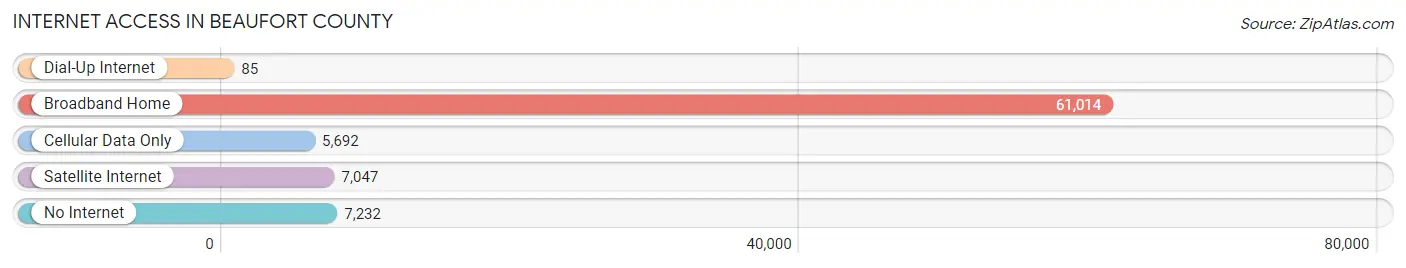
| Internet Type | # Households | % Households |
| Dial-Up Internet | 85 | 0.1% |
| Broadband Home | 61,014 | 80.2% |
| Cellular Data Only | 5,692 | 7.5% |
| Satellite Internet | 7,047 | 9.3% |
| No Internet | 7,232 | 9.5% |
| Total | 76,113 | 100.0% |
Beaufort County Summary
Beaufort County, South Carolina is located in the Lowcountry region of the state and is bordered by Jasper County to the north, Hampton County to the west, Colleton County to the northwest, and Charleston County to the northeast. The county seat is Beaufort, and the county is home to a population of nearly 170,000 people.
Geography
Beaufort County is located in the southeastern corner of South Carolina, and is bordered by the Atlantic Ocean to the east. The county is divided into two distinct regions: the Lowcountry and the Sea Islands. The Lowcountry is a flat, marshy area that is home to the majority of the county’s population. The Sea Islands are a chain of barrier islands that are located off the coast of the county. The county is home to several rivers, including the Ashepoo, Combahee, and Coosaw rivers.
Economy
Beaufort County’s economy is largely based on tourism, agriculture, and military installations. The county is home to several military installations, including Marine Corps Air Station Beaufort, Marine Corps Recruit Depot Parris Island, and Naval Hospital Beaufort. These installations provide a significant number of jobs for the county’s residents.
Agriculture is also an important part of the county’s economy. The county is home to several large farms, which produce a variety of crops, including corn, soybeans, cotton, and peanuts. The county is also home to several seafood processing plants, which process shrimp, oysters, and other seafood.
Tourism is a major industry in Beaufort County. The county is home to several popular tourist attractions, including Hunting Island State Park, the Beaufort Historic District, and the Penn Center. The county is also home to several golf courses, marinas, and other recreational facilities.
Demographics
As of the 2010 census, Beaufort County had a population of 162,233 people. The population is made up of a variety of racial and ethnic groups, including White (63.2%), African American (30.2%), Hispanic or Latino (3.3%), Asian (1.7%), and Native American (0.5%). The median household income in the county is $50,837, and the median home value is $179,400.
The county is home to several colleges and universities, including the University of South Carolina Beaufort, Technical College of the Lowcountry, and Beaufort County Community College. The county is also home to several public school districts, including Beaufort County School District, Beaufort-Jasper Academy for Career Excellence, and Beaufort-Jasper Water and Sewer Authority.
Conclusion
Beaufort County, South Carolina is a diverse and vibrant county located in the Lowcountry region of the state. The county is home to a population of nearly 170,000 people, and is largely supported by tourism, agriculture, and military installations. The county is home to several popular tourist attractions, and is also home to several colleges and universities. The county is also home to a variety of racial and ethnic groups, and has a median household income of $50,837.
Common Questions
What is Per Capita Income in Beaufort County?
Per Capita income in Beaufort County is $48,132.
What is the Median Family Income in Beaufort County?
Median Family Income in Beaufort County is $94,307.
What is the Median Household income in Beaufort County?
Median Household Income in Beaufort County is $81,260.
What is Income or Wage Gap in Beaufort County?
Income or Wage Gap in Beaufort County is 21.6%.
Women in Beaufort County earn 78.4 cents for every dollar earned by a man.
What is Family Income Deficit in Beaufort County?
Family Income Deficit in Beaufort County is $10,522.
Families that are below poverty line in Beaufort County earn $10,522 less on average than the poverty threshold level.
What is Inequality or Gini Index in Beaufort County?
Inequality or Gini Index in Beaufort County is 0.48.
What is the Total Population of Beaufort County?
Total Population of Beaufort County is 189,071.
What is the Total Male Population of Beaufort County?
Total Male Population of Beaufort County is 93,987.
What is the Total Female Population of Beaufort County?
Total Female Population of Beaufort County is 95,084.
What is the Ratio of Males per 100 Females in Beaufort County?
There are 98.85 Males per 100 Females in Beaufort County.
What is the Ratio of Females per 100 Males in Beaufort County?
There are 101.17 Females per 100 Males in Beaufort County.
What is the Median Population Age in Beaufort County?
Median Population Age in Beaufort County is 46.8 Years.
What is the Average Family Size in Beaufort County
Average Family Size in Beaufort County is 2.9 People.
What is the Average Household Size in Beaufort County
Average Household Size in Beaufort County is 2.4 People.
How Large is the Labor Force in Beaufort County?
There are 88,521 People in the Labor Forcein in Beaufort County.
What is the Percentage of People in the Labor Force in Beaufort County?
55.4% of People are in the Labor Force in Beaufort County.
What is the Unemployment Rate in Beaufort County?
Unemployment Rate in Beaufort County is 3.1%.