Cities with the Highest Percentage of Immigrants from Cambodia in the United States
RELATED REPORTS & OPTIONS
Cambodia
United States
Compare Cities
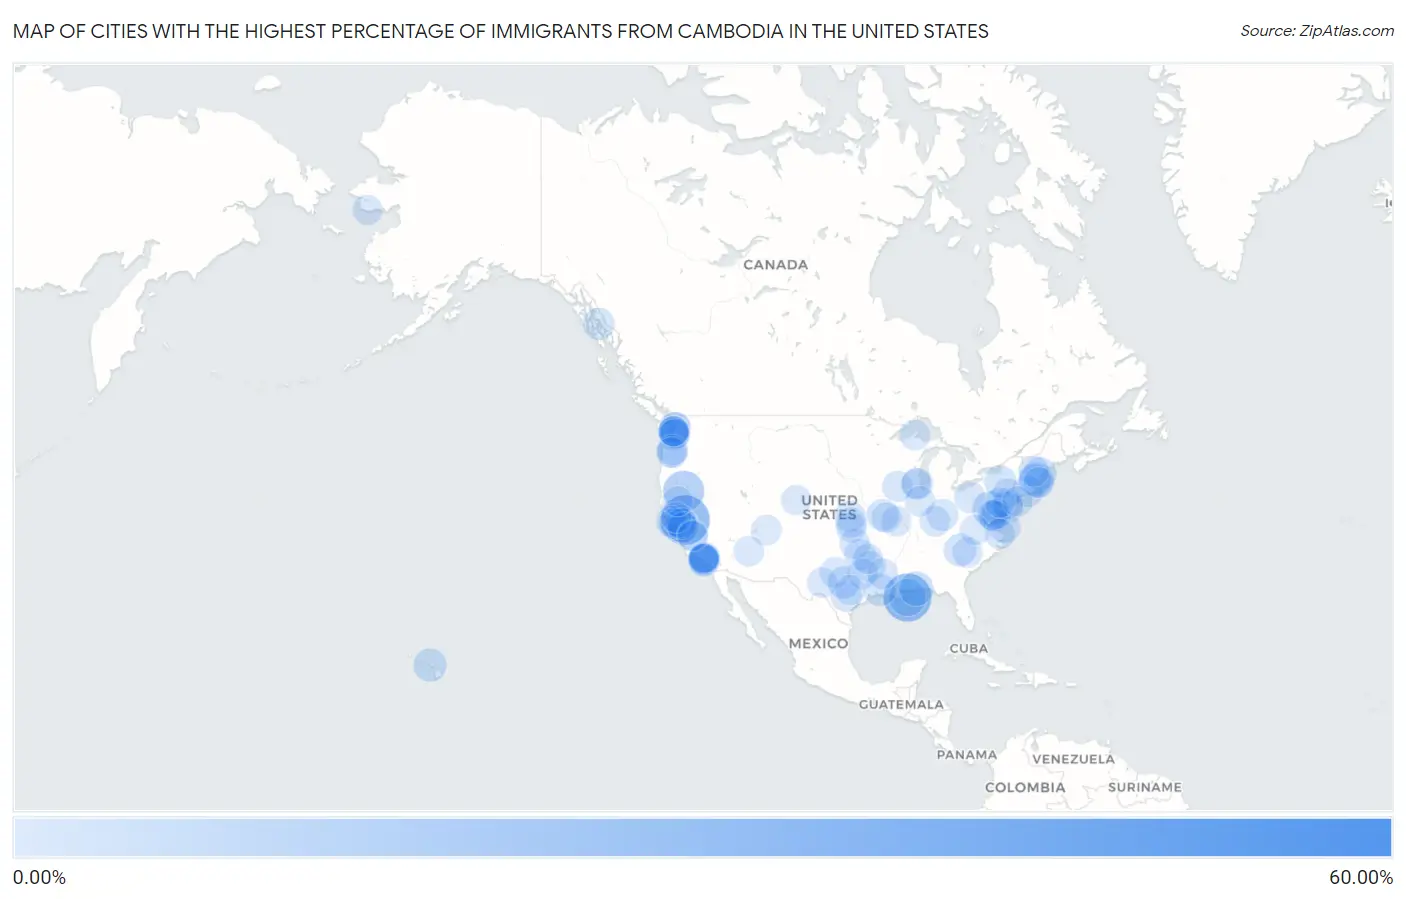
Map of Cities with the Highest Percentage of Immigrants from Cambodia in the United States
0.00%
60.00%
Cities with the Highest Percentage of Immigrants from Cambodia in the United States
| City | Cambodia | vs State | vs National | |
| 1. | Kingsbury Colony | 55.56% | 0.00055%(+55.6)#-1 | 0.045%(+55.5)#0 |
| 2. | Martell | 26.48% | 0.13%(+26.4)#-1 | 0.045%(+26.4)#1 |
| 3. | Triumph | 24.55% | 0.010%(+24.5)#-1 | 0.045%(+24.5)#2 |
| 4. | Canby | 15.03% | 0.13%(+14.9)#0 | 0.045%(+15.0)#3 |
| 5. | Buras | 10.10% | 0.010%(+10.1)#0 | 0.045%(+10.1)#4 |
| 6. | Clear Spring | 7.06% | 0.026%(+7.03)#-1 | 0.045%(+7.01)#5 |
| 7. | Lowell | 7.00% | 0.20%(+6.80)#1 | 0.045%(+6.96)#268 |
| 8. | Bayou La Batre | 6.41% | 0.010%(+6.40)#-1 | 0.045%(+6.37)#269 |
| 9. | Taft Mosswood | 5.78% | 0.13%(+5.64)#1 | 0.045%(+5.73)#270 |
| 10. | Berwick | 4.63% | 0.044%(+4.59)#-1 | 0.045%(+4.59)#271 |
| 11. | Olowalu | 4.55% | 0.023%(+4.52)#-1 | 0.045%(+4.50)#272 |
| 12. | Westlake | 3.90% | 0.010%(+3.89)#1 | 0.045%(+3.85)#273 |
| 13. | Signal Hill | 3.87% | 0.13%(+3.74)#95 | 0.045%(+3.83)#545 |
| 14. | Guilford Lake | 3.87% | 0.022%(+3.85)#-1 | 0.045%(+3.83)#546 |
| 15. | Inman | 3.85% | 0.014%(+3.84)#-1 | 0.045%(+3.80)#547 |
| 16. | Walnut Grove | 3.69% | 0.13%(+3.55)#96 | 0.045%(+3.64)#548 |
| 17. | Lometa | 3.27% | 0.034%(+3.24)#-1 | 0.045%(+3.23)#549 |
| 18. | Marion | 3.18% | 0.075%(+3.11)#-1 | 0.045%(+3.14)#550 |
| 19. | East Pepperell | 3.15% | 0.20%(+2.95)#2 | 0.045%(+3.11)#551 |
| 20. | Lansing | 3.04% | 0.015%(+3.03)#-1 | 0.045%(+3.00)#552 |
| 21. | Nelson | 3.03% | 0.012%(+3.02)#-1 | 0.045%(+2.99)#553 |
| 22. | Durham | 2.88% | 0.043%(+2.84)#-1 | 0.045%(+2.84)#554 |
| 23. | Petersburg | 2.77% | 0.022%(+2.75)#-1 | 0.045%(+2.73)#555 |
| 24. | Fairview | 2.70% | 0.023%(+2.68)#-1 | 0.045%(+2.66)#556 |
| 25. | Parkside Borough | 2.53% | 0.072%(+2.46)#-1 | 0.045%(+2.49)#557 |
| 26. | Boothwyn | 2.51% | 0.072%(+2.43)#0 | 0.045%(+2.46)#558 |
| 27. | Hainesville | 2.28% | 0.024%(+2.26)#-1 | 0.045%(+2.24)#559 |
| 28. | Mcqueeney | 2.19% | 0.034%(+2.16)#0 | 0.045%(+2.15)#560 |
| 29. | Phillips | 2.11% | 0.013%(+2.09)#-1 | 0.045%(+2.06)#561 |
| 30. | Rouse | 2.09% | 0.13%(+1.96)#97 | 0.045%(+2.05)#562 |
| 31. | Exmore | 1.95% | 0.055%(+1.89)#-1 | 0.045%(+1.90)#563 |
| 32. | Martha Lake | 1.78% | 0.14%(+1.64)#-1 | 0.045%(+1.73)#564 |
| 33. | Long Beach | 1.75% | 0.13%(+1.62)#192 | 0.045%(+1.71)#888 |
| 34. | Leetonia | 1.73% | 0.022%(+1.71)#0 | 0.045%(+1.69)#889 |
| 35. | Penngrove | 1.69% | 0.13%(+1.56)#193 | 0.045%(+1.65)#890 |
| 36. | New Cambria | 1.64% | 0.023%(+1.62)#-1 | 0.045%(+1.59)#891 |
| 37. | Dulles Town Center | 1.60% | 0.055%(+1.54)#12 | 0.045%(+1.55)#892 |
| 38. | Lakewood | 1.52% | 0.13%(+1.39)#194 | 0.045%(+1.48)#893 |
| 39. | Trooper | 1.47% | 0.072%(+1.39)#1 | 0.045%(+1.42)#894 |
| 40. | Naples | 1.44% | 0.034%(+1.41)#1 | 0.045%(+1.39)#895 |
| 41. | Trabuco Canyon | 1.41% | 0.13%(+1.28)#195 | 0.045%(+1.37)#896 |
| 42. | Clearview | 1.41% | 0.14%(+1.27)#0 | 0.045%(+1.36)#897 |
| 43. | Pocono Springs | 1.41% | 0.072%(+1.34)#2 | 0.045%(+1.36)#898 |
| 44. | Monmouth | 1.41% | 0.014%(+1.39)#-1 | 0.045%(+1.36)#899 |
| 45. | Seven Corners | 1.39% | 0.055%(+1.33)#13 | 0.045%(+1.34)#900 |
| 46. | Bristol | 1.38% | 0.030%(+1.35)#-1 | 0.045%(+1.34)#901 |
| 47. | Indian Hills | 1.38% | 0.023%(+1.36)#0 | 0.045%(+1.34)#902 |
| 48. | Lynn | 1.36% | 0.20%(+1.15)#3 | 0.045%(+1.31)#903 |
| 49. | Layhill | 1.36% | 0.026%(+1.33)#0 | 0.045%(+1.31)#904 |
| 50. | Lansdale Borough | 1.35% | 0.072%(+1.28)#3 | 0.045%(+1.31)#905 |
| 51. | Hawaiian Gardens | 1.35% | 0.13%(+1.22)#196 | 0.045%(+1.30)#906 |
| 52. | West Modesto | 1.34% | 0.13%(+1.21)#197 | 0.045%(+1.30)#907 |
| 53. | Athens | 1.34% | 0.034%(+1.30)#2 | 0.045%(+1.29)#908 |
| 54. | Chandler | 1.32% | 0.013%(+1.30)#0 | 0.045%(+1.27)#909 |
| 55. | Hubbell | 1.30% | 0.016%(+1.28)#-1 | 0.045%(+1.26)#910 |
| 56. | Midland | 1.30% | 0.14%(+1.16)#1 | 0.045%(+1.25)#911 |
| 57. | Potosi | 1.30% | 0.034%(+1.26)#3 | 0.045%(+1.25)#912 |
| 58. | Rollingwood | 1.29% | 0.13%(+1.16)#198 | 0.045%(+1.25)#913 |
| 59. | Lucky | 1.29% | 0.010%(+1.28)#2 | 0.045%(+1.25)#914 |
| 60. | Stockton | 1.29% | 0.13%(+1.16)#199 | 0.045%(+1.24)#915 |
| 61. | Mayfair | 1.17% | 0.13%(+1.04)#200 | 0.045%(+1.13)#916 |
| 62. | Johnson City | 1.16% | 0.055%(+1.11)#-1 | 0.045%(+1.12)#917 |
| 63. | Volo | 1.15% | 0.024%(+1.12)#0 | 0.045%(+1.10)#918 |
| 64. | Lordship | 1.14% | 0.043%(+1.10)#0 | 0.045%(+1.10)#919 |
| 65. | North Newton | 1.14% | 0.023%(+1.12)#0 | 0.045%(+1.10)#920 |
| 66. | Richburg | 1.13% | 0.014%(+1.12)#0 | 0.045%(+1.08)#921 |
| 67. | Arkwright | 1.12% | 0.014%(+1.11)#1 | 0.045%(+1.08)#922 |
| 68. | Esparto | 1.11% | 0.13%(+0.979)#201 | 0.045%(+1.07)#923 |
| 69. | Valliant | 1.11% | 0.013%(+1.10)#1 | 0.045%(+1.07)#924 |
| 70. | North El Monte | 1.10% | 0.13%(+0.973)#202 | 0.045%(+1.06)#925 |
| 71. | Montezuma Creek | 1.10% | 0.047%(+1.06)#-1 | 0.045%(+1.06)#926 |
| 72. | Waller | 1.09% | 0.14%(+0.946)#2 | 0.045%(+1.04)#927 |
| 73. | Burien | 1.09% | 0.14%(+0.944)#32 | 0.045%(+1.04)#928 |
| 74. | Norwood Borough | 1.08% | 0.072%(+1.01)#4 | 0.045%(+1.03)#929 |
| 75. | Big Lake | 1.07% | 0.034%(+1.04)#4 | 0.045%(+1.03)#930 |
| 76. | San Gabriel | 1.07% | 0.13%(+0.942)#203 | 0.045%(+1.03)#931 |
| 77. | Wrightstown Borough | 1.07% | 0.0096%(+1.06)#-1 | 0.045%(+1.03)#932 |
| 78. | Seatac | 1.07% | 0.14%(+0.924)#33 | 0.045%(+1.02)#933 |
| 79. | Rosemead | 1.06% | 0.13%(+0.926)#204 | 0.045%(+1.01)#934 |
| 80. | Brambleton | 1.04% | 0.055%(+0.980)#14 | 0.045%(+0.990)#935 |
| 81. | Tukwila | 1.03% | 0.14%(+0.886)#34 | 0.045%(+0.984)#936 |
| 82. | Hollins | 1.02% | 0.055%(+0.964)#15 | 0.045%(+0.974)#937 |
| 83. | Hoopeston | 1.01% | 0.024%(+0.988)#1 | 0.045%(+0.967)#938 |
| 84. | Meadow Glade | 1.00% | 0.14%(+0.861)#35 | 0.045%(+0.959)#939 |
| 85. | Monmouth | 0.99% | 0.13%(+0.858)#205 | 0.045%(+0.945)#940 |
| 86. | Sand Hill | 0.99% | 0.072%(+0.917)#5 | 0.045%(+0.945)#941 |
| 87. | Laporte | 0.99% | 0.034%(+0.952)#-1 | 0.045%(+0.940)#942 |
| 88. | Leonardo | 0.98% | 0.0096%(+0.975)#0 | 0.045%(+0.939)#943 |
| 89. | Manton | 0.98% | 0.13%(+0.852)#206 | 0.045%(+0.938)#944 |
| 90. | Oaklawn Sunview | 0.97% | 0.023%(+0.948)#1 | 0.045%(+0.927)#945 |
| 91. | Garden Home Whitford | 0.95% | 0.055%(+0.890)#0 | 0.045%(+0.900)#946 |
| 92. | Sedona | 0.94% | 0.024%(+0.921)#-1 | 0.045%(+0.900)#947 |
| 93. | Pacific | 0.93% | 0.14%(+0.787)#36 | 0.045%(+0.885)#948 |
| 94. | Hornsby Bend | 0.92% | 0.034%(+0.890)#5 | 0.045%(+0.880)#949 |
| 95. | Parkway | 0.91% | 0.012%(+0.901)#0 | 0.045%(+0.869)#950 |
| 96. | Centertown | 0.91% | 0.012%(+0.894)#1 | 0.045%(+0.861)#951 |
| 97. | White Center | 0.90% | 0.14%(+0.755)#37 | 0.045%(+0.853)#952 |
| 98. | Nome | 0.89% | 0.022%(+0.868)#0 | 0.045%(+0.844)#953 |
| 99. | Carrollton | 0.89% | 0.055%(+0.832)#16 | 0.045%(+0.842)#954 |
| 100. | Monterey Park | 0.89% | 0.13%(+0.754)#207 | 0.045%(+0.841)#955 |
Common Questions
What are the Top 10 Cities with the Highest Percentage of Immigrants from Cambodia in the United States?
Top 10 Cities with the Highest Percentage of Immigrants from Cambodia in the United States are:
What city has the Highest Percentage of Immigrants from Cambodia in the United States?
Martell has the Highest Percentage of Immigrants from Cambodia in the United States with 26.48%.
What is the Percentage of Immigrants from Cambodia in the United States?
Percentage of Immigrants from Cambodia in the United States is 0.045%.