Aiken, SC Map & Demographics
Aiken Map
Aiken Overview
$40,926
PER CAPITA INCOME
$93,666
AVG FAMILY INCOME
$65,712
AVG HOUSEHOLD INCOME
36.3%
WAGE / INCOME GAP [ % ]
63.7¢/ $1
WAGE / INCOME GAP [ $ ]
$14,743
FAMILY INCOME DEFICIT
0.48
INEQUALITY / GINI INDEX
32,014
TOTAL POPULATION
14,615
MALE POPULATION
17,399
FEMALE POPULATION
84.00
MALES / 100 FEMALES
119.05
FEMALES / 100 MALES
46.4
MEDIAN AGE
3.1
AVG FAMILY SIZE
2.3
AVG HOUSEHOLD SIZE
14,820
LABOR FORCE [ PEOPLE ]
55.0%
PERCENT IN LABOR FORCE
3.9%
UNEMPLOYMENT RATE
Aiken Area Codes
Income in Aiken
Income Overview in Aiken
Per Capita Income in Aiken is $40,926, while median incomes of families and households are $93,666 and $65,712 respectively.
| Characteristic | Number | Measure |
| Per Capita Income | 32,014 | $40,926 |
| Median Family Income | 7,633 | $93,666 |
| Mean Family Income | 7,633 | $120,732 |
| Median Household Income | 12,953 | $65,712 |
| Mean Household Income | 12,953 | $95,355 |
| Income Deficit | 7,633 | $14,743 |
| Wage / Income Gap (%) | 32,014 | 36.31% |
| Wage / Income Gap ($) | 32,014 | 63.69¢ per $1 |
| Gini / Inequality Index | 32,014 | 0.48 |
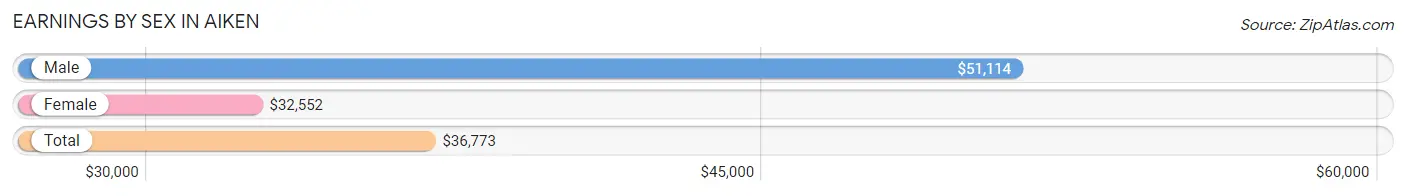
Earnings by Sex in Aiken
Average Earnings in Aiken are $36,773, $51,114 for men and $32,552 for women, a difference of 36.3%.
| Sex | Number | Average Earnings |
| Male | 7,320 (47.9%) | $51,114 |
| Female | 7,958 (52.1%) | $32,552 |
| Total | 15,278 (100.0%) | $36,773 |
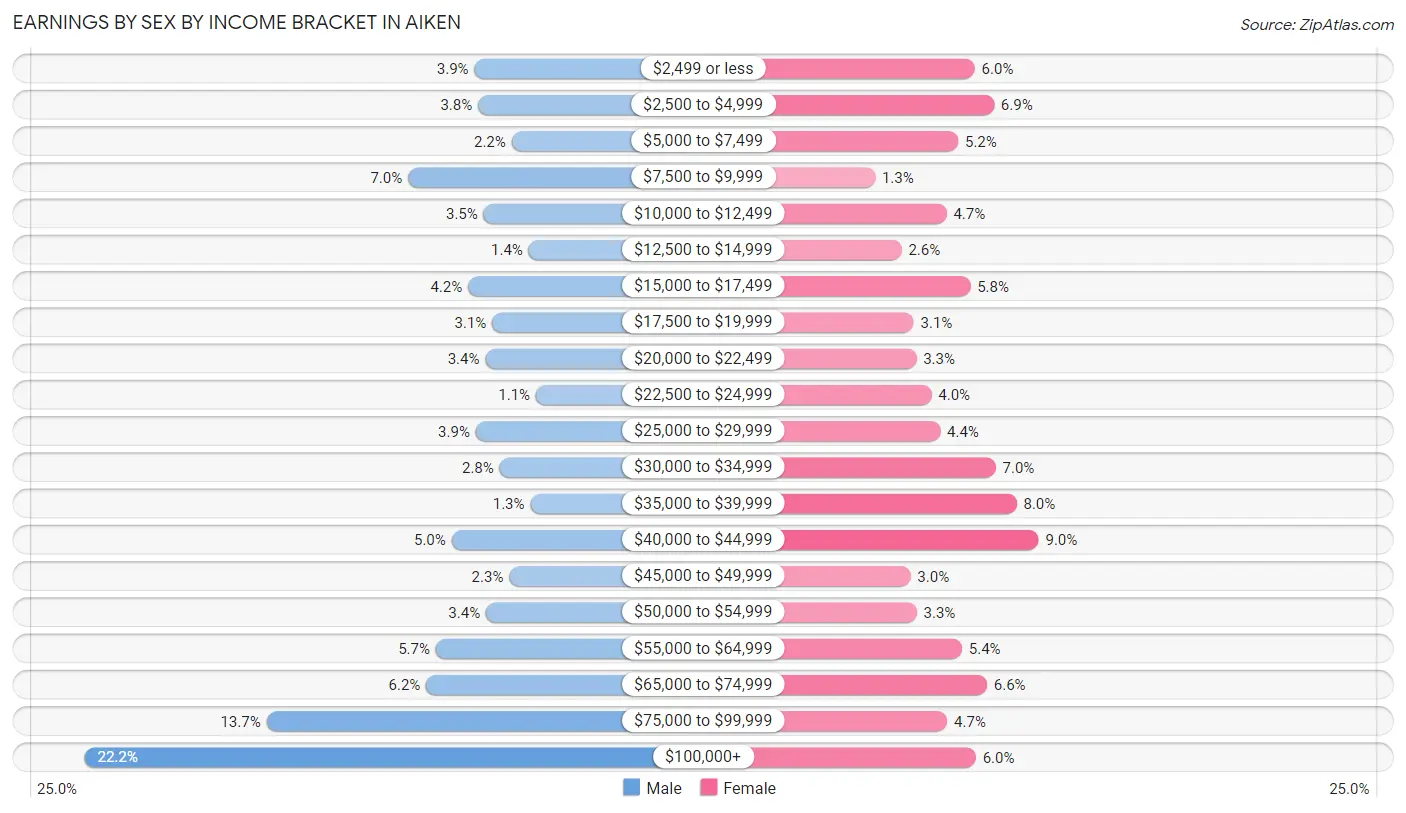
Earnings by Sex by Income Bracket in Aiken
The most common earnings brackets in Aiken are $100,000+ for men (1,624 | 22.2%) and $40,000 to $44,999 for women (715 | 9.0%).
| Income | Male | Female |
| $2,499 or less | 288 (3.9%) | 477 (6.0%) |
| $2,500 to $4,999 | 275 (3.8%) | 548 (6.9%) |
| $5,000 to $7,499 | 160 (2.2%) | 415 (5.2%) |
| $7,500 to $9,999 | 515 (7.0%) | 105 (1.3%) |
| $10,000 to $12,499 | 256 (3.5%) | 372 (4.7%) |
| $12,500 to $14,999 | 102 (1.4%) | 204 (2.6%) |
| $15,000 to $17,499 | 310 (4.2%) | 460 (5.8%) |
| $17,500 to $19,999 | 227 (3.1%) | 249 (3.1%) |
| $20,000 to $22,499 | 250 (3.4%) | 259 (3.3%) |
| $22,500 to $24,999 | 77 (1.1%) | 315 (4.0%) |
| $25,000 to $29,999 | 283 (3.9%) | 348 (4.4%) |
| $30,000 to $34,999 | 201 (2.8%) | 555 (7.0%) |
| $35,000 to $39,999 | 96 (1.3%) | 633 (8.0%) |
| $40,000 to $44,999 | 366 (5.0%) | 715 (9.0%) |
| $45,000 to $49,999 | 168 (2.3%) | 237 (3.0%) |
| $50,000 to $54,999 | 248 (3.4%) | 260 (3.3%) |
| $55,000 to $64,999 | 420 (5.7%) | 429 (5.4%) |
| $65,000 to $74,999 | 453 (6.2%) | 522 (6.6%) |
| $75,000 to $99,999 | 1,001 (13.7%) | 374 (4.7%) |
| $100,000+ | 1,624 (22.2%) | 481 (6.0%) |
| Total | 7,320 (100.0%) | 7,958 (100.0%) |
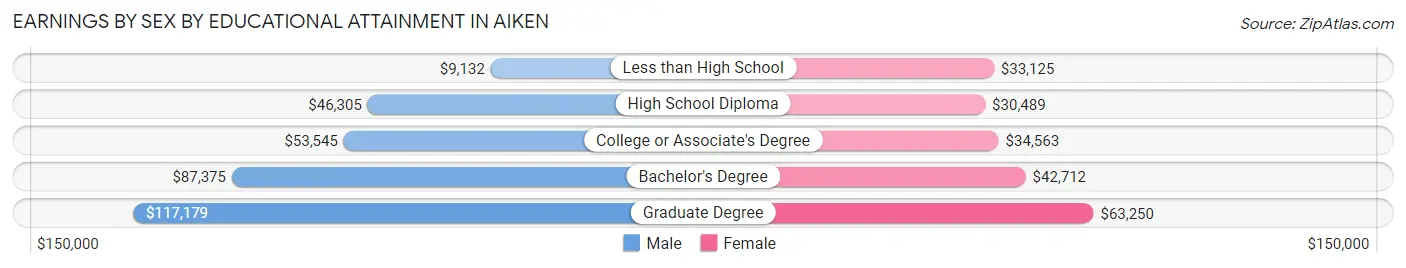
Earnings by Sex by Educational Attainment in Aiken
Average earnings in Aiken are $59,570 for men and $36,748 for women, a difference of 38.3%. Men with an educational attainment of graduate degree enjoy the highest average annual earnings of $117,179, while those with less than high school education earn the least with $9,132. Women with an educational attainment of graduate degree earn the most with the average annual earnings of $63,250, while those with high school diploma education have the smallest earnings of $30,489.
| Educational Attainment | Male Income | Female Income |
| Less than High School | $9,132 | $33,125 |
| High School Diploma | $46,305 | $30,489 |
| College or Associate's Degree | $53,545 | $34,563 |
| Bachelor's Degree | $87,375 | $42,712 |
| Graduate Degree | $117,179 | $63,250 |
| Total | $59,570 | $36,748 |
Family Income in Aiken
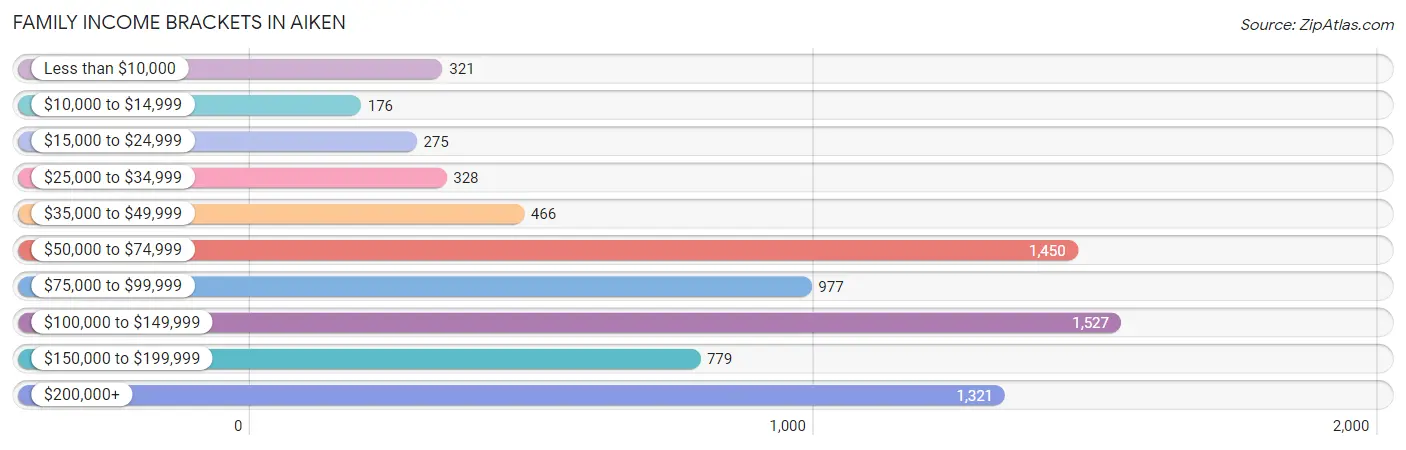
Family Income Brackets in Aiken
According to the Aiken family income data, there are 1,527 families falling into the $100,000 to $149,999 income range, which is the most common income bracket and makes up 20.0% of all families. Conversely, the $10,000 to $14,999 income bracket is the least frequent group with only 176 families (2.3%) belonging to this category.
| Income Bracket | # Families | % Families |
| Less than $10,000 | 321 | 4.2% |
| $10,000 to $14,999 | 176 | 2.3% |
| $15,000 to $24,999 | 275 | 3.6% |
| $25,000 to $34,999 | 328 | 4.3% |
| $35,000 to $49,999 | 466 | 6.1% |
| $50,000 to $74,999 | 1,450 | 19.0% |
| $75,000 to $99,999 | 977 | 12.8% |
| $100,000 to $149,999 | 1,527 | 20.0% |
| $150,000 to $199,999 | 779 | 10.2% |
| $200,000+ | 1,321 | 17.3% |
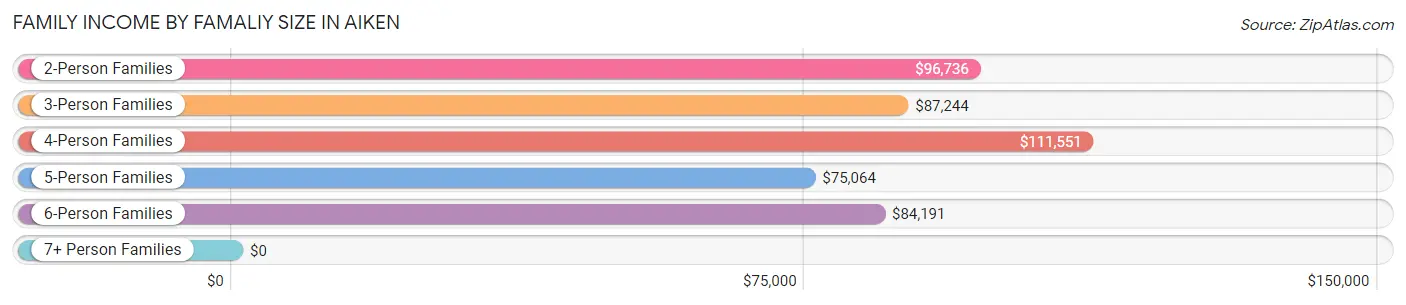
Family Income by Famaliy Size in Aiken
4-person families (1,369 | 17.9%) account for the highest median family income in Aiken with $111,551 per family, while 2-person families (4,290 | 56.2%) have the highest median income of $48,368 per family member.
| Income Bracket | # Families | Median Income |
| 2-Person Families | 4,290 (56.2%) | $96,736 |
| 3-Person Families | 1,348 (17.7%) | $87,244 |
| 4-Person Families | 1,369 (17.9%) | $111,551 |
| 5-Person Families | 468 (6.1%) | $75,064 |
| 6-Person Families | 121 (1.6%) | $84,191 |
| 7+ Person Families | 37 (0.5%) | $0 |
| Total | 7,633 (100.0%) | $93,666 |
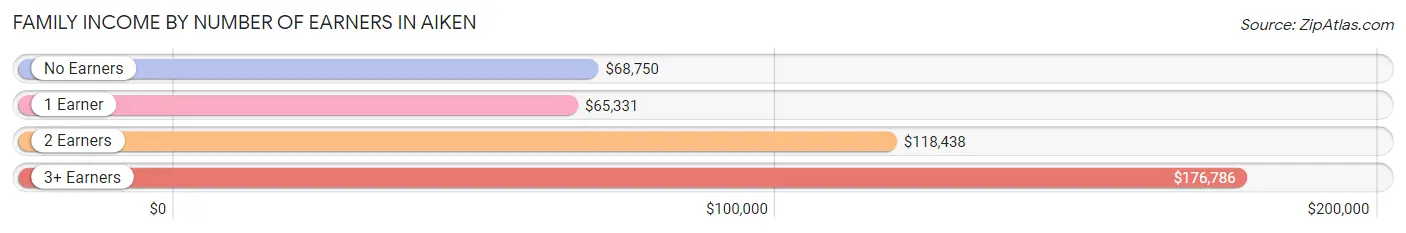
Family Income by Number of Earners in Aiken
The median family income in Aiken is $93,666, with families comprising 3+ earners (720) having the highest median family income of $176,786, while families with 1 earner (2,683) have the lowest median family income of $65,331, accounting for 9.4% and 35.1% of families, respectively.
| Number of Earners | # Families | Median Income |
| No Earners | 2,091 (27.4%) | $68,750 |
| 1 Earner | 2,683 (35.1%) | $65,331 |
| 2 Earners | 2,139 (28.0%) | $118,438 |
| 3+ Earners | 720 (9.4%) | $176,786 |
| Total | 7,633 (100.0%) | $93,666 |
Household Income in Aiken
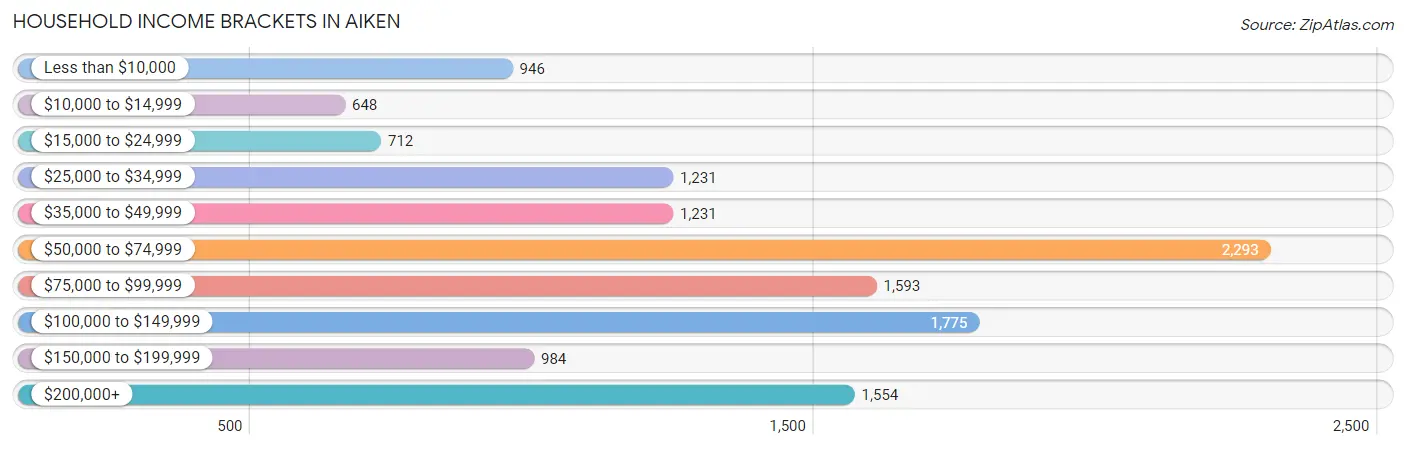
Household Income Brackets in Aiken
With 2,293 households falling in the category, the $50,000 to $74,999 income range is the most frequent in Aiken, accounting for 17.7% of all households. In contrast, only 648 households (5.0%) fall into the $10,000 to $14,999 income bracket, making it the least populous group.
| Income Bracket | # Households | % Households |
| Less than $10,000 | 946 | 7.3% |
| $10,000 to $14,999 | 648 | 5.0% |
| $15,000 to $24,999 | 712 | 5.5% |
| $25,000 to $34,999 | 1,231 | 9.5% |
| $35,000 to $49,999 | 1,231 | 9.5% |
| $50,000 to $74,999 | 2,293 | 17.7% |
| $75,000 to $99,999 | 1,593 | 12.3% |
| $100,000 to $149,999 | 1,775 | 13.7% |
| $150,000 to $199,999 | 984 | 7.6% |
| $200,000+ | 1,554 | 12.0% |
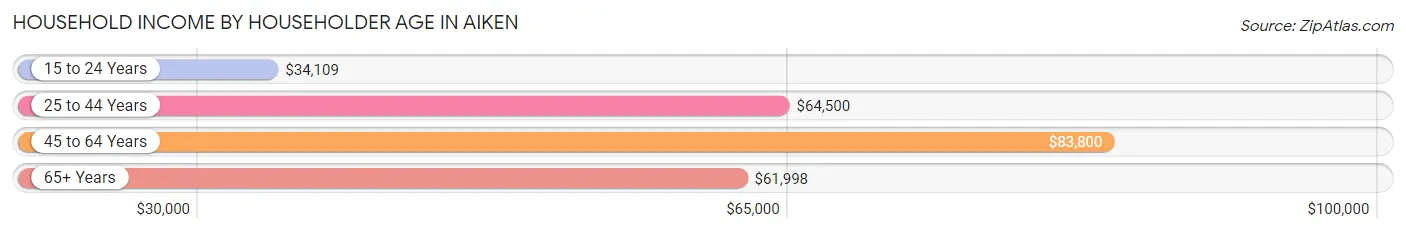
Household Income by Householder Age in Aiken
The median household income in Aiken is $65,712, with the highest median household income of $83,800 found in the 45 to 64 years age bracket for the primary householder. A total of 4,194 households (32.4%) fall into this category. Meanwhile, the 15 to 24 years age bracket for the primary householder has the lowest median household income of $34,109, with 556 households (4.3%) in this group.
| Income Bracket | # Households | Median Income |
| 15 to 24 Years | 556 (4.3%) | $34,109 |
| 25 to 44 Years | 3,246 (25.1%) | $64,500 |
| 45 to 64 Years | 4,194 (32.4%) | $83,800 |
| 65+ Years | 4,957 (38.3%) | $61,998 |
| Total | 12,953 (100.0%) | $65,712 |
Poverty in Aiken
Income Below Poverty by Sex and Age in Aiken
With 16.0% poverty level for males and 15.9% for females among the residents of Aiken, under 5 year old males and 5 year old females are the most vulnerable to poverty, with 341 males (45.4%) and 96 females (59.6%) in their respective age groups living below the poverty level.
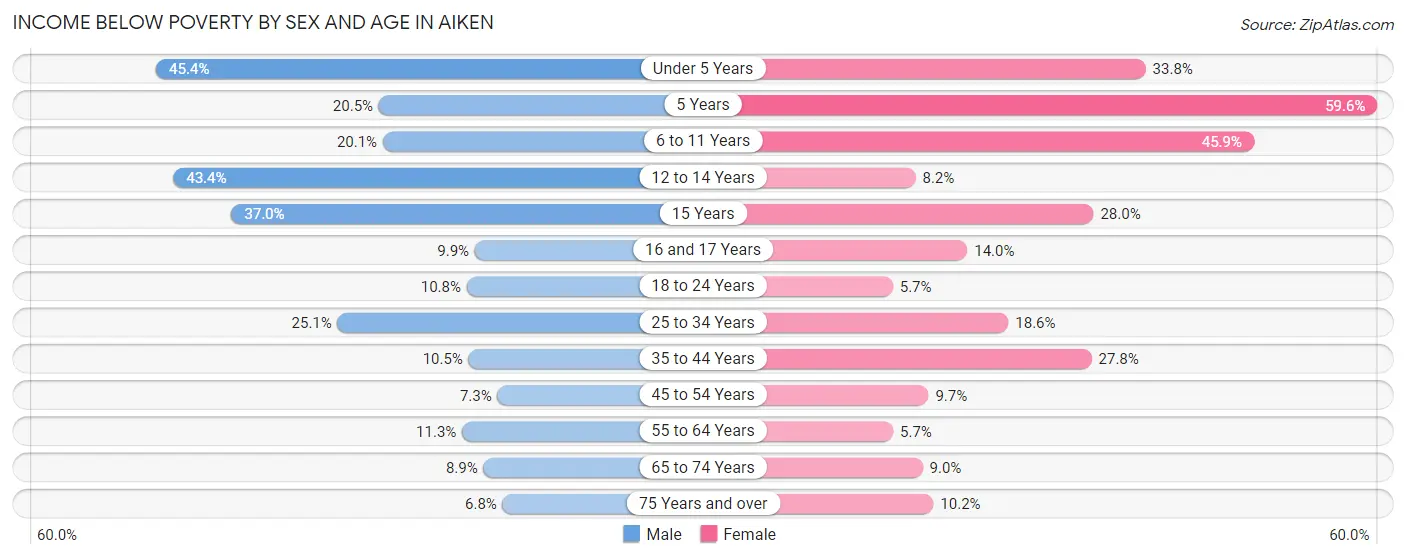
| Age Bracket | Male | Female |
| Under 5 Years | 341 (45.4%) | 224 (33.8%) |
| 5 Years | 23 (20.5%) | 96 (59.6%) |
| 6 to 11 Years | 170 (20.1%) | 573 (45.9%) |
| 12 to 14 Years | 265 (43.4%) | 28 (8.2%) |
| 15 Years | 44 (37.0%) | 44 (28.0%) |
| 16 and 17 Years | 20 (9.9%) | 46 (14.0%) |
| 18 to 24 Years | 134 (10.7%) | 73 (5.7%) |
| 25 to 34 Years | 555 (25.1%) | 309 (18.5%) |
| 35 to 44 Years | 114 (10.5%) | 461 (27.8%) |
| 45 to 54 Years | 136 (7.3%) | 173 (9.7%) |
| 55 to 64 Years | 175 (11.3%) | 135 (5.7%) |
| 65 to 74 Years | 186 (8.9%) | 227 (9.0%) |
| 75 Years and over | 95 (6.8%) | 226 (10.2%) |
| Total | 2,258 (16.0%) | 2,615 (15.9%) |
Income Above Poverty by Sex and Age in Aiken
According to the poverty statistics in Aiken, males aged 75 years and over and females aged 18 to 24 years are the age groups that are most secure financially, with 93.2% of males and 94.3% of females in these age groups living above the poverty line.
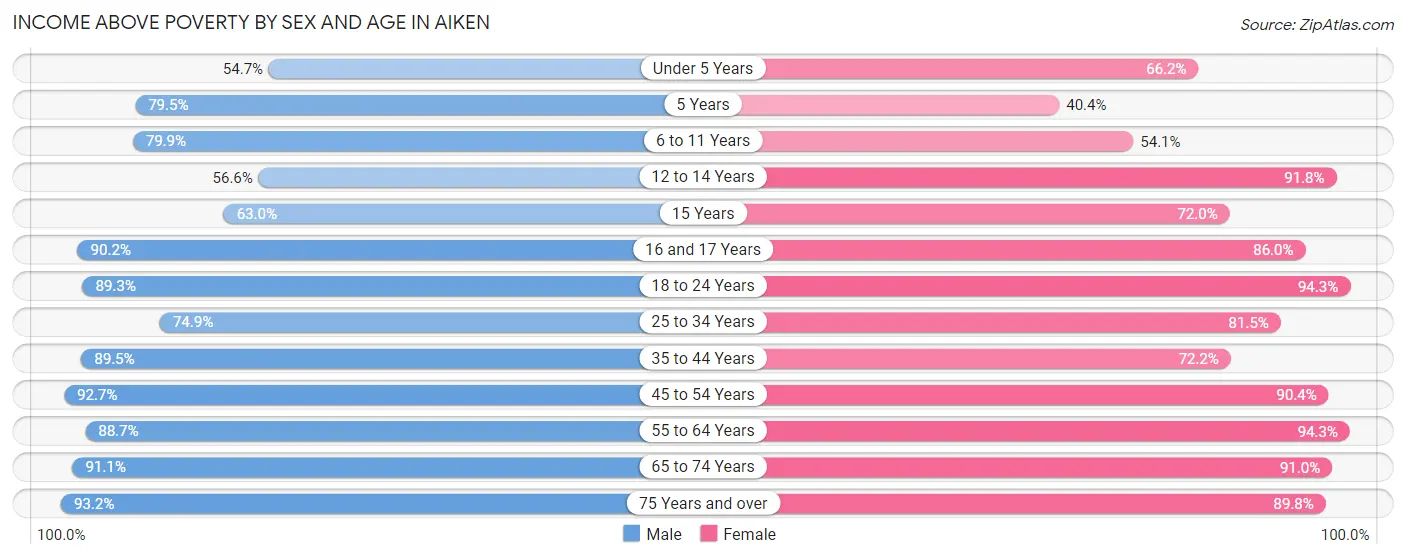
| Age Bracket | Male | Female |
| Under 5 Years | 411 (54.6%) | 438 (66.2%) |
| 5 Years | 89 (79.5%) | 65 (40.4%) |
| 6 to 11 Years | 676 (79.9%) | 676 (54.1%) |
| 12 to 14 Years | 345 (56.6%) | 313 (91.8%) |
| 15 Years | 75 (63.0%) | 113 (72.0%) |
| 16 and 17 Years | 183 (90.1%) | 283 (86.0%) |
| 18 to 24 Years | 1,113 (89.2%) | 1,213 (94.3%) |
| 25 to 34 Years | 1,653 (74.9%) | 1,357 (81.5%) |
| 35 to 44 Years | 968 (89.5%) | 1,196 (72.2%) |
| 45 to 54 Years | 1,720 (92.7%) | 1,619 (90.3%) |
| 55 to 64 Years | 1,378 (88.7%) | 2,231 (94.3%) |
| 65 to 74 Years | 1,907 (91.1%) | 2,294 (91.0%) |
| 75 Years and over | 1,310 (93.2%) | 1,990 (89.8%) |
| Total | 11,828 (84.0%) | 13,788 (84.1%) |
Income Below Poverty Among Married-Couple Families in Aiken
The poverty statistics for married-couple families in Aiken show that 2.5% or 143 of the total 5,637 families live below the poverty line. Families with 3 or 4 children have the highest poverty rate of 21.5%, comprising of 52 families. On the other hand, families with 1 or 2 children have the lowest poverty rate of 0.0%, which includes 0 families.
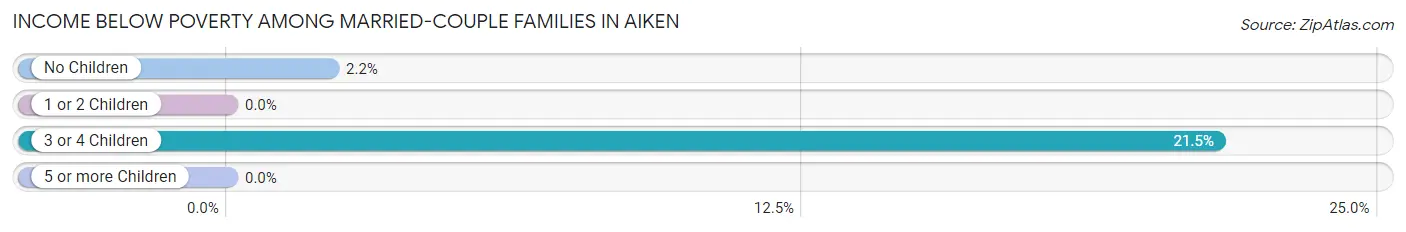
| Children | Above Poverty | Below Poverty |
| No Children | 4,036 (97.8%) | 91 (2.2%) |
| 1 or 2 Children | 1,268 (100.0%) | 0 (0.0%) |
| 3 or 4 Children | 190 (78.5%) | 52 (21.5%) |
| 5 or more Children | 0 (0.0%) | 0 (0.0%) |
| Total | 5,494 (97.5%) | 143 (2.5%) |
Income Below Poverty Among Single-Parent Households in Aiken
According to the poverty data in Aiken, 12.5% or 40 single-father households and 32.4% or 543 single-mother households are living below the poverty line. Among single-father households, those with 1 or 2 children have the highest poverty rate, with 30 households (16.6%) experiencing poverty. Likewise, among single-mother households, those with 5 or more children have the highest poverty rate, with 21 households (100.0%) falling below the poverty line.
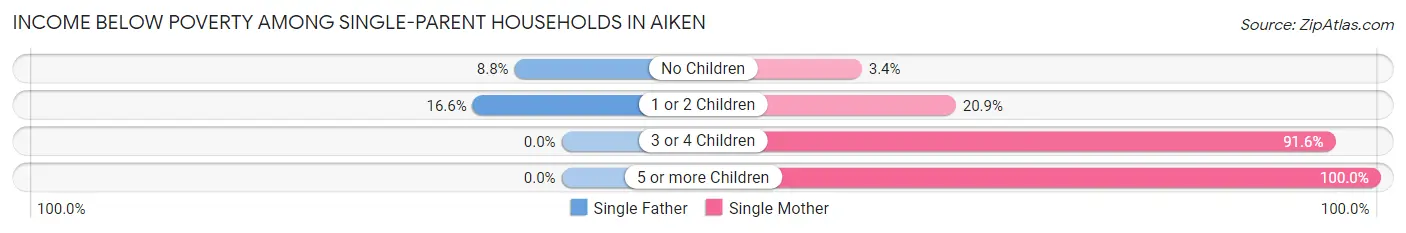
| Children | Single Father | Single Mother |
| No Children | 10 (8.8%) | 24 (3.4%) |
| 1 or 2 Children | 30 (16.6%) | 108 (20.9%) |
| 3 or 4 Children | 0 (0.0%) | 390 (91.5%) |
| 5 or more Children | 0 (0.0%) | 21 (100.0%) |
| Total | 40 (12.5%) | 543 (32.4%) |
Income Below Poverty Among Married-Couple vs Single-Parent Households in Aiken
The poverty data for Aiken shows that 143 of the married-couple family households (2.5%) and 583 of the single-parent households (29.2%) are living below the poverty level. Within the married-couple family households, those with 3 or 4 children have the highest poverty rate, with 52 households (21.5%) falling below the poverty line. Among the single-parent households, those with 5 or more children have the highest poverty rate, with 21 household (100.0%) living below poverty.
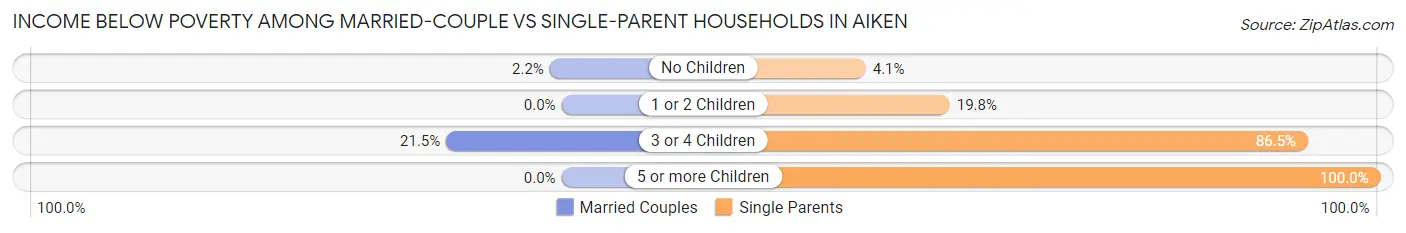
| Children | Married-Couple Families | Single-Parent Households |
| No Children | 91 (2.2%) | 34 (4.1%) |
| 1 or 2 Children | 0 (0.0%) | 138 (19.8%) |
| 3 or 4 Children | 52 (21.5%) | 390 (86.5%) |
| 5 or more Children | 0 (0.0%) | 21 (100.0%) |
| Total | 143 (2.5%) | 583 (29.2%) |
Race in Aiken
The most populous races in Aiken are White / Caucasian (18,418 | 57.5%), Black / African American (11,562 | 36.1%), and Two or more Races (1,047 | 3.3%).
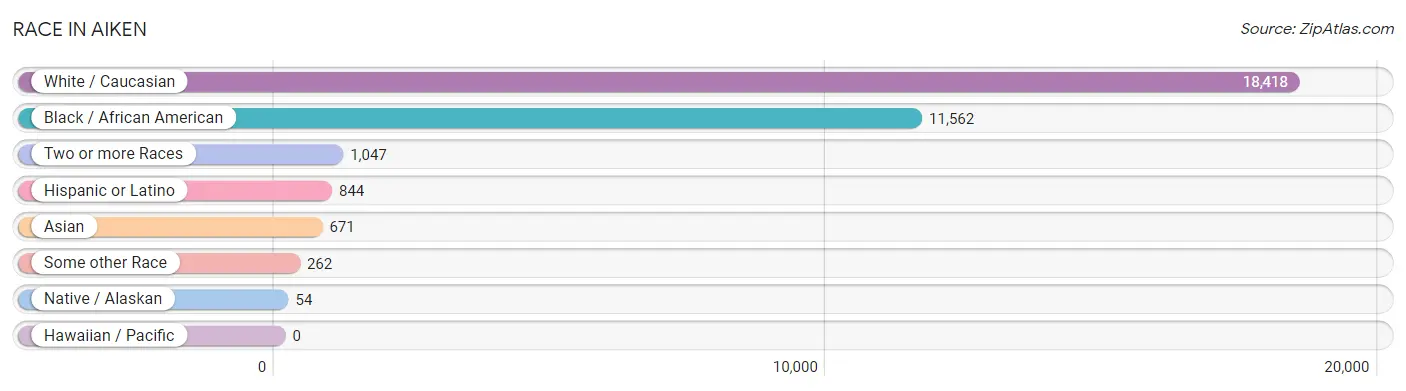
| Race | # Population | % Population |
| Asian | 671 | 2.1% |
| Black / African American | 11,562 | 36.1% |
| Hawaiian / Pacific | 0 | 0.0% |
| Hispanic or Latino | 844 | 2.6% |
| Native / Alaskan | 54 | 0.2% |
| White / Caucasian | 18,418 | 57.5% |
| Two or more Races | 1,047 | 3.3% |
| Some other Race | 262 | 0.8% |
| Total | 32,014 | 100.0% |
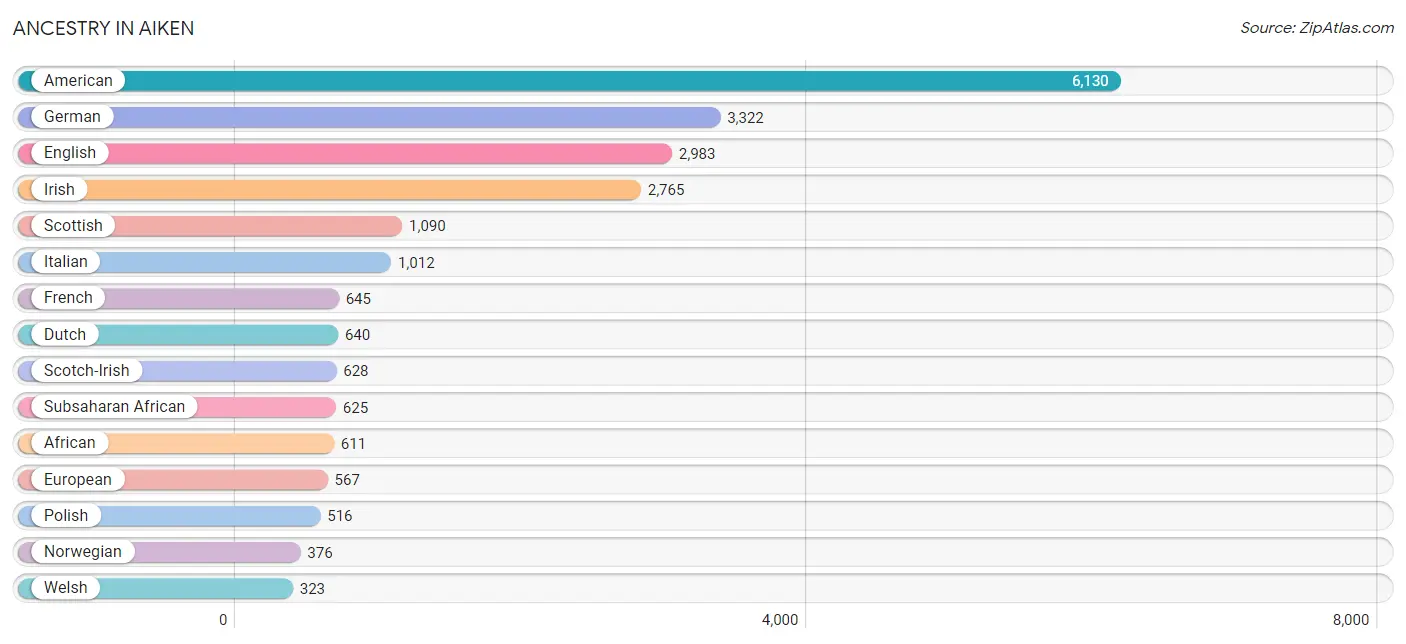
Ancestry in Aiken
The most populous ancestries reported in Aiken are American (6,130 | 19.2%), German (3,322 | 10.4%), English (2,983 | 9.3%), Irish (2,765 | 8.6%), and Scottish (1,090 | 3.4%), together accounting for 50.9% of all Aiken residents.
| Ancestry | # Population | % Population |
| African | 611 | 1.9% |
| Albanian | 123 | 0.4% |
| American | 6,130 | 19.2% |
| Arab | 17 | 0.1% |
| Armenian | 47 | 0.2% |
| Australian | 5 | 0.0% |
| Austrian | 61 | 0.2% |
| Bahamian | 40 | 0.1% |
| Bangladeshi | 4 | 0.0% |
| Basque | 1 | 0.0% |
| Belgian | 13 | 0.0% |
| Bhutanese | 153 | 0.5% |
| British | 174 | 0.5% |
| Burmese | 11 | 0.0% |
| Cajun | 34 | 0.1% |
| Canadian | 88 | 0.3% |
| Central American | 24 | 0.1% |
| Cherokee | 193 | 0.6% |
| Colombian | 9 | 0.0% |
| Croatian | 112 | 0.4% |
| Cuban | 319 | 1.0% |
| Czech | 173 | 0.5% |
| Czechoslovakian | 31 | 0.1% |
| Danish | 25 | 0.1% |
| Dominican | 6 | 0.0% |
| Dutch | 640 | 2.0% |
| Eastern European | 32 | 0.1% |
| Egyptian | 17 | 0.1% |
| English | 2,983 | 9.3% |
| European | 567 | 1.8% |
| Filipino | 28 | 0.1% |
| French | 645 | 2.0% |
| French Canadian | 25 | 0.1% |
| German | 3,322 | 10.4% |
| Greek | 100 | 0.3% |
| Guyanese | 29 | 0.1% |
| Honduran | 24 | 0.1% |
| Hungarian | 118 | 0.4% |
| Indian (Asian) | 173 | 0.5% |
| Iranian | 71 | 0.2% |
| Irish | 2,765 | 8.6% |
| Iroquois | 24 | 0.1% |
| Israeli | 15 | 0.1% |
| Italian | 1,012 | 3.2% |
| Jamaican | 219 | 0.7% |
| Korean | 163 | 0.5% |
| Latvian | 8 | 0.0% |
| Lithuanian | 29 | 0.1% |
| Mexican | 96 | 0.3% |
| Mexican American Indian | 1 | 0.0% |
| Nigerian | 14 | 0.0% |
| Northern European | 26 | 0.1% |
| Norwegian | 376 | 1.2% |
| Pennsylvania German | 18 | 0.1% |
| Polish | 516 | 1.6% |
| Portuguese | 25 | 0.1% |
| Puerto Rican | 299 | 0.9% |
| Russian | 94 | 0.3% |
| Scandinavian | 42 | 0.1% |
| Scotch-Irish | 628 | 2.0% |
| Scottish | 1,090 | 3.4% |
| Serbian | 25 | 0.1% |
| Sioux | 10 | 0.0% |
| Slavic | 42 | 0.1% |
| Slovak | 62 | 0.2% |
| Slovene | 39 | 0.1% |
| South American | 20 | 0.1% |
| Spaniard | 33 | 0.1% |
| Spanish | 35 | 0.1% |
| Sri Lankan | 252 | 0.8% |
| Subsaharan African | 625 | 1.9% |
| Swedish | 142 | 0.4% |
| Swiss | 68 | 0.2% |
| Thai | 10 | 0.0% |
| Ukrainian | 39 | 0.1% |
| Venezuelan | 11 | 0.0% |
| Welsh | 323 | 1.0% |
| West Indian | 18 | 0.1% |
| Yugoslavian | 13 | 0.0% | View All 79 Rows |
Immigrants in Aiken
The most numerous immigrant groups reported in Aiken came from Asia (544 | 1.7%), Europe (313 | 1.0%), Latin America (256 | 0.8%), South Eastern Asia (247 | 0.8%), and Eastern Asia (227 | 0.7%), together accounting for 5.0% of all Aiken residents.
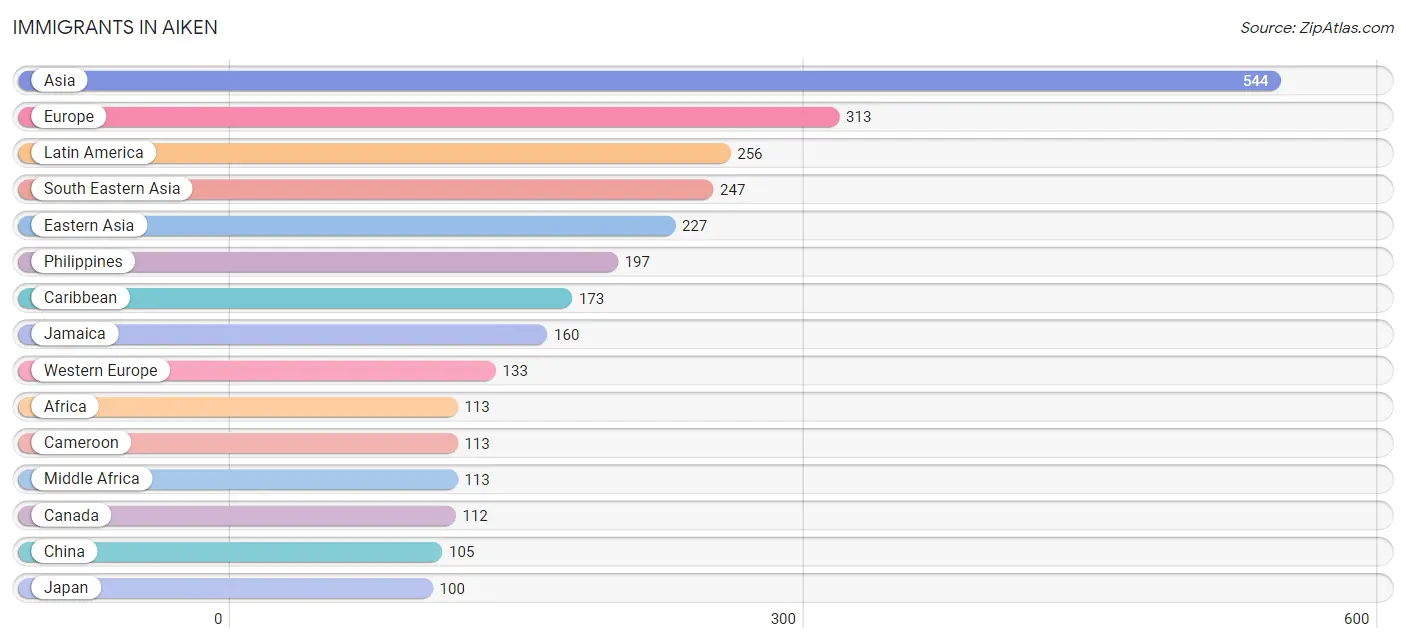
| Immigration Origin | # Population | % Population |
| Africa | 113 | 0.4% |
| Asia | 544 | 1.7% |
| Australia | 15 | 0.1% |
| Brazil | 14 | 0.0% |
| Cameroon | 113 | 0.4% |
| Canada | 112 | 0.4% |
| Caribbean | 173 | 0.5% |
| Central America | 40 | 0.1% |
| China | 105 | 0.3% |
| Cuba | 12 | 0.0% |
| Eastern Asia | 227 | 0.7% |
| Eastern Europe | 58 | 0.2% |
| England | 11 | 0.0% |
| Europe | 313 | 1.0% |
| France | 22 | 0.1% |
| Germany | 64 | 0.2% |
| Greece | 68 | 0.2% |
| Guyana | 29 | 0.1% |
| Honduras | 27 | 0.1% |
| India | 23 | 0.1% |
| Iran | 47 | 0.2% |
| Jamaica | 160 | 0.5% |
| Japan | 100 | 0.3% |
| Korea | 22 | 0.1% |
| Latin America | 256 | 0.8% |
| Mexico | 13 | 0.0% |
| Middle Africa | 113 | 0.4% |
| Netherlands | 47 | 0.2% |
| Northern Europe | 35 | 0.1% |
| Oceania | 15 | 0.1% |
| Philippines | 197 | 0.6% |
| Portugal | 18 | 0.1% |
| Russia | 48 | 0.2% |
| Scotland | 7 | 0.0% |
| Serbia | 10 | 0.0% |
| South America | 43 | 0.1% |
| South Central Asia | 70 | 0.2% |
| South Eastern Asia | 247 | 0.8% |
| Southern Europe | 87 | 0.3% |
| Spain | 1 | 0.0% |
| Trinidad and Tobago | 1 | 0.0% |
| Vietnam | 50 | 0.2% |
| Western Europe | 133 | 0.4% | View All 43 Rows |
Sex and Age in Aiken
Sex and Age in Aiken
The most populous age groups in Aiken are 65 to 69 Years (1,168 | 8.0%) for men and 65 to 69 Years (1,413 | 8.1%) for women.
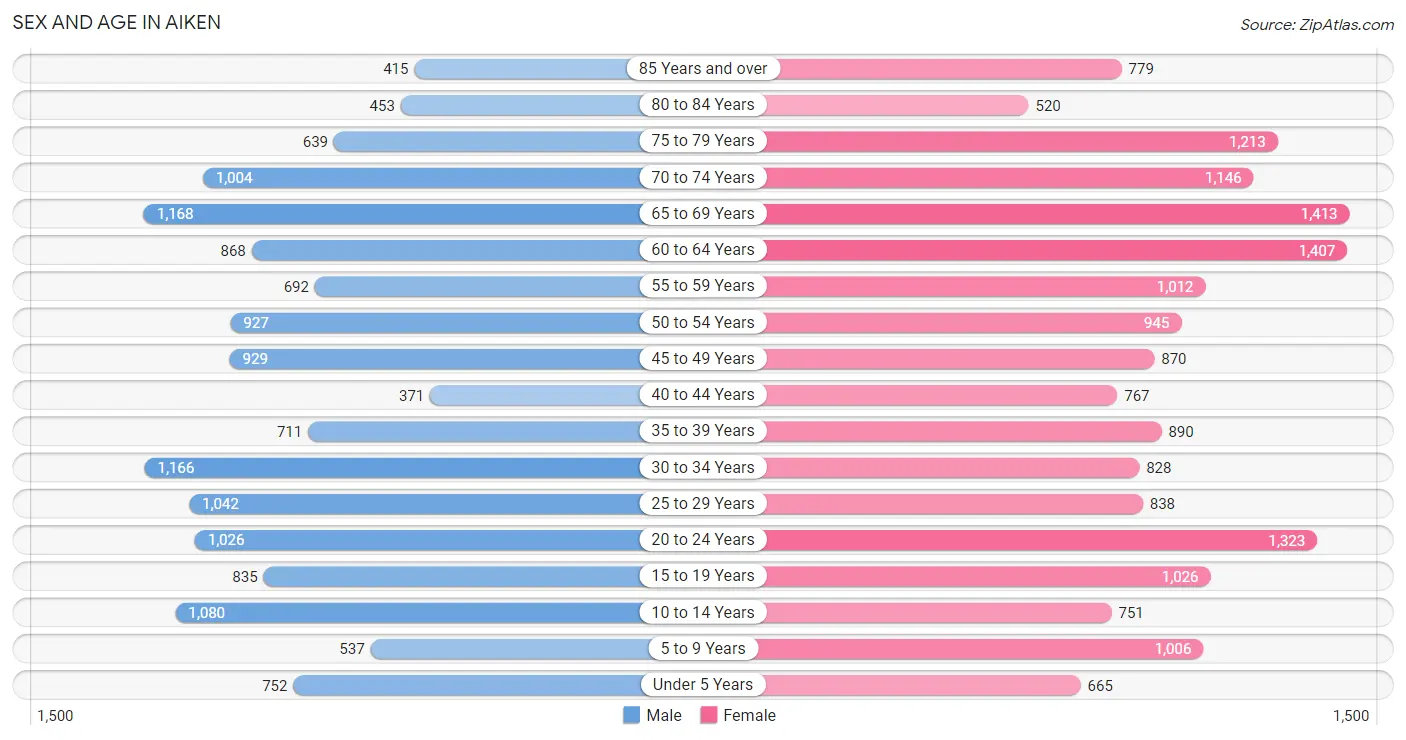
| Age Bracket | Male | Female |
| Under 5 Years | 752 (5.1%) | 665 (3.8%) |
| 5 to 9 Years | 537 (3.7%) | 1,006 (5.8%) |
| 10 to 14 Years | 1,080 (7.4%) | 751 (4.3%) |
| 15 to 19 Years | 835 (5.7%) | 1,026 (5.9%) |
| 20 to 24 Years | 1,026 (7.0%) | 1,323 (7.6%) |
| 25 to 29 Years | 1,042 (7.1%) | 838 (4.8%) |
| 30 to 34 Years | 1,166 (8.0%) | 828 (4.8%) |
| 35 to 39 Years | 711 (4.9%) | 890 (5.1%) |
| 40 to 44 Years | 371 (2.5%) | 767 (4.4%) |
| 45 to 49 Years | 929 (6.4%) | 870 (5.0%) |
| 50 to 54 Years | 927 (6.3%) | 945 (5.4%) |
| 55 to 59 Years | 692 (4.7%) | 1,012 (5.8%) |
| 60 to 64 Years | 868 (5.9%) | 1,407 (8.1%) |
| 65 to 69 Years | 1,168 (8.0%) | 1,413 (8.1%) |
| 70 to 74 Years | 1,004 (6.9%) | 1,146 (6.6%) |
| 75 to 79 Years | 639 (4.4%) | 1,213 (7.0%) |
| 80 to 84 Years | 453 (3.1%) | 520 (3.0%) |
| 85 Years and over | 415 (2.8%) | 779 (4.5%) |
| Total | 14,615 (100.0%) | 17,399 (100.0%) |
Families and Households in Aiken
Median Family Size in Aiken
The median family size in Aiken is 3.07 persons per family, with single female/mother families (1,676 | 22.0%) accounting for the largest median family size of 3.5 persons per family. On the other hand, married-couple families (5,637 | 73.9%) represent the smallest median family size with 2.95 persons per family.
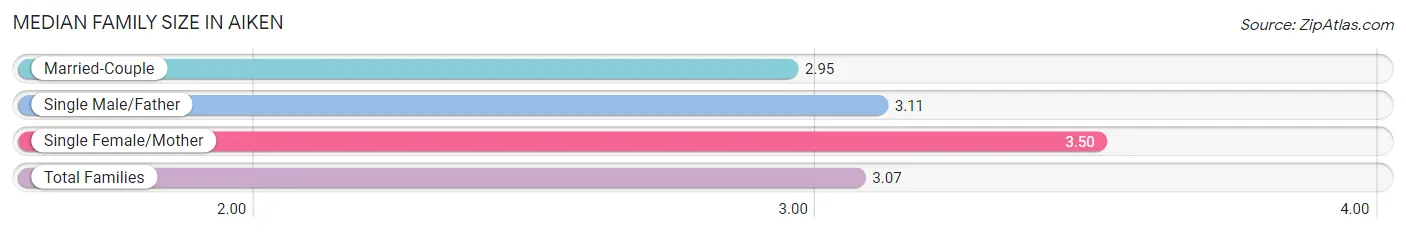
| Family Type | # Families | Family Size |
| Married-Couple | 5,637 (73.9%) | 2.95 |
| Single Male/Father | 320 (4.2%) | 3.11 |
| Single Female/Mother | 1,676 (22.0%) | 3.50 |
| Total Families | 7,633 (100.0%) | 3.07 |
Median Household Size in Aiken
The median household size in Aiken is 2.34 persons per household, with single female/mother households (1,676 | 12.9%) accounting for the largest median household size of 3.64 persons per household. non-family households (5,320 | 41.1%) represent the smallest median household size with 1.22 persons per household.
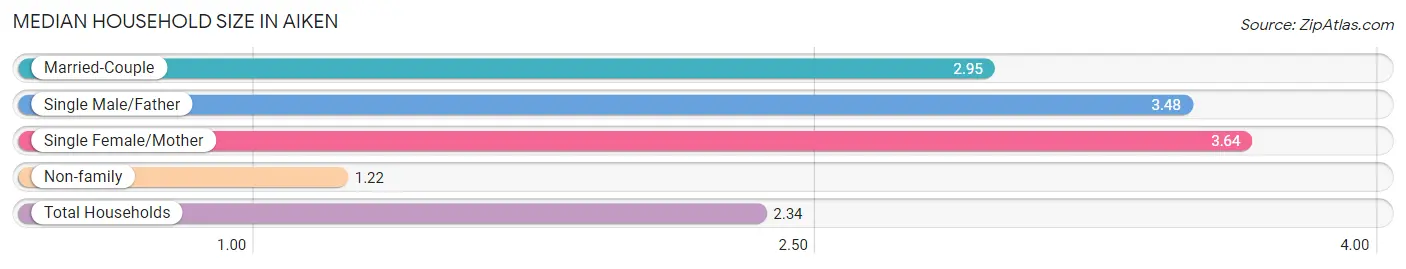
| Household Type | # Households | Household Size |
| Married-Couple | 5,637 (43.5%) | 2.95 |
| Single Male/Father | 320 (2.5%) | 3.48 |
| Single Female/Mother | 1,676 (12.9%) | 3.64 |
| Non-family | 5,320 (41.1%) | 1.22 |
| Total Households | 12,953 (100.0%) | 2.34 |
Household Size by Marriage Status in Aiken
Out of a total of 12,953 households in Aiken, 7,633 (58.9%) are family households, while 5,320 (41.1%) are nonfamily households. The most numerous type of family households are 2-person households, comprising 4,157, and the most common type of nonfamily households are 1-person households, comprising 4,451.
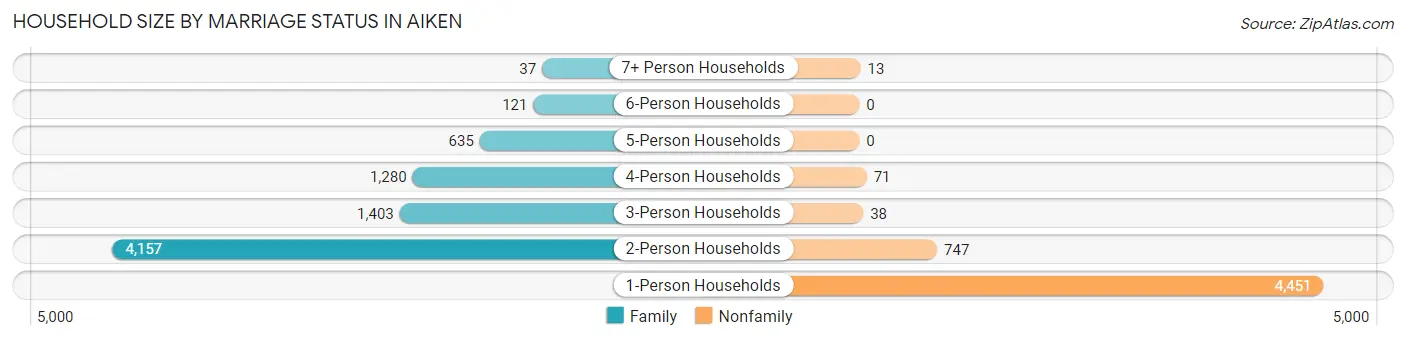
| Household Size | Family Households | Nonfamily Households |
| 1-Person Households | - | 4,451 (34.4%) |
| 2-Person Households | 4,157 (32.1%) | 747 (5.8%) |
| 3-Person Households | 1,403 (10.8%) | 38 (0.3%) |
| 4-Person Households | 1,280 (9.9%) | 71 (0.5%) |
| 5-Person Households | 635 (4.9%) | 0 (0.0%) |
| 6-Person Households | 121 (0.9%) | 0 (0.0%) |
| 7+ Person Households | 37 (0.3%) | 13 (0.1%) |
| Total | 7,633 (58.9%) | 5,320 (41.1%) |
Female Fertility in Aiken
Fertility by Age in Aiken
Average fertility rate in Aiken is 48.0 births per 1,000 women. Women in the age bracket of 20 to 34 years have the highest fertility rate with 62.0 births per 1,000 women. Women in the age bracket of 20 to 34 years acount for 58.6% of all women with births.
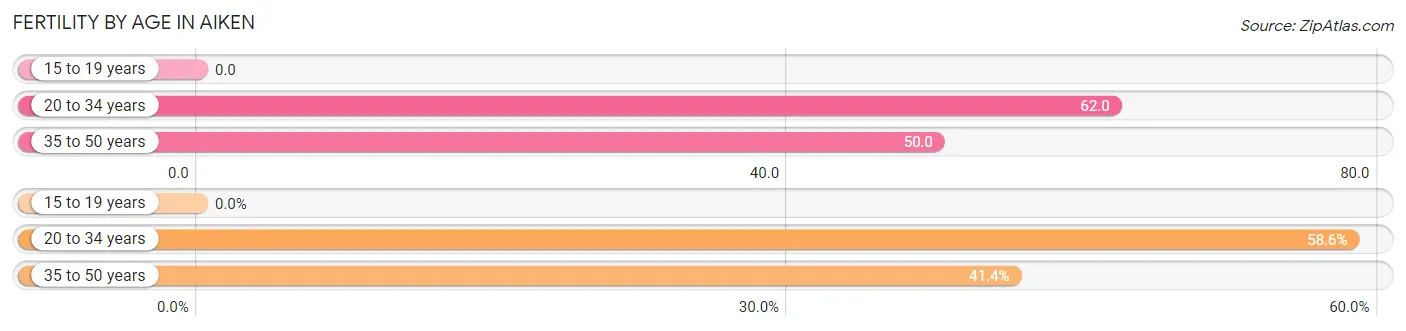
| Age Bracket | Women with Births | Births / 1,000 Women |
| 15 to 19 years | 0 (0.0%) | 0.0 |
| 20 to 34 years | 184 (58.6%) | 62.0 |
| 35 to 50 years | 130 (41.4%) | 50.0 |
| Total | 314 (100.0%) | 48.0 |
Fertility by Age by Marriage Status in Aiken
35.7% of women with births (314) in Aiken are married. The highest percentage of unmarried women with births falls into 35 to 50 years age bracket with 100.0% of them unmarried at the time of birth, while the lowest percentage of unmarried women with births belong to 20 to 34 years age bracket with 39.1% of them unmarried.
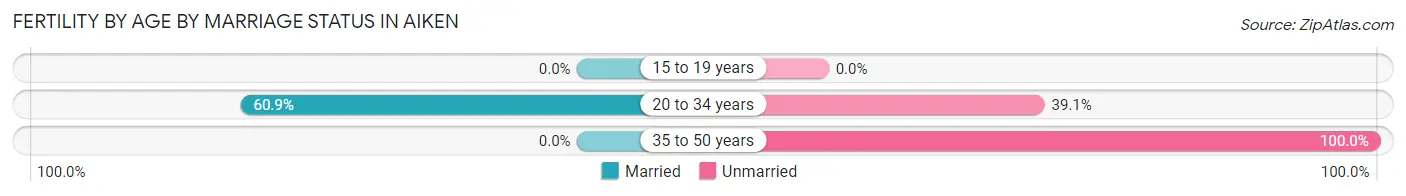
| Age Bracket | Married | Unmarried |
| 15 to 19 years | 0 (0.0%) | 0 (0.0%) |
| 20 to 34 years | 112 (60.9%) | 72 (39.1%) |
| 35 to 50 years | 0 (0.0%) | 130 (100.0%) |
| Total | 112 (35.7%) | 202 (64.3%) |
Fertility by Education in Aiken
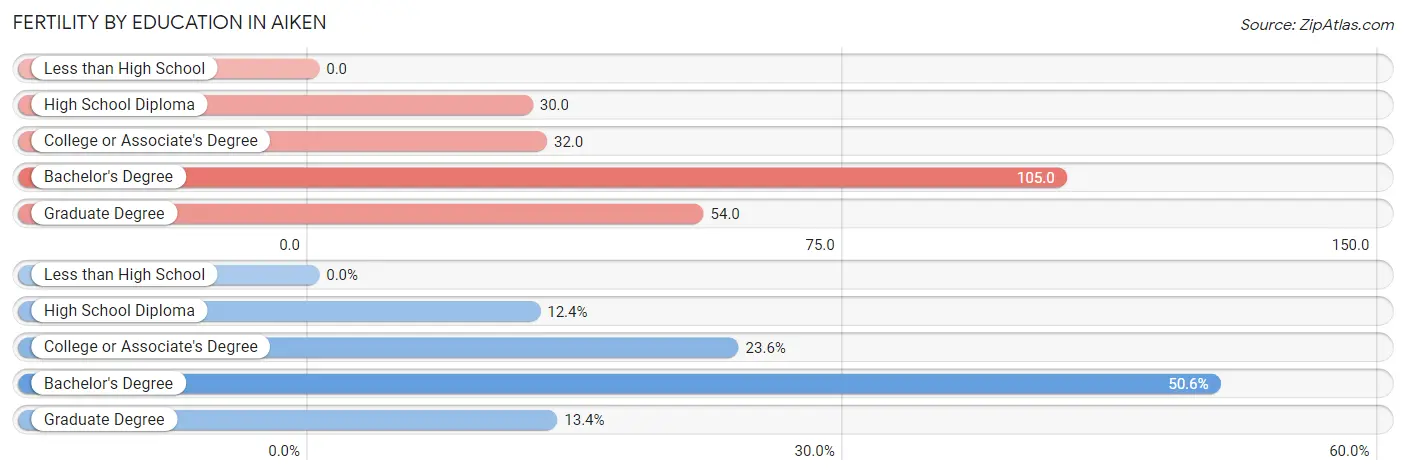
| Educational Attainment | Women with Births | Births / 1,000 Women |
| Less than High School | 0 (0.0%) | 0.0 |
| High School Diploma | 39 (12.4%) | 30.0 |
| College or Associate's Degree | 74 (23.6%) | 32.0 |
| Bachelor's Degree | 159 (50.6%) | 105.0 |
| Graduate Degree | 42 (13.4%) | 54.0 |
| Total | 314 (100.0%) | 48.0 |
Fertility by Education by Marriage Status in Aiken
64.3% of women with births in Aiken are unmarried. Women with the educational attainment of graduate degree are most likely to be married with 100.0% of them married at childbirth, while women with the educational attainment of high school diploma are least likely to be married with 100.0% of them unmarried at childbirth.
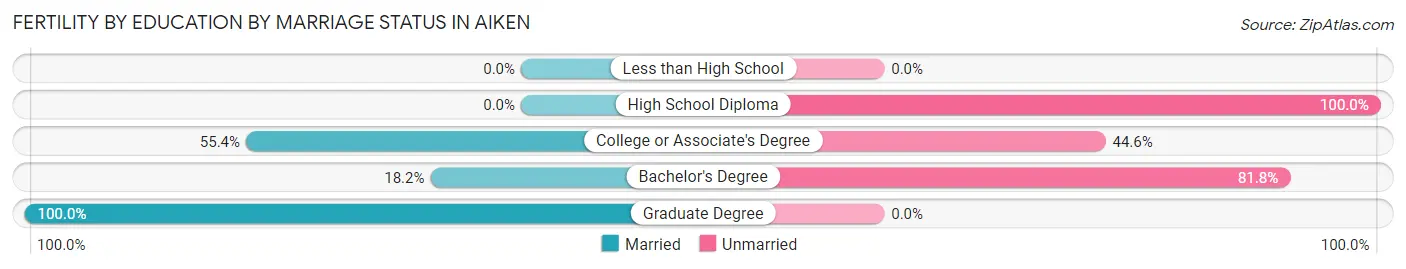
| Educational Attainment | Married | Unmarried |
| Less than High School | 0 (0.0%) | 0 (0.0%) |
| High School Diploma | 0 (0.0%) | 39 (100.0%) |
| College or Associate's Degree | 41 (55.4%) | 33 (44.6%) |
| Bachelor's Degree | 29 (18.2%) | 130 (81.8%) |
| Graduate Degree | 42 (100.0%) | 0 (0.0%) |
| Total | 112 (35.7%) | 202 (64.3%) |
Employment Characteristics in Aiken
Employment by Class of Employer in Aiken
Among the 14,082 employed individuals in Aiken, private company employees (9,162 | 65.1%), local government employees (1,294 | 9.2%), and state government employees (982 | 7.0%) make up the most common classes of employment.
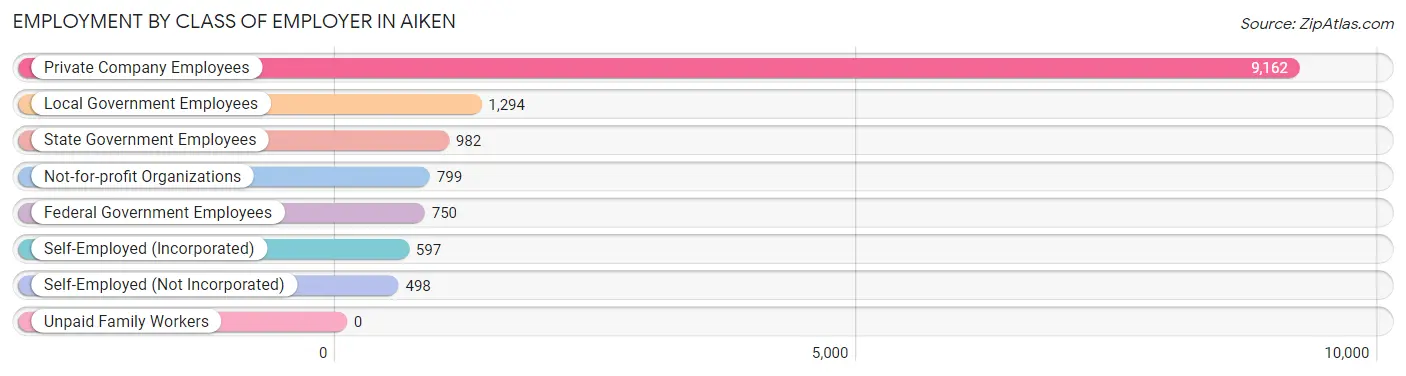
| Employer Class | # Employees | % Employees |
| Private Company Employees | 9,162 | 65.1% |
| Self-Employed (Incorporated) | 597 | 4.2% |
| Self-Employed (Not Incorporated) | 498 | 3.5% |
| Not-for-profit Organizations | 799 | 5.7% |
| Local Government Employees | 1,294 | 9.2% |
| State Government Employees | 982 | 7.0% |
| Federal Government Employees | 750 | 5.3% |
| Unpaid Family Workers | 0 | 0.0% |
| Total | 14,082 | 100.0% |
Employment Status by Age in Aiken
According to the labor force statistics for Aiken, out of the total population over 16 years of age (26,946), 55.0% or 14,820 individuals are in the labor force, with 3.9% or 578 of them unemployed. The age group with the highest labor force participation rate is 25 to 29 years, with 92.0% or 1,730 individuals in the labor force. Within the labor force, the 25 to 29 years age range has the highest percentage of unemployed individuals, with 12.9% or 223 of them being unemployed.
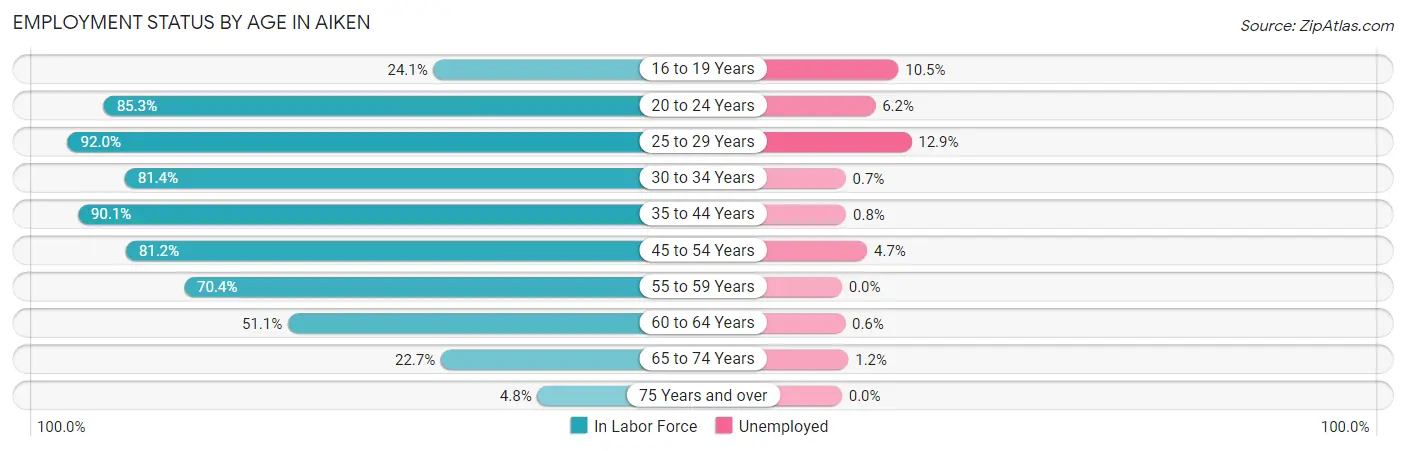
| Age Bracket | In Labor Force | Unemployed |
| 16 to 19 Years | 382 (24.1%) | 40 (10.5%) |
| 20 to 24 Years | 2,004 (85.3%) | 124 (6.2%) |
| 25 to 29 Years | 1,730 (92.0%) | 223 (12.9%) |
| 30 to 34 Years | 1,623 (81.4%) | 11 (0.7%) |
| 35 to 44 Years | 2,468 (90.1%) | 20 (0.8%) |
| 45 to 54 Years | 2,981 (81.2%) | 140 (4.7%) |
| 55 to 59 Years | 1,200 (70.4%) | 0 (0.0%) |
| 60 to 64 Years | 1,163 (51.1%) | 7 (0.6%) |
| 65 to 74 Years | 1,074 (22.7%) | 13 (1.2%) |
| 75 Years and over | 193 (4.8%) | 0 (0.0%) |
| Total | 14,820 (55.0%) | 578 (3.9%) |
Employment Status by Educational Attainment in Aiken
According to labor force statistics for Aiken, 78.3% of individuals (11,168) out of the total population between 25 and 64 years of age (14,263) are in the labor force, with 3.6% or 402 of them being unemployed. The group with the highest labor force participation rate are those with the educational attainment of bachelor's degree or higher, with 84.8% or 4,635 individuals in the labor force. Within the labor force, individuals with college / associate degree education have the highest percentage of unemployment, with 9.1% or 303 of them being unemployed.
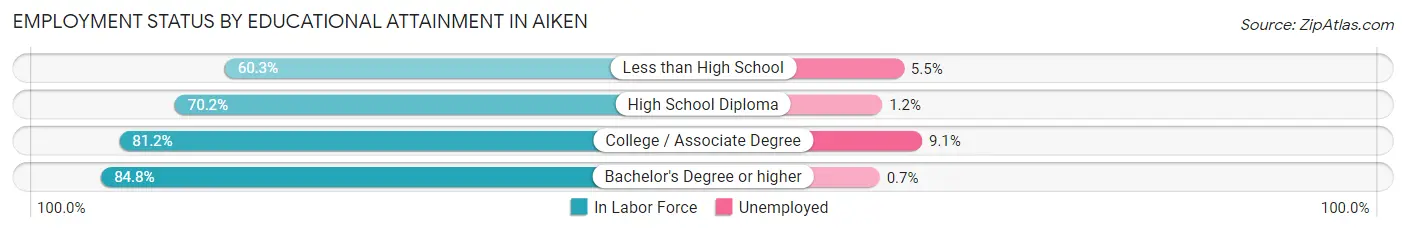
| Educational Attainment | In Labor Force | Unemployed |
| Less than High School | 603 (60.3%) | 55 (5.5%) |
| High School Diploma | 2,599 (70.2%) | 44 (1.2%) |
| College / Associate Degree | 3,325 (81.2%) | 373 (9.1%) |
| Bachelor's Degree or higher | 4,635 (84.8%) | 38 (0.7%) |
| Total | 11,168 (78.3%) | 513 (3.6%) |
Employment Occupations by Sex in Aiken
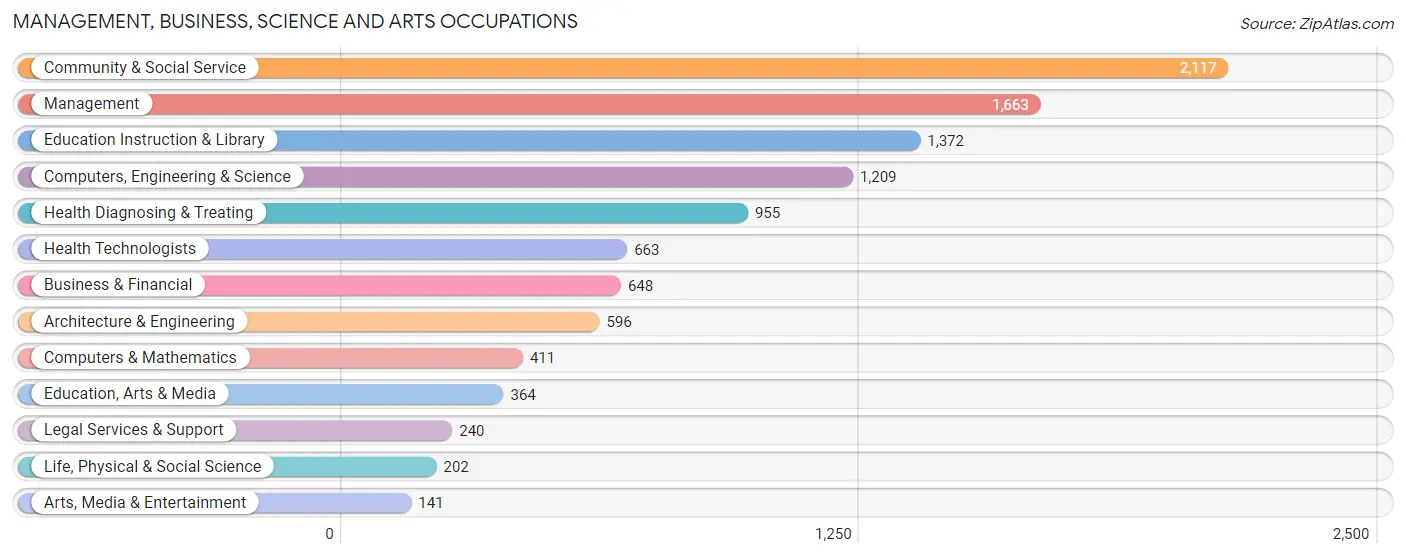
Management, Business, Science and Arts Occupations
The most common Management, Business, Science and Arts occupations in Aiken are Community & Social Service (2,117 | 14.9%), Management (1,663 | 11.7%), Education Instruction & Library (1,372 | 9.7%), Computers, Engineering & Science (1,209 | 8.5%), and Health Diagnosing & Treating (955 | 6.7%).
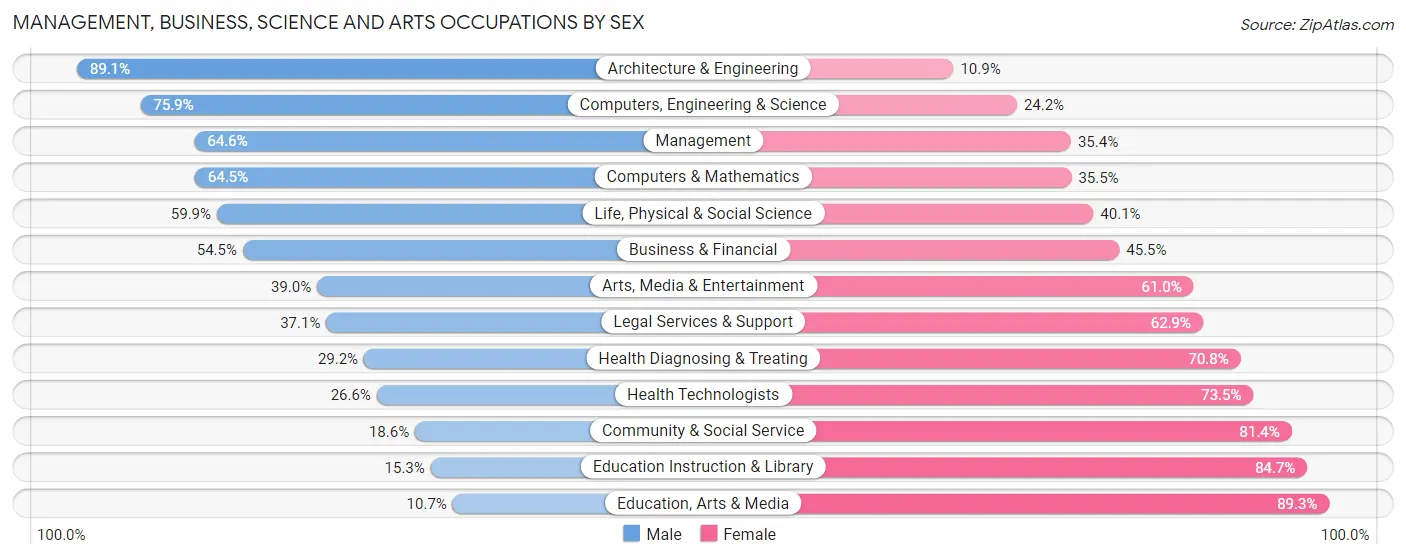
Management, Business, Science and Arts Occupations by Sex
Within the Management, Business, Science and Arts occupations in Aiken, the most male-oriented occupations are Architecture & Engineering (89.1%), Computers, Engineering & Science (75.8%), and Management (64.6%), while the most female-oriented occupations are Education, Arts & Media (89.3%), Education Instruction & Library (84.7%), and Community & Social Service (81.4%).
| Occupation | Male | Female |
| Management | 1,074 (64.6%) | 589 (35.4%) |
| Business & Financial | 353 (54.5%) | 295 (45.5%) |
| Computers, Engineering & Science | 917 (75.8%) | 292 (24.1%) |
| Computers & Mathematics | 265 (64.5%) | 146 (35.5%) |
| Architecture & Engineering | 531 (89.1%) | 65 (10.9%) |
| Life, Physical & Social Science | 121 (59.9%) | 81 (40.1%) |
| Community & Social Service | 393 (18.6%) | 1,724 (81.4%) |
| Education, Arts & Media | 39 (10.7%) | 325 (89.3%) |
| Legal Services & Support | 89 (37.1%) | 151 (62.9%) |
| Education Instruction & Library | 210 (15.3%) | 1,162 (84.7%) |
| Arts, Media & Entertainment | 55 (39.0%) | 86 (61.0%) |
| Health Diagnosing & Treating | 279 (29.2%) | 676 (70.8%) |
| Health Technologists | 176 (26.6%) | 487 (73.5%) |
| Total (Category) | 3,016 (45.8%) | 3,576 (54.2%) |
| Total (Overall) | 6,913 (48.7%) | 7,284 (51.3%) |
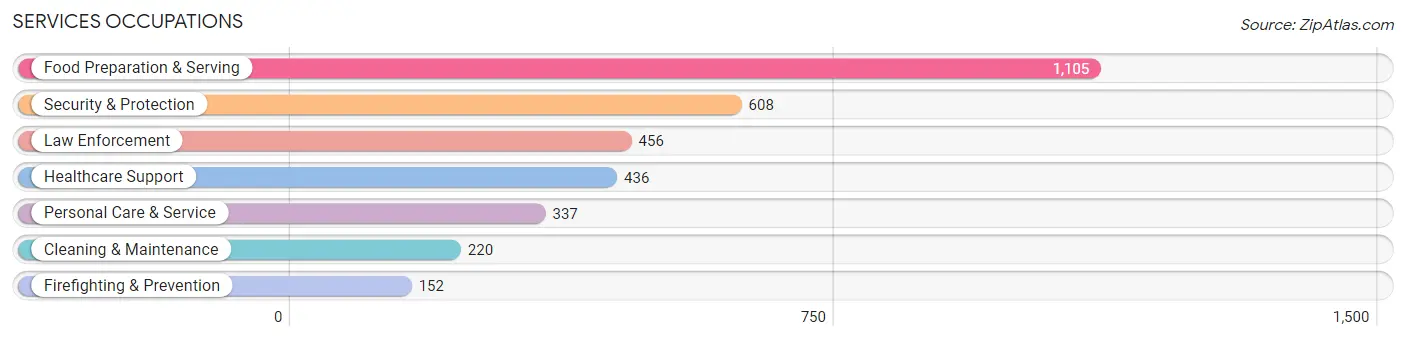
Services Occupations
The most common Services occupations in Aiken are Food Preparation & Serving (1,105 | 7.8%), Security & Protection (608 | 4.3%), Law Enforcement (456 | 3.2%), Healthcare Support (436 | 3.1%), and Personal Care & Service (337 | 2.4%).
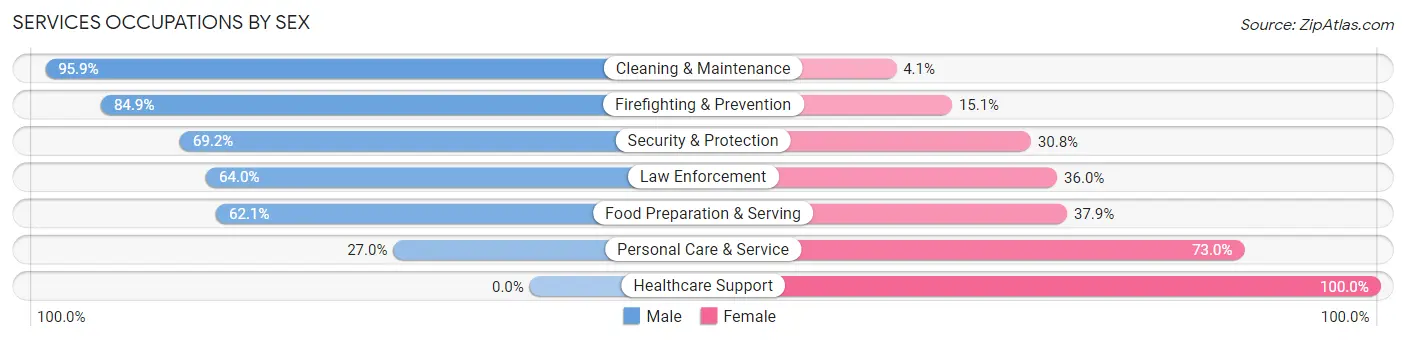
Services Occupations by Sex
Within the Services occupations in Aiken, the most male-oriented occupations are Cleaning & Maintenance (95.9%), Firefighting & Prevention (84.9%), and Security & Protection (69.2%), while the most female-oriented occupations are Healthcare Support (100.0%), Personal Care & Service (73.0%), and Food Preparation & Serving (37.9%).
| Occupation | Male | Female |
| Healthcare Support | 0 (0.0%) | 436 (100.0%) |
| Security & Protection | 421 (69.2%) | 187 (30.8%) |
| Firefighting & Prevention | 129 (84.9%) | 23 (15.1%) |
| Law Enforcement | 292 (64.0%) | 164 (36.0%) |
| Food Preparation & Serving | 686 (62.1%) | 419 (37.9%) |
| Cleaning & Maintenance | 211 (95.9%) | 9 (4.1%) |
| Personal Care & Service | 91 (27.0%) | 246 (73.0%) |
| Total (Category) | 1,409 (52.1%) | 1,297 (47.9%) |
| Total (Overall) | 6,913 (48.7%) | 7,284 (51.3%) |
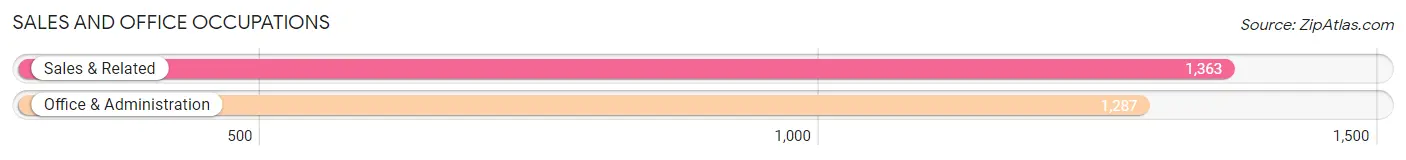
Sales and Office Occupations
The most common Sales and Office occupations in Aiken are Sales & Related (1,363 | 9.6%), and Office & Administration (1,287 | 9.1%).
Sales and Office Occupations by Sex
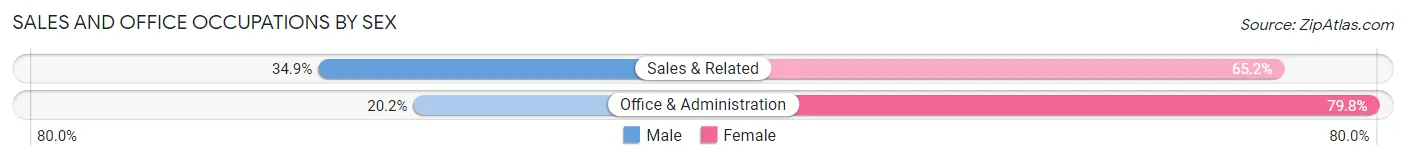
| Occupation | Male | Female |
| Sales & Related | 475 (34.8%) | 888 (65.1%) |
| Office & Administration | 260 (20.2%) | 1,027 (79.8%) |
| Total (Category) | 735 (27.7%) | 1,915 (72.3%) |
| Total (Overall) | 6,913 (48.7%) | 7,284 (51.3%) |
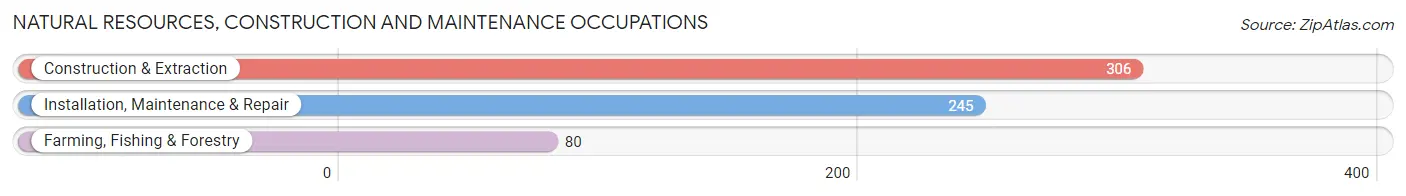
Natural Resources, Construction and Maintenance Occupations
The most common Natural Resources, Construction and Maintenance occupations in Aiken are Construction & Extraction (306 | 2.2%), Installation, Maintenance & Repair (245 | 1.7%), and Farming, Fishing & Forestry (80 | 0.6%).
Natural Resources, Construction and Maintenance Occupations by Sex
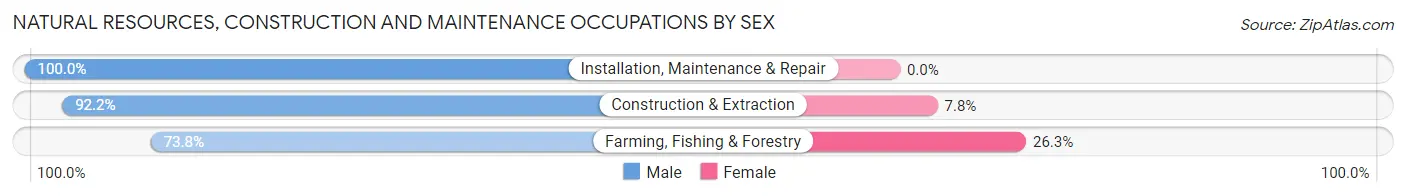
| Occupation | Male | Female |
| Farming, Fishing & Forestry | 59 (73.8%) | 21 (26.3%) |
| Construction & Extraction | 282 (92.2%) | 24 (7.8%) |
| Installation, Maintenance & Repair | 245 (100.0%) | 0 (0.0%) |
| Total (Category) | 586 (92.9%) | 45 (7.1%) |
| Total (Overall) | 6,913 (48.7%) | 7,284 (51.3%) |
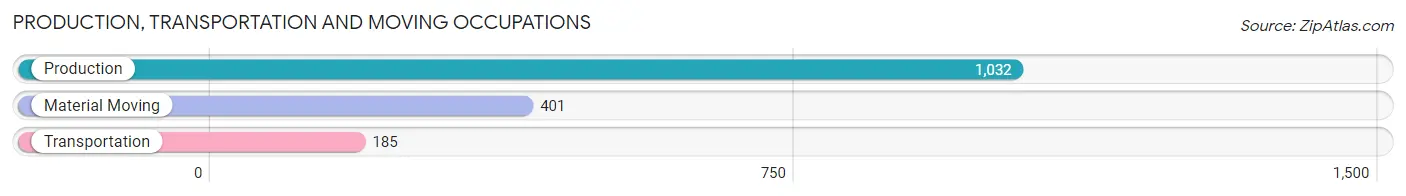
Production, Transportation and Moving Occupations
The most common Production, Transportation and Moving occupations in Aiken are Production (1,032 | 7.3%), Material Moving (401 | 2.8%), and Transportation (185 | 1.3%).
Production, Transportation and Moving Occupations by Sex
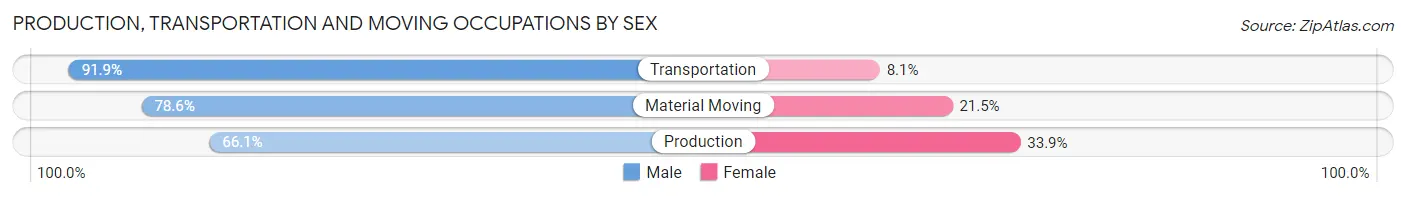
| Occupation | Male | Female |
| Production | 682 (66.1%) | 350 (33.9%) |
| Transportation | 170 (91.9%) | 15 (8.1%) |
| Material Moving | 315 (78.5%) | 86 (21.4%) |
| Total (Category) | 1,167 (72.1%) | 451 (27.9%) |
| Total (Overall) | 6,913 (48.7%) | 7,284 (51.3%) |
Employment Industries by Sex in Aiken
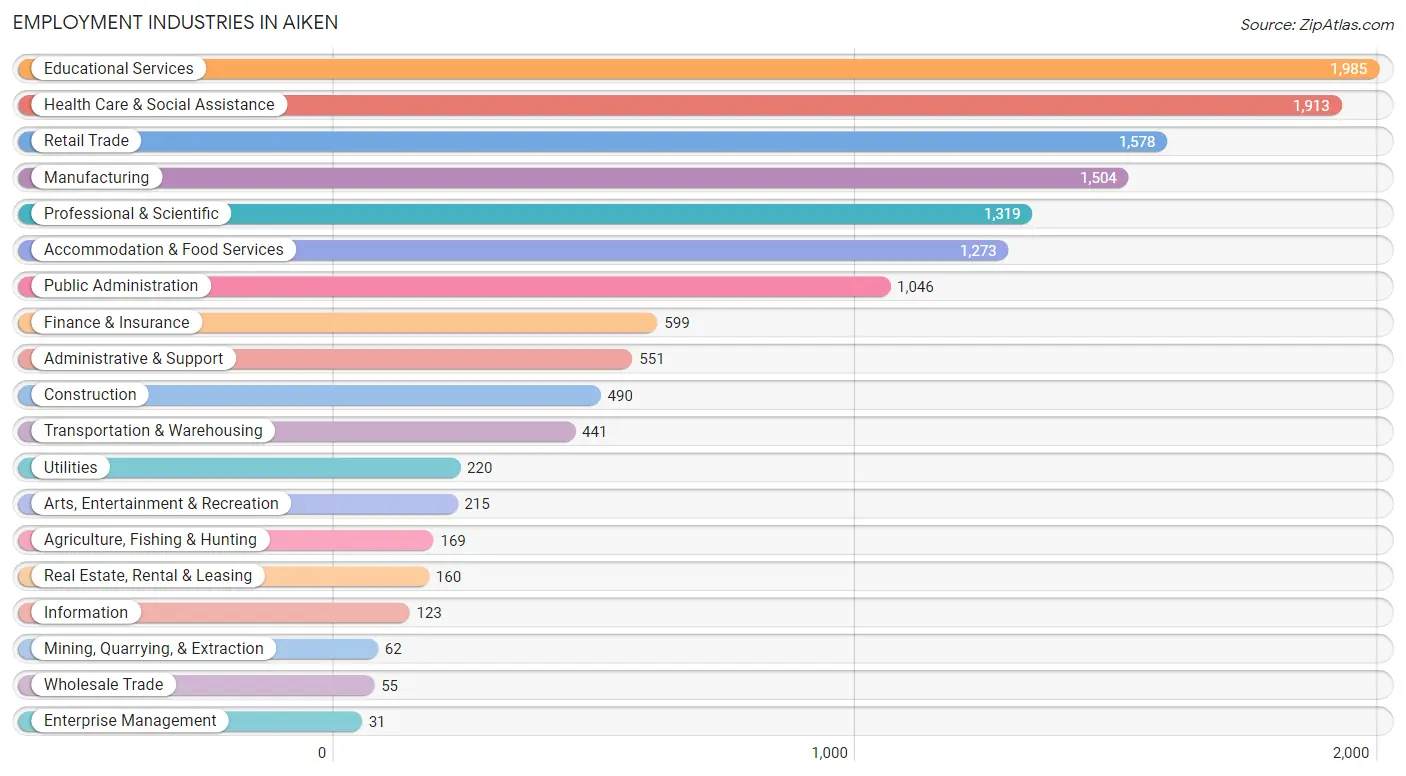
Employment Industries in Aiken
The major employment industries in Aiken include Educational Services (1,985 | 14.0%), Health Care & Social Assistance (1,913 | 13.5%), Retail Trade (1,578 | 11.1%), Manufacturing (1,504 | 10.6%), and Professional & Scientific (1,319 | 9.3%).
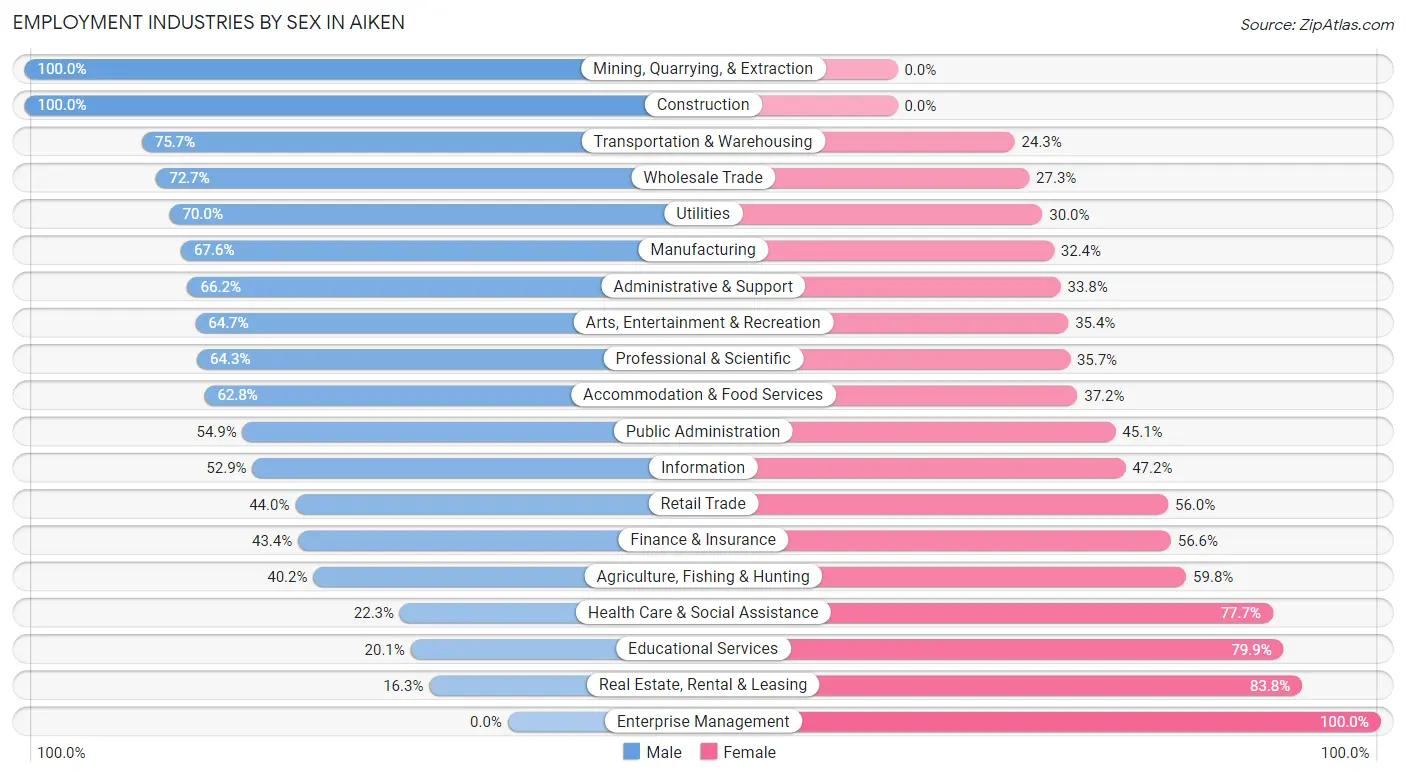
Employment Industries by Sex in Aiken
The Aiken industries that see more men than women are Mining, Quarrying, & Extraction (100.0%), Construction (100.0%), and Transportation & Warehousing (75.7%), whereas the industries that tend to have a higher number of women are Enterprise Management (100.0%), Real Estate, Rental & Leasing (83.8%), and Educational Services (79.9%).
| Industry | Male | Female |
| Agriculture, Fishing & Hunting | 68 (40.2%) | 101 (59.8%) |
| Mining, Quarrying, & Extraction | 62 (100.0%) | 0 (0.0%) |
| Construction | 490 (100.0%) | 0 (0.0%) |
| Manufacturing | 1,017 (67.6%) | 487 (32.4%) |
| Wholesale Trade | 40 (72.7%) | 15 (27.3%) |
| Retail Trade | 694 (44.0%) | 884 (56.0%) |
| Transportation & Warehousing | 334 (75.7%) | 107 (24.3%) |
| Utilities | 154 (70.0%) | 66 (30.0%) |
| Information | 65 (52.8%) | 58 (47.1%) |
| Finance & Insurance | 260 (43.4%) | 339 (56.6%) |
| Real Estate, Rental & Leasing | 26 (16.3%) | 134 (83.8%) |
| Professional & Scientific | 848 (64.3%) | 471 (35.7%) |
| Enterprise Management | 0 (0.0%) | 31 (100.0%) |
| Administrative & Support | 365 (66.2%) | 186 (33.8%) |
| Educational Services | 399 (20.1%) | 1,586 (79.9%) |
| Health Care & Social Assistance | 427 (22.3%) | 1,486 (77.7%) |
| Arts, Entertainment & Recreation | 139 (64.6%) | 76 (35.3%) |
| Accommodation & Food Services | 799 (62.8%) | 474 (37.2%) |
| Public Administration | 574 (54.9%) | 472 (45.1%) |
| Total | 6,913 (48.7%) | 7,284 (51.3%) |
Education in Aiken
School Enrollment in Aiken
The most common levels of schooling among the 7,515 students in Aiken are college / undergraduate (2,652 | 35.3%), middle school (1,612 | 21.4%), and elementary school (1,248 | 16.6%).
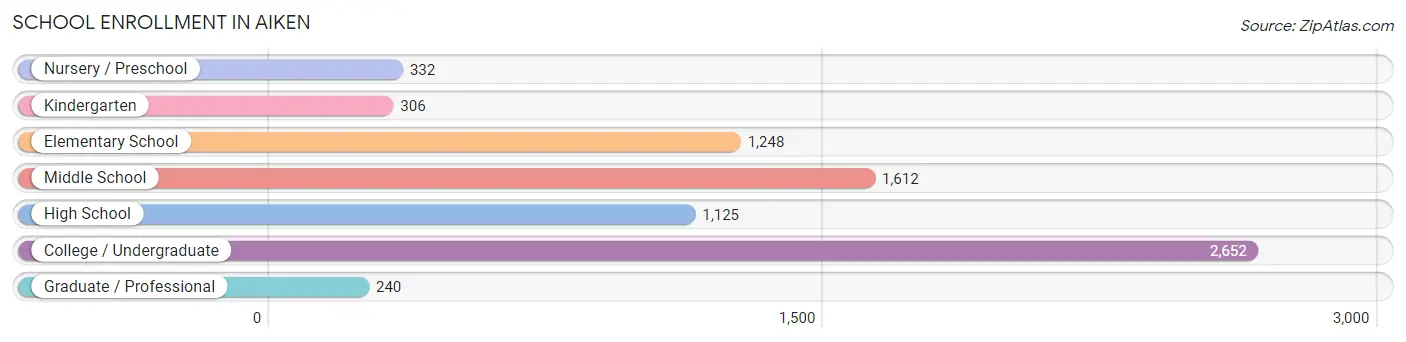
| School Level | # Students | % Students |
| Nursery / Preschool | 332 | 4.4% |
| Kindergarten | 306 | 4.1% |
| Elementary School | 1,248 | 16.6% |
| Middle School | 1,612 | 21.4% |
| High School | 1,125 | 15.0% |
| College / Undergraduate | 2,652 | 35.3% |
| Graduate / Professional | 240 | 3.2% |
| Total | 7,515 | 100.0% |
School Enrollment by Age by Funding Source in Aiken
Out of a total of 7,515 students who are enrolled in schools in Aiken, 1,330 (17.7%) attend a private institution, while the remaining 6,185 (82.3%) are enrolled in public schools. The age group of 3 to 4 year olds has the highest likelihood of being enrolled in private schools, with 143 (46.1% in the age bracket) enrolled. Conversely, the age group of 35 years and over has the lowest likelihood of being enrolled in a private school, with 220 (97.4% in the age bracket) attending a public institution.
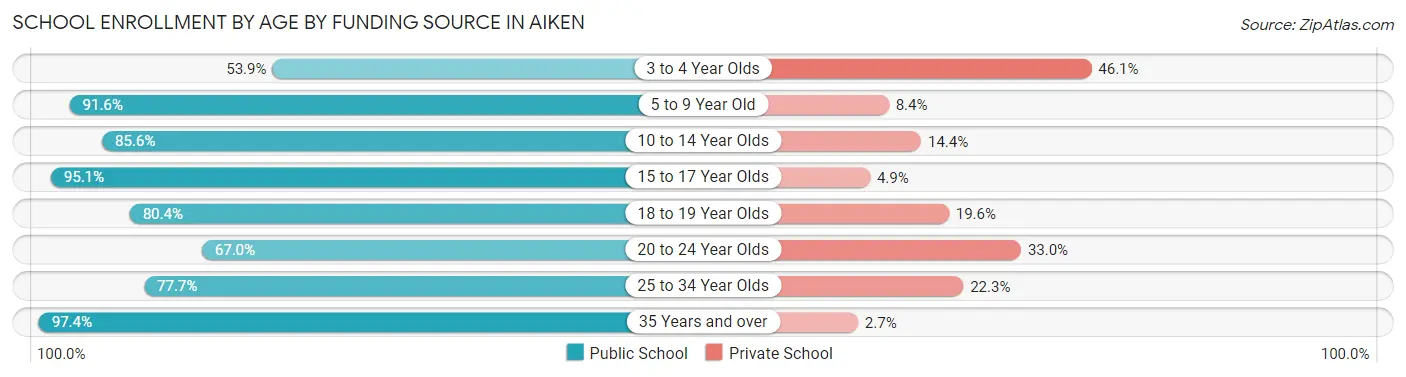
| Age Bracket | Public School | Private School |
| 3 to 4 Year Olds | 167 (53.9%) | 143 (46.1%) |
| 5 to 9 Year Old | 1,364 (91.6%) | 125 (8.4%) |
| 10 to 14 Year Olds | 1,567 (85.6%) | 264 (14.4%) |
| 15 to 17 Year Olds | 815 (95.1%) | 42 (4.9%) |
| 18 to 19 Year Olds | 772 (80.4%) | 188 (19.6%) |
| 20 to 24 Year Olds | 933 (67.0%) | 460 (33.0%) |
| 25 to 34 Year Olds | 349 (77.7%) | 100 (22.3%) |
| 35 Years and over | 220 (97.4%) | 6 (2.6%) |
| Total | 6,185 (82.3%) | 1,330 (17.7%) |
Educational Attainment by Field of Study in Aiken
Business (2,098 | 19.7%), education (1,849 | 17.4%), engineering (1,409 | 13.2%), science & technology (898 | 8.4%), and bio, nature & agricultural (710 | 6.7%) are the most common fields of study among 10,645 individuals in Aiken who have obtained a bachelor's degree or higher.
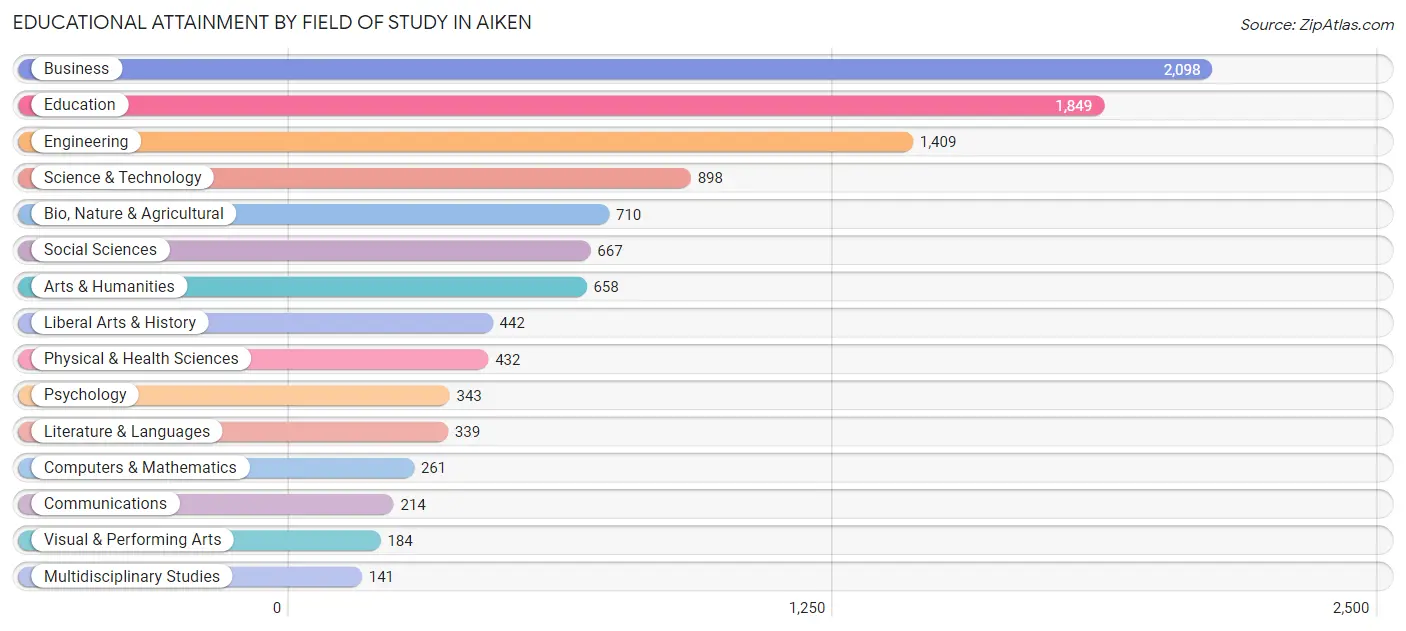
| Field of Study | # Graduates | % Graduates |
| Computers & Mathematics | 261 | 2.5% |
| Bio, Nature & Agricultural | 710 | 6.7% |
| Physical & Health Sciences | 432 | 4.1% |
| Psychology | 343 | 3.2% |
| Social Sciences | 667 | 6.3% |
| Engineering | 1,409 | 13.2% |
| Multidisciplinary Studies | 141 | 1.3% |
| Science & Technology | 898 | 8.4% |
| Business | 2,098 | 19.7% |
| Education | 1,849 | 17.4% |
| Literature & Languages | 339 | 3.2% |
| Liberal Arts & History | 442 | 4.2% |
| Visual & Performing Arts | 184 | 1.7% |
| Communications | 214 | 2.0% |
| Arts & Humanities | 658 | 6.2% |
| Total | 10,645 | 100.0% |
Transportation & Commute in Aiken
Vehicle Availability by Sex in Aiken
The most prevalent vehicle ownership categories in Aiken are males with 2 vehicles (2,307, accounting for 34.3%) and females with 2 vehicles (2,514, making up 32.7%).
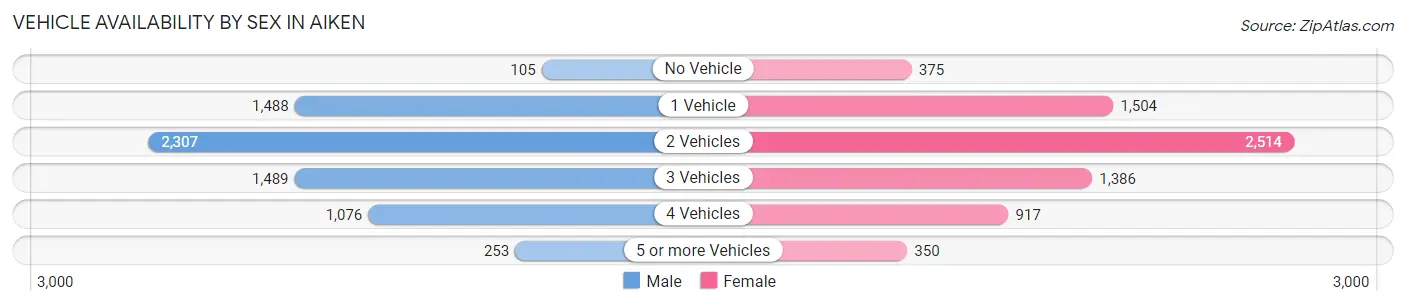
| Vehicles Available | Male | Female |
| No Vehicle | 105 (1.6%) | 375 (5.3%) |
| 1 Vehicle | 1,488 (22.2%) | 1,504 (21.3%) |
| 2 Vehicles | 2,307 (34.3%) | 2,514 (35.7%) |
| 3 Vehicles | 1,489 (22.2%) | 1,386 (19.7%) |
| 4 Vehicles | 1,076 (16.0%) | 917 (13.0%) |
| 5 or more Vehicles | 253 (3.8%) | 350 (5.0%) |
| Total | 6,718 (100.0%) | 7,046 (100.0%) |
Commute Time in Aiken
The most frequently occuring commute durations in Aiken are 10 to 14 minutes (2,308 commuters, 17.9%), 15 to 19 minutes (2,226 commuters, 17.3%), and 20 to 24 minutes (1,517 commuters, 11.8%).
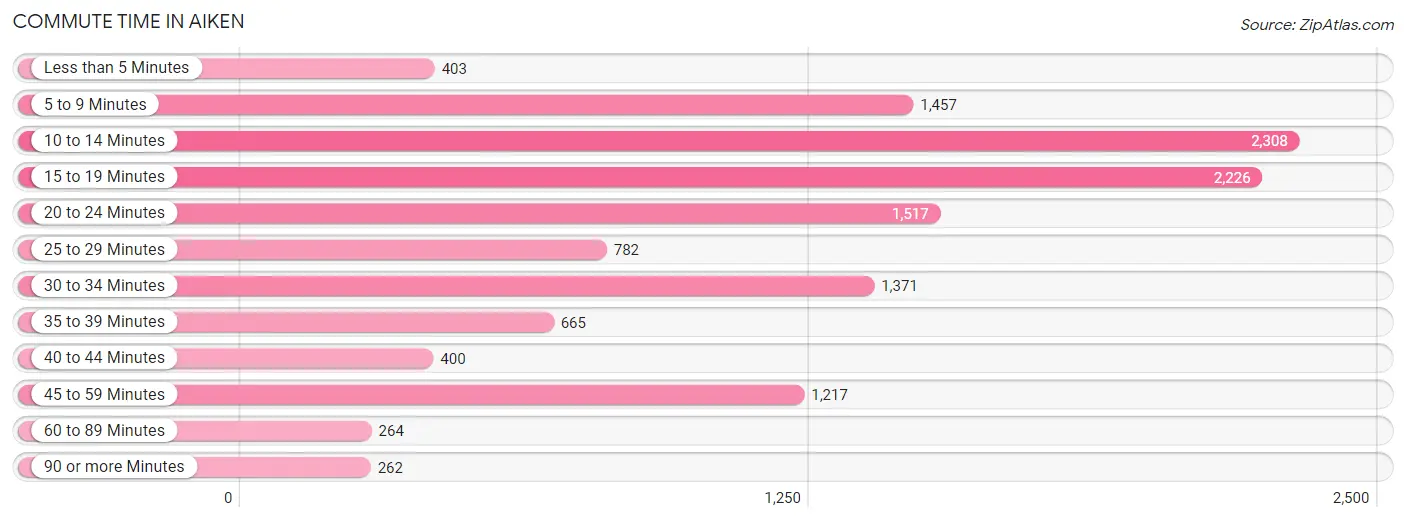
| Commute Time | # Commuters | % Commuters |
| Less than 5 Minutes | 403 | 3.1% |
| 5 to 9 Minutes | 1,457 | 11.3% |
| 10 to 14 Minutes | 2,308 | 17.9% |
| 15 to 19 Minutes | 2,226 | 17.3% |
| 20 to 24 Minutes | 1,517 | 11.8% |
| 25 to 29 Minutes | 782 | 6.1% |
| 30 to 34 Minutes | 1,371 | 10.6% |
| 35 to 39 Minutes | 665 | 5.2% |
| 40 to 44 Minutes | 400 | 3.1% |
| 45 to 59 Minutes | 1,217 | 9.5% |
| 60 to 89 Minutes | 264 | 2.1% |
| 90 or more Minutes | 262 | 2.0% |
Commute Time by Sex in Aiken
The most common commute times in Aiken are 10 to 14 minutes (1,212 commuters, 18.9%) for males and 15 to 19 minutes (1,401 commuters, 21.7%) for females.
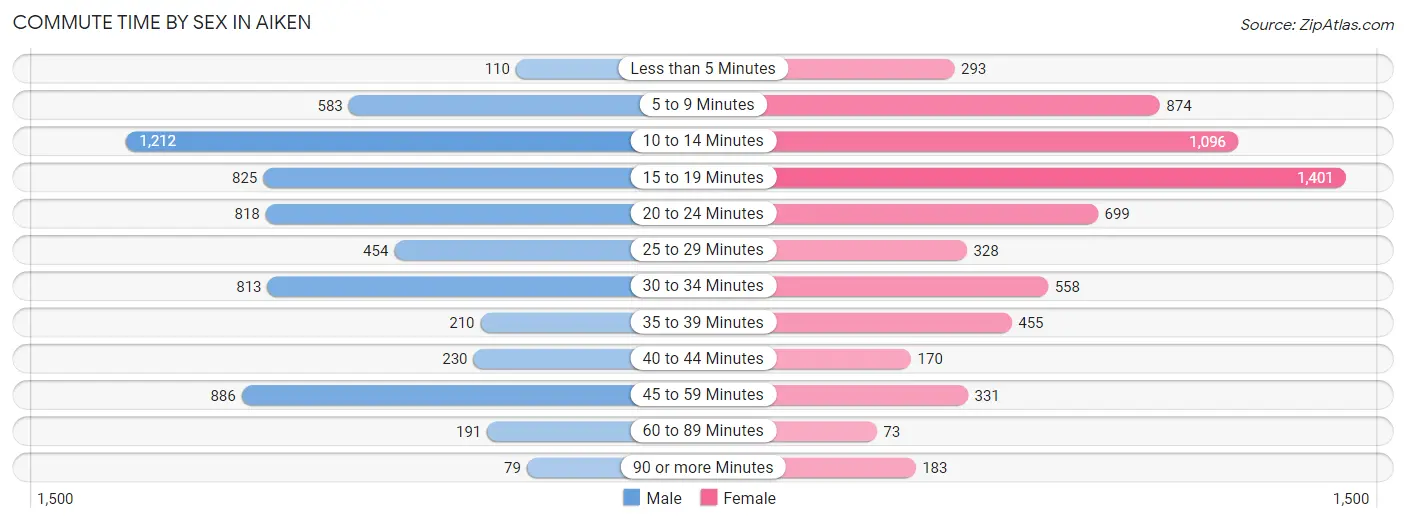
| Commute Time | Male | Female |
| Less than 5 Minutes | 110 (1.7%) | 293 (4.5%) |
| 5 to 9 Minutes | 583 (9.1%) | 874 (13.5%) |
| 10 to 14 Minutes | 1,212 (18.9%) | 1,096 (17.0%) |
| 15 to 19 Minutes | 825 (12.9%) | 1,401 (21.7%) |
| 20 to 24 Minutes | 818 (12.8%) | 699 (10.8%) |
| 25 to 29 Minutes | 454 (7.1%) | 328 (5.1%) |
| 30 to 34 Minutes | 813 (12.7%) | 558 (8.6%) |
| 35 to 39 Minutes | 210 (3.3%) | 455 (7.0%) |
| 40 to 44 Minutes | 230 (3.6%) | 170 (2.6%) |
| 45 to 59 Minutes | 886 (13.8%) | 331 (5.1%) |
| 60 to 89 Minutes | 191 (3.0%) | 73 (1.1%) |
| 90 or more Minutes | 79 (1.2%) | 183 (2.8%) |
Time of Departure to Work by Sex in Aiken
The most frequent times of departure to work in Aiken are 6:00 AM to 6:29 AM (1,231, 19.2%) for males and 7:00 AM to 7:29 AM (1,102, 17.1%) for females.
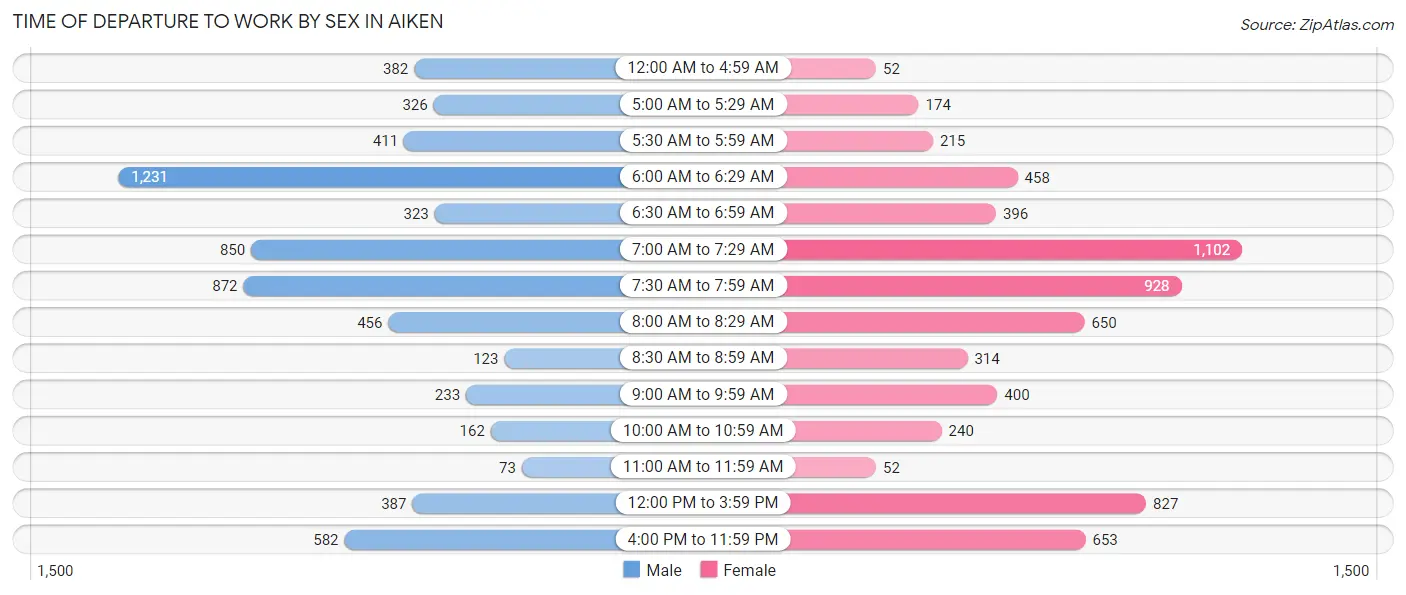
| Time of Departure | Male | Female |
| 12:00 AM to 4:59 AM | 382 (6.0%) | 52 (0.8%) |
| 5:00 AM to 5:29 AM | 326 (5.1%) | 174 (2.7%) |
| 5:30 AM to 5:59 AM | 411 (6.4%) | 215 (3.3%) |
| 6:00 AM to 6:29 AM | 1,231 (19.2%) | 458 (7.1%) |
| 6:30 AM to 6:59 AM | 323 (5.0%) | 396 (6.1%) |
| 7:00 AM to 7:29 AM | 850 (13.3%) | 1,102 (17.1%) |
| 7:30 AM to 7:59 AM | 872 (13.6%) | 928 (14.4%) |
| 8:00 AM to 8:29 AM | 456 (7.1%) | 650 (10.1%) |
| 8:30 AM to 8:59 AM | 123 (1.9%) | 314 (4.9%) |
| 9:00 AM to 9:59 AM | 233 (3.6%) | 400 (6.2%) |
| 10:00 AM to 10:59 AM | 162 (2.5%) | 240 (3.7%) |
| 11:00 AM to 11:59 AM | 73 (1.1%) | 52 (0.8%) |
| 12:00 PM to 3:59 PM | 387 (6.0%) | 827 (12.8%) |
| 4:00 PM to 11:59 PM | 582 (9.1%) | 653 (10.1%) |
| Total | 6,411 (100.0%) | 6,461 (100.0%) |
Housing Occupancy in Aiken
Occupancy by Ownership in Aiken
Of the total 12,953 dwellings in Aiken, owner-occupied units account for 8,917 (68.8%), while renter-occupied units make up 4,036 (31.2%).
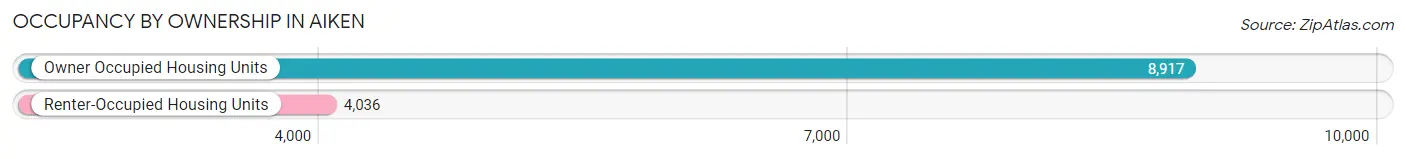
| Occupancy | # Housing Units | % Housing Units |
| Owner Occupied Housing Units | 8,917 | 68.8% |
| Renter-Occupied Housing Units | 4,036 | 31.2% |
| Total Occupied Housing Units | 12,953 | 100.0% |
Occupancy by Household Size in Aiken
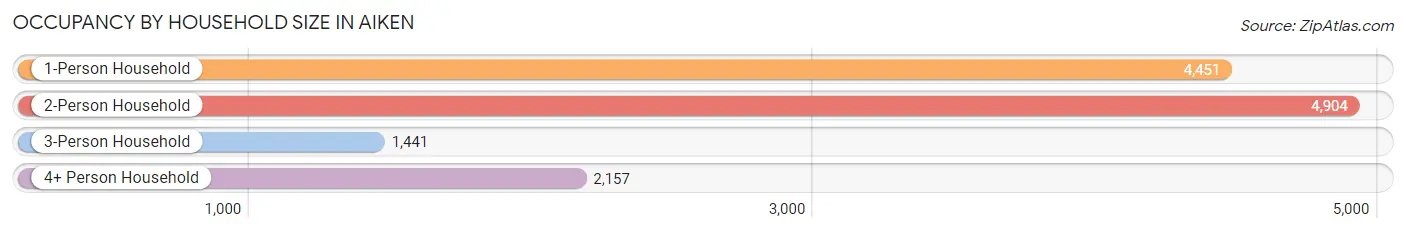
| Household Size | # Housing Units | % Housing Units |
| 1-Person Household | 4,451 | 34.4% |
| 2-Person Household | 4,904 | 37.9% |
| 3-Person Household | 1,441 | 11.1% |
| 4+ Person Household | 2,157 | 16.7% |
| Total Housing Units | 12,953 | 100.0% |
Occupancy by Ownership by Household Size in Aiken
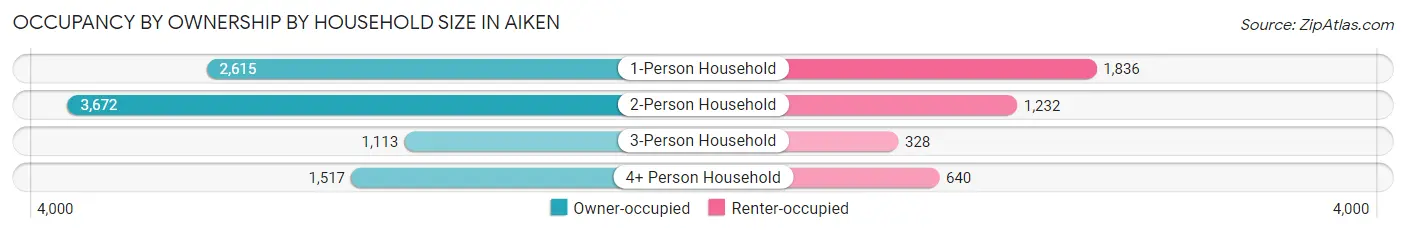
| Household Size | Owner-occupied | Renter-occupied |
| 1-Person Household | 2,615 (58.8%) | 1,836 (41.2%) |
| 2-Person Household | 3,672 (74.9%) | 1,232 (25.1%) |
| 3-Person Household | 1,113 (77.2%) | 328 (22.8%) |
| 4+ Person Household | 1,517 (70.3%) | 640 (29.7%) |
| Total Housing Units | 8,917 (68.8%) | 4,036 (31.2%) |
Occupancy by Educational Attainment in Aiken
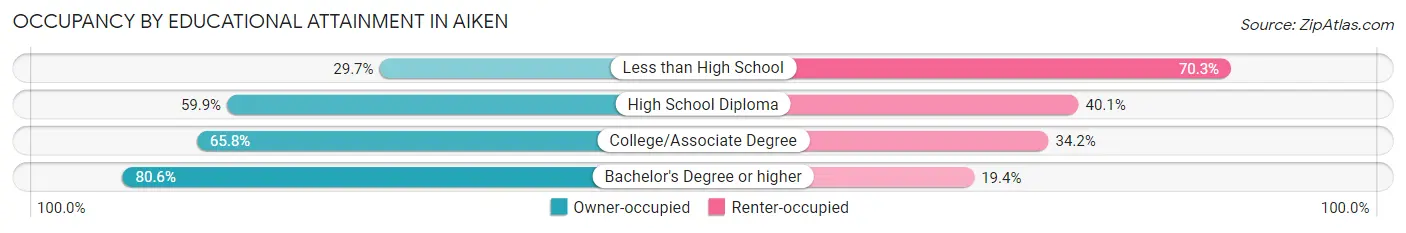
| Household Size | Owner-occupied | Renter-occupied |
| Less than High School | 310 (29.7%) | 735 (70.3%) |
| High School Diploma | 1,533 (59.9%) | 1,027 (40.1%) |
| College/Associate Degree | 2,040 (65.8%) | 1,059 (34.2%) |
| Bachelor's Degree or higher | 5,034 (80.6%) | 1,215 (19.4%) |
Occupancy by Age of Householder in Aiken
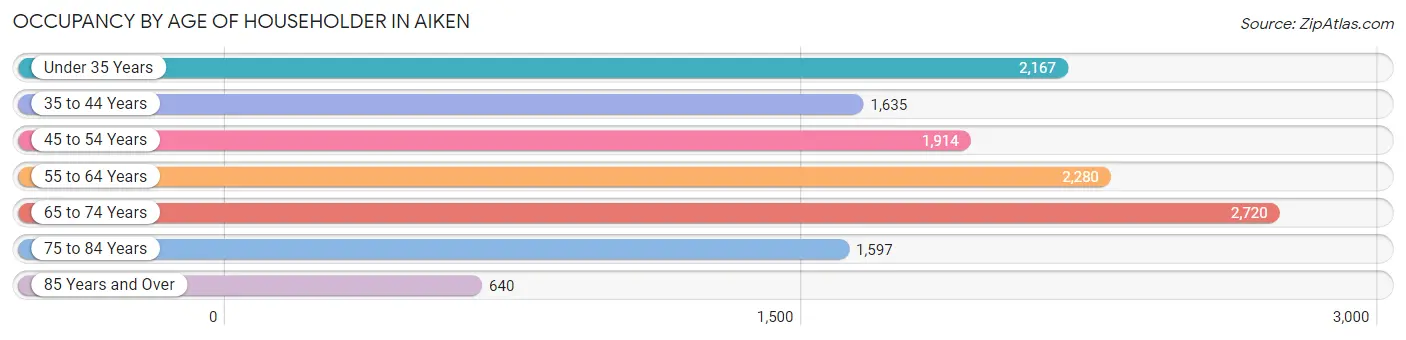
| Age Bracket | # Households | % Households |
| Under 35 Years | 2,167 | 16.7% |
| 35 to 44 Years | 1,635 | 12.6% |
| 45 to 54 Years | 1,914 | 14.8% |
| 55 to 64 Years | 2,280 | 17.6% |
| 65 to 74 Years | 2,720 | 21.0% |
| 75 to 84 Years | 1,597 | 12.3% |
| 85 Years and Over | 640 | 4.9% |
| Total | 12,953 | 100.0% |
Housing Finances in Aiken
Median Income by Occupancy in Aiken
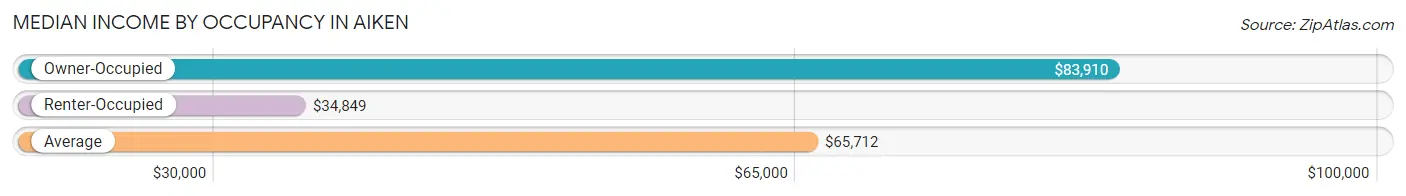
| Occupancy Type | # Households | Median Income |
| Owner-Occupied | 8,917 (68.8%) | $83,910 |
| Renter-Occupied | 4,036 (31.2%) | $34,849 |
| Average | 12,953 (100.0%) | $65,712 |
Occupancy by Householder Income Bracket in Aiken
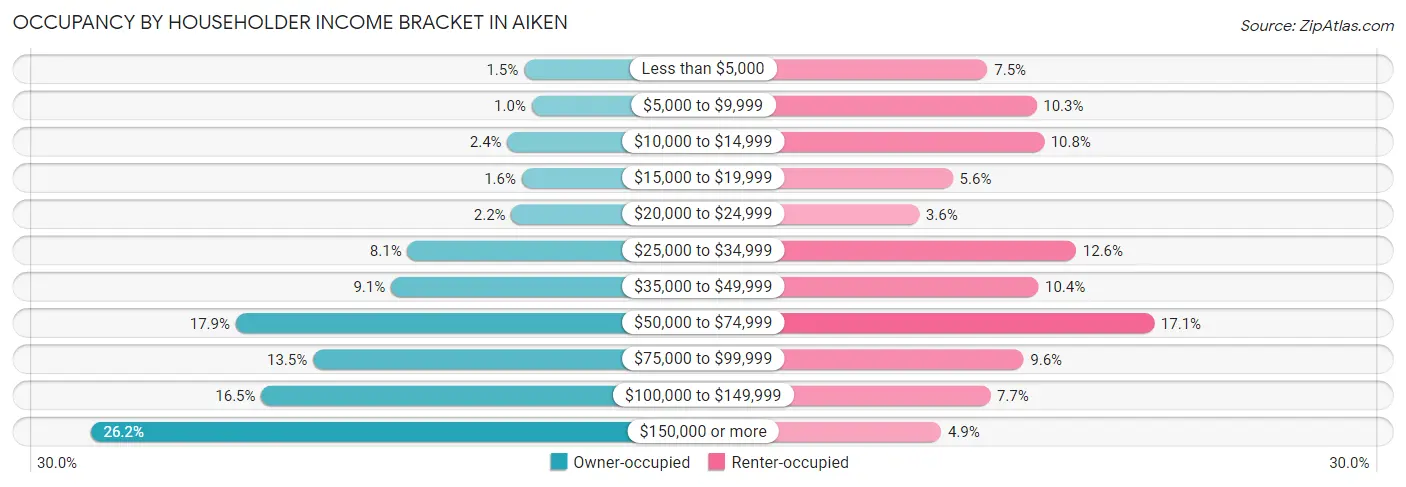
| Income Bracket | Owner-occupied | Renter-occupied |
| Less than $5,000 | 130 (1.5%) | 304 (7.5%) |
| $5,000 to $9,999 | 91 (1.0%) | 417 (10.3%) |
| $10,000 to $14,999 | 215 (2.4%) | 434 (10.7%) |
| $15,000 to $19,999 | 142 (1.6%) | 224 (5.6%) |
| $20,000 to $24,999 | 194 (2.2%) | 146 (3.6%) |
| $25,000 to $34,999 | 724 (8.1%) | 508 (12.6%) |
| $35,000 to $49,999 | 808 (9.1%) | 421 (10.4%) |
| $50,000 to $74,999 | 1,599 (17.9%) | 688 (17.1%) |
| $75,000 to $99,999 | 1,206 (13.5%) | 387 (9.6%) |
| $100,000 to $149,999 | 1,469 (16.5%) | 310 (7.7%) |
| $150,000 or more | 2,339 (26.2%) | 197 (4.9%) |
| Total | 8,917 (100.0%) | 4,036 (100.0%) |
Monthly Housing Cost Tiers in Aiken
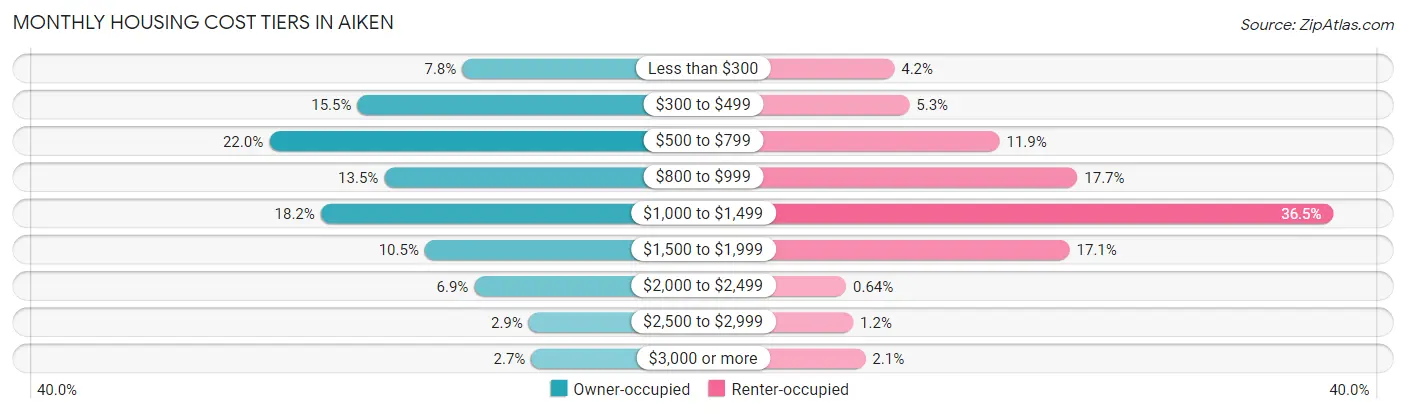
| Monthly Cost | Owner-occupied | Renter-occupied |
| Less than $300 | 694 (7.8%) | 169 (4.2%) |
| $300 to $499 | 1,382 (15.5%) | 214 (5.3%) |
| $500 to $799 | 1,962 (22.0%) | 482 (11.9%) |
| $800 to $999 | 1,206 (13.5%) | 713 (17.7%) |
| $1,000 to $1,499 | 1,623 (18.2%) | 1,474 (36.5%) |
| $1,500 to $1,999 | 939 (10.5%) | 690 (17.1%) |
| $2,000 to $2,499 | 614 (6.9%) | 26 (0.6%) |
| $2,500 to $2,999 | 257 (2.9%) | 47 (1.2%) |
| $3,000 or more | 240 (2.7%) | 83 (2.1%) |
| Total | 8,917 (100.0%) | 4,036 (100.0%) |
Physical Housing Characteristics in Aiken
Housing Structures in Aiken
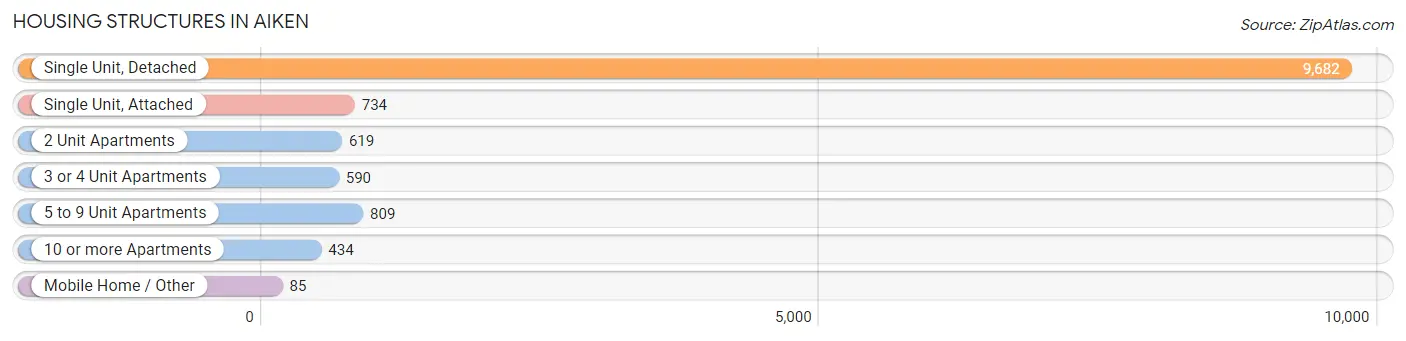
| Structure Type | # Housing Units | % Housing Units |
| Single Unit, Detached | 9,682 | 74.8% |
| Single Unit, Attached | 734 | 5.7% |
| 2 Unit Apartments | 619 | 4.8% |
| 3 or 4 Unit Apartments | 590 | 4.5% |
| 5 to 9 Unit Apartments | 809 | 6.2% |
| 10 or more Apartments | 434 | 3.4% |
| Mobile Home / Other | 85 | 0.7% |
| Total | 12,953 | 100.0% |
Housing Structures by Occupancy in Aiken
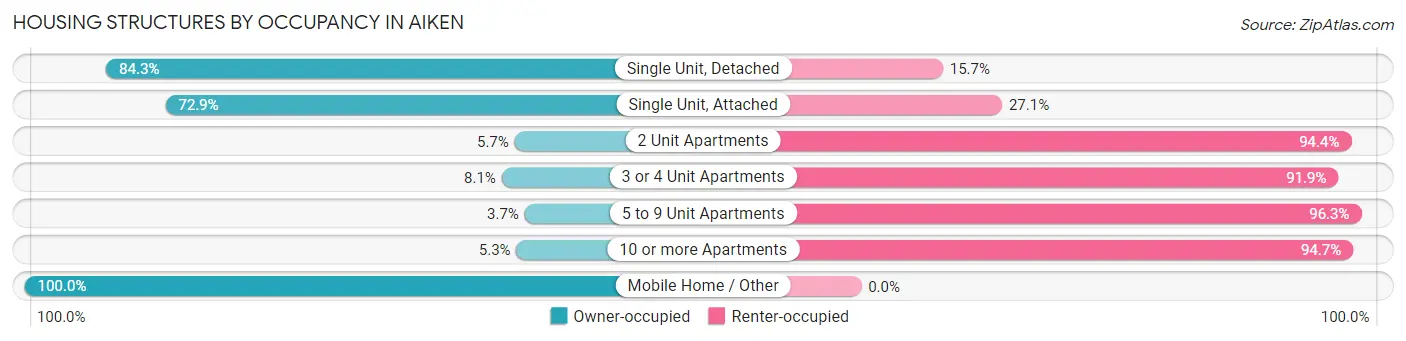
| Structure Type | Owner-occupied | Renter-occupied |
| Single Unit, Detached | 8,161 (84.3%) | 1,521 (15.7%) |
| Single Unit, Attached | 535 (72.9%) | 199 (27.1%) |
| 2 Unit Apartments | 35 (5.7%) | 584 (94.4%) |
| 3 or 4 Unit Apartments | 48 (8.1%) | 542 (91.9%) |
| 5 to 9 Unit Apartments | 30 (3.7%) | 779 (96.3%) |
| 10 or more Apartments | 23 (5.3%) | 411 (94.7%) |
| Mobile Home / Other | 85 (100.0%) | 0 (0.0%) |
| Total | 8,917 (68.8%) | 4,036 (31.2%) |
Housing Structures by Number of Rooms in Aiken
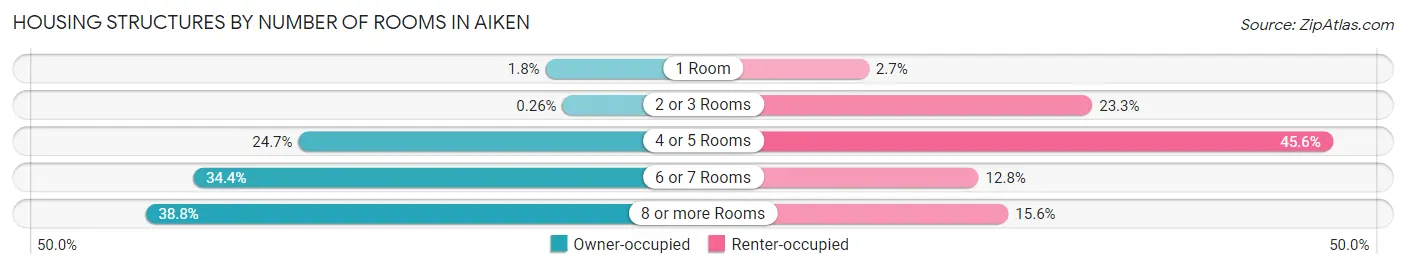
| Number of Rooms | Owner-occupied | Renter-occupied |
| 1 Room | 163 (1.8%) | 108 (2.7%) |
| 2 or 3 Rooms | 23 (0.3%) | 942 (23.3%) |
| 4 or 5 Rooms | 2,201 (24.7%) | 1,839 (45.6%) |
| 6 or 7 Rooms | 3,068 (34.4%) | 518 (12.8%) |
| 8 or more Rooms | 3,462 (38.8%) | 629 (15.6%) |
| Total | 8,917 (100.0%) | 4,036 (100.0%) |
Housing Structure by Heating Type in Aiken
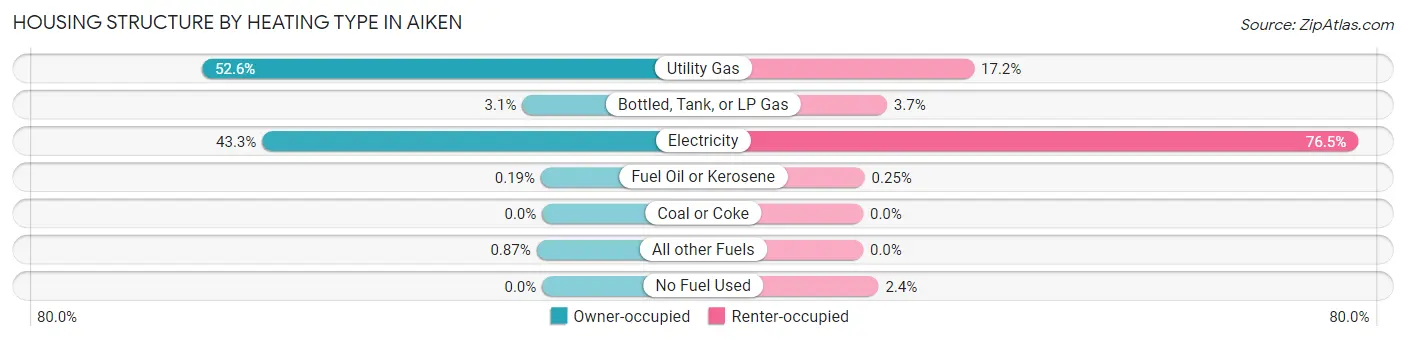
| Heating Type | Owner-occupied | Renter-occupied |
| Utility Gas | 4,689 (52.6%) | 693 (17.2%) |
| Bottled, Tank, or LP Gas | 274 (3.1%) | 149 (3.7%) |
| Electricity | 3,859 (43.3%) | 3,088 (76.5%) |
| Fuel Oil or Kerosene | 17 (0.2%) | 10 (0.3%) |
| Coal or Coke | 0 (0.0%) | 0 (0.0%) |
| All other Fuels | 78 (0.9%) | 0 (0.0%) |
| No Fuel Used | 0 (0.0%) | 96 (2.4%) |
| Total | 8,917 (100.0%) | 4,036 (100.0%) |
Household Vehicle Usage in Aiken
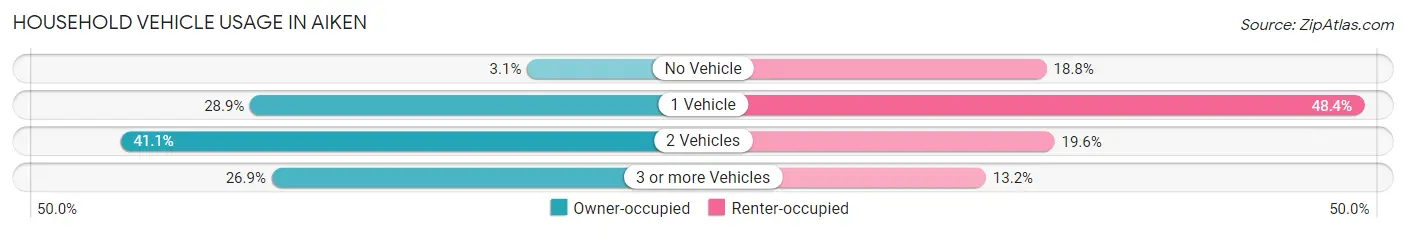
| Vehicles per Household | Owner-occupied | Renter-occupied |
| No Vehicle | 275 (3.1%) | 760 (18.8%) |
| 1 Vehicle | 2,581 (28.9%) | 1,955 (48.4%) |
| 2 Vehicles | 3,660 (41.0%) | 790 (19.6%) |
| 3 or more Vehicles | 2,401 (26.9%) | 531 (13.2%) |
| Total | 8,917 (100.0%) | 4,036 (100.0%) |
Real Estate & Mortgages in Aiken
Real Estate and Mortgage Overview in Aiken
| Characteristic | Without Mortgage | With Mortgage |
| Housing Units | 3,787 | 5,130 |
| Median Property Value | $255,500 | $222,800 |
| Median Household Income | $73,427 | $1,495 |
| Monthly Housing Costs | $487 | $233 |
| Real Estate Taxes | $1,176 | $106 |
Property Value by Mortgage Status in Aiken
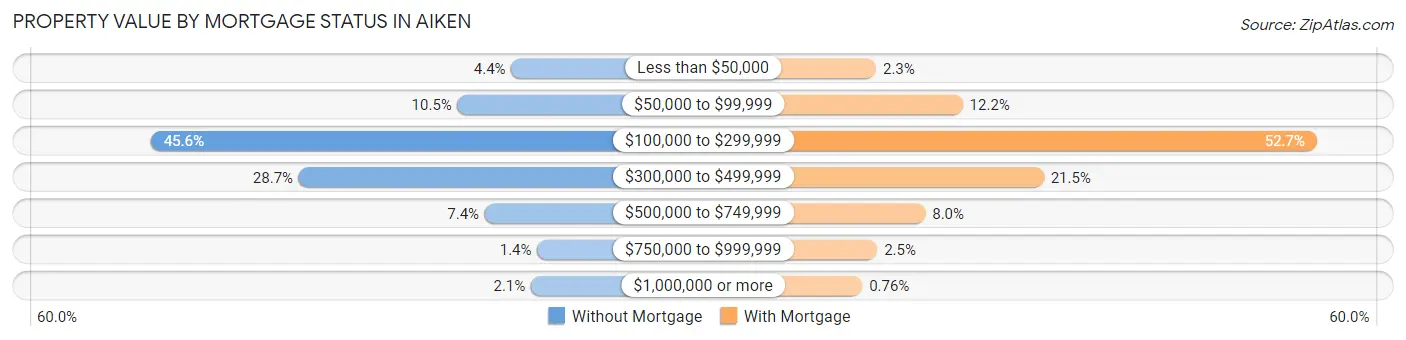
| Property Value | Without Mortgage | With Mortgage |
| Less than $50,000 | 165 (4.4%) | 120 (2.3%) |
| $50,000 to $99,999 | 398 (10.5%) | 628 (12.2%) |
| $100,000 to $299,999 | 1,726 (45.6%) | 2,704 (52.7%) |
| $300,000 to $499,999 | 1,085 (28.6%) | 1,103 (21.5%) |
| $500,000 to $749,999 | 280 (7.4%) | 409 (8.0%) |
| $750,000 to $999,999 | 53 (1.4%) | 127 (2.5%) |
| $1,000,000 or more | 80 (2.1%) | 39 (0.8%) |
| Total | 3,787 (100.0%) | 5,130 (100.0%) |
Household Income by Mortgage Status in Aiken
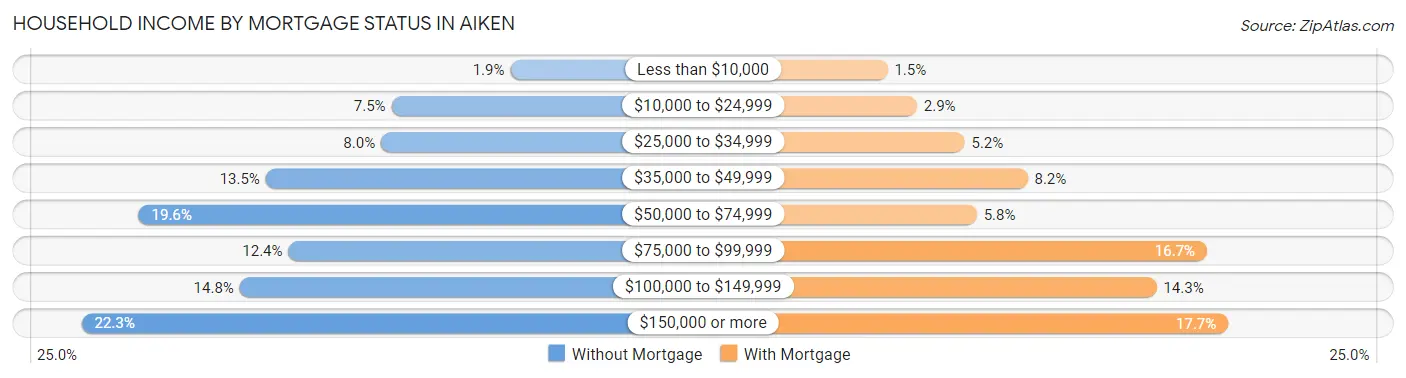
| Household Income | Without Mortgage | With Mortgage |
| Less than $10,000 | 71 (1.9%) | 78 (1.5%) |
| $10,000 to $24,999 | 285 (7.5%) | 150 (2.9%) |
| $25,000 to $34,999 | 304 (8.0%) | 266 (5.2%) |
| $35,000 to $49,999 | 512 (13.5%) | 420 (8.2%) |
| $50,000 to $74,999 | 741 (19.6%) | 296 (5.8%) |
| $75,000 to $99,999 | 471 (12.4%) | 858 (16.7%) |
| $100,000 to $149,999 | 559 (14.8%) | 735 (14.3%) |
| $150,000 or more | 844 (22.3%) | 910 (17.7%) |
| Total | 3,787 (100.0%) | 5,130 (100.0%) |
Property Value to Household Income Ratio in Aiken
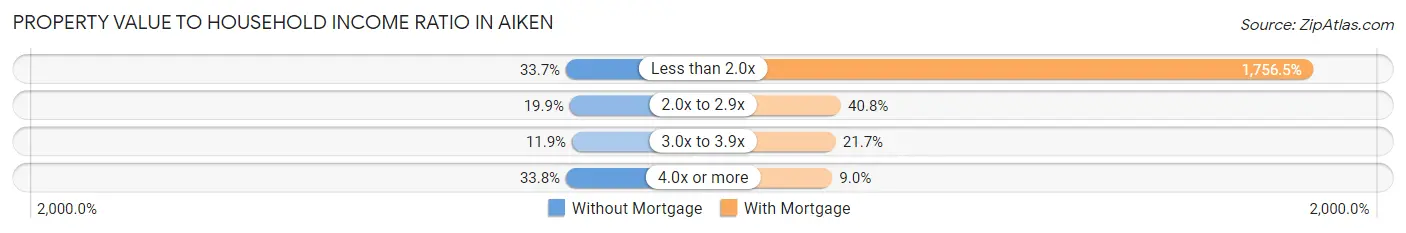
| Value-to-Income Ratio | Without Mortgage | With Mortgage |
| Less than 2.0x | 1,275 (33.7%) | 90,109 (1,756.5%) |
| 2.0x to 2.9x | 753 (19.9%) | 2,092 (40.8%) |
| 3.0x to 3.9x | 450 (11.9%) | 1,115 (21.7%) |
| 4.0x or more | 1,278 (33.8%) | 460 (9.0%) |
| Total | 3,787 (100.0%) | 5,130 (100.0%) |
Real Estate Taxes by Mortgage Status in Aiken
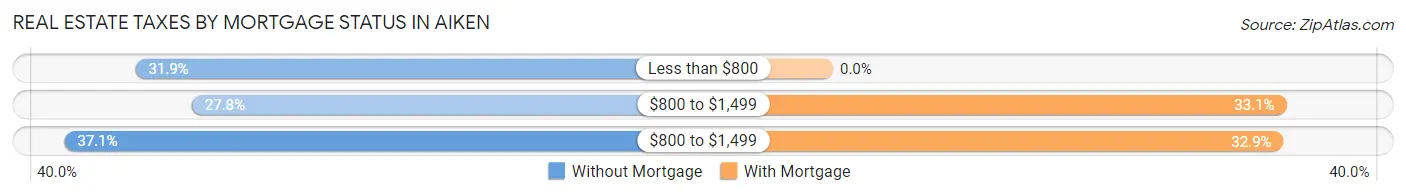
| Property Taxes | Without Mortgage | With Mortgage |
| Less than $800 | 1,208 (31.9%) | 0 (0.0%) |
| $800 to $1,499 | 1,052 (27.8%) | 1,699 (33.1%) |
| $800 to $1,499 | 1,405 (37.1%) | 1,688 (32.9%) |
| Total | 3,787 (100.0%) | 5,130 (100.0%) |
Health & Disability in Aiken
Health Insurance Coverage by Age in Aiken
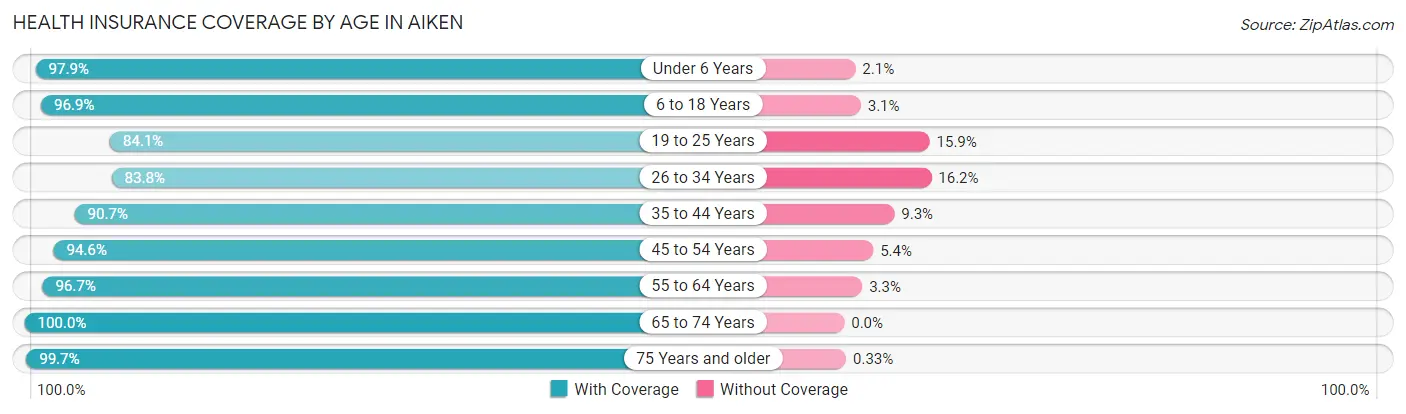
| Age Bracket | With Coverage | Without Coverage |
| Under 6 Years | 1,659 (97.9%) | 35 (2.1%) |
| 6 to 18 Years | 4,344 (96.9%) | 138 (3.1%) |
| 19 to 25 Years | 2,817 (84.1%) | 533 (15.9%) |
| 26 to 34 Years | 2,791 (83.8%) | 541 (16.2%) |
| 35 to 44 Years | 2,479 (90.7%) | 255 (9.3%) |
| 45 to 54 Years | 3,413 (94.6%) | 195 (5.4%) |
| 55 to 64 Years | 3,788 (96.7%) | 131 (3.3%) |
| 65 to 74 Years | 4,614 (100.0%) | 0 (0.0%) |
| 75 Years and older | 3,609 (99.7%) | 12 (0.3%) |
| Total | 29,514 (94.1%) | 1,840 (5.9%) |
Health Insurance Coverage by Citizenship Status in Aiken
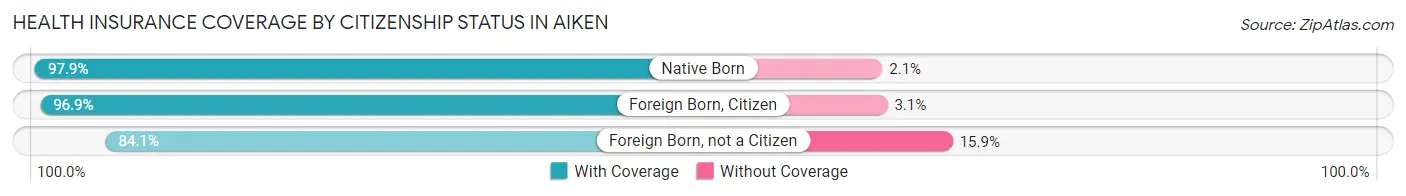
| Citizenship Status | With Coverage | Without Coverage |
| Native Born | 1,659 (97.9%) | 35 (2.1%) |
| Foreign Born, Citizen | 4,344 (96.9%) | 138 (3.1%) |
| Foreign Born, not a Citizen | 2,817 (84.1%) | 533 (15.9%) |
Health Insurance Coverage by Household Income in Aiken
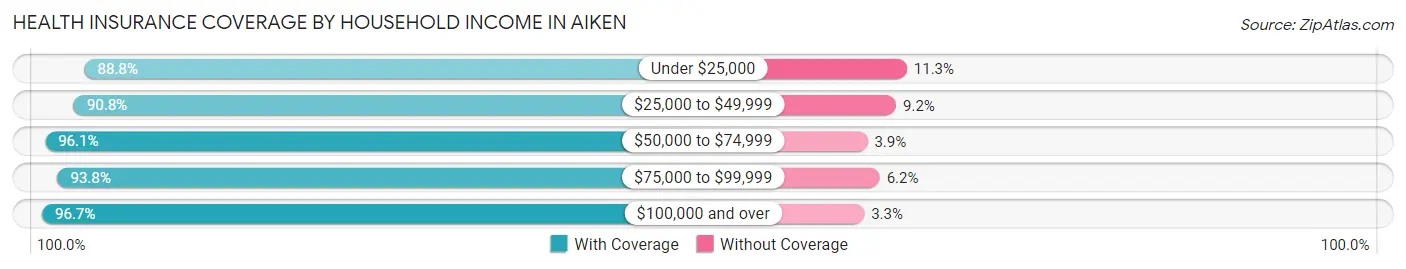
| Household Income | With Coverage | Without Coverage |
| Under $25,000 | 3,643 (88.7%) | 462 (11.3%) |
| $25,000 to $49,999 | 3,852 (90.8%) | 392 (9.2%) |
| $50,000 to $74,999 | 4,616 (96.1%) | 186 (3.9%) |
| $75,000 to $99,999 | 4,443 (93.8%) | 292 (6.2%) |
| $100,000 and over | 12,028 (96.7%) | 407 (3.3%) |
Public vs Private Health Insurance Coverage by Age in Aiken
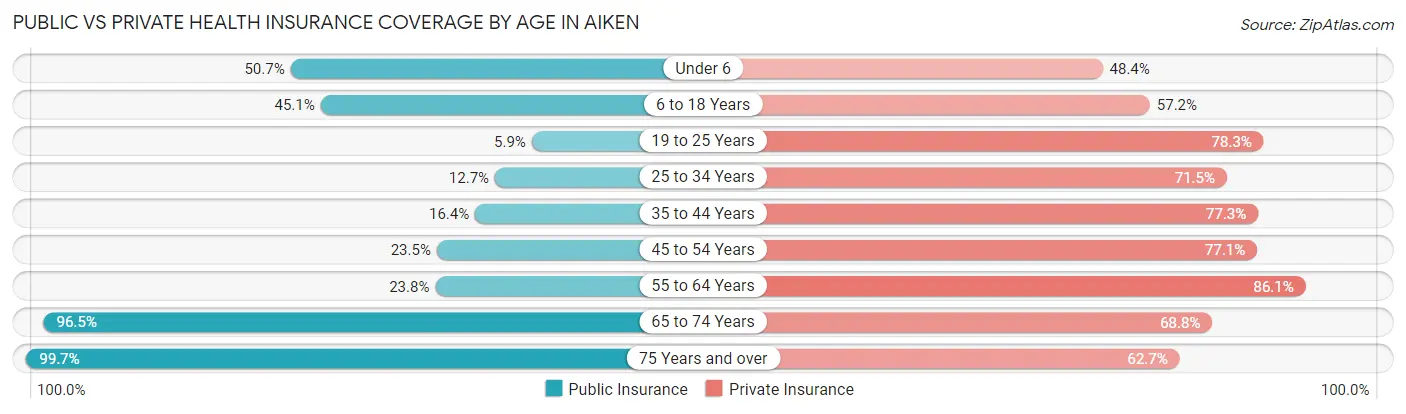
| Age Bracket | Public Insurance | Private Insurance |
| Under 6 | 858 (50.6%) | 820 (48.4%) |
| 6 to 18 Years | 2,020 (45.1%) | 2,563 (57.2%) |
| 19 to 25 Years | 197 (5.9%) | 2,623 (78.3%) |
| 25 to 34 Years | 423 (12.7%) | 2,381 (71.5%) |
| 35 to 44 Years | 448 (16.4%) | 2,112 (77.2%) |
| 45 to 54 Years | 848 (23.5%) | 2,781 (77.1%) |
| 55 to 64 Years | 932 (23.8%) | 3,373 (86.1%) |
| 65 to 74 Years | 4,451 (96.5%) | 3,172 (68.8%) |
| 75 Years and over | 3,609 (99.7%) | 2,270 (62.7%) |
| Total | 13,786 (44.0%) | 22,095 (70.5%) |
Disability Status by Sex by Age in Aiken
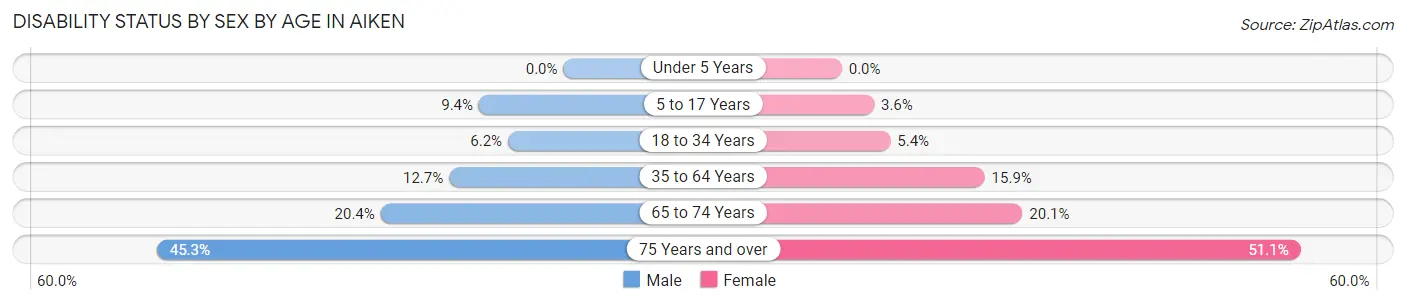
| Age Bracket | Male | Female |
| Under 5 Years | 0 (0.0%) | 0 (0.0%) |
| 5 to 17 Years | 182 (9.4%) | 82 (3.6%) |
| 18 to 34 Years | 231 (6.2%) | 188 (5.4%) |
| 35 to 64 Years | 571 (12.7%) | 919 (15.9%) |
| 65 to 74 Years | 426 (20.3%) | 507 (20.1%) |
| 75 Years and over | 636 (45.3%) | 1,132 (51.1%) |
Disability Class by Sex by Age in Aiken
Disability Class: Hearing Difficulty
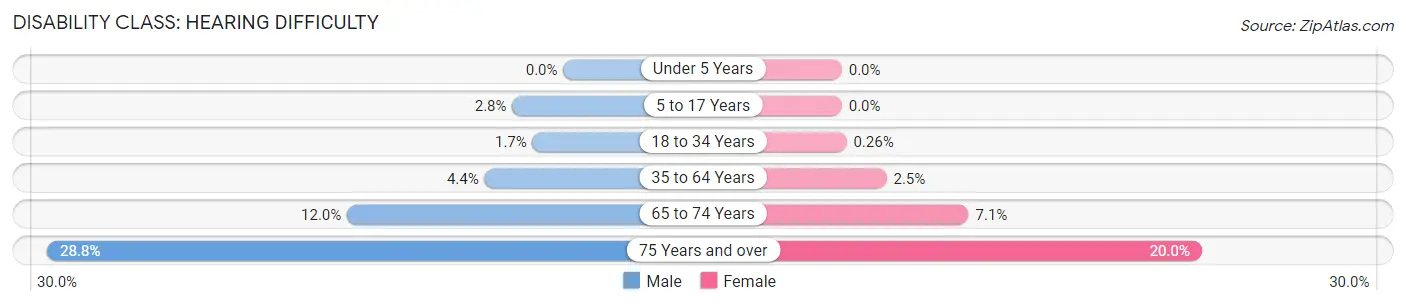
| Age Bracket | Male | Female |
| Under 5 Years | 0 (0.0%) | 0 (0.0%) |
| 5 to 17 Years | 55 (2.8%) | 0 (0.0%) |
| 18 to 34 Years | 64 (1.7%) | 9 (0.3%) |
| 35 to 64 Years | 197 (4.4%) | 144 (2.5%) |
| 65 to 74 Years | 252 (12.0%) | 178 (7.1%) |
| 75 Years and over | 404 (28.7%) | 444 (20.0%) |
Disability Class: Vision Difficulty
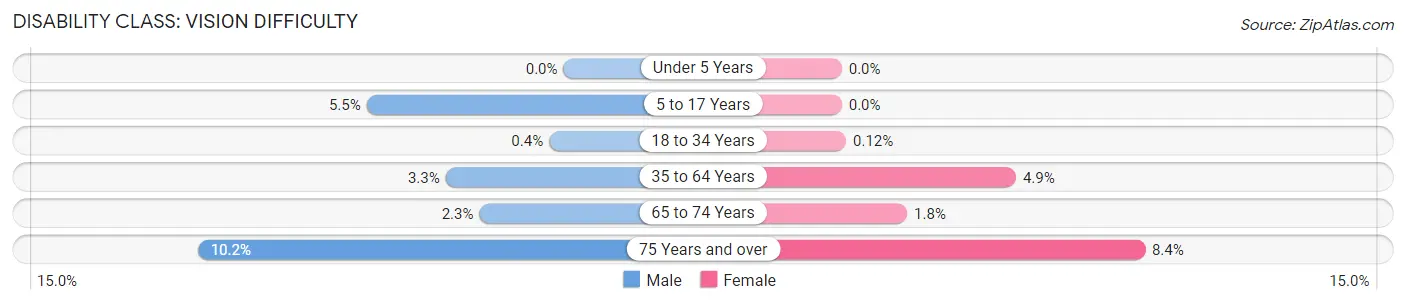
| Age Bracket | Male | Female |
| Under 5 Years | 0 (0.0%) | 0 (0.0%) |
| 5 to 17 Years | 106 (5.5%) | 0 (0.0%) |
| 18 to 34 Years | 15 (0.4%) | 4 (0.1%) |
| 35 to 64 Years | 147 (3.3%) | 280 (4.9%) |
| 65 to 74 Years | 49 (2.3%) | 46 (1.8%) |
| 75 Years and over | 143 (10.2%) | 187 (8.4%) |
Disability Class: Cognitive Difficulty
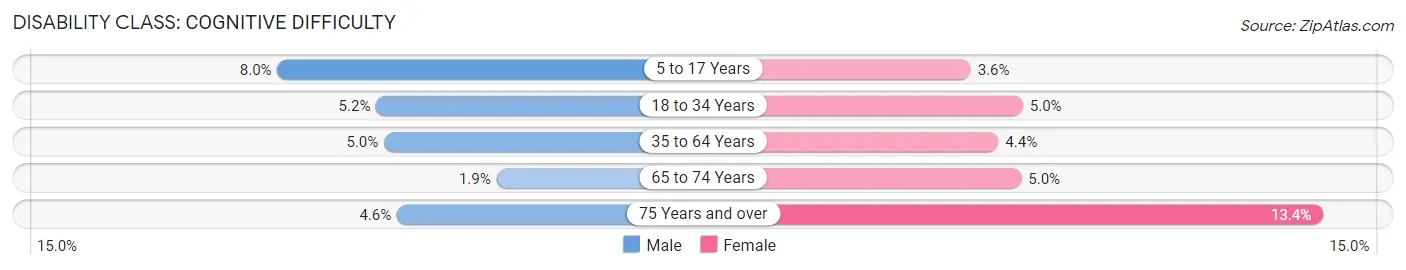
| Age Bracket | Male | Female |
| 5 to 17 Years | 154 (8.0%) | 82 (3.6%) |
| 18 to 34 Years | 195 (5.2%) | 175 (5.0%) |
| 35 to 64 Years | 224 (5.0%) | 252 (4.4%) |
| 65 to 74 Years | 39 (1.9%) | 126 (5.0%) |
| 75 Years and over | 65 (4.6%) | 297 (13.4%) |
Disability Class: Ambulatory Difficulty
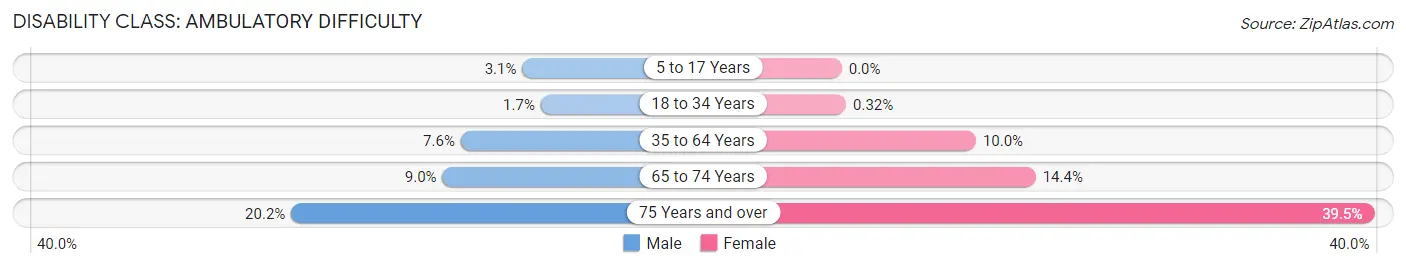
| Age Bracket | Male | Female |
| 5 to 17 Years | 59 (3.0%) | 0 (0.0%) |
| 18 to 34 Years | 63 (1.7%) | 11 (0.3%) |
| 35 to 64 Years | 342 (7.6%) | 575 (10.0%) |
| 65 to 74 Years | 188 (9.0%) | 363 (14.4%) |
| 75 Years and over | 284 (20.2%) | 876 (39.5%) |
Disability Class: Self-Care Difficulty
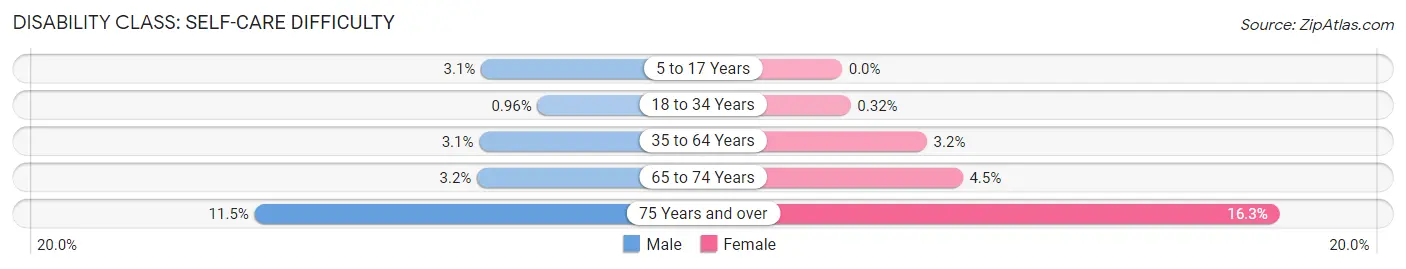
| Age Bracket | Male | Female |
| 5 to 17 Years | 59 (3.0%) | 0 (0.0%) |
| 18 to 34 Years | 36 (1.0%) | 11 (0.3%) |
| 35 to 64 Years | 140 (3.1%) | 182 (3.2%) |
| 65 to 74 Years | 67 (3.2%) | 113 (4.5%) |
| 75 Years and over | 161 (11.5%) | 360 (16.3%) |
Technology Access in Aiken
Computing Device Access in Aiken
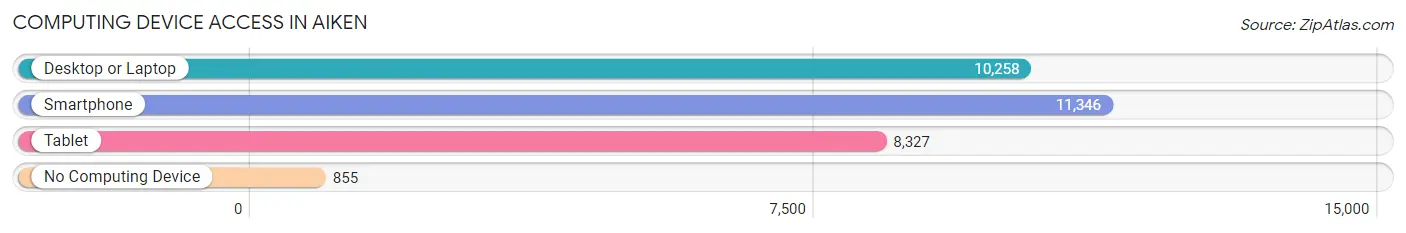
| Device Type | # Households | % Households |
| Desktop or Laptop | 10,258 | 79.2% |
| Smartphone | 11,346 | 87.6% |
| Tablet | 8,327 | 64.3% |
| No Computing Device | 855 | 6.6% |
| Total | 12,953 | 100.0% |
Internet Access in Aiken
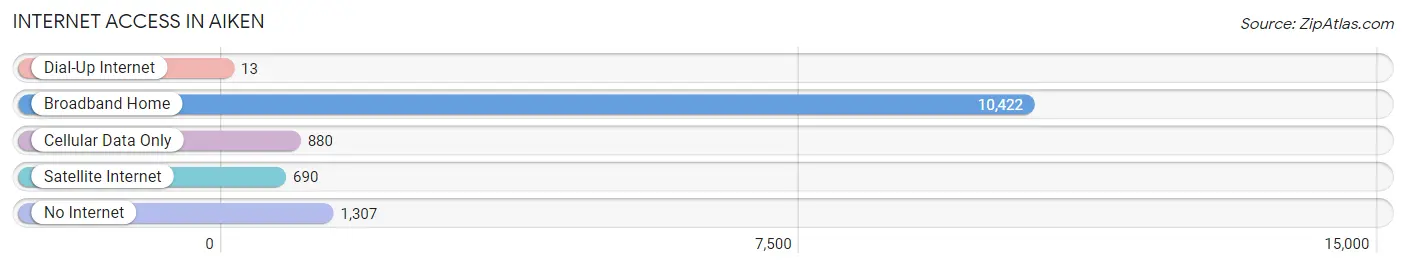
| Internet Type | # Households | % Households |
| Dial-Up Internet | 13 | 0.1% |
| Broadband Home | 10,422 | 80.5% |
| Cellular Data Only | 880 | 6.8% |
| Satellite Internet | 690 | 5.3% |
| No Internet | 1,307 | 10.1% |
| Total | 12,953 | 100.0% |
Aiken Summary
Aiken, South Carolina is a city located in Aiken County, South Carolina, United States. It is the county seat of Aiken County and is part of the Augusta-Richmond County Metropolitan Statistical Area. The city is located approximately 20 miles (32 km) northeast of Augusta, Georgia and is part of the Central Savannah River Area (CSRA). As of the 2010 census, the city had a population of 30,296.
Geography
Aiken is located at 33°32′58″N 81°43′14″W (33.549444, -81.720556). According to the United States Census Bureau, the city has a total area of 20.8 square miles (53.8 km2), of which 20.7 square miles (53.6 km2) is land and 0.1 square miles (0.2 km2) (0.43%) is water.
The city is located in the Piedmont region of South Carolina, and is situated on the fall line between the Atlantic Coastal Plain and the Piedmont. The city is located in the heart of the Sandhills region, which is known for its rolling hills and sandy soil. The city is located near the Savannah River, which forms the border between South Carolina and Georgia.
Climate
Aiken has a humid subtropical climate (Köppen Cfa), with hot, humid summers and mild winters. The average annual temperature is 61.6 °F (16.4 °C). The average annual precipitation is 48.7 inches (1,240 mm).
Demographics
As of the census of 2010, there were 30,296 people, 11,845 households, and 7,845 families residing in the city. The population density was 1,459.2 people per square mile (564.2/km2). There were 13,068 housing units at an average density of 629.3 per square mile (242.7/km2). The racial makeup of the city was 68.2% White, 28.2% African American, 0.2% Native American, 1.2% Asian, 0.1% Pacific Islander, 0.7% from other races, and 1.2% from two or more races. Hispanic or Latino of any race were 2.7% of the population.
Economy
Aiken is home to a variety of industries, including manufacturing, healthcare, retail, and tourism. The city is home to several large employers, including Bridgestone, Kimberly-Clark, and Savannah River Nuclear Solutions. The city is also home to several smaller businesses, including restaurants, shops, and other services.
The city is also home to several educational institutions, including the University of South Carolina Aiken, Aiken Technical College, and Aiken County Public Schools.
The city is also home to several cultural attractions, including the Aiken County Historical Museum, the Aiken Thoroughbred Racing Hall of Fame and Museum, and the Aiken Center for the Arts.
Conclusion
Aiken, South Carolina is a city located in Aiken County, South Carolina, United States. It is the county seat of Aiken County and is part of the Augusta-Richmond County Metropolitan Statistical Area. The city is located approximately 20 miles (32 km) northeast of Augusta, Georgia and is part of the Central Savannah River Area (CSRA). As of the 2010 census, the city had a population of 30,296. Aiken has a humid subtropical climate (Köppen Cfa), with hot, humid summers and mild winters. The city is home to a variety of industries, including manufacturing, healthcare, retail, and tourism. The city is also home to several educational institutions, including the University of South Carolina Aiken, Aiken Technical College, and Aiken County Public Schools. The city is also home to several cultural attractions, including the Aiken County Historical Museum, the Aiken Thoroughbred Racing Hall of Fame and Museum, and the Aiken Center for the Arts.
Common Questions
What is Per Capita Income in Aiken?
Per Capita income in Aiken is $40,926.
What is the Median Family Income in Aiken?
Median Family Income in Aiken is $93,666.
What is the Median Household income in Aiken?
Median Household Income in Aiken is $65,712.
What is Income or Wage Gap in Aiken?
Income or Wage Gap in Aiken is 36.3%.
Women in Aiken earn 63.7 cents for every dollar earned by a man.
What is Family Income Deficit in Aiken?
Family Income Deficit in Aiken is $14,743.
Families that are below poverty line in Aiken earn $14,743 less on average than the poverty threshold level.
What is Inequality or Gini Index in Aiken?
Inequality or Gini Index in Aiken is 0.48.
What is the Total Population of Aiken?
Total Population of Aiken is 32,014.
What is the Total Male Population of Aiken?
Total Male Population of Aiken is 14,615.
What is the Total Female Population of Aiken?
Total Female Population of Aiken is 17,399.
What is the Ratio of Males per 100 Females in Aiken?
There are 84.00 Males per 100 Females in Aiken.
What is the Ratio of Females per 100 Males in Aiken?
There are 119.05 Females per 100 Males in Aiken.
What is the Median Population Age in Aiken?
Median Population Age in Aiken is 46.4 Years.
What is the Average Family Size in Aiken
Average Family Size in Aiken is 3.1 People.
What is the Average Household Size in Aiken
Average Household Size in Aiken is 2.3 People.
How Large is the Labor Force in Aiken?
There are 14,820 People in the Labor Forcein in Aiken.
What is the Percentage of People in the Labor Force in Aiken?
55.0% of People are in the Labor Force in Aiken.
What is the Unemployment Rate in Aiken?
Unemployment Rate in Aiken is 3.9%.