Cities with the Most Immigrants from Colombia in the United States
RELATED REPORTS & OPTIONS
Colombia
United States
Compare Cities
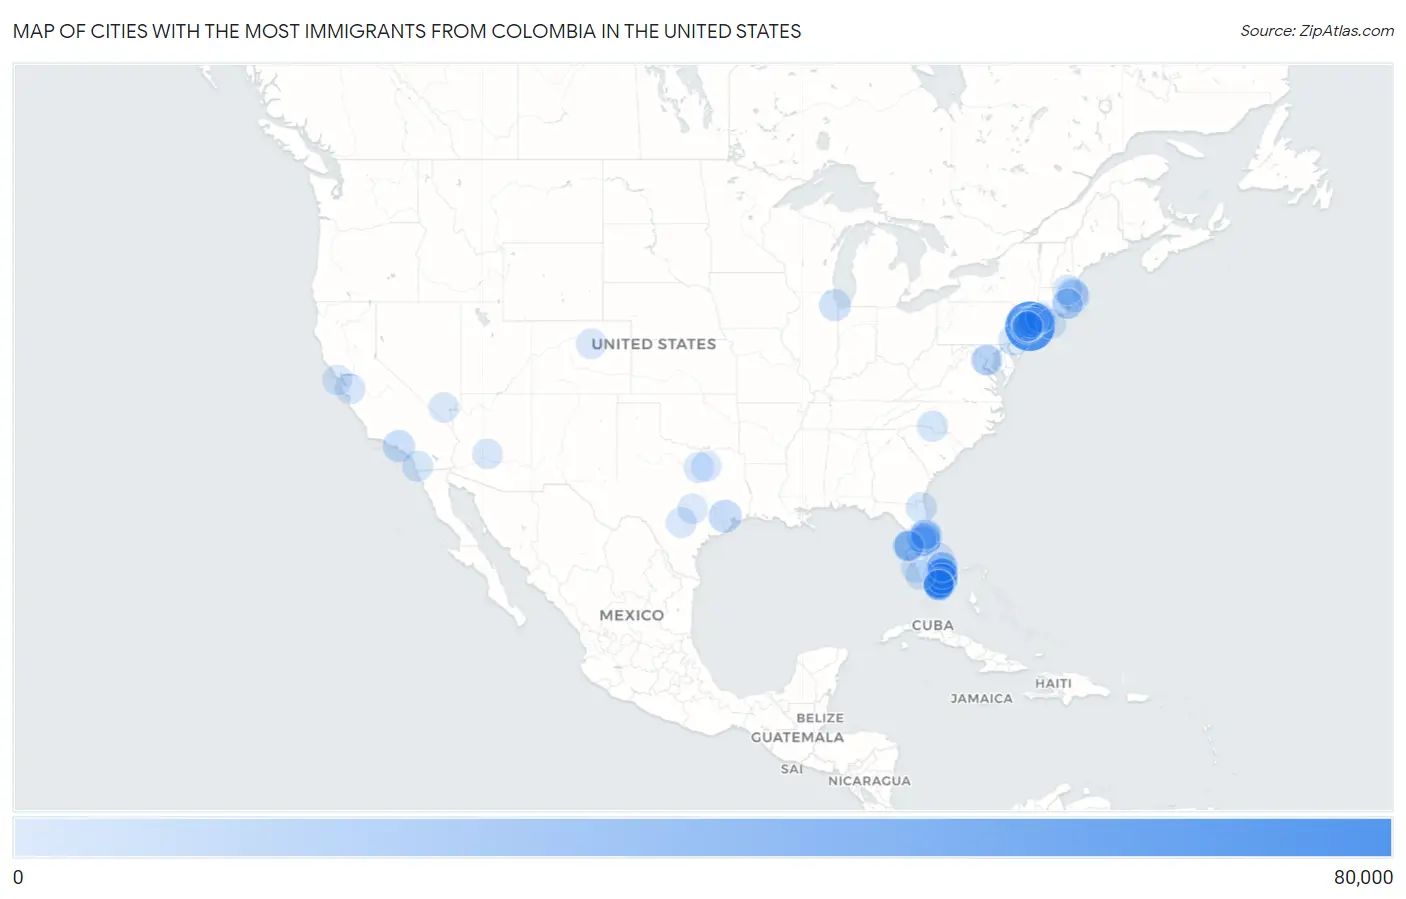
Map of Cities with the Most Immigrants from Colombia in the United States
0
80,000
Cities with the Most Immigrants from Colombia in the United States
| City | Colombia | vs State | vs National | |
| 1. | New York | 72,458 | 111,920(64.74%)#1 | 860,787(8.42%)#1 |
| 2. | Miami | 13,823 | 298,669(4.63%)#1 | 860,787(1.61%)#2 |
| 3. | Houston | 10,912 | 61,555(17.73%)#1 | 860,787(1.27%)#3 |
| 4. | Elizabeth | 10,463 | 90,817(11.52%)#1 | 860,787(1.22%)#4 |
| 5. | Pembroke Pines | 8,928 | 298,669(2.99%)#2 | 860,787(1.04%)#5 |
| 6. | Los Angeles | 7,908 | 55,249(14.31%)#1 | 860,787(0.92%)#6 |
| 7. | Hollywood | 7,764 | 298,669(2.60%)#3 | 860,787(0.90%)#7 |
| 8. | Doral | 7,520 | 298,669(2.52%)#4 | 860,787(0.87%)#8 |
| 9. | Boston | 7,118 | 27,810(25.60%)#1 | 860,787(0.83%)#9 |
| 10. | Weston | 6,138 | 298,669(2.06%)#5 | 860,787(0.71%)#10 |
| 11. | Sunrise | 5,951 | 298,669(1.99%)#6 | 860,787(0.69%)#11 |
| 12. | Chicago | 5,945 | 16,553(35.91%)#1 | 860,787(0.69%)#12 |
| 13. | Paterson | 5,432 | 90,817(5.98%)#2 | 860,787(0.63%)#13 |
| 14. | Revere | 5,050 | 27,810(18.16%)#2 | 860,787(0.59%)#14 |
| 15. | Country Club | 4,983 | 298,669(1.67%)#7 | 860,787(0.58%)#15 |
| 16. | Coral Springs | 4,927 | 298,669(1.65%)#8 | 860,787(0.57%)#16 |
| 17. | Hialeah | 4,875 | 298,669(1.63%)#9 | 860,787(0.57%)#17 |
| 18. | Orlando | 4,825 | 298,669(1.62%)#10 | 860,787(0.56%)#18 |
| 19. | Davie | 4,398 | 298,669(1.47%)#11 | 860,787(0.51%)#19 |
| 20. | Fountainebleau | 4,312 | 298,669(1.44%)#12 | 860,787(0.50%)#20 |
| 21. | Meadow Woods | 3,978 | 298,669(1.33%)#13 | 860,787(0.46%)#21 |
| 22. | Miramar | 3,975 | 298,669(1.33%)#14 | 860,787(0.46%)#22 |
| 23. | Miami Beach | 3,739 | 298,669(1.25%)#15 | 860,787(0.43%)#23 |
| 24. | Philadelphia | 3,725 | 13,823(26.95%)#1 | 860,787(0.43%)#24 |
| 25. | Aventura | 3,661 | 298,669(1.23%)#16 | 860,787(0.43%)#25 |
| 26. | The Hammocks | 3,516 | 298,669(1.18%)#17 | 860,787(0.41%)#26 |
| 27. | Charlotte | 3,462 | 18,275(18.94%)#1 | 860,787(0.40%)#27 |
| 28. | Jacksonville | 3,385 | 298,669(1.13%)#18 | 860,787(0.39%)#28 |
| 29. | San Diego | 3,162 | 55,249(5.72%)#2 | 860,787(0.37%)#29 |
| 30. | Tamarac | 3,085 | 298,669(1.03%)#19 | 860,787(0.36%)#30 |
| 31. | Kendall | 3,015 | 298,669(1.01%)#20 | 860,787(0.35%)#31 |
| 32. | Stamford | 3,011 | 18,124(16.61%)#1 | 860,787(0.35%)#32 |
| 33. | Tampa | 2,902 | 298,669(0.97%)#21 | 860,787(0.34%)#33 |
| 34. | Washington | 2,899 | 2,899(100.00%)#1 | 860,787(0.34%)#34 |
| 35. | Kendale Lakes | 2,821 | 298,669(0.94%)#22 | 860,787(0.33%)#35 |
| 36. | Town N Country | 2,769 | 298,669(0.93%)#23 | 860,787(0.32%)#36 |
| 37. | Kissimmee | 2,722 | 298,669(0.91%)#24 | 860,787(0.32%)#37 |
| 38. | Norwalk | 2,703 | 18,124(14.91%)#2 | 860,787(0.31%)#38 |
| 39. | West New York | 2,693 | 90,817(2.97%)#3 | 860,787(0.31%)#39 |
| 40. | Deerfield Beach | 2,668 | 298,669(0.89%)#25 | 860,787(0.31%)#40 |
| 41. | Union City | 2,589 | 90,817(2.85%)#4 | 860,787(0.30%)#41 |
| 42. | Clifton | 2,463 | 90,817(2.71%)#5 | 860,787(0.29%)#42 |
| 43. | Pawtucket | 2,366 | 6,520(36.29%)#1 | 860,787(0.27%)#43 |
| 44. | Cape Coral | 2,351 | 298,669(0.79%)#26 | 860,787(0.27%)#44 |
| 45. | Kendall West | 2,339 | 298,669(0.78%)#27 | 860,787(0.27%)#45 |
| 46. | North Miami | 2,335 | 298,669(0.78%)#28 | 860,787(0.27%)#46 |
| 47. | San Antonio | 2,325 | 61,555(3.78%)#2 | 860,787(0.27%)#47 |
| 48. | Coconut Creek | 2,174 | 298,669(0.73%)#29 | 860,787(0.25%)#48 |
| 49. | San Jose | 2,150 | 55,249(3.89%)#3 | 860,787(0.25%)#49 |
| 50. | Fort Lauderdale | 2,145 | 298,669(0.72%)#30 | 860,787(0.25%)#50 |
| 51. | Sunny Isles Beach | 2,127 | 298,669(0.71%)#31 | 860,787(0.25%)#51 |
| 52. | Dover | 2,048 | 90,817(2.26%)#6 | 860,787(0.24%)#52 |
| 53. | North Miami Beach | 2,001 | 298,669(0.67%)#32 | 860,787(0.23%)#53 |
| 54. | Alafaya | 1,990 | 298,669(0.67%)#33 | 860,787(0.23%)#54 |
| 55. | Margate | 1,861 | 298,669(0.62%)#34 | 860,787(0.22%)#55 |
| 56. | Phoenix | 1,858 | 6,030(30.81%)#1 | 860,787(0.22%)#56 |
| 57. | Jersey City | 1,828 | 90,817(2.01%)#7 | 860,787(0.21%)#57 |
| 58. | Denver | 1,817 | 5,971(30.43%)#1 | 860,787(0.21%)#58 |
| 59. | White Plains | 1,810 | 111,920(1.62%)#2 | 860,787(0.21%)#59 |
| 60. | Port St Lucie | 1,792 | 298,669(0.60%)#35 | 860,787(0.21%)#60 |
| 61. | Richmond West | 1,738 | 298,669(0.58%)#36 | 860,787(0.20%)#61 |
| 62. | Ojus | 1,734 | 298,669(0.58%)#37 | 860,787(0.20%)#62 |
| 63. | Linden | 1,732 | 90,817(1.91%)#8 | 860,787(0.20%)#63 |
| 64. | Englewood | 1,719 | 90,817(1.89%)#9 | 860,787(0.20%)#64 |
| 65. | Greenacres | 1,711 | 298,669(0.57%)#38 | 860,787(0.20%)#65 |
| 66. | Bridgeport | 1,671 | 18,124(9.22%)#3 | 860,787(0.19%)#66 |
| 67. | Hampton Bays | 1,630 | 111,920(1.46%)#3 | 860,787(0.19%)#67 |
| 68. | Boca Raton | 1,628 | 298,669(0.55%)#39 | 860,787(0.19%)#68 |
| 69. | Austin | 1,607 | 61,555(2.61%)#3 | 860,787(0.19%)#69 |
| 70. | Arlington | 1,580 | 14,435(10.95%)#1 | 860,787(0.18%)#70 |
| 71. | Fort Worth | 1,579 | 61,555(2.57%)#4 | 860,787(0.18%)#71 |
| 72. | Cutler Bay | 1,548 | 298,669(0.52%)#40 | 860,787(0.18%)#72 |
| 73. | Lodi Borough | 1,523 | 90,817(1.68%)#10 | 860,787(0.18%)#73 |
| 74. | Coral Gables | 1,507 | 298,669(0.50%)#41 | 860,787(0.18%)#74 |
| 75. | Lowell | 1,502 | 27,810(5.40%)#3 | 860,787(0.17%)#75 |
| 76. | Hallandale Beach | 1,501 | 298,669(0.50%)#42 | 860,787(0.17%)#76 |
| 77. | Tamiami | 1,486 | 298,669(0.50%)#43 | 860,787(0.17%)#77 |
| 78. | San Francisco | 1,484 | 55,249(2.69%)#4 | 860,787(0.17%)#78 |
| 79. | Four Corners | 1,480 | 298,669(0.50%)#44 | 860,787(0.17%)#79 |
| 80. | Homestead | 1,471 | 298,669(0.49%)#45 | 860,787(0.17%)#80 |
| 81. | Carrollwood | 1,462 | 298,669(0.49%)#46 | 860,787(0.17%)#81 |
| 82. | Central Falls | 1,426 | 6,520(21.87%)#2 | 860,787(0.17%)#82 |
| 83. | Dallas | 1,420 | 61,555(2.31%)#5 | 860,787(0.16%)#83 |
| 84. | Miami Gardens | 1,419 | 298,669(0.48%)#47 | 860,787(0.16%)#84 |
| 85. | Wellington | 1,396 | 298,669(0.47%)#48 | 860,787(0.16%)#85 |
| 86. | Yonkers | 1,395 | 111,920(1.25%)#4 | 860,787(0.16%)#86 |
| 87. | The Crossings | 1,368 | 298,669(0.46%)#49 | 860,787(0.16%)#87 |
| 88. | Las Vegas | 1,365 | 5,045(27.06%)#1 | 860,787(0.16%)#88 |
| 89. | Pompano Beach | 1,360 | 298,669(0.46%)#50 | 860,787(0.16%)#89 |
| 90. | Harrison | 1,337 | 90,817(1.47%)#11 | 860,787(0.16%)#90 |
| 91. | South Miami Heights | 1,224 | 298,669(0.41%)#51 | 860,787(0.14%)#91 |
| 92. | Newark | 1,217 | 90,817(1.34%)#12 | 860,787(0.14%)#92 |
| 93. | Bergenfield Borough | 1,182 | 90,817(1.30%)#13 | 860,787(0.14%)#93 |
| 94. | Winter Garden | 1,179 | 298,669(0.39%)#52 | 860,787(0.14%)#94 |
| 95. | Golden Gate | 1,171 | 298,669(0.39%)#53 | 860,787(0.14%)#95 |
| 96. | Sanford | 1,148 | 298,669(0.38%)#54 | 860,787(0.13%)#96 |
| 97. | Altamonte Springs | 1,148 | 298,669(0.38%)#55 | 860,787(0.13%)#97 |
| 98. | Egypt Lake Leto | 1,133 | 298,669(0.38%)#56 | 860,787(0.13%)#98 |
| 99. | West Palm Beach | 1,108 | 298,669(0.37%)#57 | 860,787(0.13%)#99 |
| 100. | Princeton | 1,081 | 298,669(0.36%)#58 | 860,787(0.13%)#100 |
Common Questions
What are the Top 10 Cities with the Most Immigrants from Colombia in the United States?
Top 10 Cities with the Most Immigrants from Colombia in the United States are:
What city has the Most Immigrants from Colombia in the United States?
New York has the Most Immigrants from Colombia in the United States with 72,458.
What is the Total Immigrants from Colombia in the United States?
Total Immigrants from Colombia in the United States is 860,787.