Cities with the Highest Percentage of Population Employed in Transportation in the United States
RELATED REPORTS & OPTIONS
Transportation
United States
Compare Cities
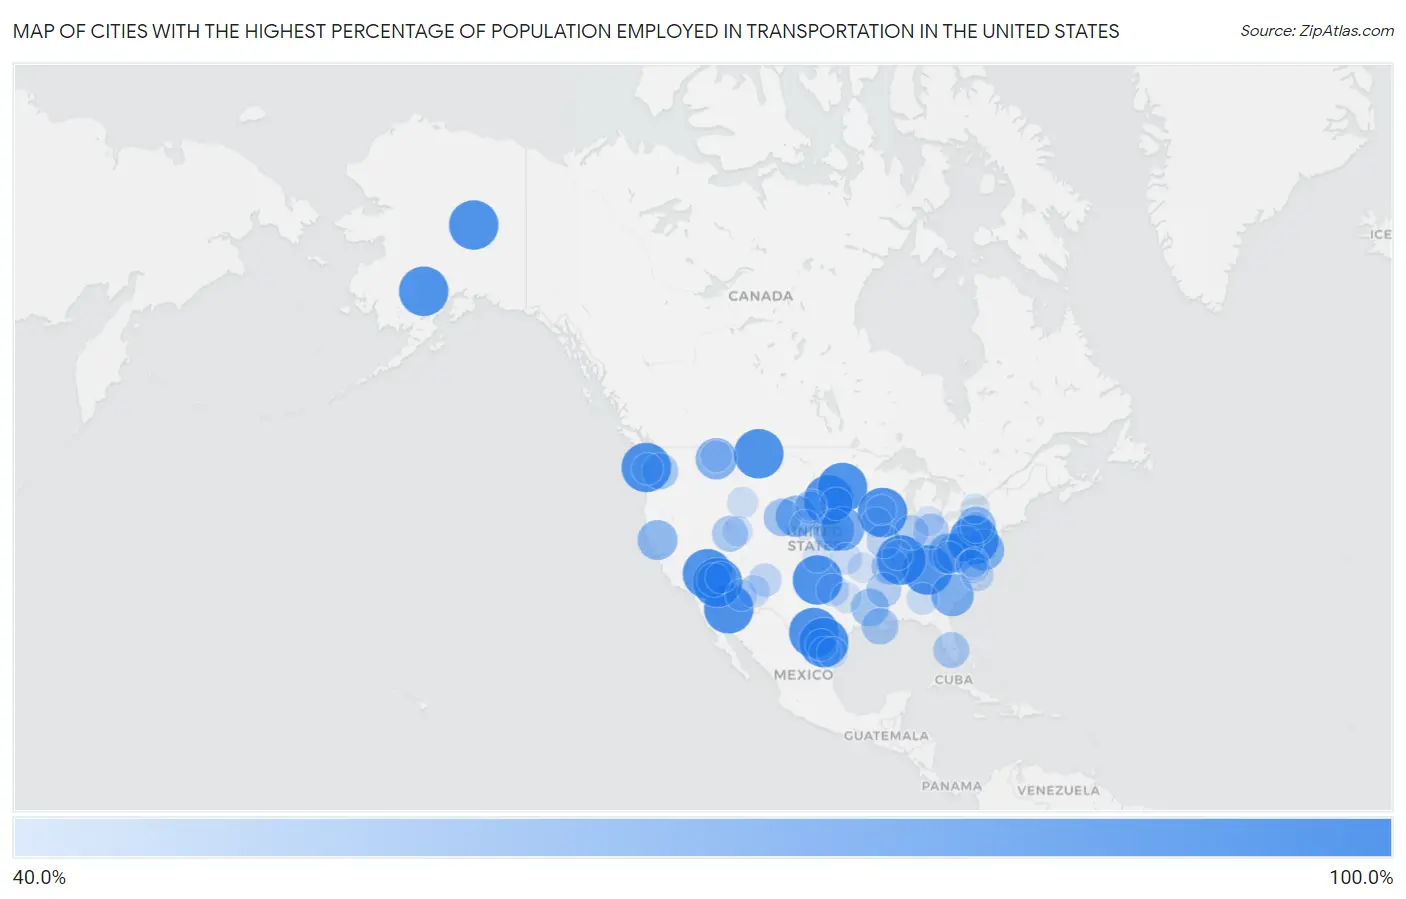
Map of Cities with the Highest Percentage of Population Employed in Transportation in the United States
0.0%
100.0%
Cities with the Highest Percentage of Population Employed in Transportation in the United States
| City | % Employed | vs State | vs National | |
| 1. | Rio | 100.0% | 4.3%(+95.7)#1 | 3.8%(+96.2)#1 |
| 2. | Swift Bird | 100.0% | 3.9%(+96.1)#1 | 3.8%(+96.2)#2 |
| 3. | Elgin | 100.0% | 4.0%(+96.0)#1 | 3.8%(+96.2)#3 |
| 4. | Goodsprings | 100.0% | 4.5%(+95.5)#1 | 3.8%(+96.2)#4 |
| 5. | Pecktonville | 100.0% | 3.4%(+96.6)#1 | 3.8%(+96.2)#5 |
| 6. | Ali Chuk | 100.0% | 3.5%(+96.5)#1 | 3.8%(+96.2)#6 |
| 7. | Dodson | 100.0% | 3.7%(+96.3)#1 | 3.8%(+96.2)#7 |
| 8. | Quemado | 100.0% | 4.2%(+95.8)#1 | 3.8%(+96.2)#8 |
| 9. | Candy Kitchen | 100.0% | 3.8%(+96.2)#1 | 3.8%(+96.2)#9 |
| 10. | Yucca | 100.0% | 3.5%(+96.5)#2 | 3.8%(+96.2)#10 |
| 11. | Oyehut | 100.0% | 3.7%(+96.3)#1 | 3.8%(+96.2)#11 |
| 12. | Oral | 100.0% | 3.9%(+96.1)#2 | 3.8%(+96.2)#12 |
| 13. | Burlington | 100.0% | 4.2%(+95.8)#2 | 3.8%(+96.2)#13 |
| 14. | Neal | 100.0% | 3.5%(+96.5)#1 | 3.8%(+96.2)#14 |
| 15. | Moselle | 100.0% | 5.1%(+94.9)#1 | 3.8%(+96.2)#15 |
| 16. | Oxville | 100.0% | 4.2%(+95.8)#1 | 3.8%(+96.2)#16 |
| 17. | Cloverleaf Colony | 100.0% | 3.9%(+96.1)#3 | 3.8%(+96.2)#17 |
| 18. | Livengood | 100.0% | 4.8%(+95.2)#1 | 3.8%(+96.2)#18 |
| 19. | Texola | 100.0% | 3.7%(+96.3)#1 | 3.8%(+96.2)#19 |
| 20. | Carlton | 100.0% | 4.2%(+95.8)#3 | 3.8%(+96.2)#20 |
| 21. | Lime Village | 100.0% | 4.8%(+95.2)#2 | 3.8%(+96.2)#21 |
| 22. | Tolu | 100.0% | 4.1%(+95.9)#1 | 3.8%(+96.2)#22 |
| 23. | Hillside Acres | 100.0% | 4.2%(+95.8)#4 | 3.8%(+96.2)#23 |
| 24. | Storla | 100.0% | 3.9%(+96.1)#4 | 3.8%(+96.2)#24 |
| 25. | Albee | 100.0% | 3.9%(+96.1)#5 | 3.8%(+96.2)#25 |
| 26. | Bankston | 100.0% | 4.0%(+96.0)#1 | 3.8%(+96.2)#26 |
| 27. | Walton | 84.4% | 3.8%(+80.6)#1 | 3.8%(+80.6)#27 |
| 28. | Cope | 81.8% | 3.7%(+78.1)#1 | 3.8%(+78.0)#28 |
| 29. | Lushton | 80.0% | 3.8%(+76.2)#2 | 3.8%(+76.2)#29 |
| 30. | Dayton | 78.6% | 3.7%(+74.9)#2 | 3.8%(+74.8)#30 |
| 31. | Berea | 78.3% | 3.8%(+74.5)#3 | 3.8%(+74.4)#31 |
| 32. | Eagle Harbor | 78.1% | 3.4%(+74.7)#2 | 3.8%(+74.3)#32 |
| 33. | Comfort | 77.5% | 4.6%(+72.9)#1 | 3.8%(+73.7)#33 |
| 34. | Fenwick | 75.0% | 4.6%(+70.4)#2 | 3.8%(+71.2)#34 |
| 35. | Elk Creek | 75.0% | 3.5%(+71.5)#1 | 3.8%(+71.2)#35 |
| 36. | Monument | 72.7% | 3.8%(+68.9)#1 | 3.8%(+68.9)#36 |
| 37. | Medill | 71.7% | 3.9%(+67.8)#1 | 3.8%(+67.9)#37 |
| 38. | Torreon Cdp Torrance County | 71.6% | 3.8%(+67.8)#2 | 3.8%(+67.8)#38 |
| 39. | Durham | 70.0% | 3.7%(+66.3)#2 | 3.8%(+66.2)#39 |
| 40. | Joyce | 69.4% | 4.3%(+65.2)#2 | 3.8%(+65.6)#40 |
| 41. | Y O Ranch | 69.0% | 4.5%(+64.5)#1 | 3.8%(+65.2)#41 |
| 42. | Penermon | 66.7% | 3.9%(+62.7)#2 | 3.8%(+62.8)#42 |
| 43. | Siracusaville | 66.4% | 4.3%(+62.1)#3 | 3.8%(+62.5)#43 |
| 44. | Gorman | 65.5% | 3.4%(+62.1)#3 | 3.8%(+61.7)#44 |
| 45. | Mineral | 65.5% | 3.7%(+61.7)#2 | 3.8%(+61.6)#45 |
| 46. | Ophir | 64.9% | 3.4%(+61.4)#1 | 3.8%(+61.0)#46 |
| 47. | Pioneer | 64.5% | 4.2%(+60.3)#1 | 3.8%(+60.7)#47 |
| 48. | Piñas | 63.2% | 3.0%(+60.1)#1 | 3.8%(+59.3)#48 |
| 49. | Uniopolis | 63.0% | 3.8%(+59.2)#1 | 3.8%(+59.1)#49 |
| 50. | Duncan | 62.0% | 5.1%(+56.9)#2 | 3.8%(+58.2)#50 |
| 51. | Buck Creek | 61.4% | 4.0%(+57.4)#1 | 3.8%(+57.6)#51 |
| 52. | Baskerville | 60.0% | 3.4%(+56.6)#1 | 3.8%(+56.2)#52 |
| 53. | Time | 60.0% | 4.2%(+55.8)#2 | 3.8%(+56.2)#53 |
| 54. | Katherine | 59.3% | 3.5%(+55.8)#3 | 3.8%(+55.5)#54 |
| 55. | Los Ebanos Cdp Starr County | 58.0% | 4.2%(+53.8)#5 | 3.8%(+54.2)#55 |
| 56. | Seboyeta | 57.8% | 3.8%(+54.0)#3 | 3.8%(+54.0)#56 |
| 57. | Smithwick | 57.1% | 3.9%(+53.2)#6 | 3.8%(+53.3)#57 |
| 58. | Dolton | 56.7% | 3.9%(+52.7)#7 | 3.8%(+52.8)#58 |
| 59. | Mcallister | 56.5% | 3.7%(+52.8)#3 | 3.8%(+52.7)#59 |
| 60. | Sugden | 56.2% | 3.7%(+52.5)#3 | 3.8%(+52.4)#60 |
| 61. | Spring Creek | 55.9% | 3.9%(+51.9)#8 | 3.8%(+52.1)#61 |
| 62. | Webster | 55.8% | 4.0%(+51.8)#2 | 3.8%(+52.0)#62 |
| 63. | Luna | 55.6% | 3.8%(+51.7)#4 | 3.8%(+51.7)#63 |
| 64. | Falkland | 55.5% | 3.5%(+51.9)#1 | 3.8%(+51.6)#64 |
| 65. | Reightown | 54.8% | 3.8%(+51.0)#2 | 3.8%(+51.0)#65 |
| 66. | Kopperston | 54.7% | 4.6%(+50.2)#3 | 3.8%(+50.9)#66 |
| 67. | Bivins | 54.5% | 4.2%(+50.4)#6 | 3.8%(+50.7)#67 |
| 68. | Charlottsville | 54.5% | 3.8%(+50.7)#3 | 3.8%(+50.7)#68 |
| 69. | Pinal | 54.3% | 3.5%(+50.8)#4 | 3.8%(+50.5)#69 |
| 70. | Dora | 54.3% | 4.2%(+50.1)#1 | 3.8%(+50.5)#70 |
| 71. | J F Villareal | 54.3% | 4.2%(+50.1)#7 | 3.8%(+50.4)#71 |
| 72. | Fredonia | 54.2% | 4.0%(+50.1)#1 | 3.8%(+50.3)#72 |
| 73. | Dorseyville | 54.1% | 4.3%(+49.8)#4 | 3.8%(+50.3)#73 |
| 74. | La Presa | 54.0% | 4.2%(+49.9)#8 | 3.8%(+50.2)#74 |
| 75. | Somers | 53.9% | 3.7%(+50.2)#4 | 3.8%(+50.1)#75 |
| 76. | Truxton | 53.8% | 3.5%(+50.3)#5 | 3.8%(+50.0)#76 |
| 77. | New Albany | 53.8% | 3.5%(+50.4)#2 | 3.8%(+50.0)#77 |
| 78. | Markham | 53.7% | 3.7%(+49.9)#3 | 3.8%(+49.8)#78 |
| 79. | Soldier Creek | 53.3% | 3.9%(+49.4)#9 | 3.8%(+49.5)#79 |
| 80. | Paris Crossing | 53.3% | 4.0%(+49.4)#3 | 3.8%(+49.5)#80 |
| 81. | Kelly | 52.5% | 4.5%(+48.0)#2 | 3.8%(+48.7)#81 |
| 82. | Zapata Ranch | 52.4% | 4.2%(+48.2)#9 | 3.8%(+48.6)#82 |
| 83. | Mingoville | 52.2% | 3.8%(+48.4)#4 | 3.8%(+48.4)#83 |
| 84. | Salado | 52.1% | 4.2%(+47.9)#2 | 3.8%(+48.3)#84 |
| 85. | Thynedale | 52.0% | 3.4%(+48.6)#2 | 3.8%(+48.2)#85 |
| 86. | Neylandville | 51.8% | 4.2%(+47.6)#10 | 3.8%(+48.0)#86 |
| 87. | Frytown | 51.4% | 4.0%(+47.4)#2 | 3.8%(+47.6)#87 |
| 88. | Fernwood | 51.4% | 5.1%(+46.3)#3 | 3.8%(+47.6)#88 |
| 89. | Eagle Rock | 51.3% | 3.9%(+47.4)#3 | 3.8%(+47.5)#89 |
| 90. | Samak | 51.2% | 3.4%(+47.7)#2 | 3.8%(+47.3)#90 |
| 91. | Shipshewana Lake | 50.6% | 4.0%(+46.6)#4 | 3.8%(+46.8)#91 |
| 92. | Fort Dodge | 50.0% | 3.5%(+46.5)#3 | 3.8%(+46.2)#92 |
| 93. | Alvordton | 50.0% | 3.8%(+46.2)#2 | 3.8%(+46.2)#93 |
| 94. | Nottoway Court House | 50.0% | 3.4%(+46.6)#3 | 3.8%(+46.2)#94 |
| 95. | Essary Springs | 50.0% | 4.0%(+46.0)#2 | 3.8%(+46.2)#95 |
| 96. | Rivervale | 50.0% | 4.2%(+45.8)#3 | 3.8%(+46.2)#96 |
| 97. | Lemoyne | 50.0% | 3.8%(+46.2)#4 | 3.8%(+46.2)#97 |
| 98. | Glen Haven | 50.0% | 3.6%(+46.4)#1 | 3.8%(+46.2)#98 |
| 99. | Linwood | 50.0% | 3.9%(+46.1)#1 | 3.8%(+46.2)#99 |
| 100. | Macedonia | 50.0% | 4.2%(+45.8)#3 | 3.8%(+46.2)#100 |
Common Questions
What are the Top 10 Cities with the Highest Percentage of Population Employed in Transportation in the United States?
Top 10 Cities with the Highest Percentage of Population Employed in Transportation in the United States are:
What city has the Highest Percentage of Population Employed in Transportation in the United States?
Elgin has the Highest Percentage of Population Employed in Transportation in the United States with 100.0%.
What is the Percentage of Population Employed in Transportation in the United States?
Percentage of Population Employed in Transportation in the United States is 3.8%.