Florence County, SC Map & Demographics
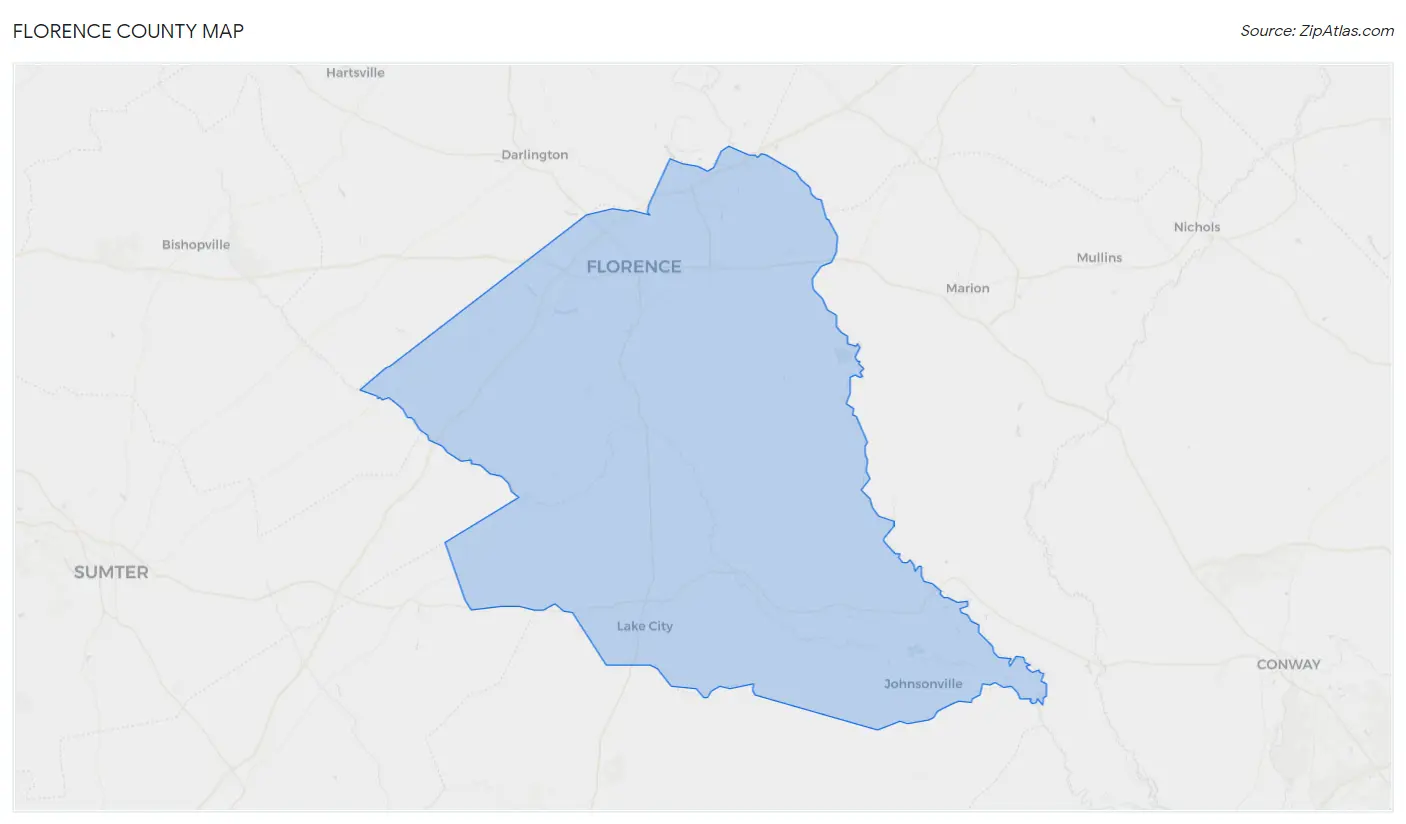
Florence County Map
Florence County Overview
$30,733
PER CAPITA INCOME
$73,657
AVG FAMILY INCOME
$56,088
AVG HOUSEHOLD INCOME
28.9%
WAGE / INCOME GAP [ % ]
71.1¢/ $1
WAGE / INCOME GAP [ $ ]
$11,637
FAMILY INCOME DEFICIT
0.48
INEQUALITY / GINI INDEX
137,015
TOTAL POPULATION
64,679
MALE POPULATION
72,336
FEMALE POPULATION
89.41
MALES / 100 FEMALES
111.84
FEMALES / 100 MALES
39.0
MEDIAN AGE
3.3
AVG FAMILY SIZE
2.6
AVG HOUSEHOLD SIZE
63,374
LABOR FORCE [ PEOPLE ]
58.3%
PERCENT IN LABOR FORCE
4.5%
UNEMPLOYMENT RATE
Florence County Area Codes
Income in Florence County
Income Overview in Florence County
Per Capita Income in Florence County is $30,733, while median incomes of families and households are $73,657 and $56,088 respectively.
| Characteristic | Number | Measure |
| Per Capita Income | 137,015 | $30,733 |
| Median Family Income | 33,312 | $73,657 |
| Mean Family Income | 33,312 | $93,996 |
| Median Household Income | 52,244 | $56,088 |
| Mean Household Income | 52,244 | $76,763 |
| Income Deficit | 33,312 | $11,637 |
| Wage / Income Gap (%) | 137,015 | 28.90% |
| Wage / Income Gap ($) | 137,015 | 71.10¢ per $1 |
| Gini / Inequality Index | 137,015 | 0.48 |
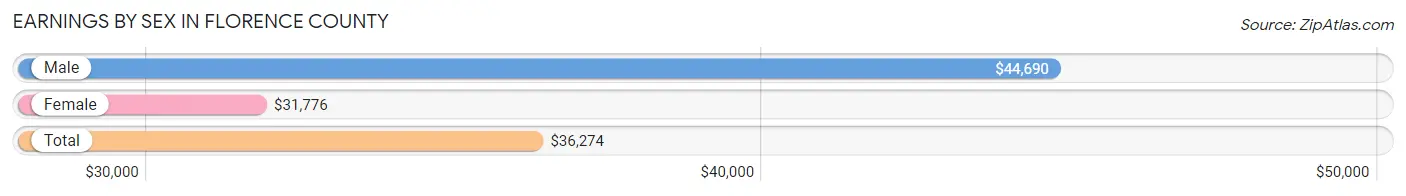
Earnings by Sex in Florence County
Average Earnings in Florence County are $36,274, $44,690 for men and $31,776 for women, a difference of 28.9%.
| Sex | Number | Average Earnings |
| Male | 31,783 (48.7%) | $44,690 |
| Female | 33,416 (51.2%) | $31,776 |
| Total | 65,199 (100.0%) | $36,274 |
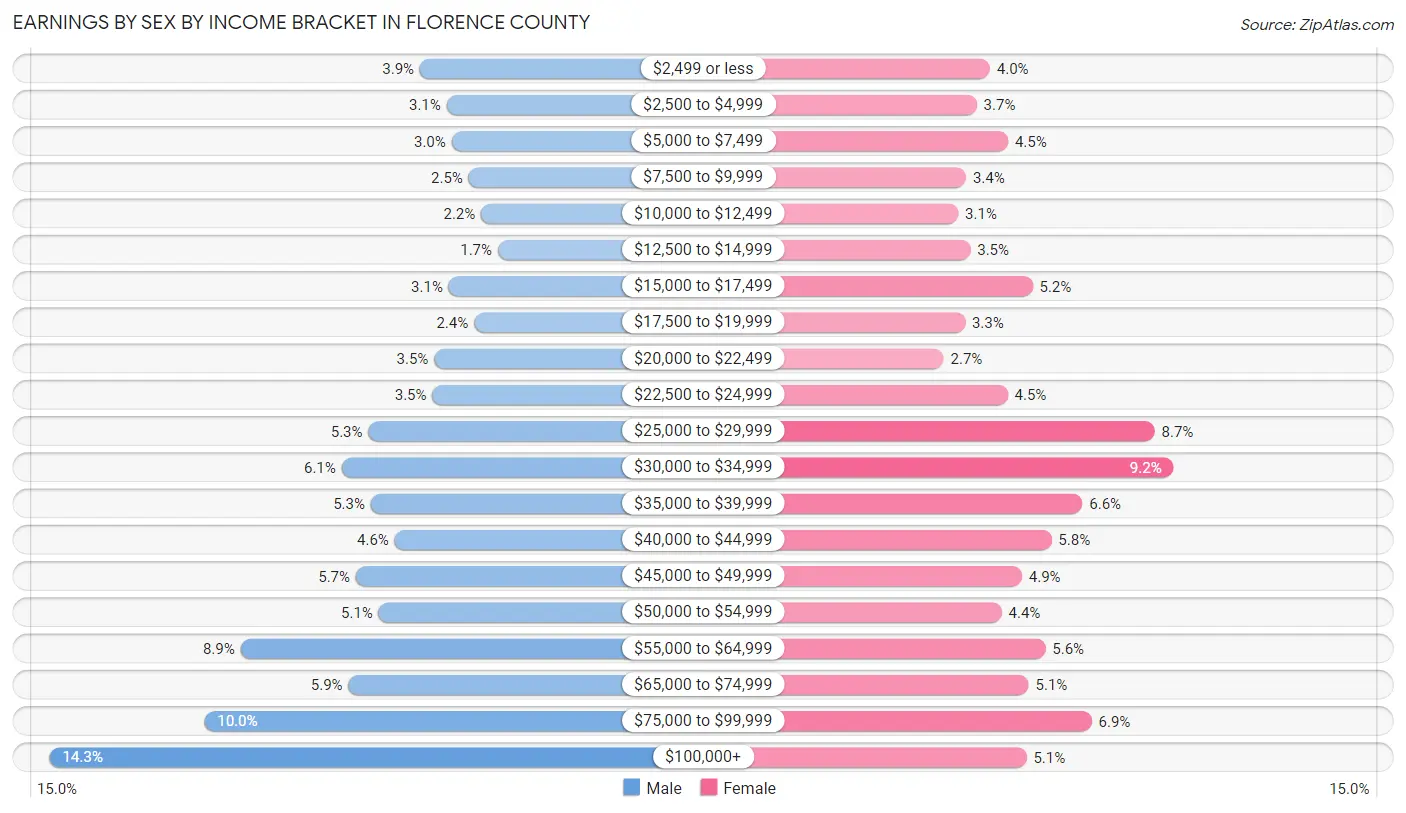
Earnings by Sex by Income Bracket in Florence County
The most common earnings brackets in Florence County are $100,000+ for men (4,546 | 14.3%) and $30,000 to $34,999 for women (3,066 | 9.2%).
| Income | Male | Female |
| $2,499 or less | 1,237 (3.9%) | 1,344 (4.0%) |
| $2,500 to $4,999 | 999 (3.1%) | 1,220 (3.6%) |
| $5,000 to $7,499 | 953 (3.0%) | 1,514 (4.5%) |
| $7,500 to $9,999 | 802 (2.5%) | 1,118 (3.4%) |
| $10,000 to $12,499 | 689 (2.2%) | 1,045 (3.1%) |
| $12,500 to $14,999 | 539 (1.7%) | 1,158 (3.5%) |
| $15,000 to $17,499 | 978 (3.1%) | 1,745 (5.2%) |
| $17,500 to $19,999 | 752 (2.4%) | 1,108 (3.3%) |
| $20,000 to $22,499 | 1,108 (3.5%) | 909 (2.7%) |
| $22,500 to $24,999 | 1,125 (3.5%) | 1,509 (4.5%) |
| $25,000 to $29,999 | 1,696 (5.3%) | 2,890 (8.6%) |
| $30,000 to $34,999 | 1,936 (6.1%) | 3,066 (9.2%) |
| $35,000 to $39,999 | 1,674 (5.3%) | 2,213 (6.6%) |
| $40,000 to $44,999 | 1,462 (4.6%) | 1,922 (5.8%) |
| $45,000 to $49,999 | 1,807 (5.7%) | 1,645 (4.9%) |
| $50,000 to $54,999 | 1,606 (5.1%) | 1,452 (4.3%) |
| $55,000 to $64,999 | 2,837 (8.9%) | 1,864 (5.6%) |
| $65,000 to $74,999 | 1,874 (5.9%) | 1,707 (5.1%) |
| $75,000 to $99,999 | 3,163 (10.0%) | 2,299 (6.9%) |
| $100,000+ | 4,546 (14.3%) | 1,688 (5.1%) |
| Total | 31,783 (100.0%) | 33,416 (100.0%) |
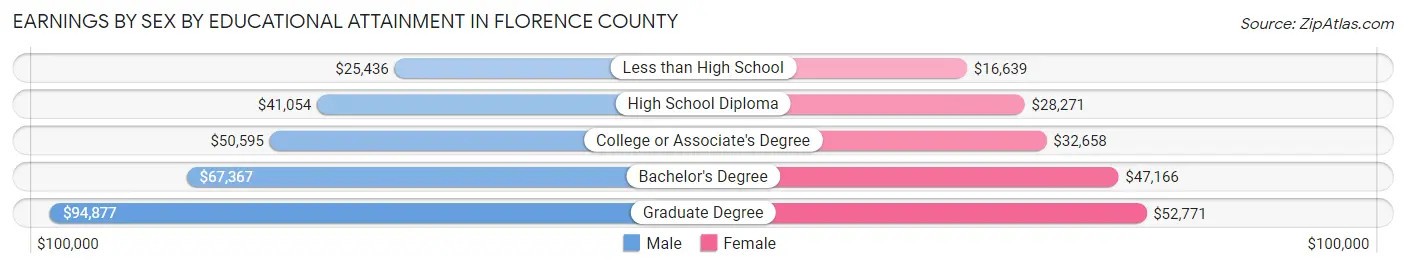
Earnings by Sex by Educational Attainment in Florence County
Average earnings in Florence County are $49,921 for men and $35,157 for women, a difference of 29.6%. Men with an educational attainment of graduate degree enjoy the highest average annual earnings of $94,877, while those with less than high school education earn the least with $25,436. Women with an educational attainment of graduate degree earn the most with the average annual earnings of $52,771, while those with less than high school education have the smallest earnings of $16,639.
| Educational Attainment | Male Income | Female Income |
| Less than High School | $25,436 | $16,639 |
| High School Diploma | $41,054 | $28,271 |
| College or Associate's Degree | $50,595 | $32,658 |
| Bachelor's Degree | $67,367 | $47,166 |
| Graduate Degree | $94,877 | $52,771 |
| Total | $49,921 | $35,157 |
Family Income in Florence County
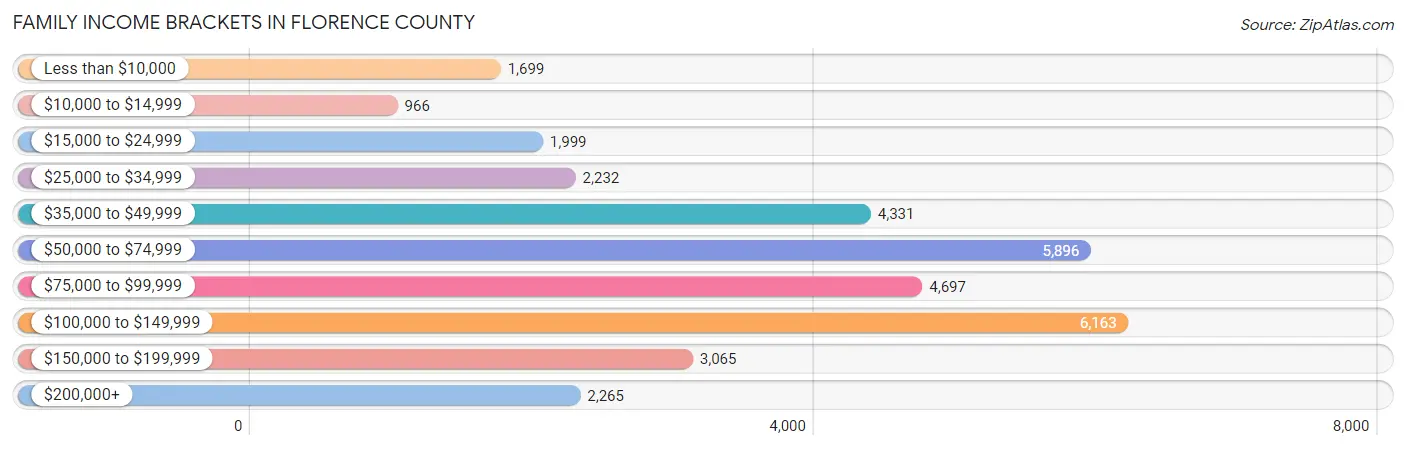
Family Income Brackets in Florence County
According to the Florence County family income data, there are 6,163 families falling into the $100,000 to $149,999 income range, which is the most common income bracket and makes up 18.5% of all families. Conversely, the $10,000 to $14,999 income bracket is the least frequent group with only 966 families (2.9%) belonging to this category.
| Income Bracket | # Families | % Families |
| Less than $10,000 | 1,699 | 5.1% |
| $10,000 to $14,999 | 966 | 2.9% |
| $15,000 to $24,999 | 1,999 | 6.0% |
| $25,000 to $34,999 | 2,232 | 6.7% |
| $35,000 to $49,999 | 4,331 | 13.0% |
| $50,000 to $74,999 | 5,896 | 17.7% |
| $75,000 to $99,999 | 4,697 | 14.1% |
| $100,000 to $149,999 | 6,163 | 18.5% |
| $150,000 to $199,999 | 3,065 | 9.2% |
| $200,000+ | 2,265 | 6.8% |
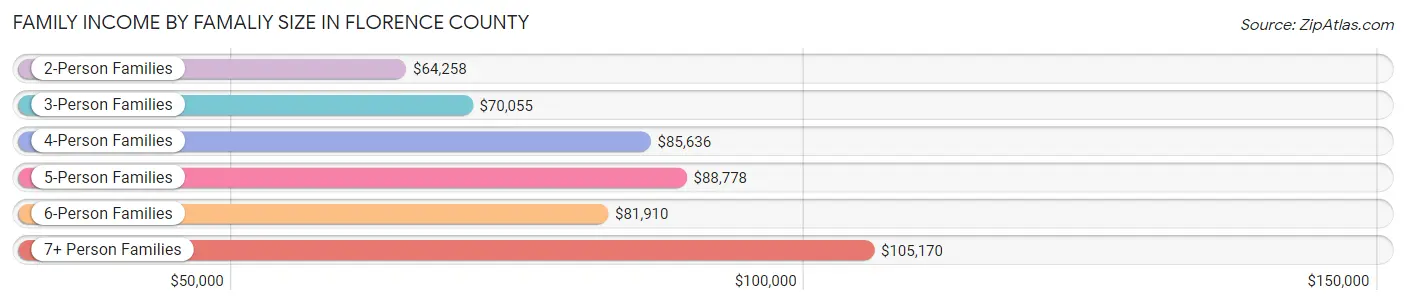
Family Income by Famaliy Size in Florence County
7+ person families (323 | 1.0%) account for the highest median family income in Florence County with $105,170 per family, while 2-person families (15,929 | 47.8%) have the highest median income of $32,129 per family member.
| Income Bracket | # Families | Median Income |
| 2-Person Families | 15,929 (47.8%) | $64,258 |
| 3-Person Families | 7,970 (23.9%) | $70,055 |
| 4-Person Families | 5,915 (17.8%) | $85,636 |
| 5-Person Families | 2,288 (6.9%) | $88,778 |
| 6-Person Families | 887 (2.7%) | $81,910 |
| 7+ Person Families | 323 (1.0%) | $105,170 |
| Total | 33,312 (100.0%) | $73,657 |
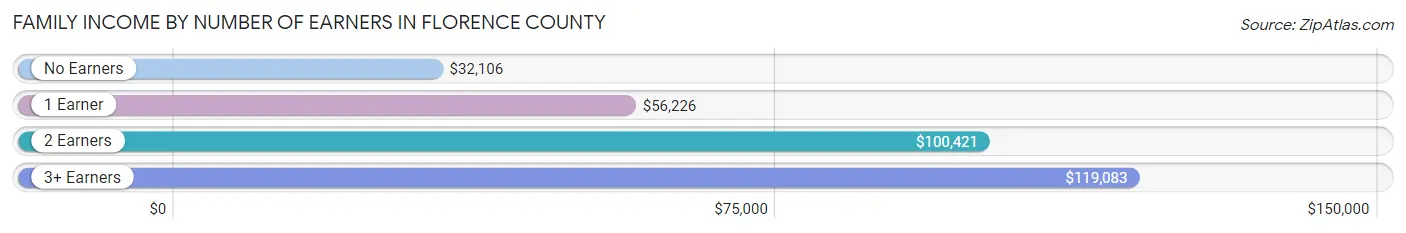
Family Income by Number of Earners in Florence County
The median family income in Florence County is $73,657, with families comprising 3+ earners (3,156) having the highest median family income of $119,083, while families with no earners (5,963) have the lowest median family income of $32,106, accounting for 9.5% and 17.9% of families, respectively.
| Number of Earners | # Families | Median Income |
| No Earners | 5,963 (17.9%) | $32,106 |
| 1 Earner | 11,922 (35.8%) | $56,226 |
| 2 Earners | 12,271 (36.8%) | $100,421 |
| 3+ Earners | 3,156 (9.5%) | $119,083 |
| Total | 33,312 (100.0%) | $73,657 |
Household Income in Florence County
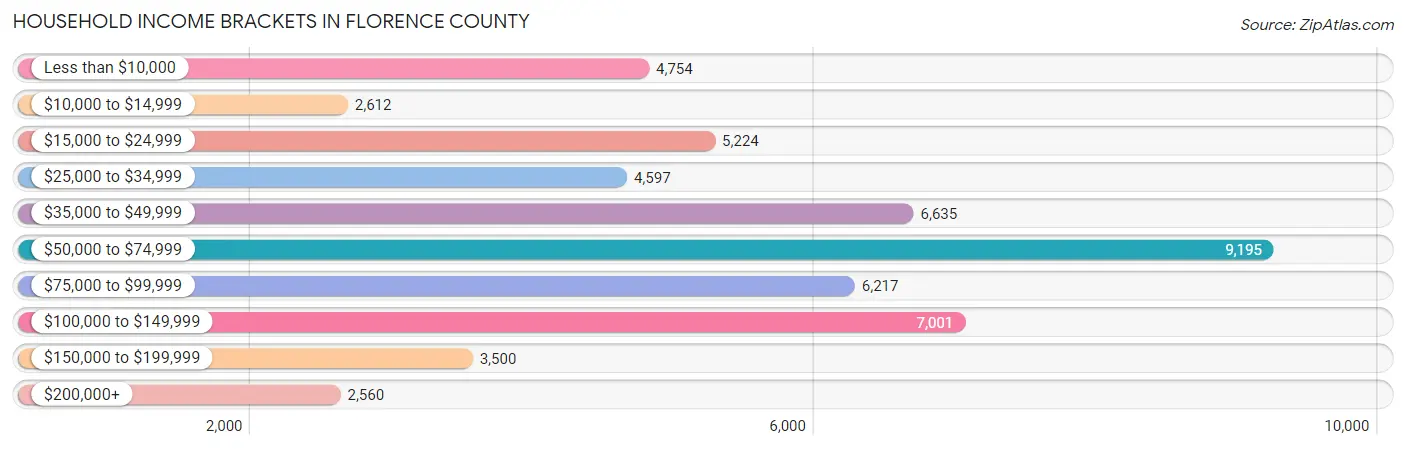
Household Income Brackets in Florence County
With 9,195 households falling in the category, the $50,000 to $74,999 income range is the most frequent in Florence County, accounting for 17.6% of all households. In contrast, only 2,560 households (4.9%) fall into the $200,000+ income bracket, making it the least populous group.
| Income Bracket | # Households | % Households |
| Less than $10,000 | 4,754 | 9.1% |
| $10,000 to $14,999 | 2,612 | 5.0% |
| $15,000 to $24,999 | 5,224 | 10.0% |
| $25,000 to $34,999 | 4,597 | 8.8% |
| $35,000 to $49,999 | 6,635 | 12.7% |
| $50,000 to $74,999 | 9,195 | 17.6% |
| $75,000 to $99,999 | 6,217 | 11.9% |
| $100,000 to $149,999 | 7,001 | 13.4% |
| $150,000 to $199,999 | 3,500 | 6.7% |
| $200,000+ | 2,560 | 4.9% |
Household Income by Householder Age in Florence County
The median household income in Florence County is $56,088, with the highest median household income of $66,972 found in the 25 to 44 years age bracket for the primary householder. A total of 16,549 households (31.7%) fall into this category. Meanwhile, the 15 to 24 years age bracket for the primary householder has the lowest median household income of $24,222, with 1,727 households (3.3%) in this group.
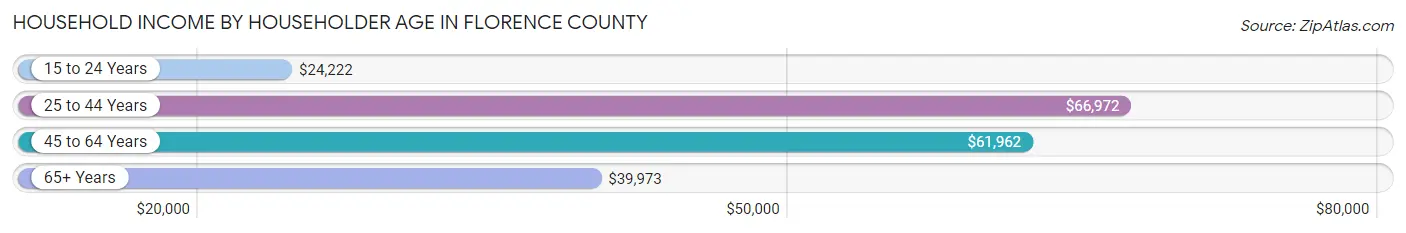
| Income Bracket | # Households | Median Income |
| 15 to 24 Years | 1,727 (3.3%) | $24,222 |
| 25 to 44 Years | 16,549 (31.7%) | $66,972 |
| 45 to 64 Years | 19,022 (36.4%) | $61,962 |
| 65+ Years | 14,946 (28.6%) | $39,973 |
| Total | 52,244 (100.0%) | $56,088 |
Poverty in Florence County
Income Below Poverty by Sex and Age in Florence County
With 18.1% poverty level for males and 17.5% for females among the residents of Florence County, under 5 year old males and under 5 year old females are the most vulnerable to poverty, with 1,354 males (33.0%) and 1,268 females (33.3%) in their respective age groups living below the poverty level.
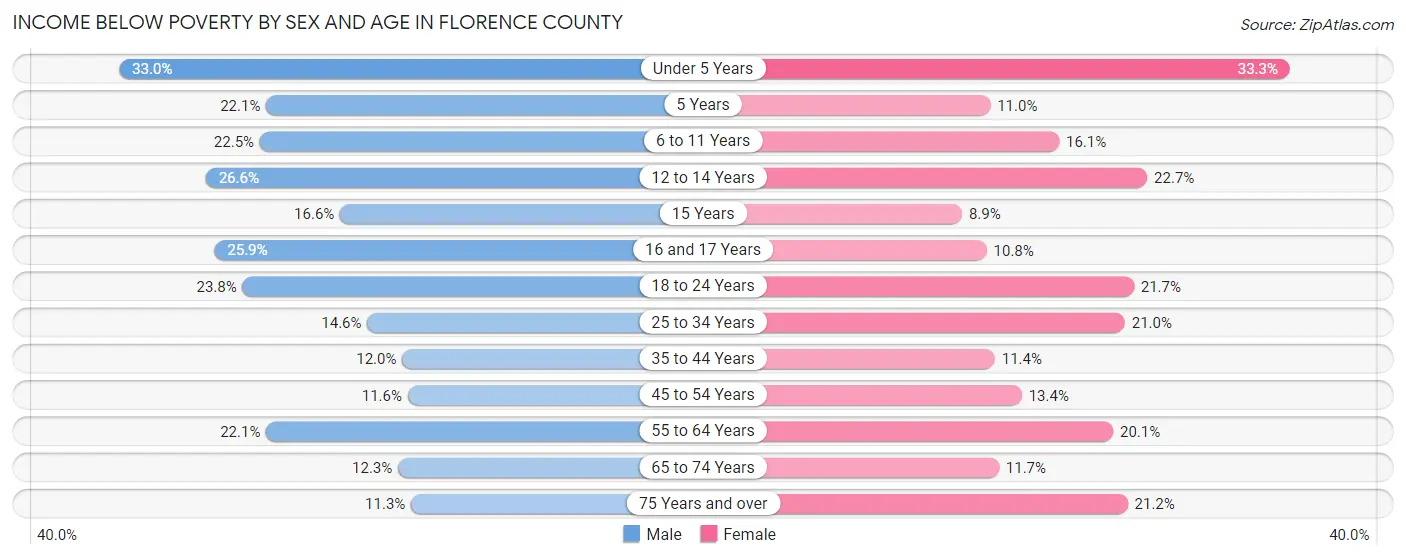
| Age Bracket | Male | Female |
| Under 5 Years | 1,354 (33.0%) | 1,268 (33.3%) |
| 5 Years | 216 (22.1%) | 125 (11.0%) |
| 6 to 11 Years | 1,170 (22.5%) | 789 (16.1%) |
| 12 to 14 Years | 780 (26.6%) | 668 (22.7%) |
| 15 Years | 180 (16.6%) | 73 (8.9%) |
| 16 and 17 Years | 511 (25.9%) | 203 (10.7%) |
| 18 to 24 Years | 1,321 (23.8%) | 1,170 (21.7%) |
| 25 to 34 Years | 1,131 (14.5%) | 1,906 (21.0%) |
| 35 to 44 Years | 939 (12.0%) | 990 (11.4%) |
| 45 to 54 Years | 906 (11.6%) | 1,242 (13.4%) |
| 55 to 64 Years | 1,785 (22.1%) | 1,874 (20.1%) |
| 65 to 74 Years | 777 (12.3%) | 914 (11.7%) |
| 75 Years and over | 400 (11.3%) | 1,153 (21.2%) |
| Total | 11,470 (18.1%) | 12,375 (17.5%) |
Income Above Poverty by Sex and Age in Florence County
According to the poverty statistics in Florence County, males aged 75 years and over and females aged 15 years are the age groups that are most secure financially, with 88.7% of males and 91.1% of females in these age groups living above the poverty line.
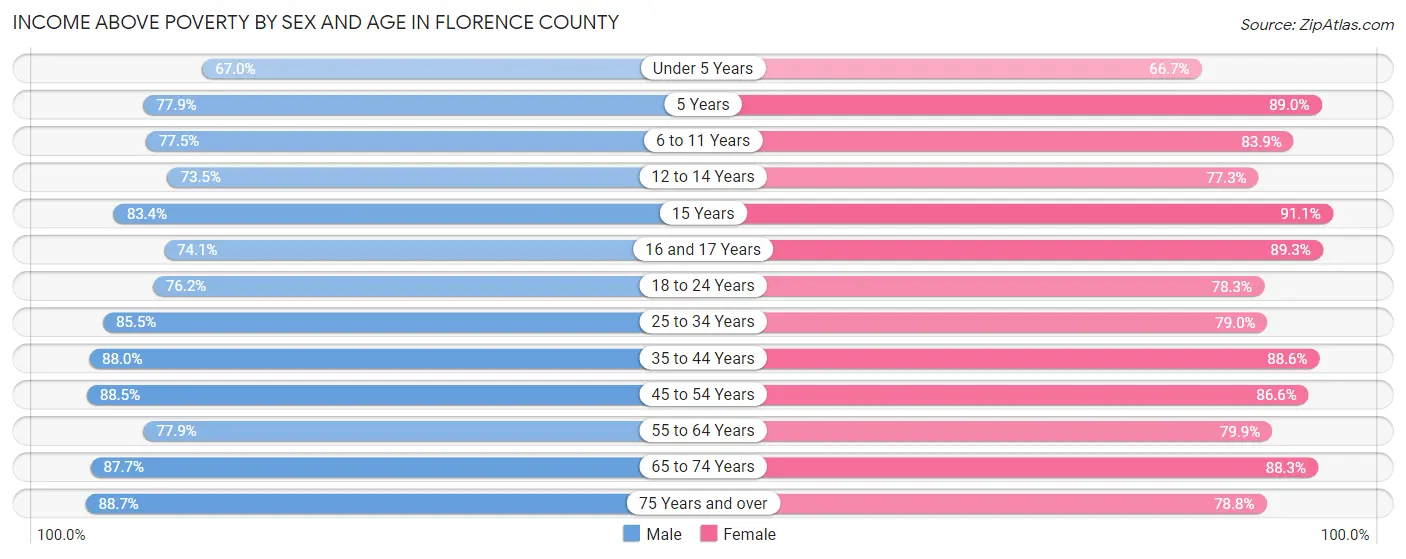
| Age Bracket | Male | Female |
| Under 5 Years | 2,752 (67.0%) | 2,544 (66.7%) |
| 5 Years | 763 (77.9%) | 1,009 (89.0%) |
| 6 to 11 Years | 4,024 (77.5%) | 4,103 (83.9%) |
| 12 to 14 Years | 2,158 (73.5%) | 2,278 (77.3%) |
| 15 Years | 906 (83.4%) | 745 (91.1%) |
| 16 and 17 Years | 1,461 (74.1%) | 1,686 (89.2%) |
| 18 to 24 Years | 4,224 (76.2%) | 4,227 (78.3%) |
| 25 to 34 Years | 6,644 (85.5%) | 7,166 (79.0%) |
| 35 to 44 Years | 6,912 (88.0%) | 7,727 (88.6%) |
| 45 to 54 Years | 6,941 (88.4%) | 8,057 (86.6%) |
| 55 to 64 Years | 6,305 (77.9%) | 7,432 (79.9%) |
| 65 to 74 Years | 5,556 (87.7%) | 6,928 (88.3%) |
| 75 Years and over | 3,139 (88.7%) | 4,281 (78.8%) |
| Total | 51,785 (81.9%) | 58,183 (82.5%) |
Income Below Poverty Among Married-Couple Families in Florence County
The poverty statistics for married-couple families in Florence County show that 5.3% or 1,203 of the total 22,657 families live below the poverty line. Families with 5 or more children have the highest poverty rate of 62.9%, comprising of 22 families. On the other hand, families with 3 or 4 children have the lowest poverty rate of 0.5%, which includes 7 families.
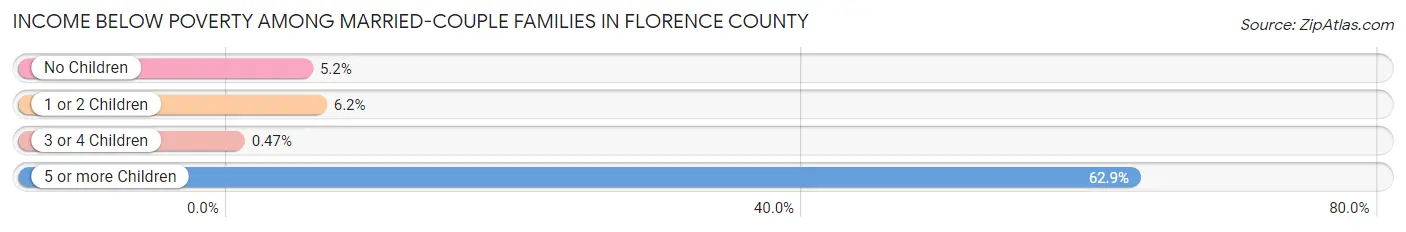
| Children | Above Poverty | Below Poverty |
| No Children | 13,049 (94.8%) | 718 (5.2%) |
| 1 or 2 Children | 6,920 (93.8%) | 456 (6.2%) |
| 3 or 4 Children | 1,472 (99.5%) | 7 (0.5%) |
| 5 or more Children | 13 (37.1%) | 22 (62.9%) |
| Total | 21,454 (94.7%) | 1,203 (5.3%) |
Income Below Poverty Among Single-Parent Households in Florence County
According to the poverty data in Florence County, 27.3% or 550 single-father households and 28.4% or 2,459 single-mother households are living below the poverty line. Among single-father households, those with 5 or more children have the highest poverty rate, with 118 households (100.0%) experiencing poverty. Likewise, among single-mother households, those with 5 or more children have the highest poverty rate, with 59 households (83.1%) falling below the poverty line.
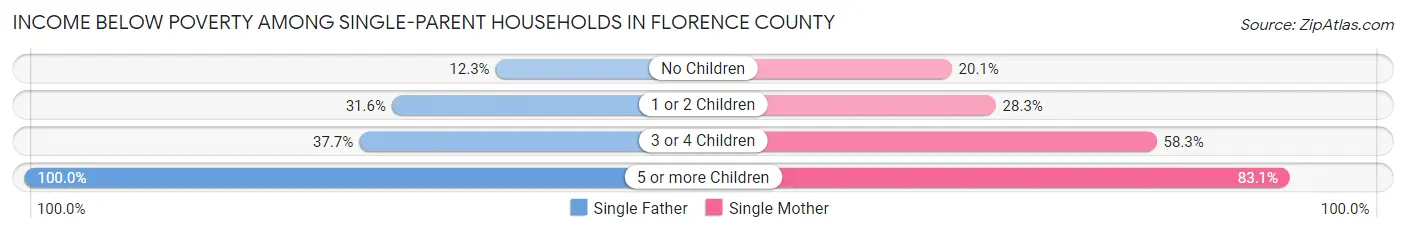
| Children | Single Father | Single Mother |
| No Children | 114 (12.3%) | 658 (20.1%) |
| 1 or 2 Children | 246 (31.6%) | 1,271 (28.3%) |
| 3 or 4 Children | 72 (37.7%) | 471 (58.3%) |
| 5 or more Children | 118 (100.0%) | 59 (83.1%) |
| Total | 550 (27.3%) | 2,459 (28.4%) |
Income Below Poverty Among Married-Couple vs Single-Parent Households in Florence County
The poverty data for Florence County shows that 1,203 of the married-couple family households (5.3%) and 3,009 of the single-parent households (28.2%) are living below the poverty level. Within the married-couple family households, those with 5 or more children have the highest poverty rate, with 22 households (62.9%) falling below the poverty line. Among the single-parent households, those with 5 or more children have the highest poverty rate, with 177 household (93.6%) living below poverty.
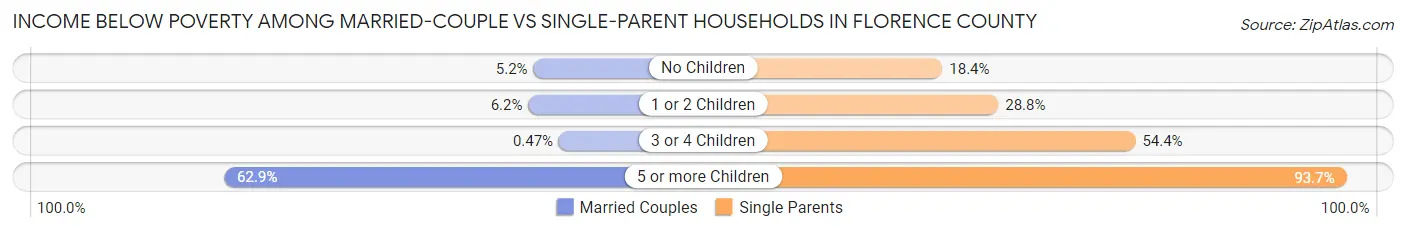
| Children | Married-Couple Families | Single-Parent Households |
| No Children | 718 (5.2%) | 772 (18.4%) |
| 1 or 2 Children | 456 (6.2%) | 1,517 (28.8%) |
| 3 or 4 Children | 7 (0.5%) | 543 (54.3%) |
| 5 or more Children | 22 (62.9%) | 177 (93.6%) |
| Total | 1,203 (5.3%) | 3,009 (28.2%) |
Race in Florence County
The most populous races in Florence County are White / Caucasian (70,072 | 51.1%), Black / African American (58,677 | 42.8%), and Hispanic or Latino (4,022 | 2.9%).
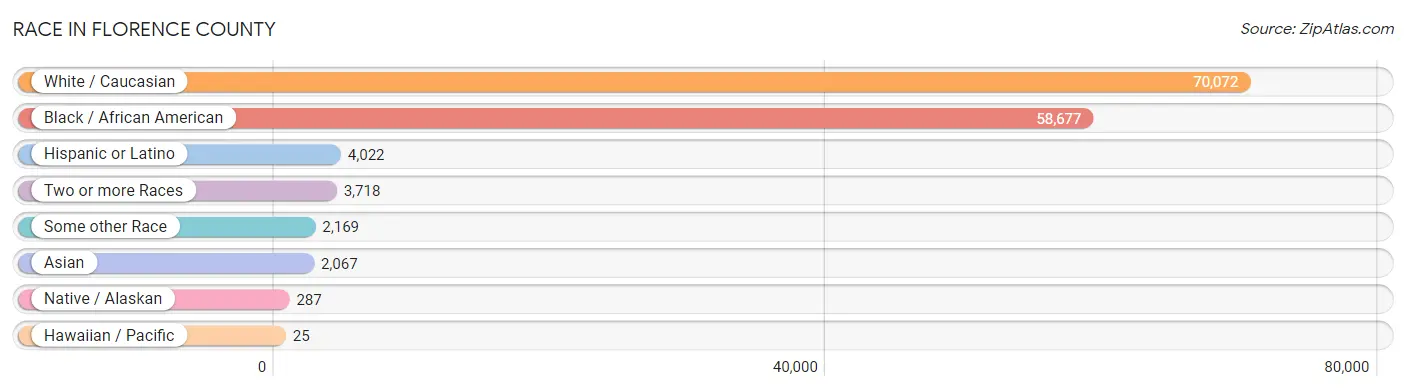
| Race | # Population | % Population |
| Asian | 2,067 | 1.5% |
| Black / African American | 58,677 | 42.8% |
| Hawaiian / Pacific | 25 | 0.0% |
| Hispanic or Latino | 4,022 | 2.9% |
| Native / Alaskan | 287 | 0.2% |
| White / Caucasian | 70,072 | 51.1% |
| Two or more Races | 3,718 | 2.7% |
| Some other Race | 2,169 | 1.6% |
| Total | 137,015 | 100.0% |
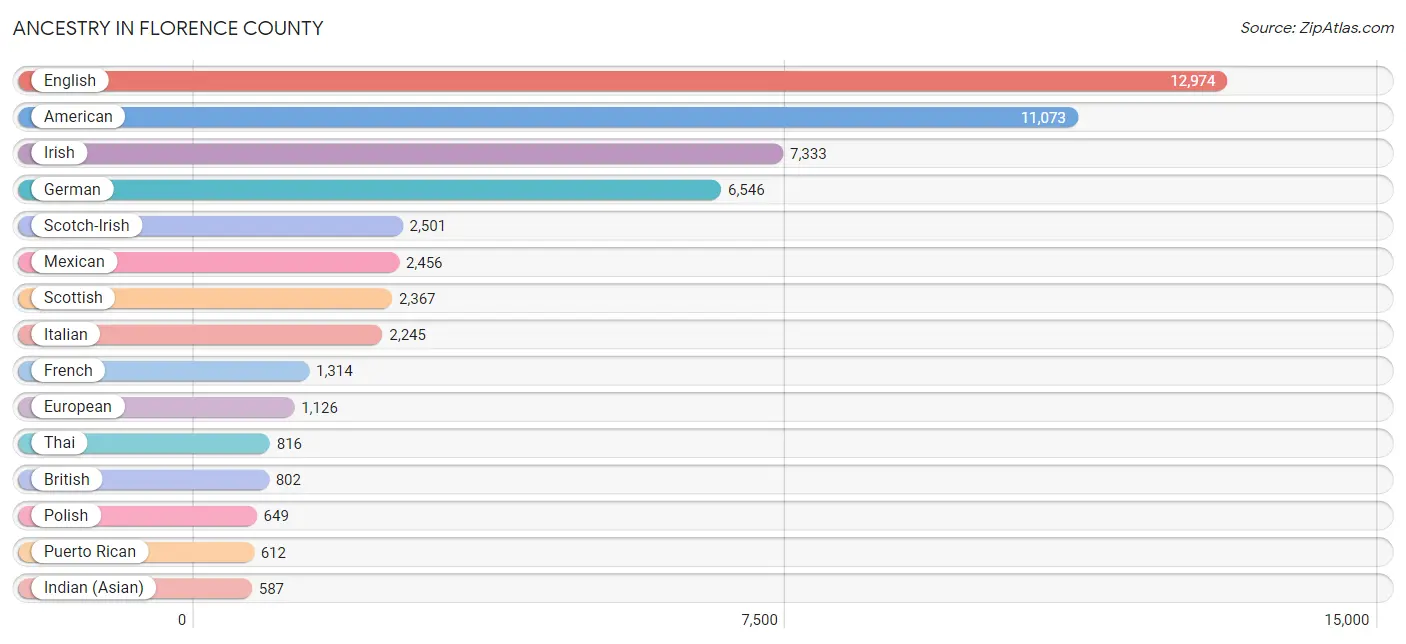
Ancestry in Florence County
The most populous ancestries reported in Florence County are English (12,974 | 9.5%), American (11,073 | 8.1%), Irish (7,333 | 5.3%), German (6,546 | 4.8%), and Scotch-Irish (2,501 | 1.8%), together accounting for 29.5% of all Florence County residents.
| Ancestry | # Population | % Population |
| African | 220 | 0.2% |
| American | 11,073 | 8.1% |
| Arab | 309 | 0.2% |
| Argentinean | 23 | 0.0% |
| Armenian | 8 | 0.0% |
| Australian | 88 | 0.1% |
| Austrian | 109 | 0.1% |
| Bahamian | 8 | 0.0% |
| Bangladeshi | 60 | 0.0% |
| Belgian | 31 | 0.0% |
| Bhutanese | 33 | 0.0% |
| Blackfeet | 36 | 0.0% |
| Bolivian | 9 | 0.0% |
| British | 802 | 0.6% |
| Bulgarian | 25 | 0.0% |
| Burmese | 212 | 0.2% |
| Canadian | 42 | 0.0% |
| Celtic | 31 | 0.0% |
| Central American | 254 | 0.2% |
| Central American Indian | 32 | 0.0% |
| Cherokee | 211 | 0.2% |
| Chickasaw | 34 | 0.0% |
| Chilean | 2 | 0.0% |
| Choctaw | 16 | 0.0% |
| Colombian | 105 | 0.1% |
| Costa Rican | 51 | 0.0% |
| Croatian | 158 | 0.1% |
| Crow | 13 | 0.0% |
| Cuban | 65 | 0.1% |
| Czechoslovakian | 33 | 0.0% |
| Danish | 81 | 0.1% |
| Dominican | 189 | 0.1% |
| Dutch | 197 | 0.1% |
| Eastern European | 7 | 0.0% |
| Ecuadorian | 17 | 0.0% |
| English | 12,974 | 9.5% |
| European | 1,126 | 0.8% |
| Filipino | 42 | 0.0% |
| Finnish | 100 | 0.1% |
| French | 1,314 | 1.0% |
| French American Indian | 59 | 0.0% |
| French Canadian | 206 | 0.2% |
| German | 6,546 | 4.8% |
| Greek | 358 | 0.3% |
| Guamanian / Chamorro | 28 | 0.0% |
| Guatemalan | 26 | 0.0% |
| Haitian | 46 | 0.0% |
| Honduran | 55 | 0.0% |
| Hungarian | 261 | 0.2% |
| Indian (Asian) | 587 | 0.4% |
| Irish | 7,333 | 5.3% |
| Iroquois | 20 | 0.0% |
| Italian | 2,245 | 1.6% |
| Jamaican | 254 | 0.2% |
| Japanese | 10 | 0.0% |
| Jordanian | 41 | 0.0% |
| Kenyan | 45 | 0.0% |
| Korean | 289 | 0.2% |
| Latvian | 10 | 0.0% |
| Lebanese | 238 | 0.2% |
| Lithuanian | 17 | 0.0% |
| Lumbee | 241 | 0.2% |
| Mexican | 2,456 | 1.8% |
| Moroccan | 20 | 0.0% |
| Native Hawaiian | 17 | 0.0% |
| Nigerian | 54 | 0.0% |
| Northern European | 39 | 0.0% |
| Norwegian | 221 | 0.2% |
| Pakistani | 53 | 0.0% |
| Panamanian | 2 | 0.0% |
| Pennsylvania German | 15 | 0.0% |
| Polish | 649 | 0.5% |
| Portuguese | 48 | 0.0% |
| Pueblo | 11 | 0.0% |
| Puerto Rican | 612 | 0.4% |
| Russian | 53 | 0.0% |
| Salvadoran | 120 | 0.1% |
| Samoan | 66 | 0.1% |
| Scandinavian | 29 | 0.0% |
| Scotch-Irish | 2,501 | 1.8% |
| Scottish | 2,367 | 1.7% |
| Sioux | 11 | 0.0% |
| Slavic | 44 | 0.0% |
| Slovak | 33 | 0.0% |
| Slovene | 57 | 0.0% |
| South African | 97 | 0.1% |
| South American | 156 | 0.1% |
| Spaniard | 31 | 0.0% |
| Spanish | 14 | 0.0% |
| Sri Lankan | 38 | 0.0% |
| Subsaharan African | 479 | 0.4% |
| Swedish | 191 | 0.1% |
| Swiss | 28 | 0.0% |
| Syrian | 10 | 0.0% |
| Thai | 816 | 0.6% |
| Turkish | 68 | 0.1% |
| Ugandan | 25 | 0.0% |
| Ukrainian | 10 | 0.0% |
| Welsh | 533 | 0.4% |
| West Indian | 14 | 0.0% |
| Yugoslavian | 5 | 0.0% | View All 101 Rows |
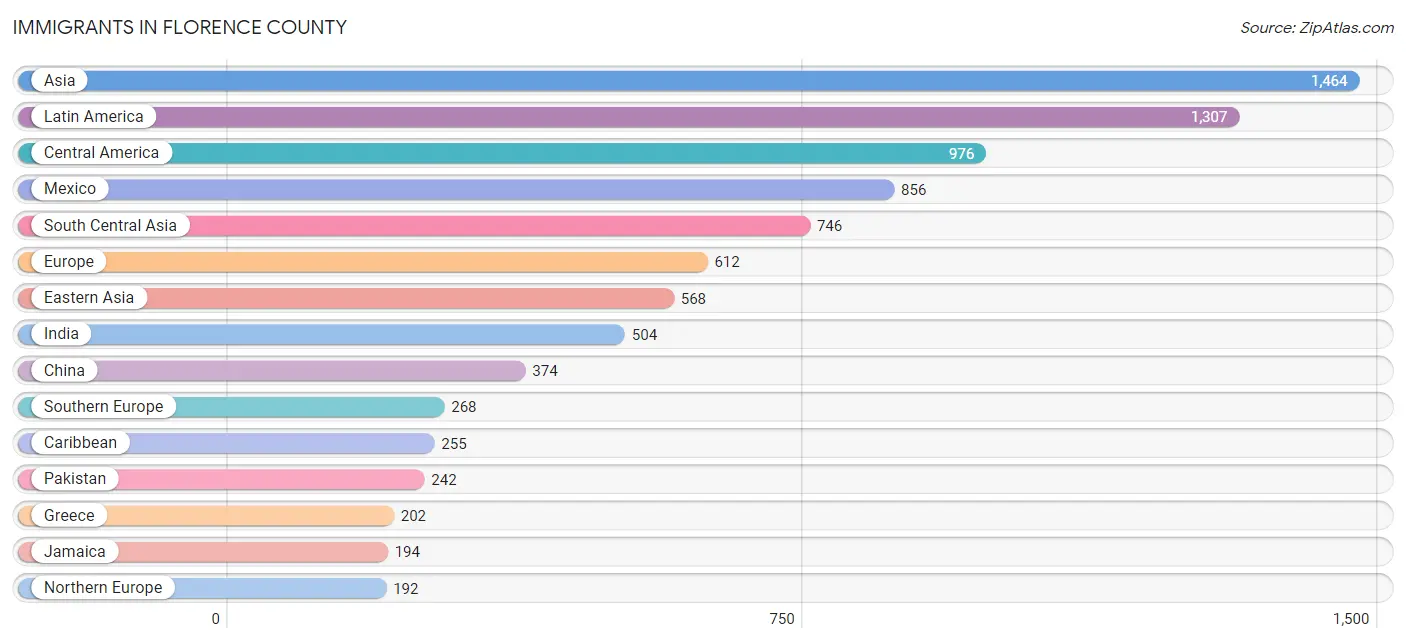
Immigrants in Florence County
The most numerous immigrant groups reported in Florence County came from Asia (1,464 | 1.1%), Latin America (1,307 | 0.9%), Central America (976 | 0.7%), Mexico (856 | 0.6%), and South Central Asia (746 | 0.5%), together accounting for 3.9% of all Florence County residents.
| Immigration Origin | # Population | % Population |
| Africa | 155 | 0.1% |
| Argentina | 6 | 0.0% |
| Asia | 1,464 | 1.1% |
| Australia | 4 | 0.0% |
| Bahamas | 2 | 0.0% |
| Belize | 10 | 0.0% |
| Bolivia | 9 | 0.0% |
| Brazil | 30 | 0.0% |
| Canada | 40 | 0.0% |
| Caribbean | 255 | 0.2% |
| Central America | 976 | 0.7% |
| Chile | 2 | 0.0% |
| China | 374 | 0.3% |
| Colombia | 29 | 0.0% |
| Costa Rica | 2 | 0.0% |
| Dominican Republic | 28 | 0.0% |
| Eastern Africa | 114 | 0.1% |
| Eastern Asia | 568 | 0.4% |
| Eastern Europe | 61 | 0.0% |
| El Salvador | 16 | 0.0% |
| England | 15 | 0.0% |
| Europe | 612 | 0.4% |
| Germany | 91 | 0.1% |
| Greece | 202 | 0.2% |
| Guatemala | 35 | 0.0% |
| Haiti | 31 | 0.0% |
| Honduras | 55 | 0.0% |
| Hong Kong | 21 | 0.0% |
| Hungary | 10 | 0.0% |
| India | 504 | 0.4% |
| Ireland | 4 | 0.0% |
| Italy | 11 | 0.0% |
| Jamaica | 194 | 0.1% |
| Japan | 39 | 0.0% |
| Jordan | 15 | 0.0% |
| Kenya | 87 | 0.1% |
| Korea | 155 | 0.1% |
| Latin America | 1,307 | 0.9% |
| Latvia | 10 | 0.0% |
| Mexico | 856 | 0.6% |
| Morocco | 8 | 0.0% |
| Nigeria | 31 | 0.0% |
| Northern Africa | 8 | 0.0% |
| Northern Europe | 192 | 0.1% |
| Oceania | 16 | 0.0% |
| Pakistan | 242 | 0.2% |
| Panama | 2 | 0.0% |
| Philippines | 109 | 0.1% |
| Portugal | 27 | 0.0% |
| Russia | 31 | 0.0% |
| South America | 76 | 0.1% |
| South Central Asia | 746 | 0.5% |
| South Eastern Asia | 120 | 0.1% |
| Southern Europe | 268 | 0.2% |
| Spain | 28 | 0.0% |
| Taiwan | 69 | 0.1% |
| Thailand | 5 | 0.0% |
| Turkey | 15 | 0.0% |
| Uganda | 25 | 0.0% |
| Ukraine | 10 | 0.0% |
| Vietnam | 6 | 0.0% |
| Western Africa | 31 | 0.0% |
| Western Asia | 30 | 0.0% |
| Western Europe | 91 | 0.1% | View All 64 Rows |
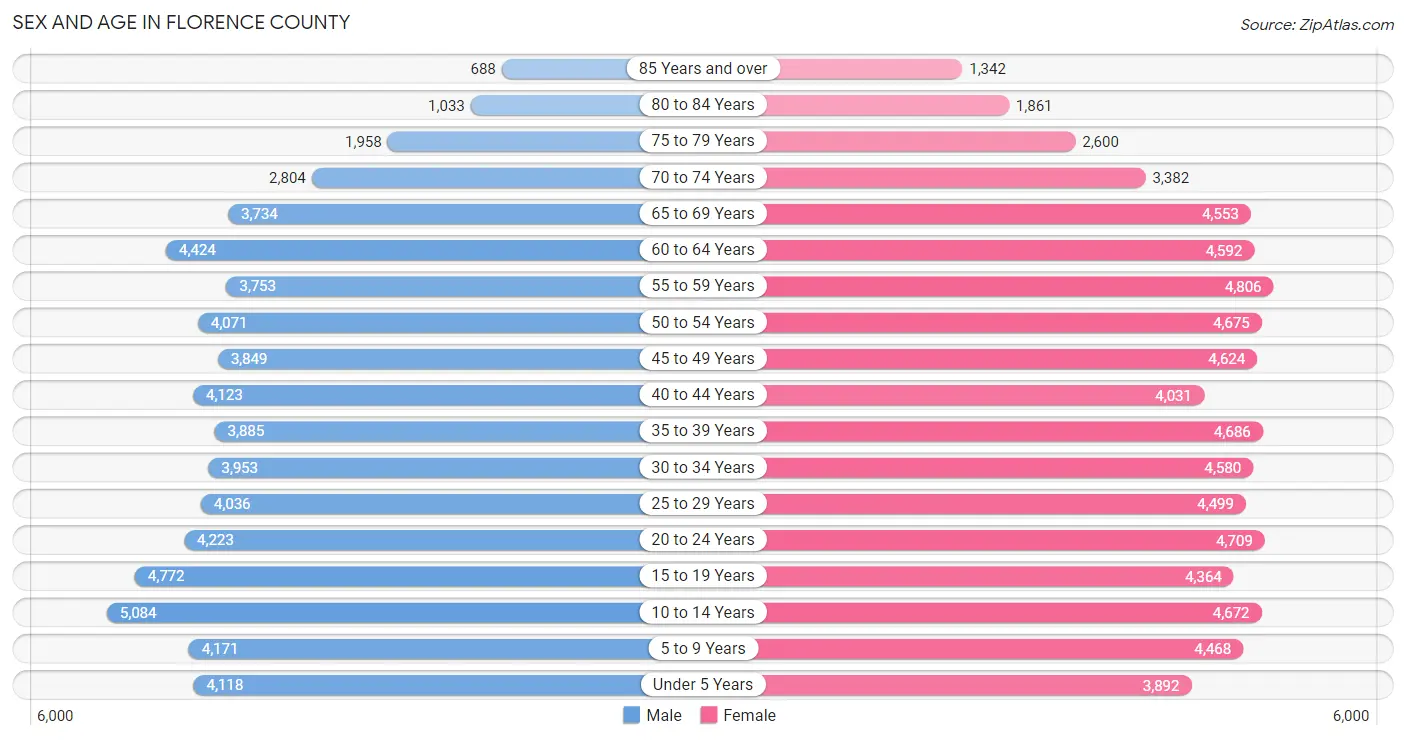
Sex and Age in Florence County
Sex and Age in Florence County
The most populous age groups in Florence County are 10 to 14 Years (5,084 | 7.9%) for men and 55 to 59 Years (4,806 | 6.6%) for women.
| Age Bracket | Male | Female |
| Under 5 Years | 4,118 (6.4%) | 3,892 (5.4%) |
| 5 to 9 Years | 4,171 (6.5%) | 4,468 (6.2%) |
| 10 to 14 Years | 5,084 (7.9%) | 4,672 (6.5%) |
| 15 to 19 Years | 4,772 (7.4%) | 4,364 (6.0%) |
| 20 to 24 Years | 4,223 (6.5%) | 4,709 (6.5%) |
| 25 to 29 Years | 4,036 (6.2%) | 4,499 (6.2%) |
| 30 to 34 Years | 3,953 (6.1%) | 4,580 (6.3%) |
| 35 to 39 Years | 3,885 (6.0%) | 4,686 (6.5%) |
| 40 to 44 Years | 4,123 (6.4%) | 4,031 (5.6%) |
| 45 to 49 Years | 3,849 (5.9%) | 4,624 (6.4%) |
| 50 to 54 Years | 4,071 (6.3%) | 4,675 (6.5%) |
| 55 to 59 Years | 3,753 (5.8%) | 4,806 (6.6%) |
| 60 to 64 Years | 4,424 (6.8%) | 4,592 (6.4%) |
| 65 to 69 Years | 3,734 (5.8%) | 4,553 (6.3%) |
| 70 to 74 Years | 2,804 (4.3%) | 3,382 (4.7%) |
| 75 to 79 Years | 1,958 (3.0%) | 2,600 (3.6%) |
| 80 to 84 Years | 1,033 (1.6%) | 1,861 (2.6%) |
| 85 Years and over | 688 (1.1%) | 1,342 (1.9%) |
| Total | 64,679 (100.0%) | 72,336 (100.0%) |
Families and Households in Florence County
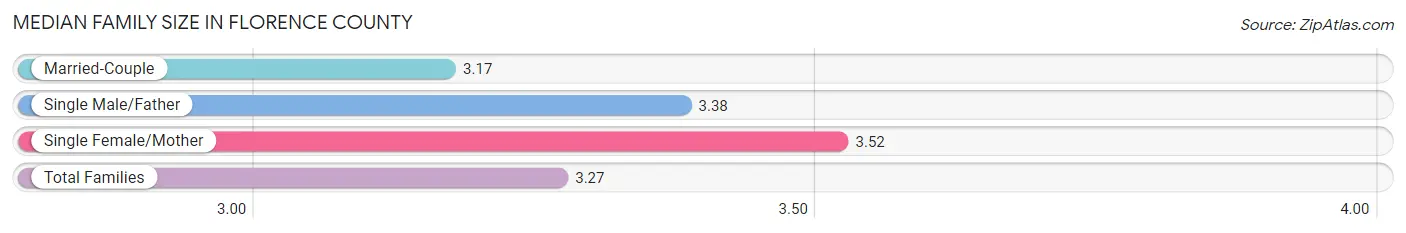
Median Family Size in Florence County
The median family size in Florence County is 3.27 persons per family, with single female/mother families (8,642 | 25.9%) accounting for the largest median family size of 3.52 persons per family. On the other hand, married-couple families (22,657 | 68.0%) represent the smallest median family size with 3.17 persons per family.
| Family Type | # Families | Family Size |
| Married-Couple | 22,657 (68.0%) | 3.17 |
| Single Male/Father | 2,013 (6.0%) | 3.38 |
| Single Female/Mother | 8,642 (25.9%) | 3.52 |
| Total Families | 33,312 (100.0%) | 3.27 |
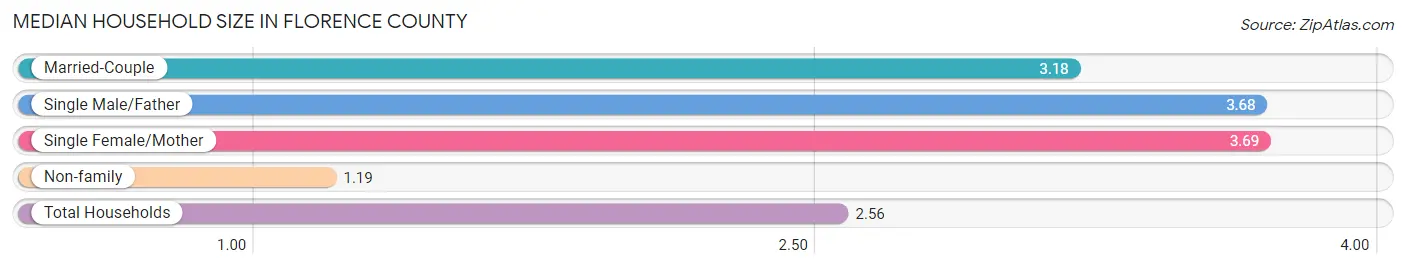
Median Household Size in Florence County
The median household size in Florence County is 2.56 persons per household, with single female/mother households (8,642 | 16.5%) accounting for the largest median household size of 3.69 persons per household. non-family households (18,932 | 36.2%) represent the smallest median household size with 1.19 persons per household.
| Household Type | # Households | Household Size |
| Married-Couple | 22,657 (43.4%) | 3.18 |
| Single Male/Father | 2,013 (3.8%) | 3.68 |
| Single Female/Mother | 8,642 (16.5%) | 3.69 |
| Non-family | 18,932 (36.2%) | 1.19 |
| Total Households | 52,244 (100.0%) | 2.56 |
Household Size by Marriage Status in Florence County
Out of a total of 52,244 households in Florence County, 33,312 (63.8%) are family households, while 18,932 (36.2%) are nonfamily households. The most numerous type of family households are 2-person households, comprising 15,269, and the most common type of nonfamily households are 1-person households, comprising 16,537.
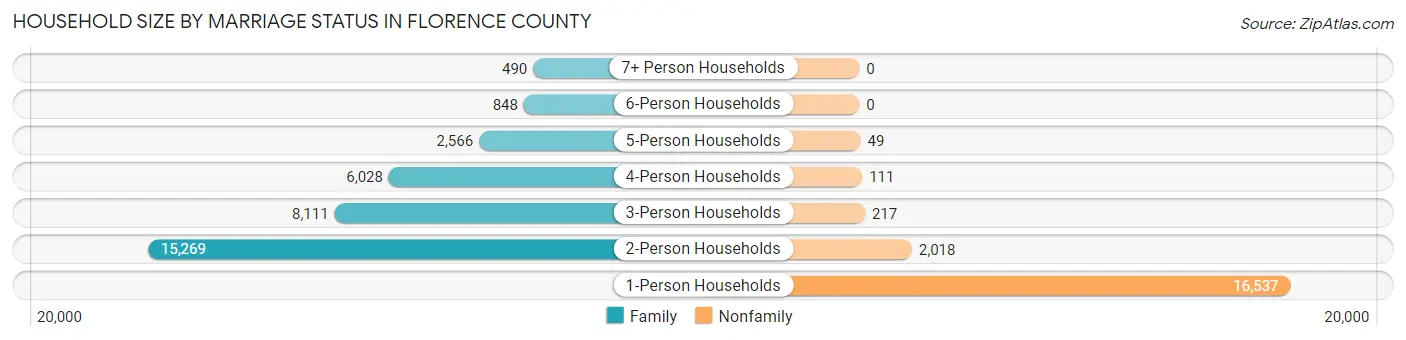
| Household Size | Family Households | Nonfamily Households |
| 1-Person Households | - | 16,537 (31.7%) |
| 2-Person Households | 15,269 (29.2%) | 2,018 (3.9%) |
| 3-Person Households | 8,111 (15.5%) | 217 (0.4%) |
| 4-Person Households | 6,028 (11.5%) | 111 (0.2%) |
| 5-Person Households | 2,566 (4.9%) | 49 (0.1%) |
| 6-Person Households | 848 (1.6%) | 0 (0.0%) |
| 7+ Person Households | 490 (0.9%) | 0 (0.0%) |
| Total | 33,312 (63.8%) | 18,932 (36.2%) |
Female Fertility in Florence County
Fertility by Age in Florence County
Average fertility rate in Florence County is 59.0 births per 1,000 women. Women in the age bracket of 20 to 34 years have the highest fertility rate with 100.0 births per 1,000 women. Women in the age bracket of 20 to 34 years acount for 72.7% of all women with births.
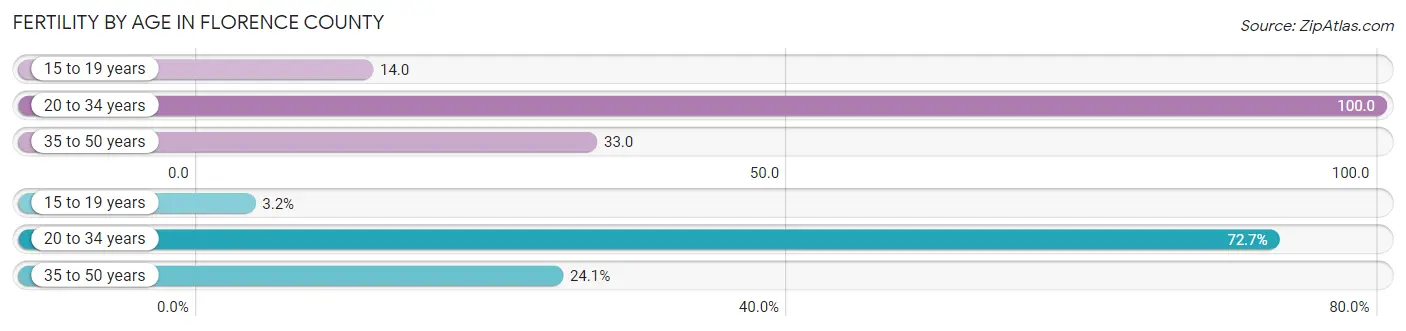
| Age Bracket | Women with Births | Births / 1,000 Women |
| 15 to 19 years | 61 (3.2%) | 14.0 |
| 20 to 34 years | 1,382 (72.7%) | 100.0 |
| 35 to 50 years | 458 (24.1%) | 33.0 |
| Total | 1,901 (100.0%) | 59.0 |
Fertility by Age by Marriage Status in Florence County
41.6% of women with births (1,901) in Florence County are married. The highest percentage of unmarried women with births falls into 15 to 19 years age bracket with 100.0% of them unmarried at the time of birth, while the lowest percentage of unmarried women with births belong to 35 to 50 years age bracket with 56.8% of them unmarried.
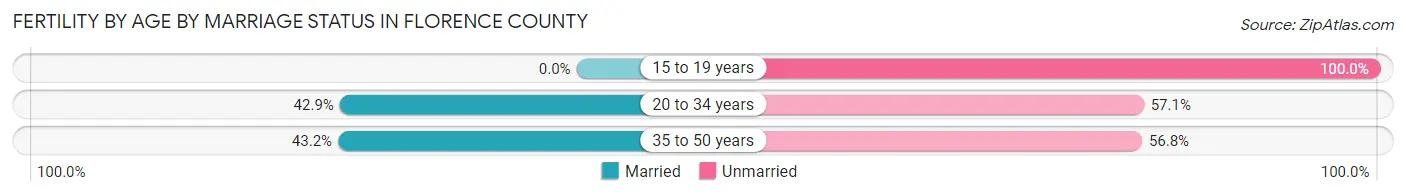
| Age Bracket | Married | Unmarried |
| 15 to 19 years | 0 (0.0%) | 61 (100.0%) |
| 20 to 34 years | 593 (42.9%) | 789 (57.1%) |
| 35 to 50 years | 198 (43.2%) | 260 (56.8%) |
| Total | 791 (41.6%) | 1,110 (58.4%) |
Fertility by Education in Florence County
Average fertility rate in Florence County is 59.0 births per 1,000 women. Women with the education attainment of graduate degree have the highest fertility rate of 72.0 births per 1,000 women, while women with the education attainment of less than high school have the lowest fertility at 35.0 births per 1,000 women. Women with the education attainment of college or associate's degree represent 41.2% of all women with births.
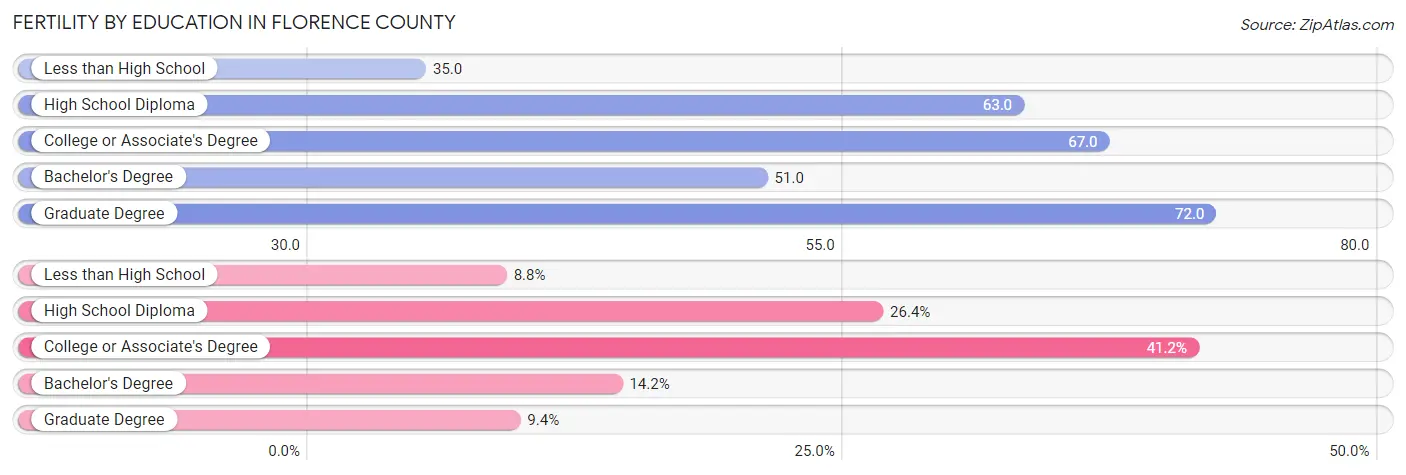
| Educational Attainment | Women with Births | Births / 1,000 Women |
| Less than High School | 167 (8.8%) | 35.0 |
| High School Diploma | 502 (26.4%) | 63.0 |
| College or Associate's Degree | 783 (41.2%) | 67.0 |
| Bachelor's Degree | 270 (14.2%) | 51.0 |
| Graduate Degree | 179 (9.4%) | 72.0 |
| Total | 1,901 (100.0%) | 59.0 |
Fertility by Education by Marriage Status in Florence County
58.4% of women with births in Florence County are unmarried. Women with the educational attainment of bachelor's degree are most likely to be married with 70.7% of them married at childbirth, while women with the educational attainment of less than high school are least likely to be married with 90.4% of them unmarried at childbirth.
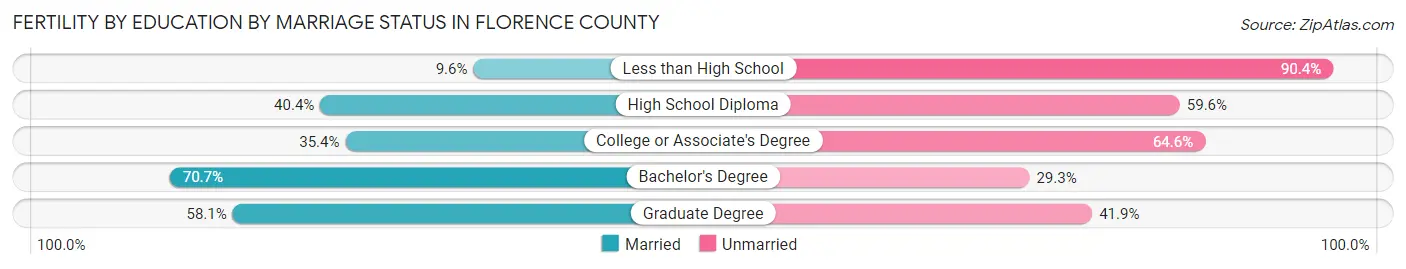
| Educational Attainment | Married | Unmarried |
| Less than High School | 16 (9.6%) | 151 (90.4%) |
| High School Diploma | 203 (40.4%) | 299 (59.6%) |
| College or Associate's Degree | 277 (35.4%) | 506 (64.6%) |
| Bachelor's Degree | 191 (70.7%) | 79 (29.3%) |
| Graduate Degree | 104 (58.1%) | 75 (41.9%) |
| Total | 791 (41.6%) | 1,110 (58.4%) |
Employment Characteristics in Florence County
Employment by Class of Employer in Florence County
Among the 59,787 employed individuals in Florence County, private company employees (39,154 | 65.5%), not-for-profit organizations (5,548 | 9.3%), and state government employees (4,125 | 6.9%) make up the most common classes of employment.
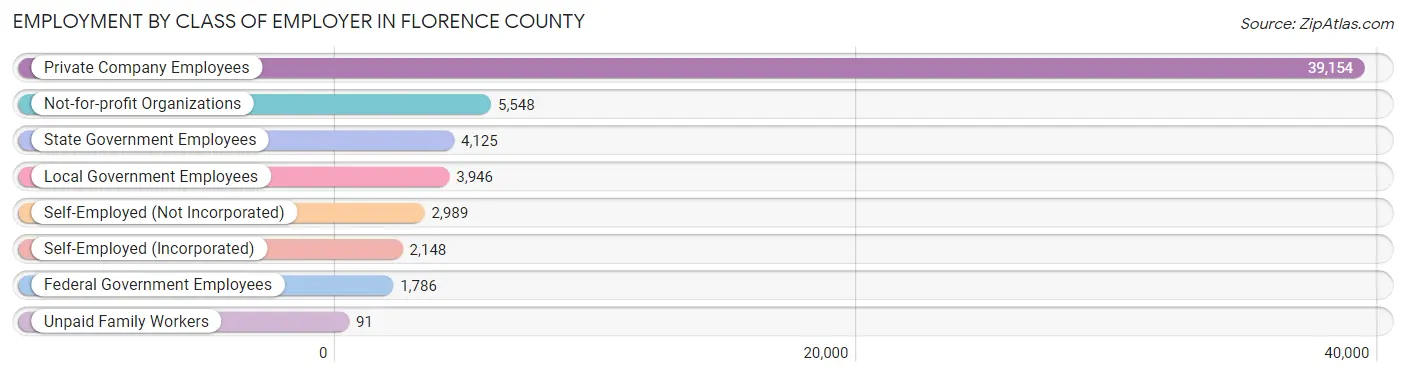
| Employer Class | # Employees | % Employees |
| Private Company Employees | 39,154 | 65.5% |
| Self-Employed (Incorporated) | 2,148 | 3.6% |
| Self-Employed (Not Incorporated) | 2,989 | 5.0% |
| Not-for-profit Organizations | 5,548 | 9.3% |
| Local Government Employees | 3,946 | 6.6% |
| State Government Employees | 4,125 | 6.9% |
| Federal Government Employees | 1,786 | 3.0% |
| Unpaid Family Workers | 91 | 0.2% |
| Total | 59,787 | 100.0% |
Employment Status by Age in Florence County
According to the labor force statistics for Florence County, out of the total population over 16 years of age (108,703), 58.3% or 63,374 individuals are in the labor force, with 4.5% or 2,852 of them unemployed. The age group with the highest labor force participation rate is 35 to 44 years, with 83.9% or 14,032 individuals in the labor force. Within the labor force, the 20 to 24 years age range has the highest percentage of unemployed individuals, with 9.5% or 613 of them being unemployed.
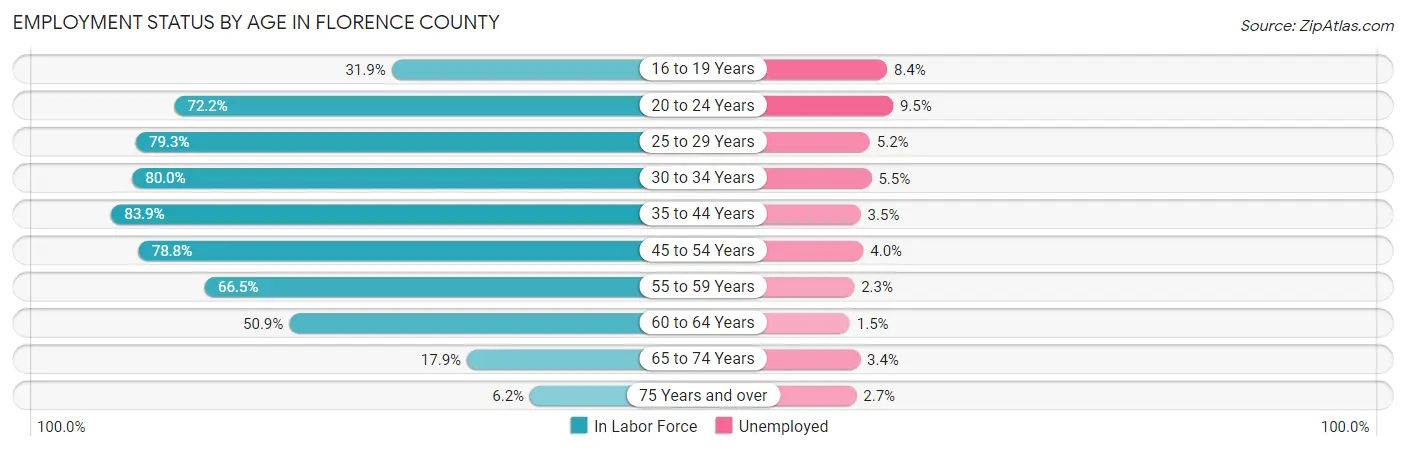
| Age Bracket | In Labor Force | Unemployed |
| 16 to 19 Years | 2,306 (31.9%) | 194 (8.4%) |
| 20 to 24 Years | 6,449 (72.2%) | 613 (9.5%) |
| 25 to 29 Years | 6,768 (79.3%) | 352 (5.2%) |
| 30 to 34 Years | 6,826 (80.0%) | 375 (5.5%) |
| 35 to 44 Years | 14,032 (83.9%) | 491 (3.5%) |
| 45 to 54 Years | 13,569 (78.8%) | 543 (4.0%) |
| 55 to 59 Years | 5,692 (66.5%) | 131 (2.3%) |
| 60 to 64 Years | 4,589 (50.9%) | 69 (1.5%) |
| 65 to 74 Years | 2,591 (17.9%) | 88 (3.4%) |
| 75 Years and over | 588 (6.2%) | 16 (2.7%) |
| Total | 63,374 (58.3%) | 2,852 (4.5%) |
Employment Status by Educational Attainment in Florence County
According to labor force statistics for Florence County, 75.0% of individuals (51,440) out of the total population between 25 and 64 years of age (68,587) are in the labor force, with 3.8% or 1,955 of them being unemployed. The group with the highest labor force participation rate are those with the educational attainment of bachelor's degree or higher, with 87.6% or 15,321 individuals in the labor force. Within the labor force, individuals with high school diploma education have the highest percentage of unemployment, with 6.3% or 944 of them being unemployed.
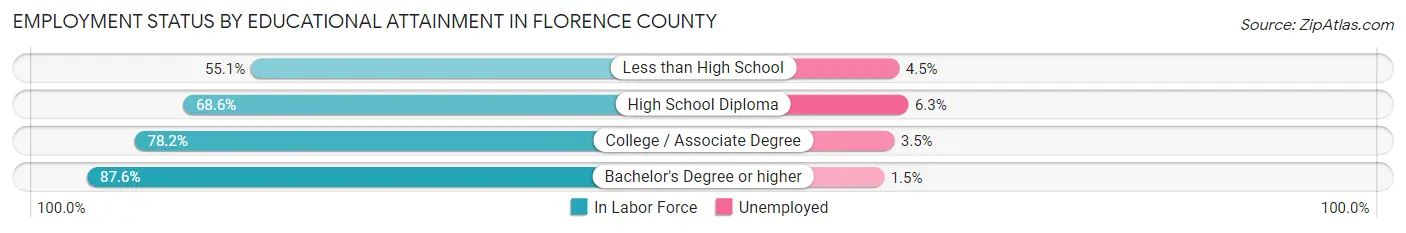
| Educational Attainment | In Labor Force | Unemployed |
| Less than High School | 4,053 (55.1%) | 331 (4.5%) |
| High School Diploma | 14,985 (68.6%) | 1,376 (6.3%) |
| College / Associate Degree | 17,123 (78.2%) | 766 (3.5%) |
| Bachelor's Degree or higher | 15,321 (87.6%) | 262 (1.5%) |
| Total | 51,440 (75.0%) | 2,606 (3.8%) |
Employment Occupations by Sex in Florence County
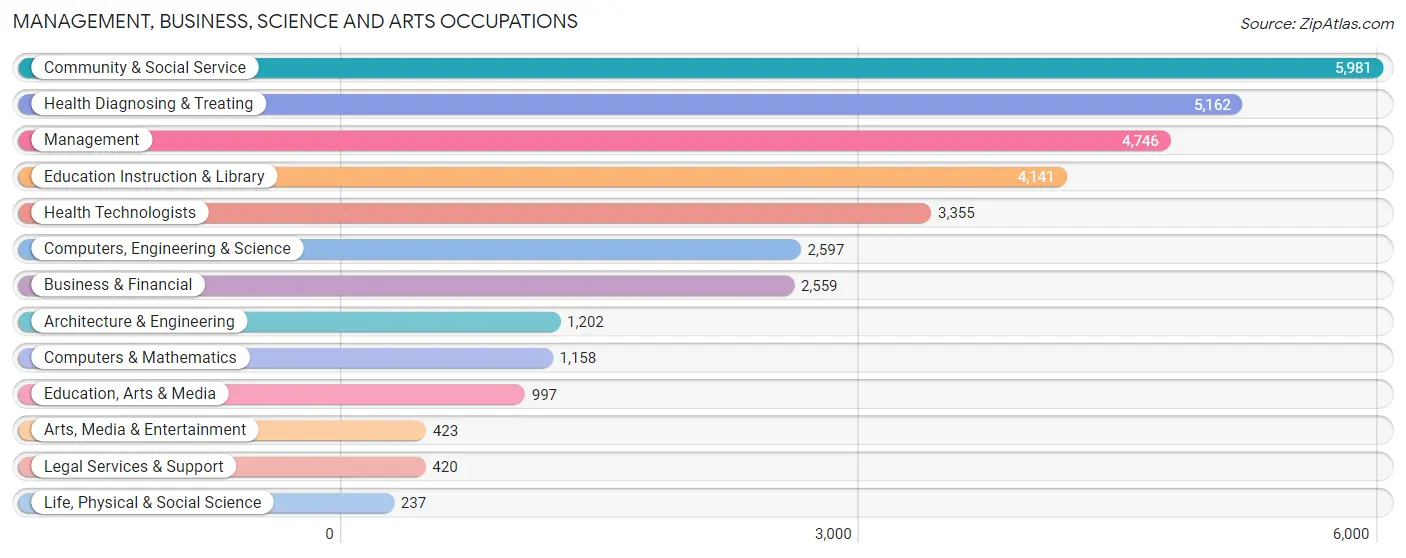
Management, Business, Science and Arts Occupations
The most common Management, Business, Science and Arts occupations in Florence County are Community & Social Service (5,981 | 10.0%), Health Diagnosing & Treating (5,162 | 8.6%), Management (4,746 | 7.9%), Education Instruction & Library (4,141 | 6.9%), and Health Technologists (3,355 | 5.6%).
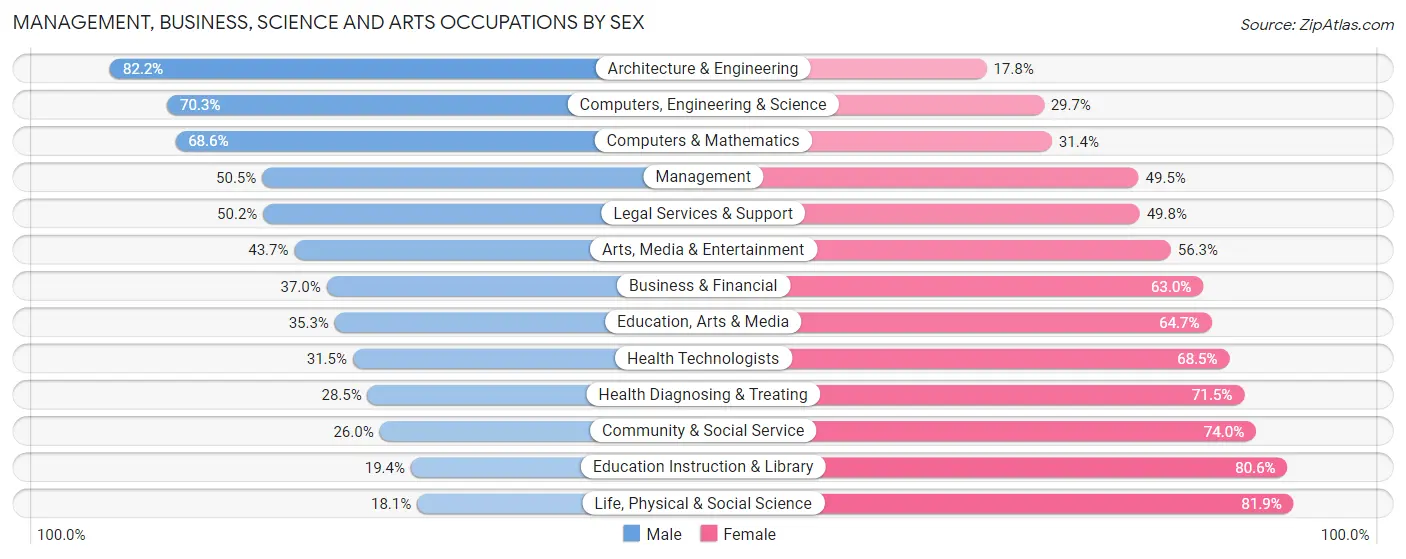
Management, Business, Science and Arts Occupations by Sex
Within the Management, Business, Science and Arts occupations in Florence County, the most male-oriented occupations are Architecture & Engineering (82.2%), Computers, Engineering & Science (70.3%), and Computers & Mathematics (68.6%), while the most female-oriented occupations are Life, Physical & Social Science (81.9%), Education Instruction & Library (80.6%), and Community & Social Service (74.0%).
| Occupation | Male | Female |
| Management | 2,395 (50.5%) | 2,351 (49.5%) |
| Business & Financial | 947 (37.0%) | 1,612 (63.0%) |
| Computers, Engineering & Science | 1,825 (70.3%) | 772 (29.7%) |
| Computers & Mathematics | 794 (68.6%) | 364 (31.4%) |
| Architecture & Engineering | 988 (82.2%) | 214 (17.8%) |
| Life, Physical & Social Science | 43 (18.1%) | 194 (81.9%) |
| Community & Social Service | 1,553 (26.0%) | 4,428 (74.0%) |
| Education, Arts & Media | 352 (35.3%) | 645 (64.7%) |
| Legal Services & Support | 211 (50.2%) | 209 (49.8%) |
| Education Instruction & Library | 805 (19.4%) | 3,336 (80.6%) |
| Arts, Media & Entertainment | 185 (43.7%) | 238 (56.3%) |
| Health Diagnosing & Treating | 1,469 (28.5%) | 3,693 (71.5%) |
| Health Technologists | 1,058 (31.5%) | 2,297 (68.5%) |
| Total (Category) | 8,189 (38.9%) | 12,856 (61.1%) |
| Total (Overall) | 29,427 (49.0%) | 30,613 (51.0%) |
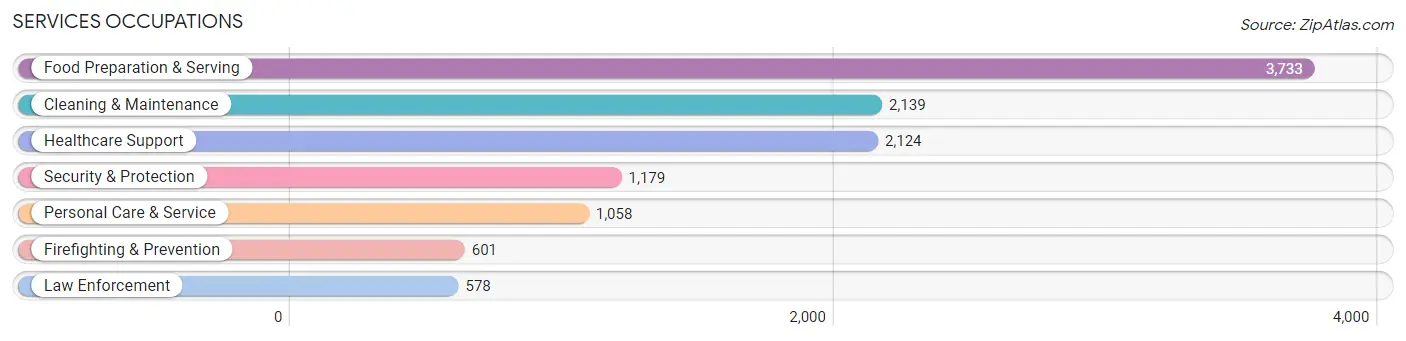
Services Occupations
The most common Services occupations in Florence County are Food Preparation & Serving (3,733 | 6.2%), Cleaning & Maintenance (2,139 | 3.6%), Healthcare Support (2,124 | 3.5%), Security & Protection (1,179 | 2.0%), and Personal Care & Service (1,058 | 1.8%).
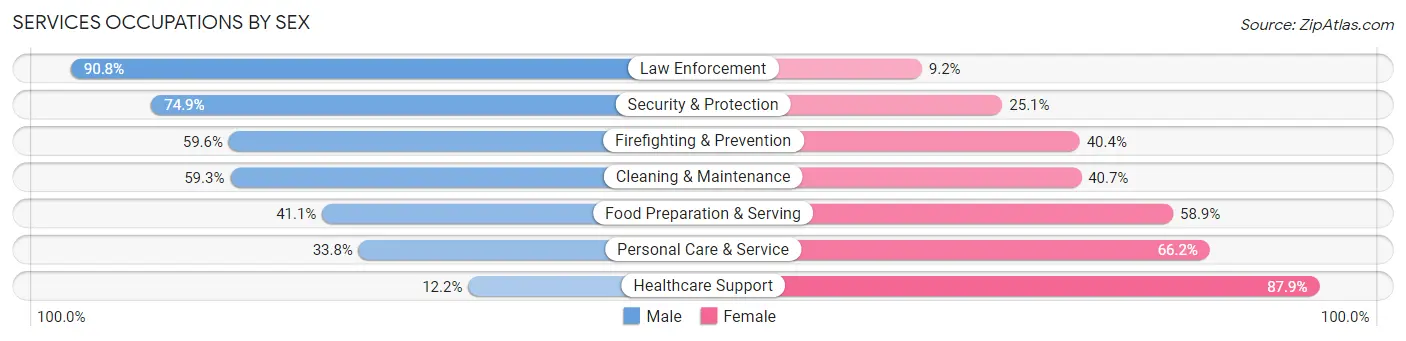
Services Occupations by Sex
Within the Services occupations in Florence County, the most male-oriented occupations are Law Enforcement (90.8%), Security & Protection (74.9%), and Firefighting & Prevention (59.6%), while the most female-oriented occupations are Healthcare Support (87.8%), Personal Care & Service (66.2%), and Food Preparation & Serving (58.9%).
| Occupation | Male | Female |
| Healthcare Support | 258 (12.1%) | 1,866 (87.8%) |
| Security & Protection | 883 (74.9%) | 296 (25.1%) |
| Firefighting & Prevention | 358 (59.6%) | 243 (40.4%) |
| Law Enforcement | 525 (90.8%) | 53 (9.2%) |
| Food Preparation & Serving | 1,533 (41.1%) | 2,200 (58.9%) |
| Cleaning & Maintenance | 1,268 (59.3%) | 871 (40.7%) |
| Personal Care & Service | 358 (33.8%) | 700 (66.2%) |
| Total (Category) | 4,300 (42.0%) | 5,933 (58.0%) |
| Total (Overall) | 29,427 (49.0%) | 30,613 (51.0%) |
Sales and Office Occupations
The most common Sales and Office occupations in Florence County are Sales & Related (6,936 | 11.6%), and Office & Administration (6,831 | 11.4%).

Sales and Office Occupations by Sex

| Occupation | Male | Female |
| Sales & Related | 3,236 (46.7%) | 3,700 (53.3%) |
| Office & Administration | 1,233 (18.0%) | 5,598 (82.0%) |
| Total (Category) | 4,469 (32.5%) | 9,298 (67.5%) |
| Total (Overall) | 29,427 (49.0%) | 30,613 (51.0%) |
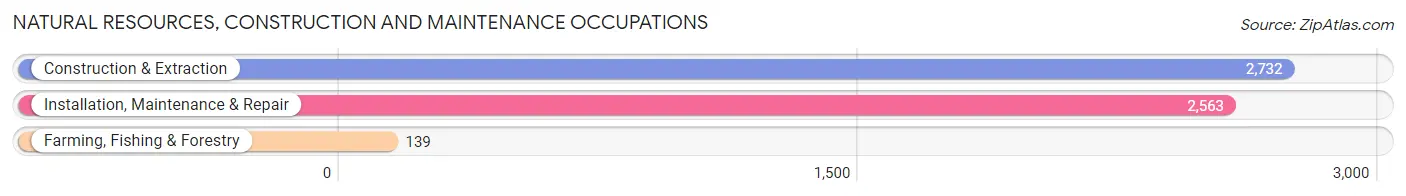
Natural Resources, Construction and Maintenance Occupations
The most common Natural Resources, Construction and Maintenance occupations in Florence County are Construction & Extraction (2,732 | 4.5%), Installation, Maintenance & Repair (2,563 | 4.3%), and Farming, Fishing & Forestry (139 | 0.2%).
Natural Resources, Construction and Maintenance Occupations by Sex
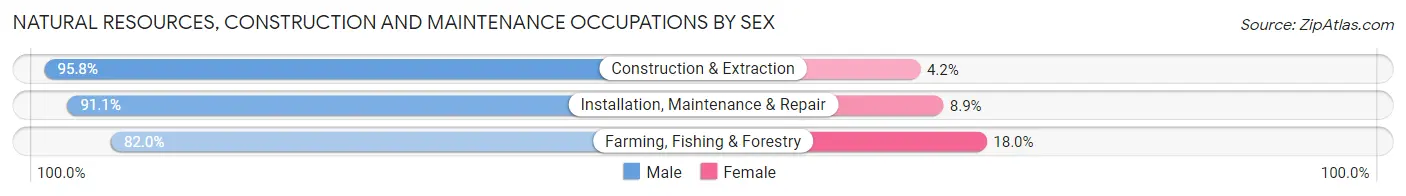
| Occupation | Male | Female |
| Farming, Fishing & Forestry | 114 (82.0%) | 25 (18.0%) |
| Construction & Extraction | 2,618 (95.8%) | 114 (4.2%) |
| Installation, Maintenance & Repair | 2,334 (91.1%) | 229 (8.9%) |
| Total (Category) | 5,066 (93.2%) | 368 (6.8%) |
| Total (Overall) | 29,427 (49.0%) | 30,613 (51.0%) |
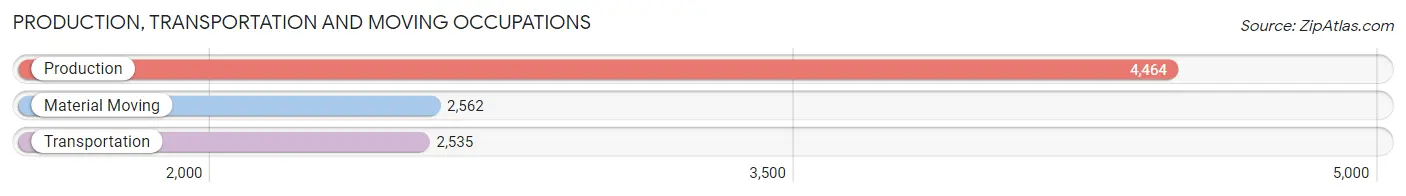
Production, Transportation and Moving Occupations
The most common Production, Transportation and Moving occupations in Florence County are Production (4,464 | 7.4%), Material Moving (2,562 | 4.3%), and Transportation (2,535 | 4.2%).
Production, Transportation and Moving Occupations by Sex
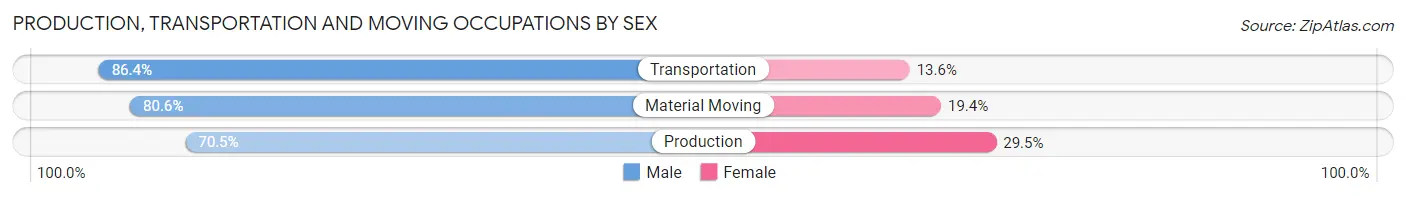
| Occupation | Male | Female |
| Production | 3,147 (70.5%) | 1,317 (29.5%) |
| Transportation | 2,190 (86.4%) | 345 (13.6%) |
| Material Moving | 2,066 (80.6%) | 496 (19.4%) |
| Total (Category) | 7,403 (77.4%) | 2,158 (22.6%) |
| Total (Overall) | 29,427 (49.0%) | 30,613 (51.0%) |
Employment Industries by Sex in Florence County
Employment Industries in Florence County
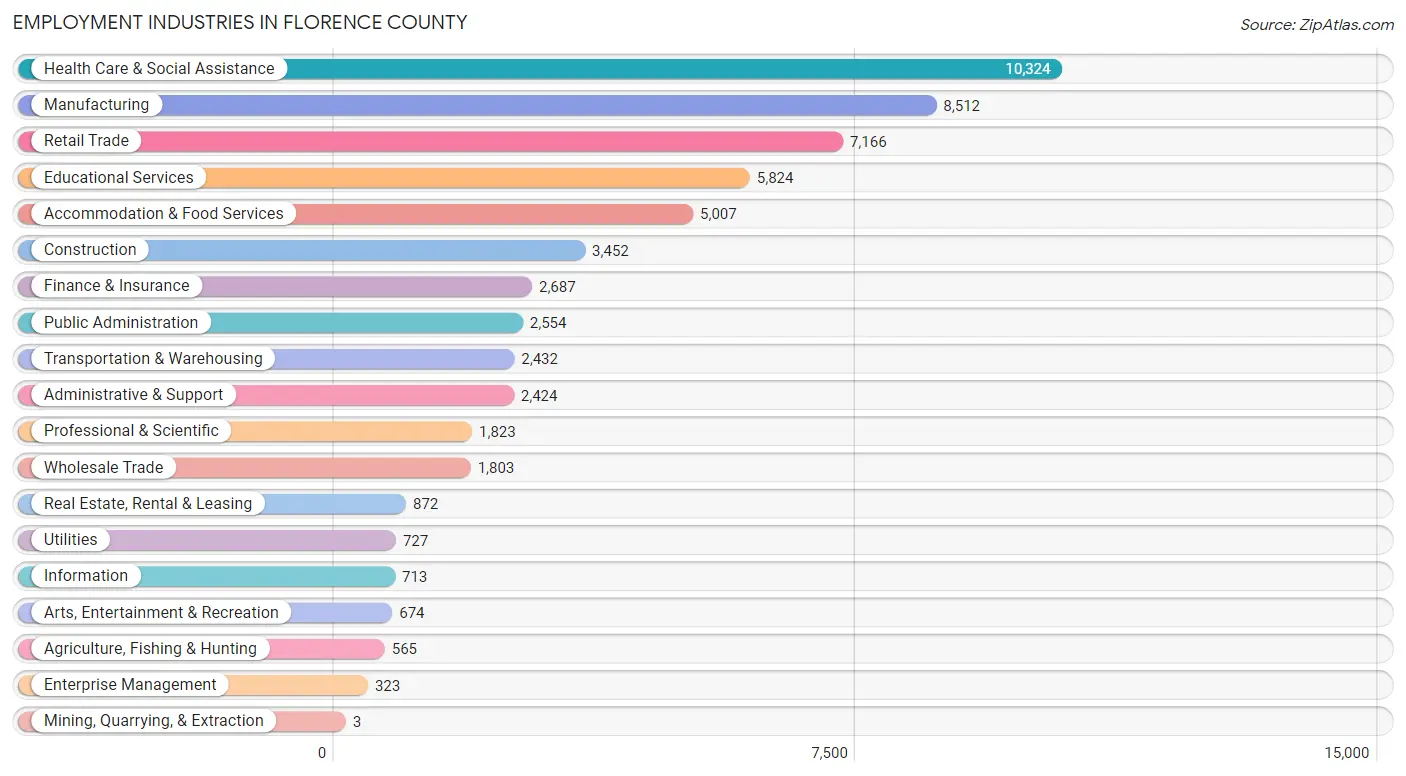
The major employment industries in Florence County include Health Care & Social Assistance (10,324 | 17.2%), Manufacturing (8,512 | 14.2%), Retail Trade (7,166 | 11.9%), Educational Services (5,824 | 9.7%), and Accommodation & Food Services (5,007 | 8.3%).
Employment Industries by Sex in Florence County
The Florence County industries that see more men than women are Mining, Quarrying, & Extraction (100.0%), Construction (93.0%), and Agriculture, Fishing & Hunting (82.8%), whereas the industries that tend to have a higher number of women are Enterprise Management (100.0%), Educational Services (77.8%), and Health Care & Social Assistance (76.4%).
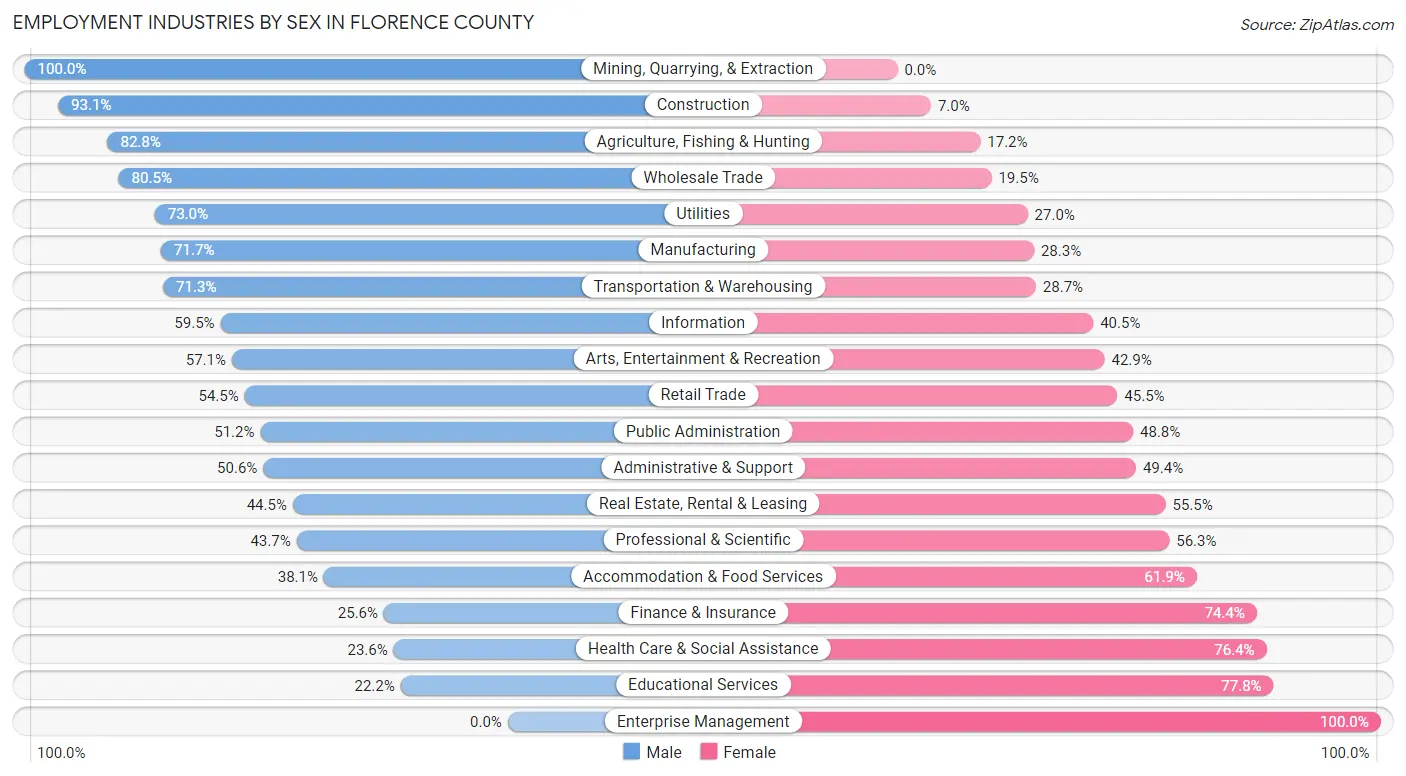
| Industry | Male | Female |
| Agriculture, Fishing & Hunting | 468 (82.8%) | 97 (17.2%) |
| Mining, Quarrying, & Extraction | 3 (100.0%) | 0 (0.0%) |
| Construction | 3,212 (93.0%) | 240 (7.0%) |
| Manufacturing | 6,106 (71.7%) | 2,406 (28.3%) |
| Wholesale Trade | 1,452 (80.5%) | 351 (19.5%) |
| Retail Trade | 3,903 (54.5%) | 3,263 (45.5%) |
| Transportation & Warehousing | 1,735 (71.3%) | 697 (28.7%) |
| Utilities | 531 (73.0%) | 196 (27.0%) |
| Information | 424 (59.5%) | 289 (40.5%) |
| Finance & Insurance | 689 (25.6%) | 1,998 (74.4%) |
| Real Estate, Rental & Leasing | 388 (44.5%) | 484 (55.5%) |
| Professional & Scientific | 797 (43.7%) | 1,026 (56.3%) |
| Enterprise Management | 0 (0.0%) | 323 (100.0%) |
| Administrative & Support | 1,227 (50.6%) | 1,197 (49.4%) |
| Educational Services | 1,292 (22.2%) | 4,532 (77.8%) |
| Health Care & Social Assistance | 2,440 (23.6%) | 7,884 (76.4%) |
| Arts, Entertainment & Recreation | 385 (57.1%) | 289 (42.9%) |
| Accommodation & Food Services | 1,906 (38.1%) | 3,101 (61.9%) |
| Public Administration | 1,308 (51.2%) | 1,246 (48.8%) |
| Total | 29,427 (49.0%) | 30,613 (51.0%) |
Education in Florence County
School Enrollment in Florence County
The most common levels of schooling among the 33,585 students in Florence County are high school (7,567 | 22.5%), middle school (7,527 | 22.4%), and elementary school (6,718 | 20.0%).
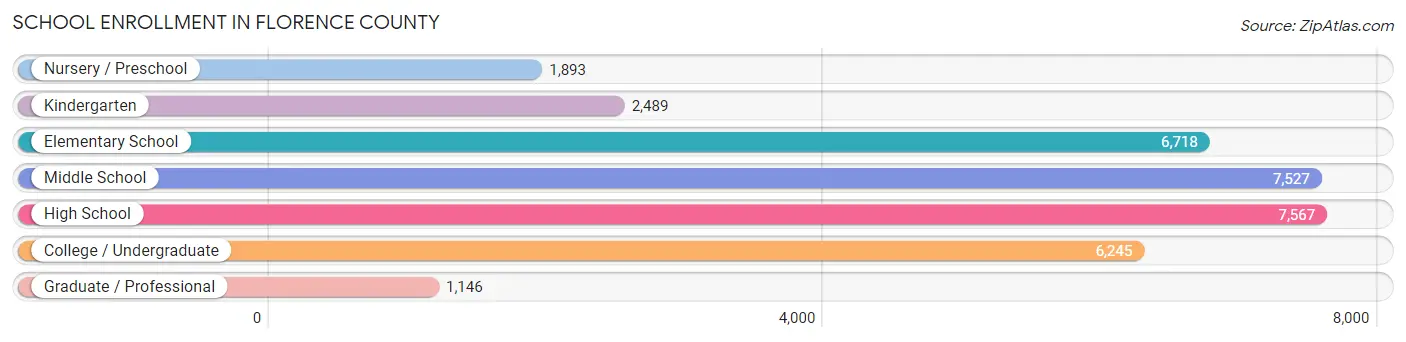
| School Level | # Students | % Students |
| Nursery / Preschool | 1,893 | 5.6% |
| Kindergarten | 2,489 | 7.4% |
| Elementary School | 6,718 | 20.0% |
| Middle School | 7,527 | 22.4% |
| High School | 7,567 | 22.5% |
| College / Undergraduate | 6,245 | 18.6% |
| Graduate / Professional | 1,146 | 3.4% |
| Total | 33,585 | 100.0% |
School Enrollment by Age by Funding Source in Florence County
Out of a total of 33,585 students who are enrolled in schools in Florence County, 4,568 (13.6%) attend a private institution, while the remaining 29,017 (86.4%) are enrolled in public schools. The age group of 3 to 4 year olds has the highest likelihood of being enrolled in private schools, with 734 (37.1% in the age bracket) enrolled. Conversely, the age group of 18 to 19 year olds has the lowest likelihood of being enrolled in a private school, with 2,251 (95.8% in the age bracket) attending a public institution.
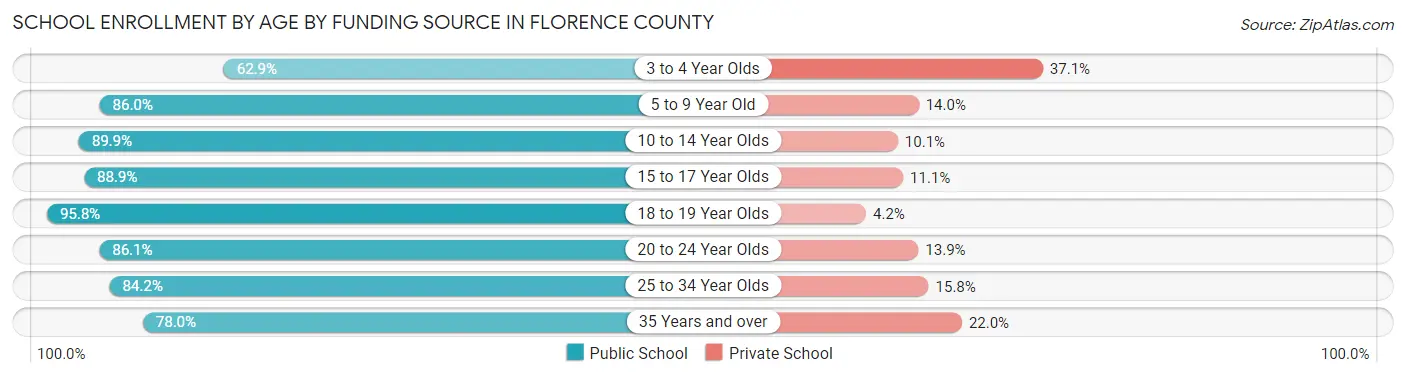
| Age Bracket | Public School | Private School |
| 3 to 4 Year Olds | 1,244 (62.9%) | 734 (37.1%) |
| 5 to 9 Year Old | 6,965 (86.0%) | 1,132 (14.0%) |
| 10 to 14 Year Olds | 8,392 (89.9%) | 943 (10.1%) |
| 15 to 17 Year Olds | 4,918 (88.9%) | 613 (11.1%) |
| 18 to 19 Year Olds | 2,251 (95.8%) | 98 (4.2%) |
| 20 to 24 Year Olds | 2,782 (86.1%) | 450 (13.9%) |
| 25 to 34 Year Olds | 947 (84.2%) | 178 (15.8%) |
| 35 Years and over | 1,511 (78.0%) | 427 (22.0%) |
| Total | 29,017 (86.4%) | 4,568 (13.6%) |
Educational Attainment by Field of Study in Florence County
Business (4,846 | 20.8%), education (4,147 | 17.8%), science & technology (2,963 | 12.7%), engineering (1,699 | 7.3%), and bio, nature & agricultural (1,659 | 7.1%) are the most common fields of study among 23,347 individuals in Florence County who have obtained a bachelor's degree or higher.
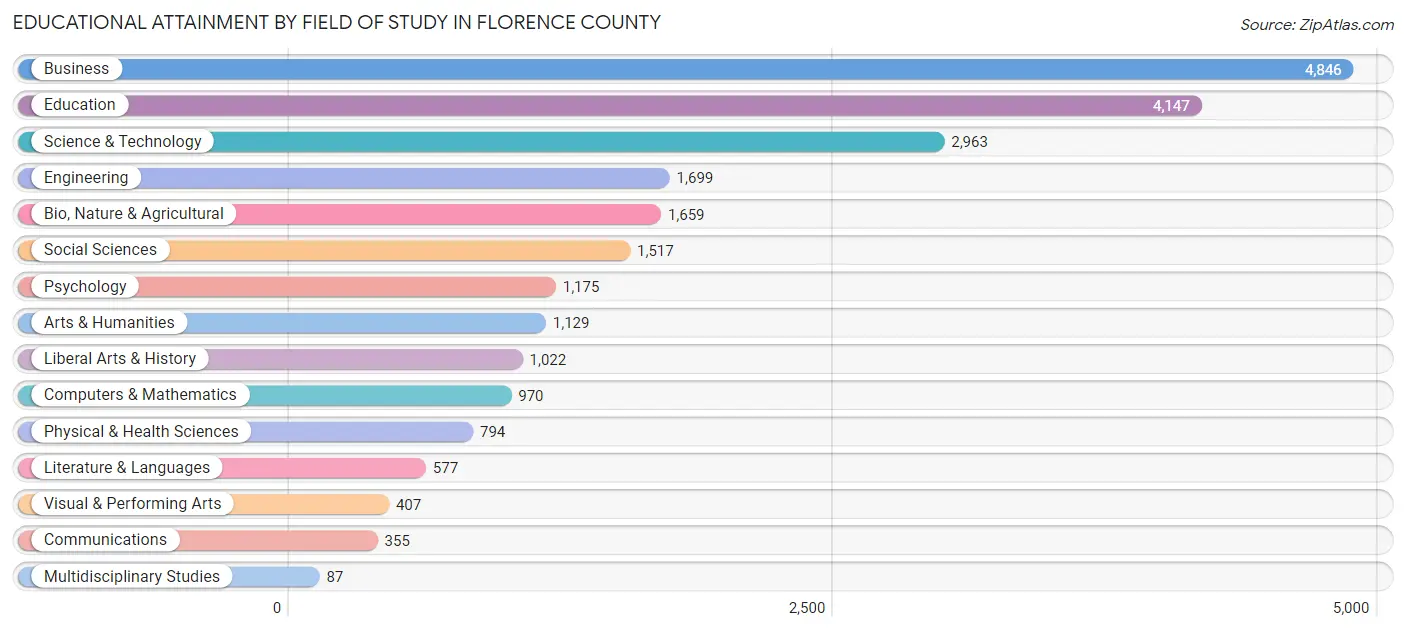
| Field of Study | # Graduates | % Graduates |
| Computers & Mathematics | 970 | 4.2% |
| Bio, Nature & Agricultural | 1,659 | 7.1% |
| Physical & Health Sciences | 794 | 3.4% |
| Psychology | 1,175 | 5.0% |
| Social Sciences | 1,517 | 6.5% |
| Engineering | 1,699 | 7.3% |
| Multidisciplinary Studies | 87 | 0.4% |
| Science & Technology | 2,963 | 12.7% |
| Business | 4,846 | 20.8% |
| Education | 4,147 | 17.8% |
| Literature & Languages | 577 | 2.5% |
| Liberal Arts & History | 1,022 | 4.4% |
| Visual & Performing Arts | 407 | 1.7% |
| Communications | 355 | 1.5% |
| Arts & Humanities | 1,129 | 4.8% |
| Total | 23,347 | 100.0% |
Transportation & Commute in Florence County
Vehicle Availability by Sex in Florence County
The most prevalent vehicle ownership categories in Florence County are males with 2 vehicles (12,457, accounting for 42.3%) and females with 2 vehicles (12,439, making up 41.7%).
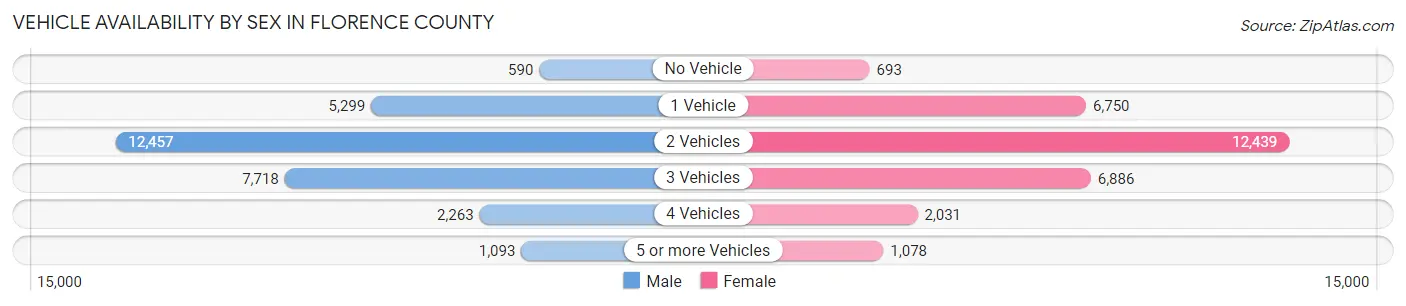
| Vehicles Available | Male | Female |
| No Vehicle | 590 (2.0%) | 693 (2.3%) |
| 1 Vehicle | 5,299 (18.0%) | 6,750 (22.6%) |
| 2 Vehicles | 12,457 (42.3%) | 12,439 (41.6%) |
| 3 Vehicles | 7,718 (26.2%) | 6,886 (23.1%) |
| 4 Vehicles | 2,263 (7.7%) | 2,031 (6.8%) |
| 5 or more Vehicles | 1,093 (3.7%) | 1,078 (3.6%) |
| Total | 29,420 (100.0%) | 29,877 (100.0%) |
Commute Time in Florence County
The most frequently occuring commute durations in Florence County are 15 to 19 minutes (12,257 commuters, 22.2%), 10 to 14 minutes (10,258 commuters, 18.6%), and 20 to 24 minutes (7,675 commuters, 13.9%).
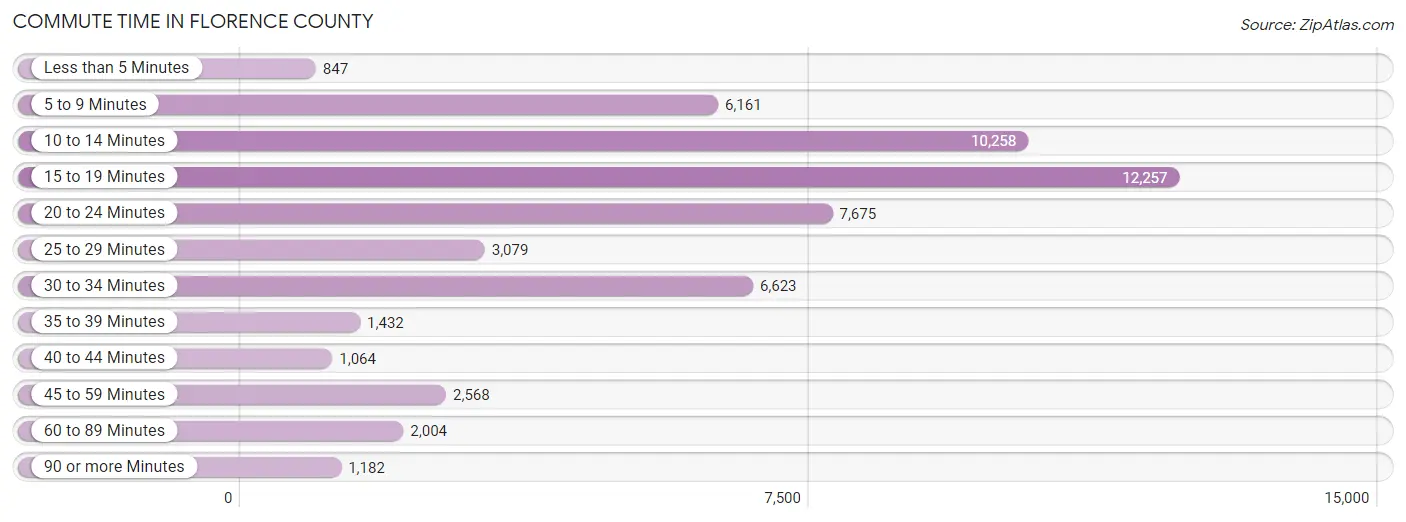
| Commute Time | # Commuters | % Commuters |
| Less than 5 Minutes | 847 | 1.5% |
| 5 to 9 Minutes | 6,161 | 11.2% |
| 10 to 14 Minutes | 10,258 | 18.6% |
| 15 to 19 Minutes | 12,257 | 22.2% |
| 20 to 24 Minutes | 7,675 | 13.9% |
| 25 to 29 Minutes | 3,079 | 5.6% |
| 30 to 34 Minutes | 6,623 | 12.0% |
| 35 to 39 Minutes | 1,432 | 2.6% |
| 40 to 44 Minutes | 1,064 | 1.9% |
| 45 to 59 Minutes | 2,568 | 4.7% |
| 60 to 89 Minutes | 2,004 | 3.6% |
| 90 or more Minutes | 1,182 | 2.1% |
Commute Time by Sex in Florence County
The most common commute times in Florence County are 15 to 19 minutes (5,606 commuters, 20.2%) for males and 15 to 19 minutes (6,651 commuters, 24.2%) for females.
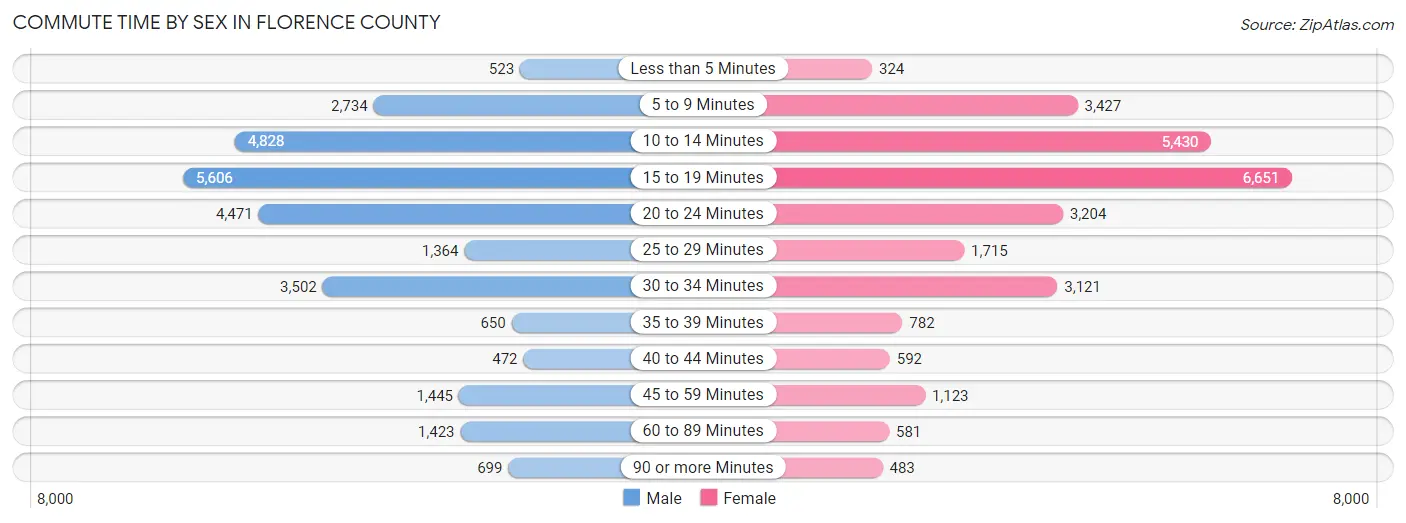
| Commute Time | Male | Female |
| Less than 5 Minutes | 523 (1.9%) | 324 (1.2%) |
| 5 to 9 Minutes | 2,734 (9.9%) | 3,427 (12.5%) |
| 10 to 14 Minutes | 4,828 (17.4%) | 5,430 (19.8%) |
| 15 to 19 Minutes | 5,606 (20.2%) | 6,651 (24.2%) |
| 20 to 24 Minutes | 4,471 (16.1%) | 3,204 (11.7%) |
| 25 to 29 Minutes | 1,364 (4.9%) | 1,715 (6.2%) |
| 30 to 34 Minutes | 3,502 (12.6%) | 3,121 (11.4%) |
| 35 to 39 Minutes | 650 (2.4%) | 782 (2.9%) |
| 40 to 44 Minutes | 472 (1.7%) | 592 (2.2%) |
| 45 to 59 Minutes | 1,445 (5.2%) | 1,123 (4.1%) |
| 60 to 89 Minutes | 1,423 (5.1%) | 581 (2.1%) |
| 90 or more Minutes | 699 (2.5%) | 483 (1.8%) |
Time of Departure to Work by Sex in Florence County
The most frequent times of departure to work in Florence County are 7:00 AM to 7:29 AM (5,417, 19.5%) for males and 7:00 AM to 7:29 AM (5,594, 20.4%) for females.
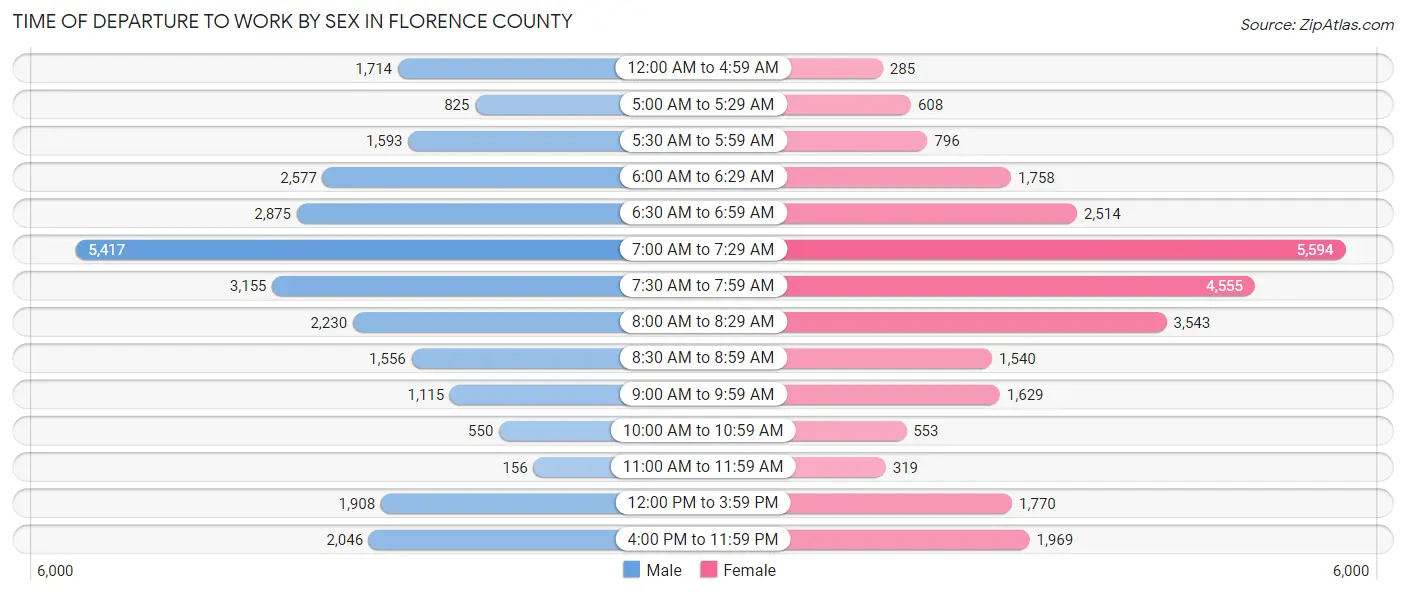
| Time of Departure | Male | Female |
| 12:00 AM to 4:59 AM | 1,714 (6.2%) | 285 (1.0%) |
| 5:00 AM to 5:29 AM | 825 (3.0%) | 608 (2.2%) |
| 5:30 AM to 5:59 AM | 1,593 (5.8%) | 796 (2.9%) |
| 6:00 AM to 6:29 AM | 2,577 (9.3%) | 1,758 (6.4%) |
| 6:30 AM to 6:59 AM | 2,875 (10.4%) | 2,514 (9.2%) |
| 7:00 AM to 7:29 AM | 5,417 (19.5%) | 5,594 (20.4%) |
| 7:30 AM to 7:59 AM | 3,155 (11.4%) | 4,555 (16.6%) |
| 8:00 AM to 8:29 AM | 2,230 (8.1%) | 3,543 (12.9%) |
| 8:30 AM to 8:59 AM | 1,556 (5.6%) | 1,540 (5.6%) |
| 9:00 AM to 9:59 AM | 1,115 (4.0%) | 1,629 (5.9%) |
| 10:00 AM to 10:59 AM | 550 (2.0%) | 553 (2.0%) |
| 11:00 AM to 11:59 AM | 156 (0.6%) | 319 (1.2%) |
| 12:00 PM to 3:59 PM | 1,908 (6.9%) | 1,770 (6.5%) |
| 4:00 PM to 11:59 PM | 2,046 (7.4%) | 1,969 (7.2%) |
| Total | 27,717 (100.0%) | 27,433 (100.0%) |
Housing Occupancy in Florence County
Occupancy by Ownership in Florence County
Of the total 52,244 dwellings in Florence County, owner-occupied units account for 33,791 (64.7%), while renter-occupied units make up 18,453 (35.3%).
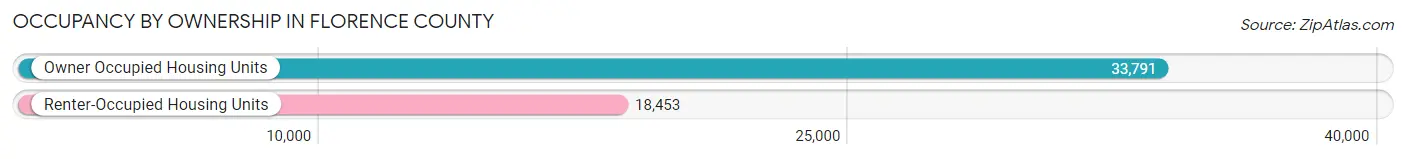
| Occupancy | # Housing Units | % Housing Units |
| Owner Occupied Housing Units | 33,791 | 64.7% |
| Renter-Occupied Housing Units | 18,453 | 35.3% |
| Total Occupied Housing Units | 52,244 | 100.0% |
Occupancy by Household Size in Florence County
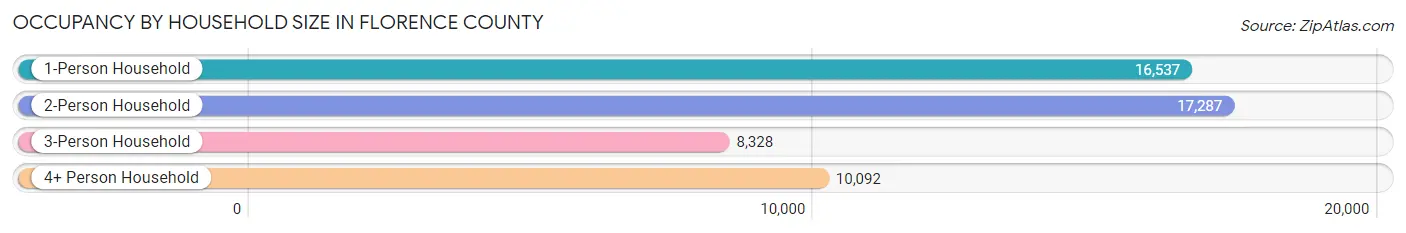
| Household Size | # Housing Units | % Housing Units |
| 1-Person Household | 16,537 | 31.7% |
| 2-Person Household | 17,287 | 33.1% |
| 3-Person Household | 8,328 | 15.9% |
| 4+ Person Household | 10,092 | 19.3% |
| Total Housing Units | 52,244 | 100.0% |
Occupancy by Ownership by Household Size in Florence County
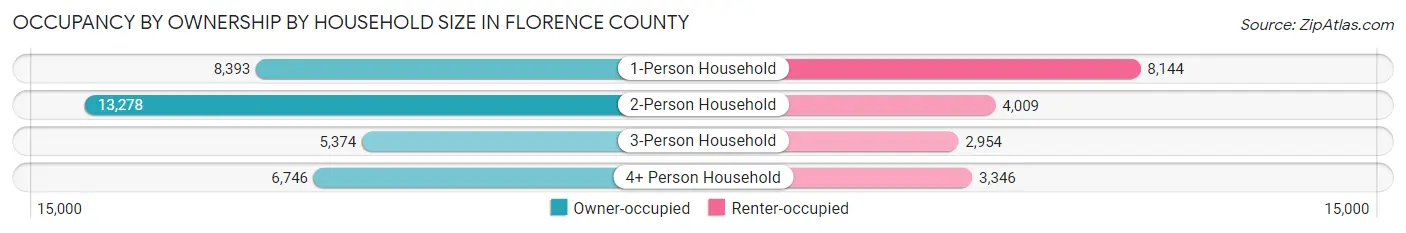
| Household Size | Owner-occupied | Renter-occupied |
| 1-Person Household | 8,393 (50.7%) | 8,144 (49.2%) |
| 2-Person Household | 13,278 (76.8%) | 4,009 (23.2%) |
| 3-Person Household | 5,374 (64.5%) | 2,954 (35.5%) |
| 4+ Person Household | 6,746 (66.8%) | 3,346 (33.2%) |
| Total Housing Units | 33,791 (64.7%) | 18,453 (35.3%) |
Occupancy by Educational Attainment in Florence County
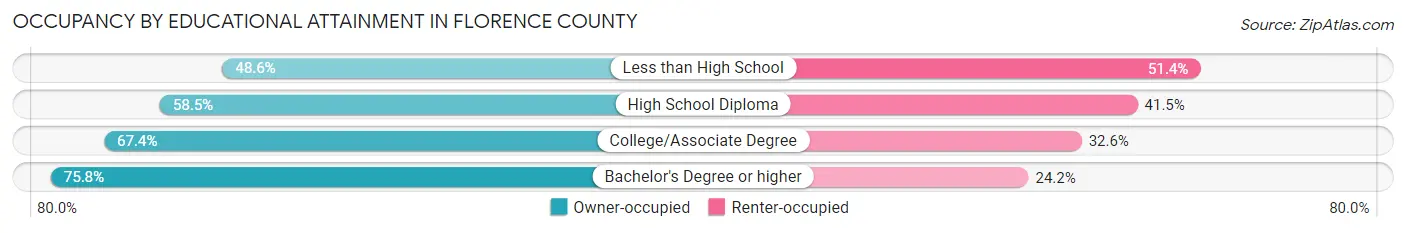
| Household Size | Owner-occupied | Renter-occupied |
| Less than High School | 2,831 (48.6%) | 2,992 (51.4%) |
| High School Diploma | 9,703 (58.5%) | 6,876 (41.5%) |
| College/Associate Degree | 10,965 (67.4%) | 5,304 (32.6%) |
| Bachelor's Degree or higher | 10,292 (75.8%) | 3,281 (24.2%) |
Occupancy by Age of Householder in Florence County
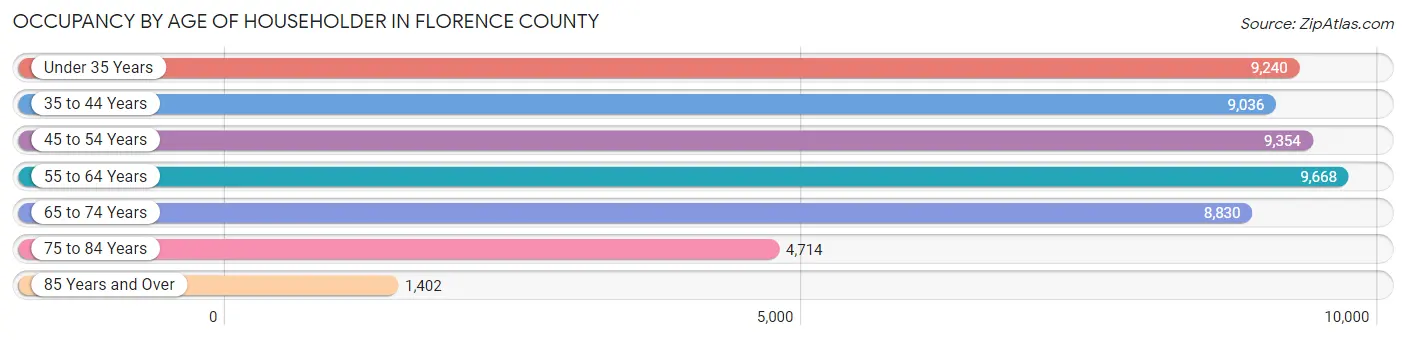
| Age Bracket | # Households | % Households |
| Under 35 Years | 9,240 | 17.7% |
| 35 to 44 Years | 9,036 | 17.3% |
| 45 to 54 Years | 9,354 | 17.9% |
| 55 to 64 Years | 9,668 | 18.5% |
| 65 to 74 Years | 8,830 | 16.9% |
| 75 to 84 Years | 4,714 | 9.0% |
| 85 Years and Over | 1,402 | 2.7% |
| Total | 52,244 | 100.0% |
Housing Finances in Florence County
Median Income by Occupancy in Florence County
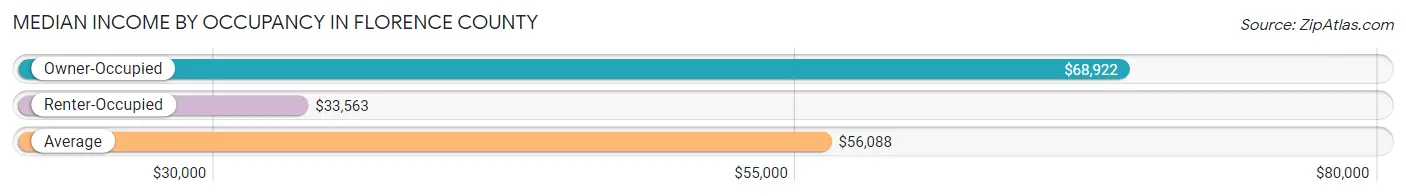
| Occupancy Type | # Households | Median Income |
| Owner-Occupied | 33,791 (64.7%) | $68,922 |
| Renter-Occupied | 18,453 (35.3%) | $33,563 |
| Average | 52,244 (100.0%) | $56,088 |
Occupancy by Householder Income Bracket in Florence County
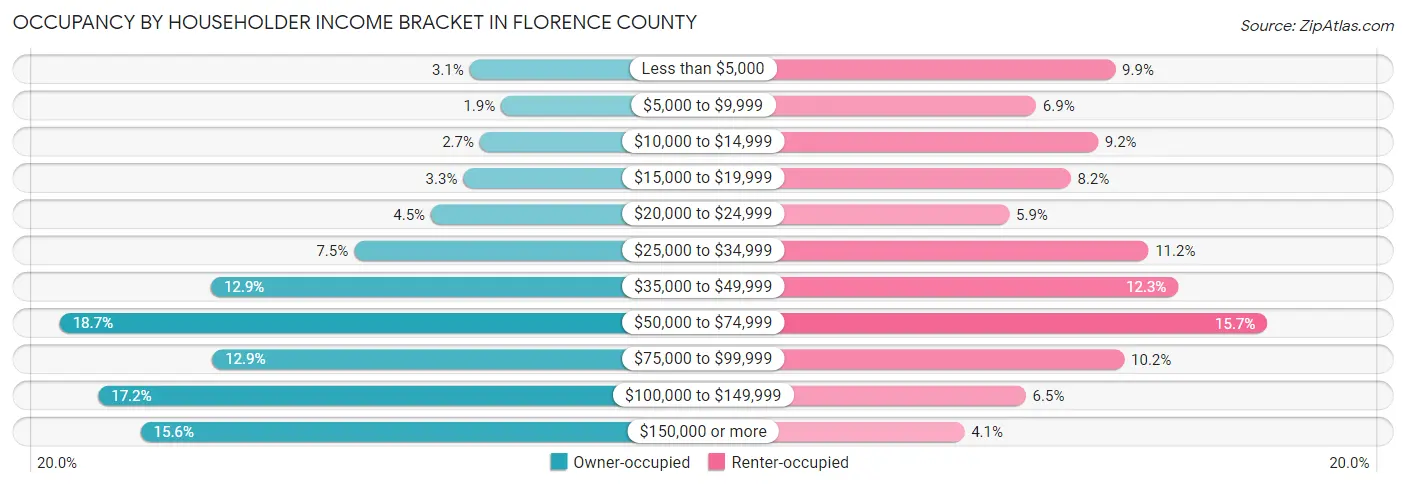
| Income Bracket | Owner-occupied | Renter-occupied |
| Less than $5,000 | 1,030 (3.0%) | 1,825 (9.9%) |
| $5,000 to $9,999 | 626 (1.8%) | 1,268 (6.9%) |
| $10,000 to $14,999 | 898 (2.7%) | 1,703 (9.2%) |
| $15,000 to $19,999 | 1,113 (3.3%) | 1,512 (8.2%) |
| $20,000 to $24,999 | 1,527 (4.5%) | 1,080 (5.9%) |
| $25,000 to $34,999 | 2,518 (7.4%) | 2,057 (11.2%) |
| $35,000 to $49,999 | 4,358 (12.9%) | 2,267 (12.3%) |
| $50,000 to $74,999 | 6,306 (18.7%) | 2,893 (15.7%) |
| $75,000 to $99,999 | 4,342 (12.9%) | 1,888 (10.2%) |
| $100,000 to $149,999 | 5,810 (17.2%) | 1,196 (6.5%) |
| $150,000 or more | 5,263 (15.6%) | 764 (4.1%) |
| Total | 33,791 (100.0%) | 18,453 (100.0%) |
Monthly Housing Cost Tiers in Florence County
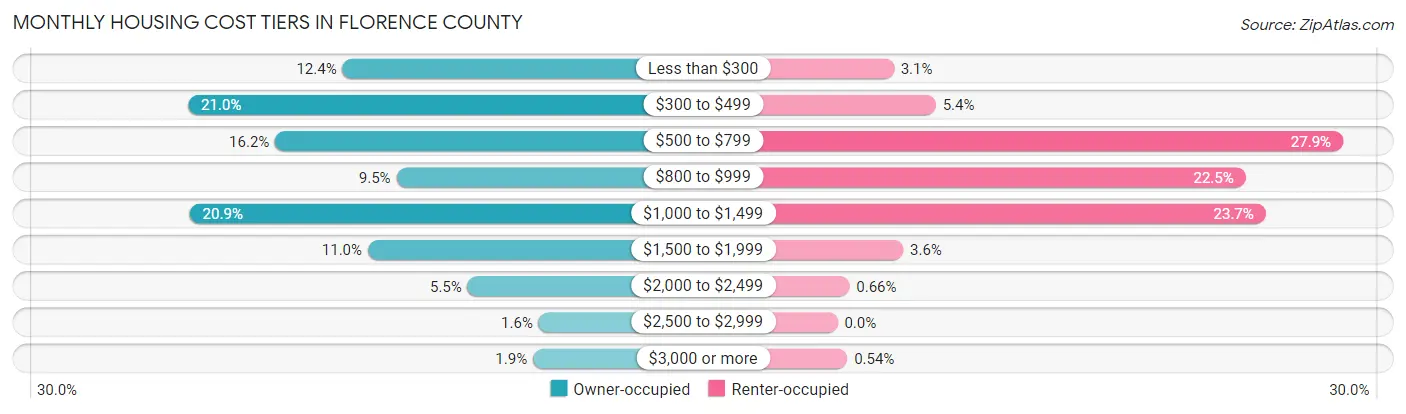
| Monthly Cost | Owner-occupied | Renter-occupied |
| Less than $300 | 4,204 (12.4%) | 574 (3.1%) |
| $300 to $499 | 7,086 (21.0%) | 1,002 (5.4%) |
| $500 to $799 | 5,461 (16.2%) | 5,153 (27.9%) |
| $800 to $999 | 3,195 (9.5%) | 4,160 (22.5%) |
| $1,000 to $1,499 | 7,057 (20.9%) | 4,364 (23.6%) |
| $1,500 to $1,999 | 3,732 (11.0%) | 670 (3.6%) |
| $2,000 to $2,499 | 1,867 (5.5%) | 121 (0.7%) |
| $2,500 to $2,999 | 539 (1.6%) | 0 (0.0%) |
| $3,000 or more | 650 (1.9%) | 99 (0.5%) |
| Total | 33,791 (100.0%) | 18,453 (100.0%) |
Physical Housing Characteristics in Florence County
Housing Structures in Florence County
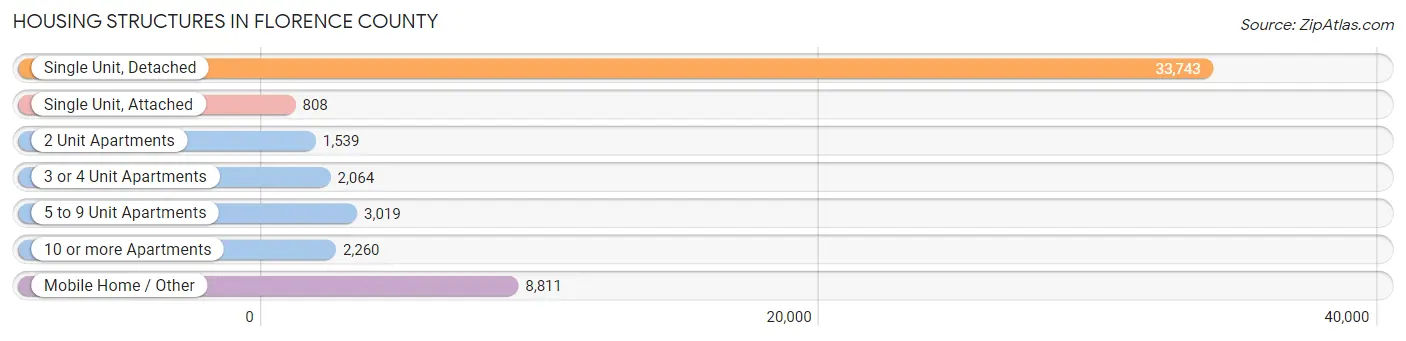
| Structure Type | # Housing Units | % Housing Units |
| Single Unit, Detached | 33,743 | 64.6% |
| Single Unit, Attached | 808 | 1.5% |
| 2 Unit Apartments | 1,539 | 2.9% |
| 3 or 4 Unit Apartments | 2,064 | 4.0% |
| 5 to 9 Unit Apartments | 3,019 | 5.8% |
| 10 or more Apartments | 2,260 | 4.3% |
| Mobile Home / Other | 8,811 | 16.9% |
| Total | 52,244 | 100.0% |
Housing Structures by Occupancy in Florence County
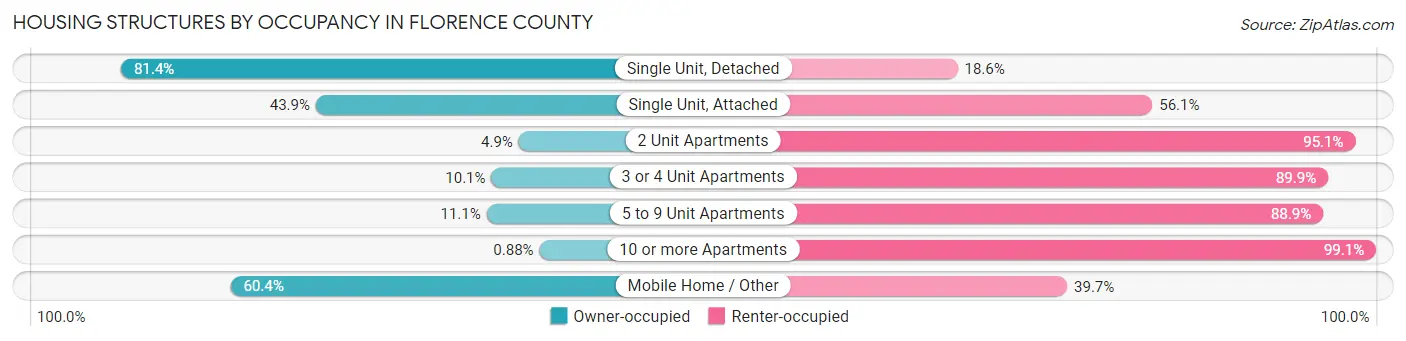
| Structure Type | Owner-occupied | Renter-occupied |
| Single Unit, Detached | 27,481 (81.4%) | 6,262 (18.6%) |
| Single Unit, Attached | 355 (43.9%) | 453 (56.1%) |
| 2 Unit Apartments | 75 (4.9%) | 1,464 (95.1%) |
| 3 or 4 Unit Apartments | 209 (10.1%) | 1,855 (89.9%) |
| 5 to 9 Unit Apartments | 334 (11.1%) | 2,685 (88.9%) |
| 10 or more Apartments | 20 (0.9%) | 2,240 (99.1%) |
| Mobile Home / Other | 5,317 (60.4%) | 3,494 (39.7%) |
| Total | 33,791 (64.7%) | 18,453 (35.3%) |
Housing Structures by Number of Rooms in Florence County
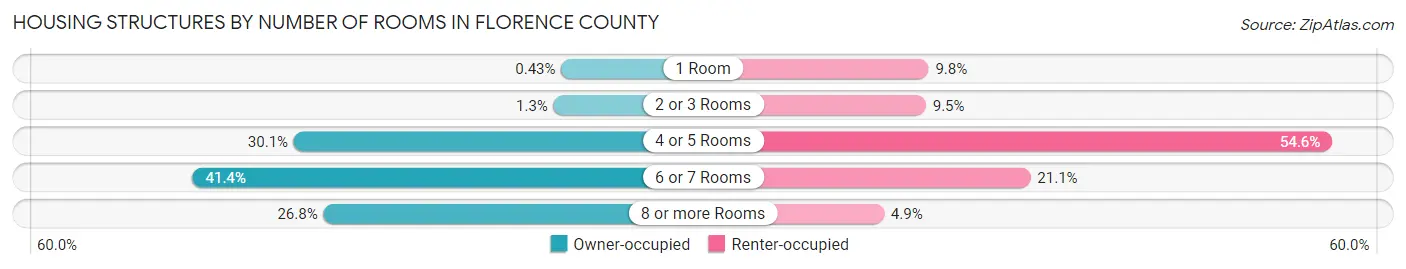
| Number of Rooms | Owner-occupied | Renter-occupied |
| 1 Room | 146 (0.4%) | 1,814 (9.8%) |
| 2 or 3 Rooms | 432 (1.3%) | 1,758 (9.5%) |
| 4 or 5 Rooms | 10,176 (30.1%) | 10,079 (54.6%) |
| 6 or 7 Rooms | 13,972 (41.3%) | 3,901 (21.1%) |
| 8 or more Rooms | 9,065 (26.8%) | 901 (4.9%) |
| Total | 33,791 (100.0%) | 18,453 (100.0%) |
Housing Structure by Heating Type in Florence County
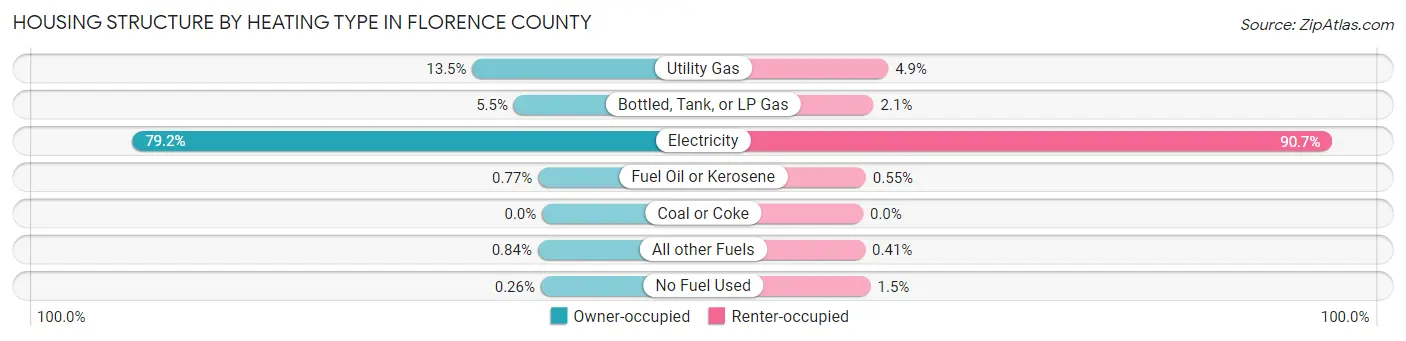
| Heating Type | Owner-occupied | Renter-occupied |
| Utility Gas | 4,552 (13.5%) | 897 (4.9%) |
| Bottled, Tank, or LP Gas | 1,847 (5.5%) | 379 (2.1%) |
| Electricity | 26,761 (79.2%) | 16,731 (90.7%) |
| Fuel Oil or Kerosene | 259 (0.8%) | 101 (0.5%) |
| Coal or Coke | 0 (0.0%) | 0 (0.0%) |
| All other Fuels | 285 (0.8%) | 76 (0.4%) |
| No Fuel Used | 87 (0.3%) | 269 (1.5%) |
| Total | 33,791 (100.0%) | 18,453 (100.0%) |
Household Vehicle Usage in Florence County
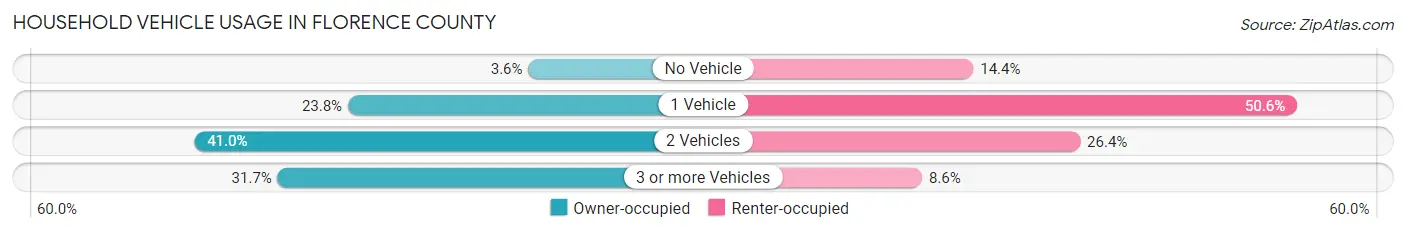
| Vehicles per Household | Owner-occupied | Renter-occupied |
| No Vehicle | 1,207 (3.6%) | 2,653 (14.4%) |
| 1 Vehicle | 8,035 (23.8%) | 9,345 (50.6%) |
| 2 Vehicles | 13,854 (41.0%) | 4,862 (26.4%) |
| 3 or more Vehicles | 10,695 (31.7%) | 1,593 (8.6%) |
| Total | 33,791 (100.0%) | 18,453 (100.0%) |
Real Estate & Mortgages in Florence County
Real Estate and Mortgage Overview in Florence County
| Characteristic | Without Mortgage | With Mortgage |
| Housing Units | 15,356 | 18,435 |
| Median Property Value | $112,600 | $184,600 |
| Median Household Income | $52,422 | $3,744 |
| Monthly Housing Costs | $388 | $598 |
| Real Estate Taxes | $519 | $463 |
Property Value by Mortgage Status in Florence County
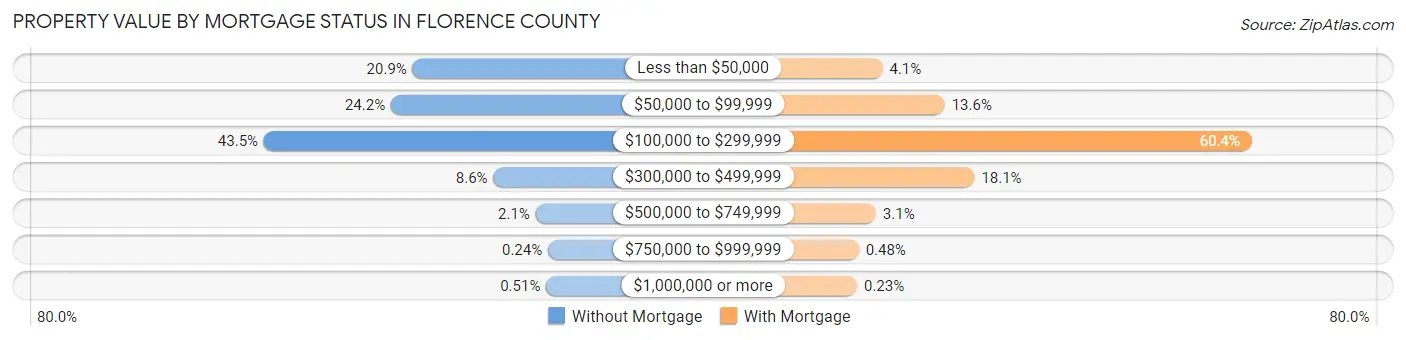
| Property Value | Without Mortgage | With Mortgage |
| Less than $50,000 | 3,205 (20.9%) | 756 (4.1%) |
| $50,000 to $99,999 | 3,711 (24.2%) | 2,505 (13.6%) |
| $100,000 to $299,999 | 6,685 (43.5%) | 11,130 (60.4%) |
| $300,000 to $499,999 | 1,314 (8.6%) | 3,341 (18.1%) |
| $500,000 to $749,999 | 326 (2.1%) | 572 (3.1%) |
| $750,000 to $999,999 | 37 (0.2%) | 89 (0.5%) |
| $1,000,000 or more | 78 (0.5%) | 42 (0.2%) |
| Total | 15,356 (100.0%) | 18,435 (100.0%) |
Household Income by Mortgage Status in Florence County
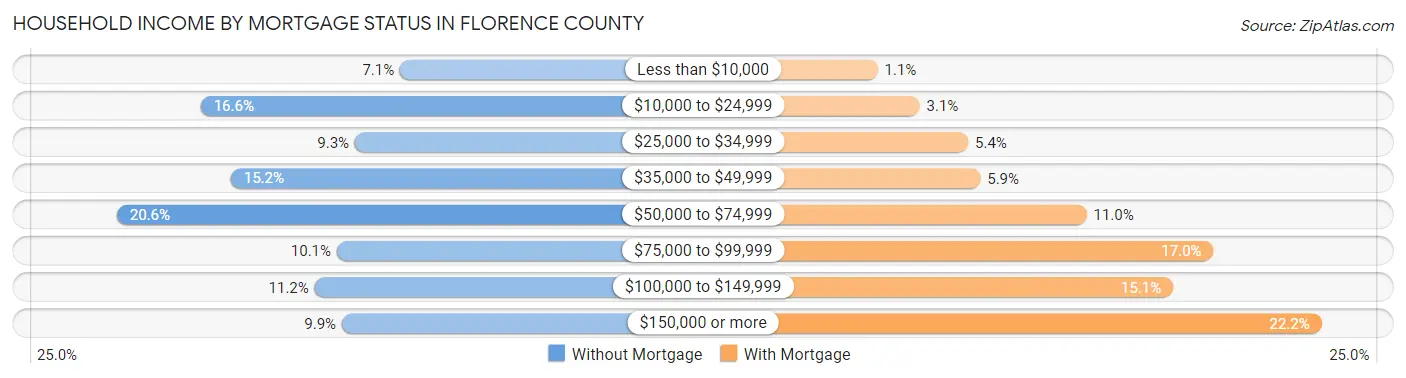
| Household Income | Without Mortgage | With Mortgage |
| Less than $10,000 | 1,094 (7.1%) | 194 (1.1%) |
| $10,000 to $24,999 | 2,550 (16.6%) | 562 (3.0%) |
| $25,000 to $34,999 | 1,423 (9.3%) | 988 (5.4%) |
| $35,000 to $49,999 | 2,331 (15.2%) | 1,095 (5.9%) |
| $50,000 to $74,999 | 3,165 (20.6%) | 2,027 (11.0%) |
| $75,000 to $99,999 | 1,555 (10.1%) | 3,141 (17.0%) |
| $100,000 to $149,999 | 1,719 (11.2%) | 2,787 (15.1%) |
| $150,000 or more | 1,519 (9.9%) | 4,091 (22.2%) |
| Total | 15,356 (100.0%) | 18,435 (100.0%) |
Property Value to Household Income Ratio in Florence County
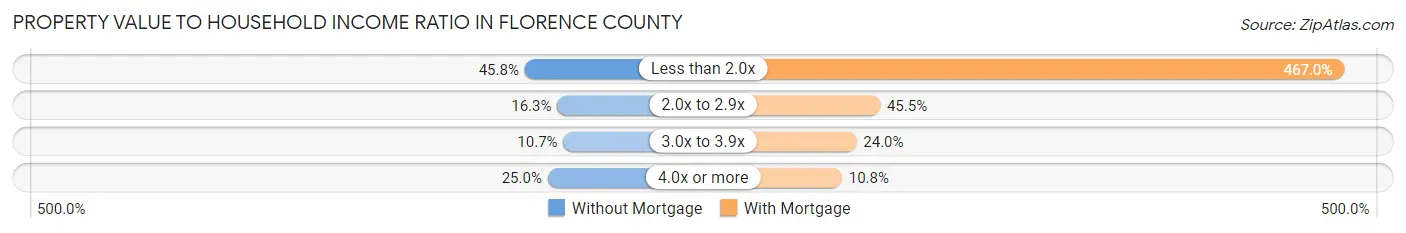
| Value-to-Income Ratio | Without Mortgage | With Mortgage |
| Less than 2.0x | 7,038 (45.8%) | 86,099 (467.0%) |
| 2.0x to 2.9x | 2,497 (16.3%) | 8,381 (45.5%) |
| 3.0x to 3.9x | 1,646 (10.7%) | 4,428 (24.0%) |
| 4.0x or more | 3,836 (25.0%) | 1,988 (10.8%) |
| Total | 15,356 (100.0%) | 18,435 (100.0%) |
Real Estate Taxes by Mortgage Status in Florence County
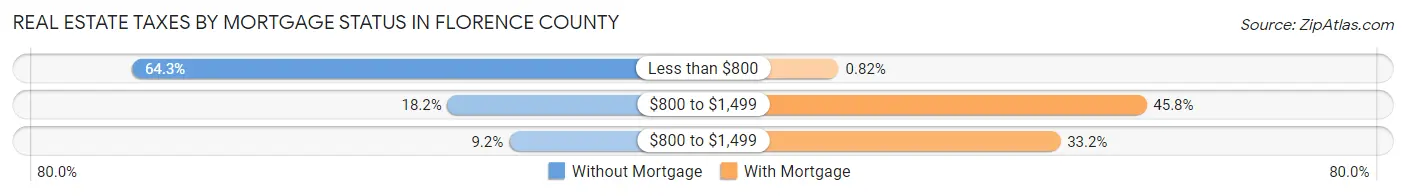
| Property Taxes | Without Mortgage | With Mortgage |
| Less than $800 | 9,875 (64.3%) | 151 (0.8%) |
| $800 to $1,499 | 2,795 (18.2%) | 8,440 (45.8%) |
| $800 to $1,499 | 1,415 (9.2%) | 6,118 (33.2%) |
| Total | 15,356 (100.0%) | 18,435 (100.0%) |
Health & Disability in Florence County
Health Insurance Coverage by Age in Florence County
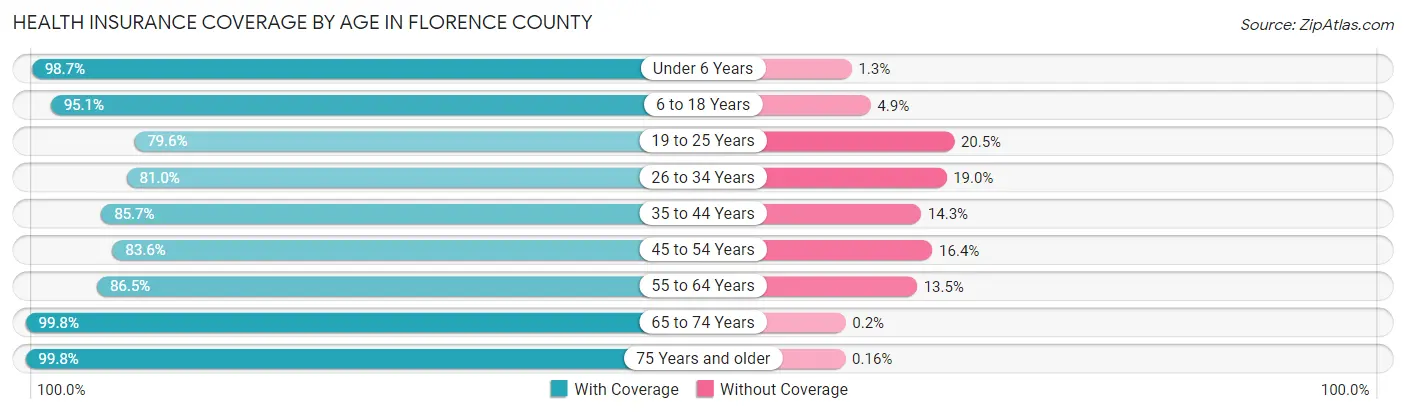
| Age Bracket | With Coverage | Without Coverage |
| Under 6 Years | 10,001 (98.7%) | 136 (1.3%) |
| 6 to 18 Years | 22,585 (95.1%) | 1,156 (4.9%) |
| 19 to 25 Years | 9,498 (79.5%) | 2,442 (20.4%) |
| 26 to 34 Years | 12,354 (81.0%) | 2,898 (19.0%) |
| 35 to 44 Years | 14,128 (85.7%) | 2,355 (14.3%) |
| 45 to 54 Years | 14,139 (83.6%) | 2,769 (16.4%) |
| 55 to 64 Years | 15,047 (86.5%) | 2,349 (13.5%) |
| 65 to 74 Years | 14,147 (99.8%) | 28 (0.2%) |
| 75 Years and older | 8,959 (99.8%) | 14 (0.2%) |
| Total | 120,858 (89.5%) | 14,147 (10.5%) |
Health Insurance Coverage by Citizenship Status in Florence County
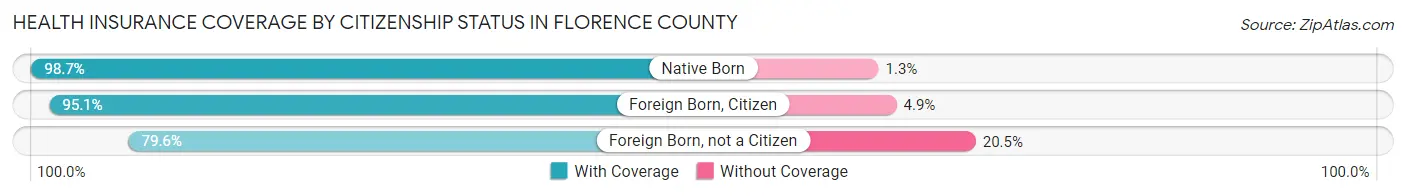
| Citizenship Status | With Coverage | Without Coverage |
| Native Born | 10,001 (98.7%) | 136 (1.3%) |
| Foreign Born, Citizen | 22,585 (95.1%) | 1,156 (4.9%) |
| Foreign Born, not a Citizen | 9,498 (79.5%) | 2,442 (20.4%) |
Health Insurance Coverage by Household Income in Florence County
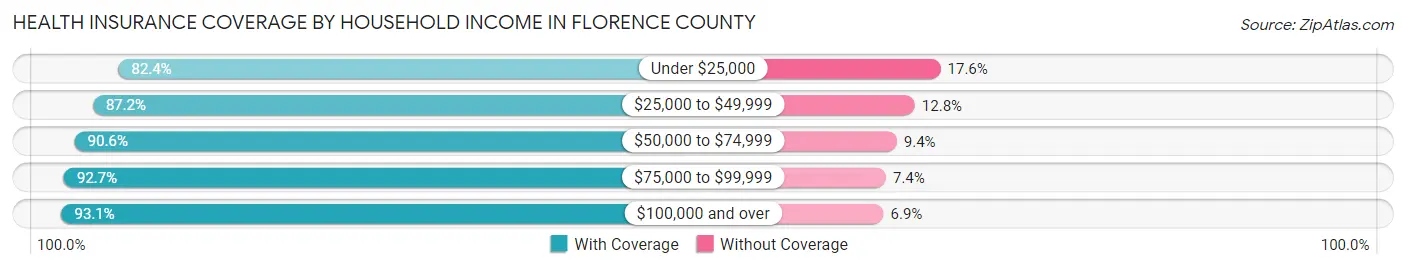
| Household Income | With Coverage | Without Coverage |
| Under $25,000 | 19,283 (82.4%) | 4,114 (17.6%) |
| $25,000 to $49,999 | 22,197 (87.2%) | 3,248 (12.8%) |
| $50,000 to $74,999 | 21,472 (90.6%) | 2,223 (9.4%) |
| $75,000 to $99,999 | 18,253 (92.6%) | 1,449 (7.3%) |
| $100,000 and over | 38,156 (93.1%) | 2,826 (6.9%) |
Public vs Private Health Insurance Coverage by Age in Florence County
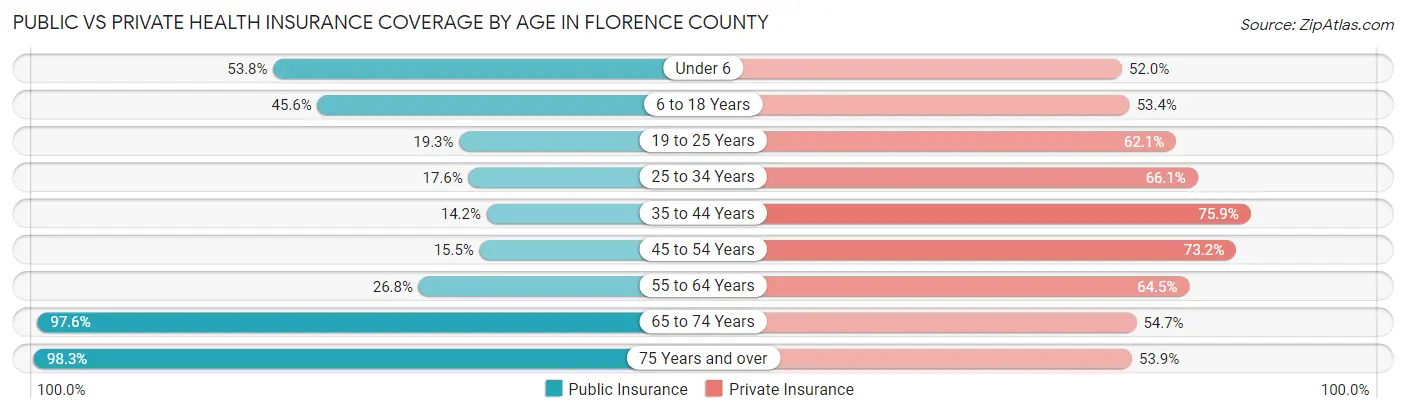
| Age Bracket | Public Insurance | Private Insurance |
| Under 6 | 5,457 (53.8%) | 5,274 (52.0%) |
| 6 to 18 Years | 10,831 (45.6%) | 12,687 (53.4%) |
| 19 to 25 Years | 2,304 (19.3%) | 7,409 (62.1%) |
| 25 to 34 Years | 2,684 (17.6%) | 10,074 (66.0%) |
| 35 to 44 Years | 2,342 (14.2%) | 12,508 (75.9%) |
| 45 to 54 Years | 2,626 (15.5%) | 12,373 (73.2%) |
| 55 to 64 Years | 4,667 (26.8%) | 11,219 (64.5%) |
| 65 to 74 Years | 13,841 (97.6%) | 7,753 (54.7%) |
| 75 Years and over | 8,818 (98.3%) | 4,835 (53.9%) |
| Total | 53,570 (39.7%) | 84,132 (62.3%) |
Disability Status by Sex by Age in Florence County
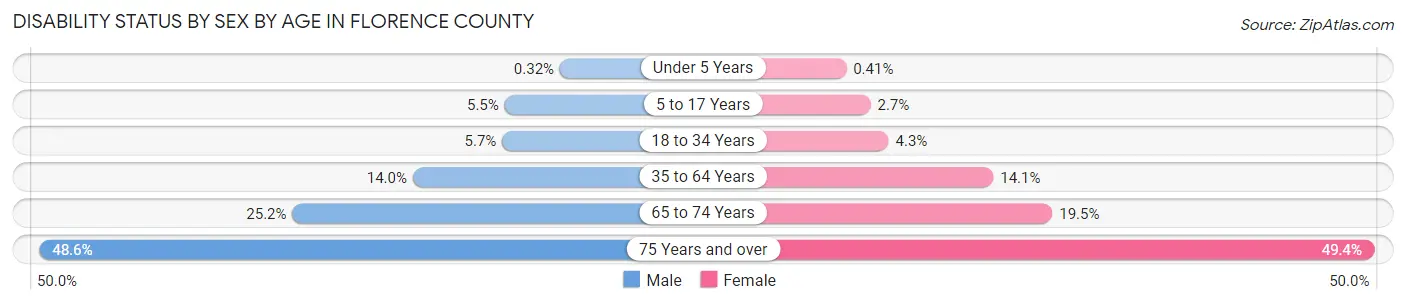
| Age Bracket | Male | Female |
| Under 5 Years | 13 (0.3%) | 16 (0.4%) |
| 5 to 17 Years | 671 (5.4%) | 317 (2.7%) |
| 18 to 34 Years | 769 (5.7%) | 667 (4.3%) |
| 35 to 64 Years | 3,281 (14.0%) | 3,838 (14.1%) |
| 65 to 74 Years | 1,593 (25.2%) | 1,532 (19.5%) |
| 75 Years and over | 1,721 (48.6%) | 2,683 (49.4%) |
Disability Class by Sex by Age in Florence County
Disability Class: Hearing Difficulty
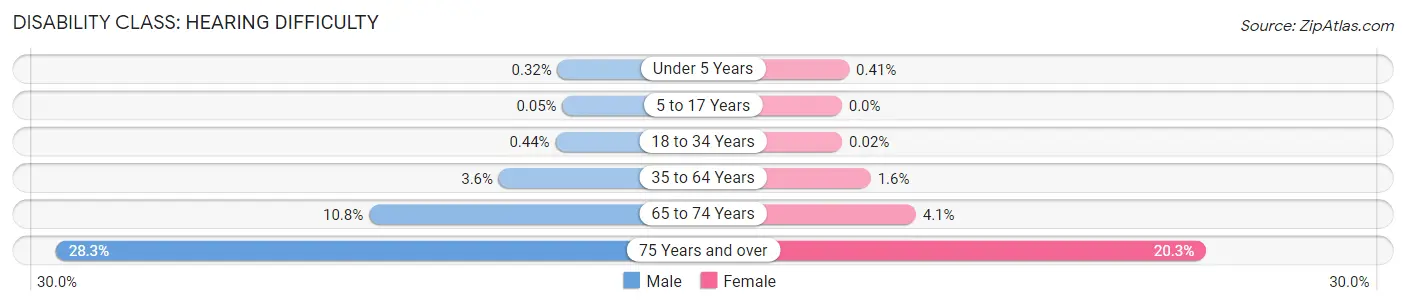
| Age Bracket | Male | Female |
| Under 5 Years | 13 (0.3%) | 16 (0.4%) |
| 5 to 17 Years | 6 (0.1%) | 0 (0.0%) |
| 18 to 34 Years | 60 (0.4%) | 3 (0.0%) |
| 35 to 64 Years | 844 (3.6%) | 440 (1.6%) |
| 65 to 74 Years | 685 (10.8%) | 323 (4.1%) |
| 75 Years and over | 1,000 (28.3%) | 1,102 (20.3%) |
Disability Class: Vision Difficulty
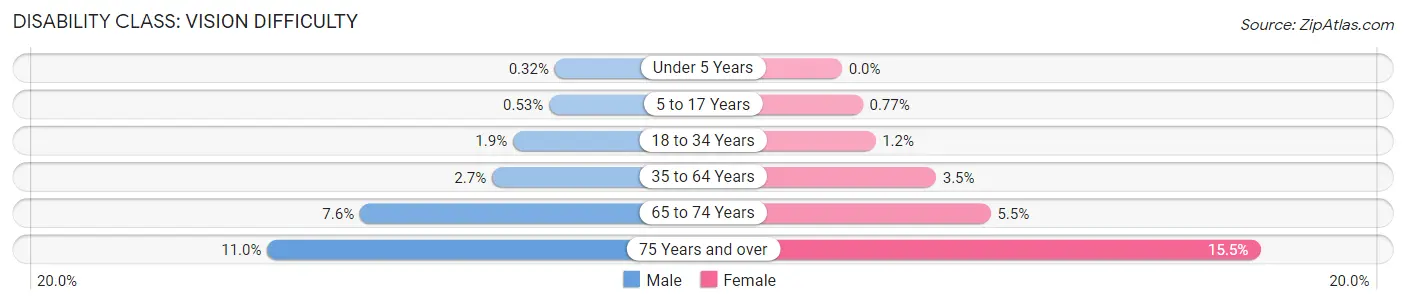
| Age Bracket | Male | Female |
| Under 5 Years | 13 (0.3%) | 0 (0.0%) |
| 5 to 17 Years | 65 (0.5%) | 91 (0.8%) |
| 18 to 34 Years | 253 (1.9%) | 190 (1.2%) |
| 35 to 64 Years | 623 (2.6%) | 952 (3.5%) |
| 65 to 74 Years | 478 (7.5%) | 433 (5.5%) |
| 75 Years and over | 389 (11.0%) | 844 (15.5%) |
Disability Class: Cognitive Difficulty
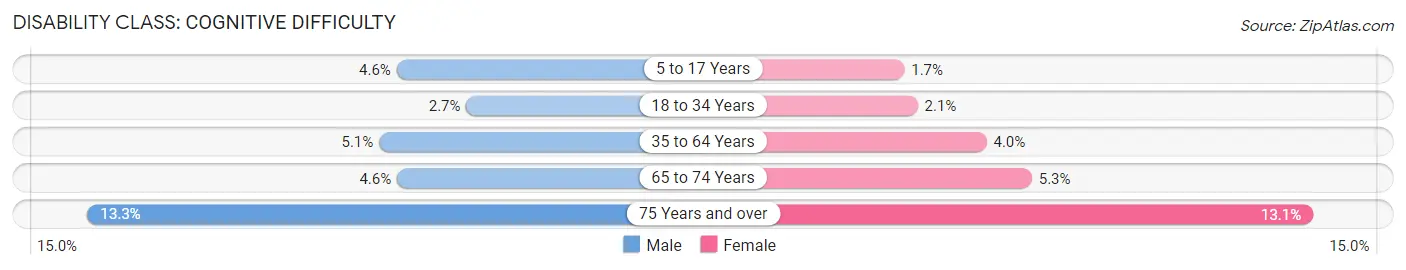
| Age Bracket | Male | Female |
| 5 to 17 Years | 571 (4.6%) | 206 (1.7%) |
| 18 to 34 Years | 366 (2.7%) | 324 (2.1%) |
| 35 to 64 Years | 1,205 (5.1%) | 1,101 (4.0%) |
| 65 to 74 Years | 293 (4.6%) | 415 (5.3%) |
| 75 Years and over | 469 (13.3%) | 713 (13.1%) |
Disability Class: Ambulatory Difficulty
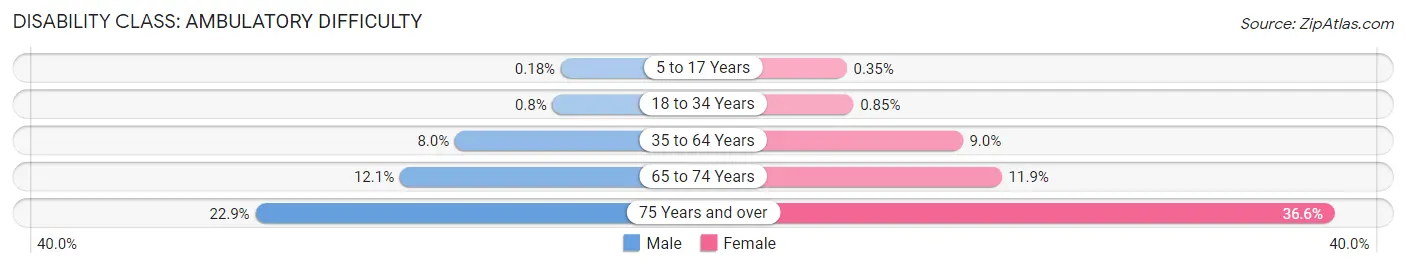
| Age Bracket | Male | Female |
| 5 to 17 Years | 22 (0.2%) | 42 (0.4%) |
| 18 to 34 Years | 108 (0.8%) | 131 (0.9%) |
| 35 to 64 Years | 1,887 (8.0%) | 2,446 (9.0%) |
| 65 to 74 Years | 768 (12.1%) | 931 (11.9%) |
| 75 Years and over | 809 (22.9%) | 1,989 (36.6%) |
Disability Class: Self-Care Difficulty
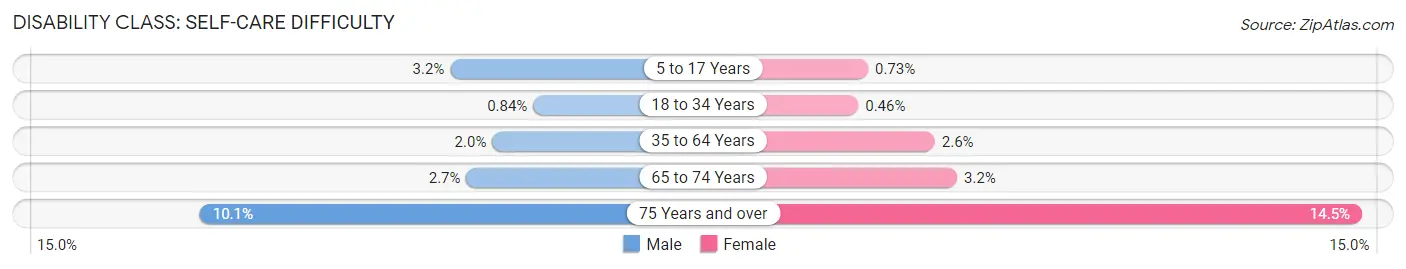
| Age Bracket | Male | Female |
| 5 to 17 Years | 388 (3.2%) | 86 (0.7%) |
| 18 to 34 Years | 113 (0.8%) | 71 (0.5%) |
| 35 to 64 Years | 466 (2.0%) | 708 (2.6%) |
| 65 to 74 Years | 171 (2.7%) | 252 (3.2%) |
| 75 Years and over | 358 (10.1%) | 787 (14.5%) |
Technology Access in Florence County
Computing Device Access in Florence County
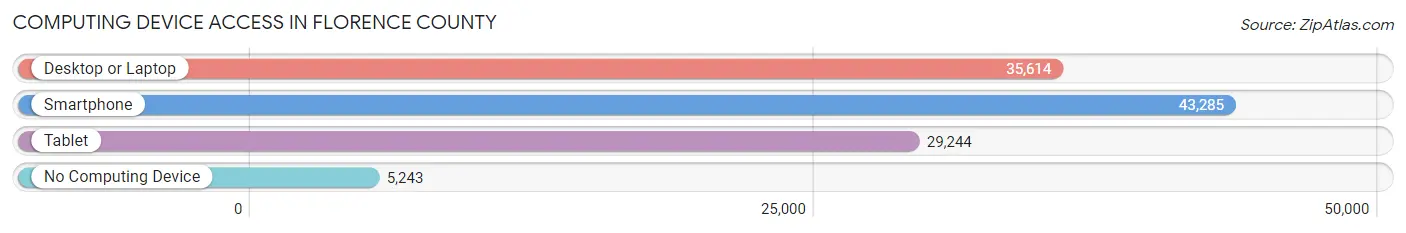
| Device Type | # Households | % Households |
| Desktop or Laptop | 35,614 | 68.2% |
| Smartphone | 43,285 | 82.9% |
| Tablet | 29,244 | 56.0% |
| No Computing Device | 5,243 | 10.0% |
| Total | 52,244 | 100.0% |
Internet Access in Florence County
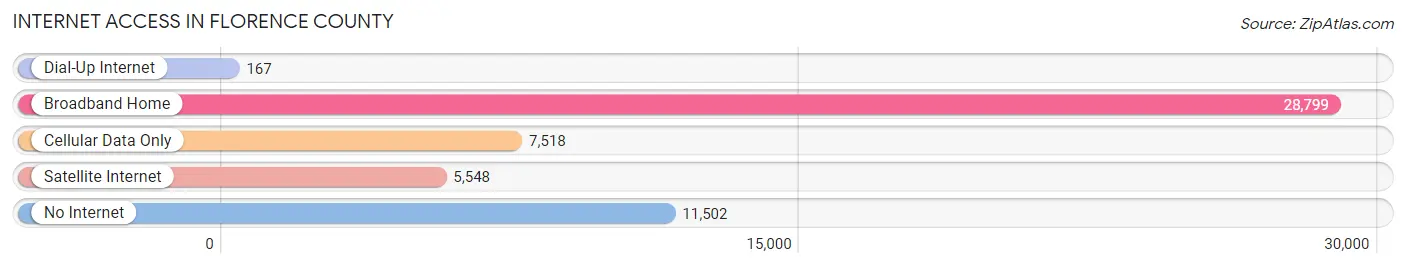
| Internet Type | # Households | % Households |
| Dial-Up Internet | 167 | 0.3% |
| Broadband Home | 28,799 | 55.1% |
| Cellular Data Only | 7,518 | 14.4% |
| Satellite Internet | 5,548 | 10.6% |
| No Internet | 11,502 | 22.0% |
| Total | 52,244 | 100.0% |
Florence County Summary
Florence County, South Carolina is located in the northeastern part of the state and is part of the Pee Dee region. It is bordered by Darlington County to the north, Marion County to the east, Dillon County to the south, and Williamsburg County to the west. The county seat is Florence, which is also the largest city in the county. The county was established in 1888 and named for General Francis Marion, a Revolutionary War hero.
Geography
Florence County covers an area of 845 square miles and is located in the Coastal Plain region of South Carolina. The terrain is mostly flat with some rolling hills. The county is drained by the Great Pee Dee River, which forms the western border of the county. Other major waterways include the Lynches River, Black Creek, and the Little Pee Dee River. The county is home to several state parks, including Lynches River County Park, Lake City County Park, and the Florence County Nature Preserve.
Demographics
As of the 2010 census, Florence County had a population of 136,885. The racial makeup of the county was 57.3% White, 37.7% African American, 0.4% Native American, 1.3% Asian, 0.1% Pacific Islander, 1.7% from other races, and 2.0% from two or more races. Hispanic or Latino of any race were 4.2% of the population.
The median household income in Florence County was $37,845 in 2019, and the median family income was $45,945. The per capita income was $20,945. About 17.3% of the population was below the poverty line.
Economy
Florence County is home to a diverse economy. The largest employers in the county are McLeod Regional Medical Center, the Florence County School District, and the City of Florence. Other major employers include the Florence County Sheriff's Office, the Florence County Library, and the Florence County Museum.
Agriculture is also an important part of the economy. The county is home to several large farms, including the Florence County Farm Bureau, which produces cotton, soybeans, corn, and wheat. Other agricultural products include poultry, eggs, and dairy products.
The county is also home to several manufacturing companies, including the Florence Manufacturing Company, which produces automotive parts, and the Florence Textile Company, which produces textiles. The county is also home to several retail stores, including Walmart, Target, and Lowe's.
Florence County is also home to several tourist attractions, including the Florence County Museum, the Florence County Library, and the Florence County Nature Preserve. The county is also home to several golf courses, including the Florence Country Club and the Florence Golf and Country Club.
Conclusion
Florence County, South Carolina is a diverse county located in the northeastern part of the state. It is home to a diverse economy, with major employers in healthcare, education, retail, agriculture, and manufacturing. The county is also home to several tourist attractions, including the Florence County Museum, the Florence County Library, and the Florence County Nature Preserve.
Common Questions
What is Per Capita Income in Florence County?
Per Capita income in Florence County is $30,733.
What is the Median Family Income in Florence County?
Median Family Income in Florence County is $73,657.
What is the Median Household income in Florence County?
Median Household Income in Florence County is $56,088.
What is Income or Wage Gap in Florence County?
Income or Wage Gap in Florence County is 28.9%.
Women in Florence County earn 71.1 cents for every dollar earned by a man.
What is Family Income Deficit in Florence County?
Family Income Deficit in Florence County is $11,637.
Families that are below poverty line in Florence County earn $11,637 less on average than the poverty threshold level.
What is Inequality or Gini Index in Florence County?
Inequality or Gini Index in Florence County is 0.48.
What is the Total Population of Florence County?
Total Population of Florence County is 137,015.
What is the Total Male Population of Florence County?
Total Male Population of Florence County is 64,679.
What is the Total Female Population of Florence County?
Total Female Population of Florence County is 72,336.
What is the Ratio of Males per 100 Females in Florence County?
There are 89.41 Males per 100 Females in Florence County.
What is the Ratio of Females per 100 Males in Florence County?
There are 111.84 Females per 100 Males in Florence County.
What is the Median Population Age in Florence County?
Median Population Age in Florence County is 39.0 Years.
What is the Average Family Size in Florence County
Average Family Size in Florence County is 3.3 People.
What is the Average Household Size in Florence County
Average Household Size in Florence County is 2.6 People.
How Large is the Labor Force in Florence County?
There are 63,374 People in the Labor Forcein in Florence County.
What is the Percentage of People in the Labor Force in Florence County?
58.3% of People are in the Labor Force in Florence County.
What is the Unemployment Rate in Florence County?
Unemployment Rate in Florence County is 4.5%.