Cities with the Lowest Percentage of Renter-Occupied Units in the United States
RELATED REPORTS & OPTIONS
Lowest Renter-Occupied
United States
Compare Cities
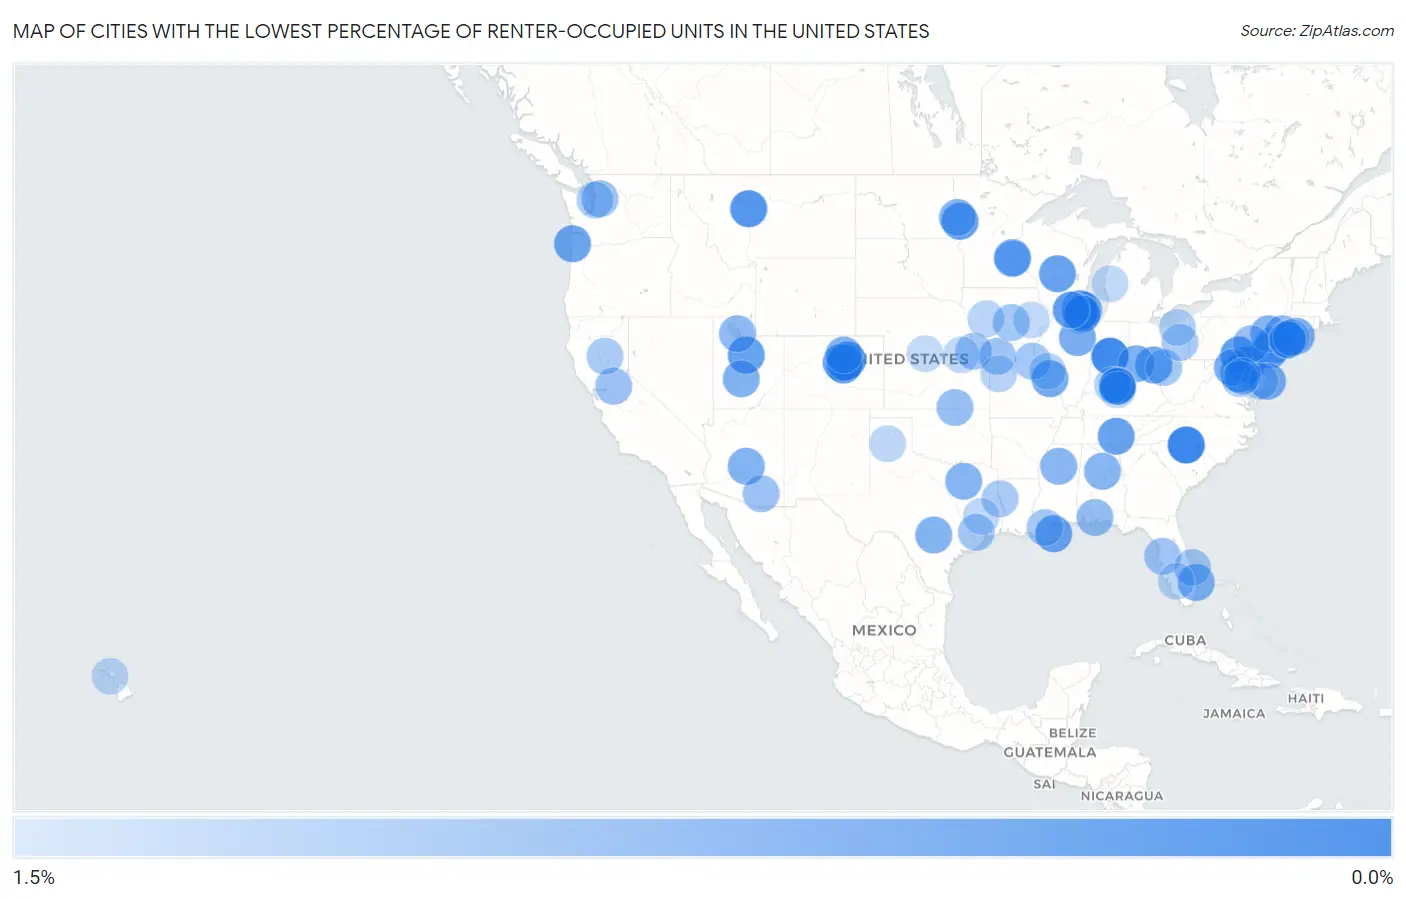
Map of Cities with the Lowest Percentage of Renter-Occupied Units in the United States
1.5%
0.0%
Cities with the Lowest Percentage of Renter-Occupied Units in the United States
| City | % Renter-Occupied | vs State | vs National | |
| 1. | Marvin | 0.11% | 33.8%(-33.7)#1 | 35.2%(-35.1)#1 |
| 2. | Meridian Hills | 0.15% | 29.9%(-29.7)#1 | 35.2%(-35.0)#2 |
| 3. | Watkins | 0.30% | 33.8%(-33.5)#1 | 35.2%(-34.9)#3 |
| 4. | Chevy Chase Section Three | 0.32% | 32.5%(-32.2)#1 | 35.2%(-34.9)#4 |
| 5. | Ulm | 0.33% | 31.0%(-30.6)#1 | 35.2%(-34.9)#5 |
| 6. | Hampton | 0.34% | 32.5%(-32.2)#2 | 35.2%(-34.8)#6 |
| 7. | Spring Grove | 0.38% | 33.3%(-32.9)#1 | 35.2%(-34.8)#7 |
| 8. | Columbine Valley | 0.42% | 33.8%(-33.4)#2 | 35.2%(-34.8)#8 |
| 9. | Castle Pines Village | 0.42% | 33.8%(-33.4)#3 | 35.2%(-34.8)#9 |
| 10. | Lake Meade | 0.46% | 30.8%(-30.4)#1 | 35.2%(-34.7)#10 |
| 11. | Sabin | 0.48% | 27.7%(-27.2)#1 | 35.2%(-34.7)#11 |
| 12. | Elk Ridge | 0.49% | 29.3%(-28.8)#1 | 35.2%(-34.7)#12 |
| 13. | Beersheba Springs | 0.52% | 32.9%(-32.4)#1 | 35.2%(-34.7)#13 |
| 14. | Lake Sherwood | 0.52% | 32.3%(-31.8)#1 | 35.2%(-34.7)#14 |
| 15. | Lafitte | 0.54% | 32.8%(-32.3)#1 | 35.2%(-34.6)#15 |
| 16. | South Barrington | 0.56% | 33.3%(-32.8)#2 | 35.2%(-34.6)#16 |
| 17. | Bayside Gardens | 0.56% | 36.8%(-36.2)#1 | 35.2%(-34.6)#17 |
| 18. | Andersonville | 0.58% | 33.2%(-32.6)#1 | 35.2%(-34.6)#18 |
| 19. | Weston | 0.58% | 36.1%(-35.6)#1 | 35.2%(-34.6)#19 |
| 20. | Woodside | 0.60% | 30.8%(-30.2)#2 | 35.2%(-34.6)#20 |
| 21. | Bellerive Acres | 0.63% | 32.4%(-31.8)#1 | 35.2%(-34.6)#21 |
| 22. | Third Lake | 0.65% | 33.3%(-32.7)#3 | 35.2%(-34.5)#22 |
| 23. | South Bethany | 0.66% | 28.0%(-27.4)#1 | 35.2%(-34.5)#23 |
| 24. | Belle Terre | 0.67% | 45.7%(-45.0)#1 | 35.2%(-34.5)#24 |
| 25. | Pine Springs | 0.68% | 27.7%(-27.0)#2 | 35.2%(-34.5)#25 |
| 26. | Creekside | 0.68% | 31.9%(-31.2)#1 | 35.2%(-34.5)#26 |
| 27. | Saunemin | 0.68% | 33.3%(-32.6)#4 | 35.2%(-34.5)#27 |
| 28. | Point Of Rocks | 0.69% | 32.5%(-31.8)#3 | 35.2%(-34.5)#28 |
| 29. | Roslyn Estates | 0.69% | 45.7%(-45.0)#2 | 35.2%(-34.5)#29 |
| 30. | Timberlane | 0.70% | 33.3%(-32.6)#5 | 35.2%(-34.5)#30 |
| 31. | Hunter | 0.72% | 33.2%(-32.5)#2 | 35.2%(-34.5)#31 |
| 32. | Foxfield | 0.73% | 33.8%(-33.1)#4 | 35.2%(-34.5)#32 |
| 33. | Rio Verde | 0.73% | 33.7%(-33.0)#1 | 35.2%(-34.5)#33 |
| 34. | Annabella | 0.74% | 29.3%(-28.5)#2 | 35.2%(-34.4)#34 |
| 35. | Lake Clarke Shores | 0.74% | 33.1%(-32.4)#1 | 35.2%(-34.4)#35 |
| 36. | Huntington | 0.75% | 27.3%(-26.6)#1 | 35.2%(-34.4)#36 |
| 37. | Hill Country Village | 0.75% | 37.6%(-36.9)#1 | 35.2%(-34.4)#37 |
| 38. | Pine Ridge | 0.76% | 30.8%(-30.0)#3 | 35.2%(-34.4)#38 |
| 39. | Sewell | 0.78% | 36.1%(-35.4)#2 | 35.2%(-34.4)#39 |
| 40. | Mclendon Chisholm | 0.78% | 37.6%(-36.8)#2 | 35.2%(-34.4)#40 |
| 41. | Todd Creek | 0.79% | 33.8%(-33.0)#5 | 35.2%(-34.4)#41 |
| 42. | Highland Lakes | 0.80% | 30.3%(-29.5)#1 | 35.2%(-34.4)#42 |
| 43. | Harwood | 0.81% | 36.8%(-36.0)#1 | 35.2%(-34.4)#43 |
| 44. | Mckinley | 0.82% | 30.8%(-30.0)#4 | 35.2%(-34.4)#44 |
| 45. | Elliott | 0.83% | 30.8%(-30.0)#1 | 35.2%(-34.4)#45 |
| 46. | Trout Valley | 0.85% | 33.3%(-32.5)#6 | 35.2%(-34.3)#46 |
| 47. | Hooper | 0.87% | 29.3%(-28.4)#3 | 35.2%(-34.3)#47 |
| 48. | West Nyack | 0.89% | 45.7%(-44.8)#3 | 35.2%(-34.3)#48 |
| 49. | Bancroft | 0.89% | 31.9%(-31.0)#2 | 35.2%(-34.3)#49 |
| 50. | Wallace | 0.90% | 33.1%(-32.2)#2 | 35.2%(-34.3)#50 |
| 51. | Fripp Island | 0.92% | 29.1%(-28.2)#1 | 35.2%(-34.3)#51 |
| 52. | Parkerfield | 0.95% | 33.1%(-32.2)#1 | 35.2%(-34.2)#52 |
| 53. | Brownsboro Farm | 0.95% | 31.9%(-30.9)#3 | 35.2%(-34.2)#53 |
| 54. | Roslyn Harbor | 0.97% | 45.7%(-44.7)#4 | 35.2%(-34.2)#54 |
| 55. | Lake Wynonah | 0.97% | 30.8%(-29.8)#5 | 35.2%(-34.2)#55 |
| 56. | Lake Carroll | 0.98% | 33.3%(-32.4)#7 | 35.2%(-34.2)#56 |
| 57. | Rincon Valley | 0.99% | 33.7%(-32.7)#2 | 35.2%(-34.2)#57 |
| 58. | Monroe North | 0.99% | 36.2%(-35.2)#1 | 35.2%(-34.2)#58 |
| 59. | Camanche Village | 1.00% | 44.4%(-43.4)#1 | 35.2%(-34.2)#59 |
| 60. | Lake Viking | 1.0% | 32.4%(-31.4)#2 | 35.2%(-34.2)#60 |
| 61. | Landfall | 1.0% | 27.7%(-26.6)#3 | 35.2%(-34.2)#61 |
| 62. | Connerton | 1.0% | 33.1%(-32.1)#3 | 35.2%(-34.1)#62 |
| 63. | Kildeer | 1.0% | 33.3%(-32.3)#8 | 35.2%(-34.1)#63 |
| 64. | Piney Point Village | 1.0% | 37.6%(-36.6)#3 | 35.2%(-34.1)#64 |
| 65. | East Williston | 1.1% | 45.7%(-44.7)#5 | 35.2%(-34.1)#65 |
| 66. | Lambs Grove | 1.1% | 28.5%(-27.4)#1 | 35.2%(-34.1)#66 |
| 67. | Rensselaer | 1.1% | 32.4%(-31.3)#3 | 35.2%(-34.1)#67 |
| 68. | Verdon | 1.1% | 33.5%(-32.4)#1 | 35.2%(-34.1)#68 |
| 69. | Stepping Stone | 1.1% | 33.8%(-32.8)#6 | 35.2%(-34.1)#69 |
| 70. | South Beach | 1.1% | 33.1%(-32.0)#4 | 35.2%(-34.1)#70 |
| 71. | Zaleski | 1.1% | 33.2%(-32.1)#3 | 35.2%(-34.1)#71 |
| 72. | Paulina | 1.1% | 32.8%(-31.7)#2 | 35.2%(-34.1)#72 |
| 73. | Forest Ranch | 1.1% | 44.4%(-43.3)#2 | 35.2%(-34.1)#73 |
| 74. | Lake Mohawk | 1.1% | 33.2%(-32.1)#4 | 35.2%(-34.1)#74 |
| 75. | Huntington Bay | 1.1% | 45.7%(-44.6)#6 | 35.2%(-34.1)#75 |
| 76. | Huxley | 1.1% | 37.6%(-36.5)#4 | 35.2%(-34.1)#76 |
| 77. | River Bluff | 1.2% | 31.9%(-30.7)#4 | 35.2%(-34.0)#77 |
| 78. | Bethel | 1.2% | 28.0%(-26.9)#2 | 35.2%(-34.0)#78 |
| 79. | Woodway | 1.2% | 36.2%(-35.0)#2 | 35.2%(-34.0)#79 |
| 80. | Accokeek | 1.2% | 32.5%(-31.3)#4 | 35.2%(-34.0)#80 |
| 81. | Mantoloking Borough | 1.2% | 36.1%(-34.9)#3 | 35.2%(-34.0)#81 |
| 82. | Queensland | 1.2% | 32.5%(-31.3)#5 | 35.2%(-34.0)#82 |
| 83. | Bentleyville | 1.2% | 33.2%(-32.0)#5 | 35.2%(-34.0)#83 |
| 84. | Galena | 1.2% | 29.9%(-28.7)#2 | 35.2%(-34.0)#84 |
| 85. | Lake Lafayette | 1.3% | 32.4%(-31.1)#4 | 35.2%(-33.9)#85 |
| 86. | Dedham | 1.3% | 28.5%(-27.2)#2 | 35.2%(-33.9)#86 |
| 87. | Fieldon | 1.3% | 33.3%(-32.1)#9 | 35.2%(-33.9)#87 |
| 88. | Bayfront | 1.3% | 32.3%(-31.1)#2 | 35.2%(-33.9)#88 |
| 89. | Crossgate | 1.3% | 31.9%(-30.6)#5 | 35.2%(-33.9)#89 |
| 90. | Poplar Grove | 1.3% | 33.3%(-32.0)#10 | 35.2%(-33.9)#90 |
| 91. | Fort Denaud | 1.3% | 33.1%(-31.8)#5 | 35.2%(-33.9)#91 |
| 92. | Lake Tanglewood | 1.3% | 37.6%(-36.3)#5 | 35.2%(-33.9)#92 |
| 93. | Point Blank | 1.3% | 37.6%(-36.3)#6 | 35.2%(-33.9)#93 |
| 94. | Makena | 1.3% | 38.2%(-36.9)#1 | 35.2%(-33.9)#94 |
| 95. | Shueyville | 1.3% | 28.5%(-27.2)#3 | 35.2%(-33.9)#95 |
| 96. | Walkerville | 1.3% | 27.5%(-26.2)#1 | 35.2%(-33.9)#96 |
| 97. | Oketo | 1.3% | 33.1%(-31.8)#2 | 35.2%(-33.9)#97 |
| 98. | Naponee | 1.4% | 33.5%(-32.1)#2 | 35.2%(-33.8)#98 |
| 99. | Willsboro Point | 1.4% | 45.7%(-44.4)#7 | 35.2%(-33.8)#99 |
| 100. | Heritage Creek | 1.4% | 31.9%(-30.5)#6 | 35.2%(-33.8)#100 |
Common Questions
What are the Top 10 Cities with the Lowest Percentage of Renter-Occupied Units in the United States?
Top 10 Cities with the Lowest Percentage of Renter-Occupied Units in the United States are:
#1
0.11%
#2
0.15%
#3
0.30%
#4
0.32%
#5
0.33%
#6
0.34%
#7
0.38%
#8
0.42%
#9
0.42%
#10
0.46%
What city has the Lowest Percentage of Renter-Occupied Units in the United States?
Marvin has the Lowest Percentage of Renter-Occupied Units in the United States with 0.11%.
What is the Percentage of Renter-Occupied Units in the United States?
Percentage of Renter-Occupied Units in the United States is 35.2%.