Cities with the Highest Percentage of Immigrants from Poland in the United States
RELATED REPORTS & OPTIONS
Poland
United States
Compare Cities
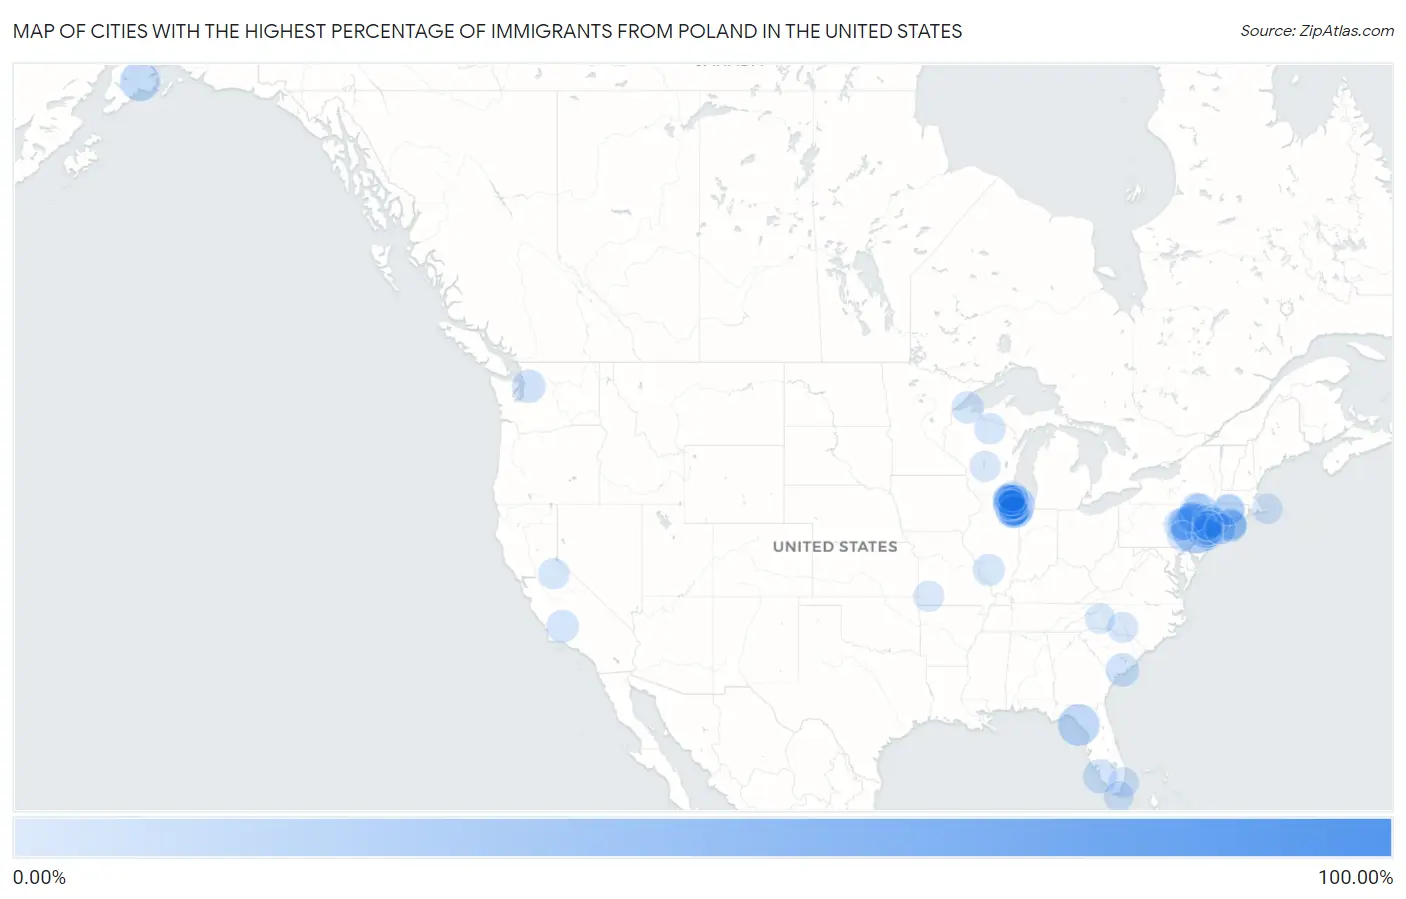
Map of Cities with the Highest Percentage of Immigrants from Poland in the United States
0.00%
100.00%
Cities with the Highest Percentage of Immigrants from Poland in the United States
| City | Poland | vs State | vs National | |
| 1. | Mogollon | 100.00% | 0.024%(+100.0)#1 | 0.12%(+99.9)#1 |
| 2. | Broadway | 32.43% | 0.53%(+31.9)#1 | 0.12%(+32.3)#2 |
| 3. | Wallington Borough | 24.82% | 0.53%(+24.3)#2 | 0.12%(+24.7)#3 |
| 4. | Horseshoe Beach | 20.51% | 0.12%(+20.4)#1 | 0.12%(+20.4)#4 |
| 5. | Primrose | 17.86% | 0.053%(+17.8)#1 | 0.12%(+17.7)#5 |
| 6. | Harwood Heights | 17.58% | 0.98%(+16.6)#1 | 0.12%(+17.5)#6 |
| 7. | Topstone | 15.73% | 0.60%(+15.1)#1 | 0.12%(+15.6)#7 |
| 8. | Norridge | 15.72% | 0.98%(+14.7)#2 | 0.12%(+15.6)#8 |
| 9. | Schiller Park | 14.78% | 0.98%(+13.8)#3 | 0.12%(+14.7)#9 |
| 10. | Justice | 12.96% | 0.98%(+12.0)#4 | 0.12%(+12.8)#10 |
| 11. | Towamensing Trails | 12.09% | 0.094%(+12.0)#1 | 0.12%(+12.0)#11 |
| 12. | Palos Hills | 11.68% | 0.98%(+10.7)#5 | 0.12%(+11.6)#12 |
| 13. | Garfield | 11.25% | 0.53%(+10.7)#3 | 0.12%(+11.1)#13 |
| 14. | Hickory Hills | 11.20% | 0.98%(+10.2)#6 | 0.12%(+11.1)#14 |
| 15. | River Grove | 11.18% | 0.98%(+10.2)#7 | 0.12%(+11.1)#15 |
| 16. | Smallwood | 10.21% | 0.33%(+9.88)#1 | 0.12%(+10.1)#16 |
| 17. | Richland | 10.04% | 0.53%(+9.51)#4 | 0.12%(+9.92)#17 |
| 18. | Wood Dale | 9.52% | 0.98%(+8.55)#8 | 0.12%(+9.40)#18 |
| 19. | Naples Park | 9.06% | 0.12%(+8.94)#2 | 0.12%(+8.93)#19 |
| 20. | Roselle | 8.85% | 0.98%(+7.87)#9 | 0.12%(+8.73)#20 |
| 21. | Elmwood Park | 8.55% | 0.98%(+7.57)#10 | 0.12%(+8.43)#21 |
| 22. | Burbank | 8.53% | 0.98%(+7.56)#11 | 0.12%(+8.41)#22 |
| 23. | Tavistock Borough | 8.33% | 0.53%(+7.81)#5 | 0.12%(+8.21)#23 |
| 24. | Bridgeview | 8.29% | 0.98%(+7.31)#12 | 0.12%(+8.17)#24 |
| 25. | Monroe North | 8.19% | 0.065%(+8.13)#1 | 0.12%(+8.07)#25 |
| 26. | Prospect Heights | 8.08% | 0.98%(+7.11)#13 | 0.12%(+7.96)#26 |
| 27. | Ravenel | 8.05% | 0.033%(+8.02)#1 | 0.12%(+7.92)#27 |
| 28. | Knollcrest | 7.95% | 0.60%(+7.35)#2 | 0.12%(+7.82)#28 |
| 29. | Lemont | 7.78% | 0.98%(+6.80)#14 | 0.12%(+7.66)#29 |
| 30. | Woodbourne | 7.26% | 0.33%(+6.94)#2 | 0.12%(+7.14)#30 |
| 31. | South Lincoln | 7.19% | 0.048%(+7.14)#1 | 0.12%(+7.07)#31 |
| 32. | Niles | 6.98% | 0.98%(+6.01)#15 | 0.12%(+6.86)#32 |
| 33. | Nuremberg | 6.72% | 0.094%(+6.62)#2 | 0.12%(+6.59)#33 |
| 34. | Shipshewana Lake | 6.56% | 0.044%(+6.52)#1 | 0.12%(+6.44)#34 |
| 35. | Harleigh | 6.51% | 0.094%(+6.41)#3 | 0.12%(+6.38)#35 |
| 36. | New Britain | 6.48% | 0.60%(+5.88)#3 | 0.12%(+6.36)#36 |
| 37. | Mckittrick | 6.45% | 0.053%(+6.40)#1 | 0.12%(+6.33)#37 |
| 38. | Finderne | 6.16% | 0.53%(+5.63)#6 | 0.12%(+6.03)#38 |
| 39. | Forest Lake | 6.10% | 0.98%(+5.13)#16 | 0.12%(+5.98)#39 |
| 40. | Barrington Hills | 5.89% | 0.98%(+4.91)#17 | 0.12%(+5.76)#40 |
| 41. | Cornucopia | 5.83% | 0.073%(+5.75)#1 | 0.12%(+5.70)#41 |
| 42. | Cape May Point Borough | 5.81% | 0.53%(+5.28)#7 | 0.12%(+5.68)#42 |
| 43. | Mount Prospect | 5.75% | 0.98%(+4.77)#18 | 0.12%(+5.62)#43 |
| 44. | Hortonville | 5.67% | 0.33%(+5.35)#3 | 0.12%(+5.55)#44 |
| 45. | Damiansville | 5.67% | 0.98%(+4.70)#19 | 0.12%(+5.55)#45 |
| 46. | Fieldsboro Borough | 5.60% | 0.53%(+5.07)#8 | 0.12%(+5.48)#46 |
| 47. | Sloatsburg | 5.23% | 0.33%(+4.91)#4 | 0.12%(+5.11)#47 |
| 48. | Homer Glen | 5.15% | 0.98%(+4.17)#20 | 0.12%(+5.03)#48 |
| 49. | Franklin Park | 5.14% | 0.98%(+4.16)#21 | 0.12%(+5.01)#49 |
| 50. | Itasca | 5.08% | 0.98%(+4.10)#22 | 0.12%(+4.96)#50 |
| 51. | Bedford Park | 5.01% | 0.98%(+4.03)#23 | 0.12%(+4.88)#51 |
| 52. | North Lindenhurst | 5.00% | 0.33%(+4.68)#5 | 0.12%(+4.88)#52 |
| 53. | Riverside | 4.99% | 0.33%(+4.67)#6 | 0.12%(+4.87)#53 |
| 54. | Jamesport | 4.90% | 0.33%(+4.57)#7 | 0.12%(+4.77)#54 |
| 55. | Bensenville | 4.87% | 0.98%(+3.89)#24 | 0.12%(+4.74)#55 |
| 56. | Quiogue | 4.83% | 0.33%(+4.50)#8 | 0.12%(+4.70)#56 |
| 57. | Trout Valley | 4.72% | 0.98%(+3.75)#25 | 0.12%(+4.60)#57 |
| 58. | Lake Tomahawk | 4.62% | 0.073%(+4.55)#2 | 0.12%(+4.50)#58 |
| 59. | Carlstadt Borough | 4.62% | 0.53%(+4.09)#9 | 0.12%(+4.50)#59 |
| 60. | Chicago Ridge | 4.61% | 0.98%(+3.63)#26 | 0.12%(+4.48)#60 |
| 61. | Harmonyville | 4.59% | 0.048%(+4.54)#2 | 0.12%(+4.46)#61 |
| 62. | Hartsdale | 4.54% | 0.33%(+4.22)#9 | 0.12%(+4.42)#62 |
| 63. | Brownville | 4.49% | 0.53%(+3.96)#10 | 0.12%(+4.37)#63 |
| 64. | Des Plaines | 4.44% | 0.98%(+3.46)#27 | 0.12%(+4.32)#64 |
| 65. | Dorrington | 4.42% | 0.053%(+4.36)#2 | 0.12%(+4.29)#65 |
| 66. | Elmwood Park Borough | 4.27% | 0.53%(+3.74)#11 | 0.12%(+4.14)#66 |
| 67. | Upper Greenwood Lake | 4.24% | 0.53%(+3.71)#12 | 0.12%(+4.12)#67 |
| 68. | Wallenpaupack Lake Estates | 4.19% | 0.094%(+4.09)#4 | 0.12%(+4.06)#68 |
| 69. | South Amboy | 4.17% | 0.53%(+3.64)#13 | 0.12%(+4.04)#69 |
| 70. | Aquadale | 4.16% | 0.034%(+4.12)#1 | 0.12%(+4.03)#70 |
| 71. | Holiday Hills | 4.14% | 0.98%(+3.17)#28 | 0.12%(+4.02)#71 |
| 72. | Linden | 4.14% | 0.53%(+3.61)#14 | 0.12%(+4.01)#72 |
| 73. | Wayne | 4.09% | 0.98%(+3.11)#29 | 0.12%(+3.97)#73 |
| 74. | Park Ridge | 4.06% | 0.98%(+3.08)#30 | 0.12%(+3.94)#74 |
| 75. | Marcy | 4.05% | 0.33%(+3.72)#10 | 0.12%(+3.92)#75 |
| 76. | Dellwood | 4.02% | 0.073%(+3.95)#3 | 0.12%(+3.90)#76 |
| 77. | East Rutherford Borough | 3.96% | 0.53%(+3.43)#15 | 0.12%(+3.84)#77 |
| 78. | Freistatt | 3.92% | 0.020%(+3.90)#1 | 0.12%(+3.80)#78 |
| 79. | Addison | 3.86% | 0.98%(+2.88)#31 | 0.12%(+3.73)#79 |
| 80. | Willow Springs | 3.80% | 0.98%(+2.83)#32 | 0.12%(+3.68)#80 |
| 81. | Pocono Springs | 3.76% | 0.094%(+3.66)#5 | 0.12%(+3.63)#81 |
| 82. | Palos Park | 3.74% | 0.98%(+2.77)#33 | 0.12%(+3.62)#82 |
| 83. | Bonnie Brae | 3.74% | 0.98%(+2.76)#34 | 0.12%(+3.61)#83 |
| 84. | Indian Creek | 3.70% | 0.12%(+3.59)#3 | 0.12%(+3.58)#84 |
| 85. | Elk Grove Village | 3.61% | 0.98%(+2.64)#35 | 0.12%(+3.49)#85 |
| 86. | West Wyomissing | 3.61% | 0.094%(+3.52)#6 | 0.12%(+3.49)#86 |
| 87. | Lindenhurst | 3.61% | 0.33%(+3.28)#11 | 0.12%(+3.48)#87 |
| 88. | Brewster | 3.45% | 0.16%(+3.29)#1 | 0.12%(+3.33)#88 |
| 89. | Clifton | 3.44% | 0.53%(+2.92)#16 | 0.12%(+3.32)#89 |
| 90. | Newington | 3.42% | 0.60%(+2.82)#4 | 0.12%(+3.30)#90 |
| 91. | Mettawa | 3.33% | 0.98%(+2.35)#36 | 0.12%(+3.20)#91 |
| 92. | Ardmore | 3.29% | 0.044%(+3.25)#2 | 0.12%(+3.17)#92 |
| 93. | Old Mill Creek | 3.28% | 0.98%(+2.30)#37 | 0.12%(+3.16)#93 |
| 94. | Glen Alpine | 3.27% | 0.034%(+3.24)#2 | 0.12%(+3.15)#94 |
| 95. | Ritchie | 3.25% | 0.98%(+2.27)#38 | 0.12%(+3.12)#95 |
| 96. | Lake Barrington | 3.24% | 0.98%(+2.26)#39 | 0.12%(+3.11)#96 |
| 97. | Tavernier | 3.23% | 0.12%(+3.11)#4 | 0.12%(+3.11)#97 |
| 98. | Singac | 3.20% | 0.53%(+2.67)#17 | 0.12%(+3.07)#98 |
| 99. | Bloomingdale | 3.19% | 0.98%(+2.22)#40 | 0.12%(+3.07)#99 |
| 100. | Macopin | 3.17% | 0.53%(+2.65)#18 | 0.12%(+3.05)#100 |
Common Questions
What are the Top 10 Cities with the Highest Percentage of Immigrants from Poland in the United States?
Top 10 Cities with the Highest Percentage of Immigrants from Poland in the United States are:
#1
32.43%
#2
20.51%
#3
17.86%
#4
17.58%
#5
15.72%
#6
14.78%
#7
12.96%
#8
12.09%
#9
11.68%
#10
11.25%
What city has the Highest Percentage of Immigrants from Poland in the United States?
Broadway has the Highest Percentage of Immigrants from Poland in the United States with 32.43%.
What is the Percentage of Immigrants from Poland in the United States?
Percentage of Immigrants from Poland in the United States is 0.12%.