Cities with the Highest Percentage of Immigrants from Singapore in the United States
RELATED REPORTS & OPTIONS
Singapore
United States
Compare Cities
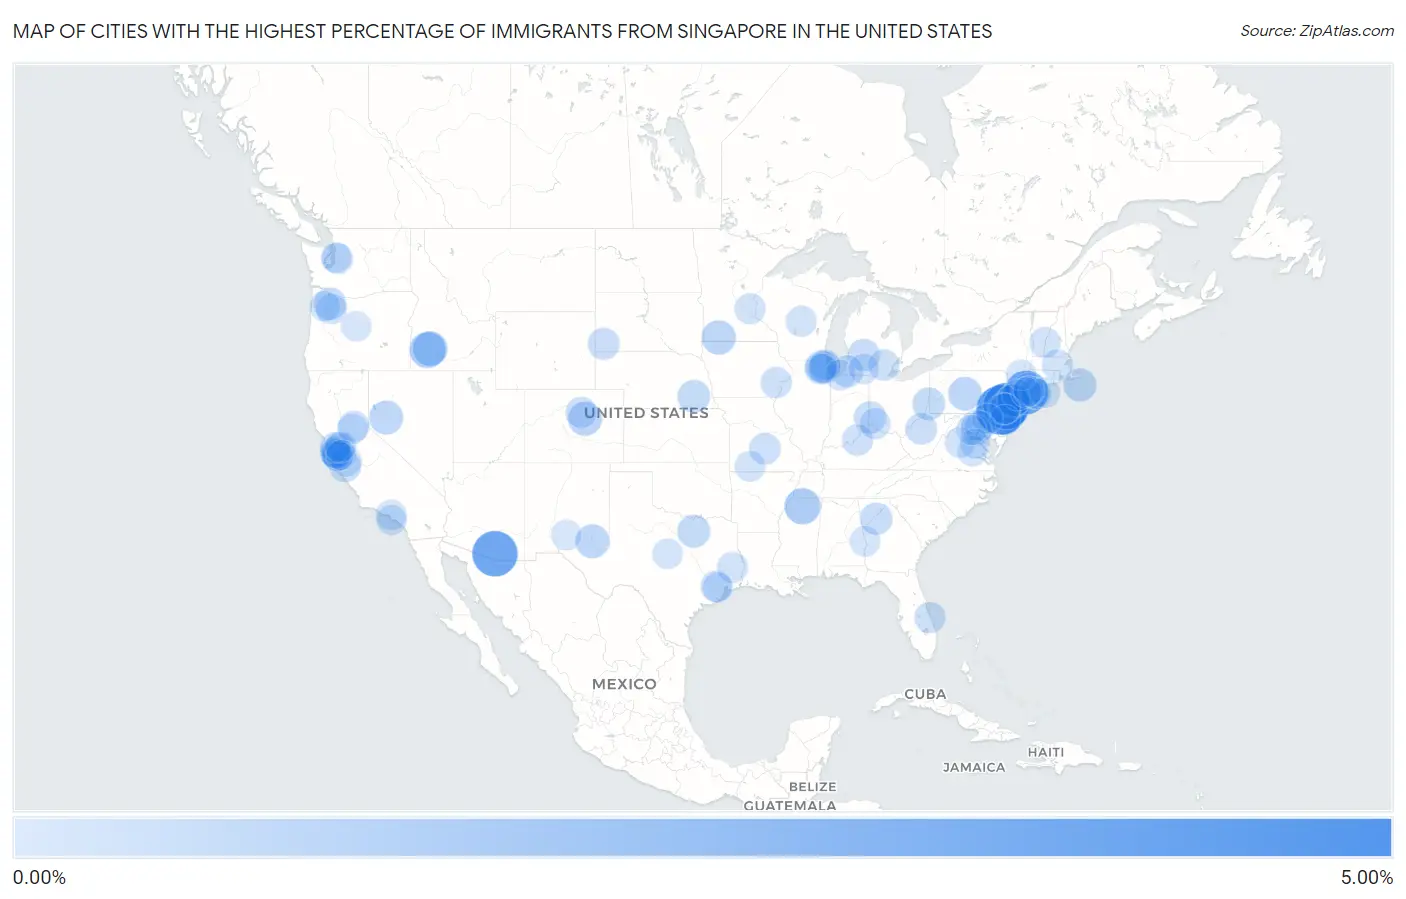
Map of Cities with the Highest Percentage of Immigrants from Singapore in the United States
0.00%
5.00%
Cities with the Highest Percentage of Immigrants from Singapore in the United States
| City | Singapore | vs State | vs National | |
| 1. | Cheyney University | 4.61% | 0.0064%(+4.60)#2 | 0.011%(+4.59)#242 |
| 2. | Arcadia University | 3.87% | 0.0064%(+3.86)#3 | 0.011%(+3.86)#243 |
| 3. | Arivaca Junction | 3.63% | 0.011%(+3.62)#-1 | 0.011%(+3.62)#244 |
| 4. | Port Washington North | 3.22% | 0.019%(+3.20)#-1 | 0.011%(+3.21)#245 |
| 5. | Abbeville | 1.52% | 0.0013%(+1.52)#-1 | 0.011%(+1.51)#246 |
| 6. | Mountain Home Afb | 1.48% | 0.018%(+1.46)#21 | 0.011%(+1.47)#4,770 |
| 7. | Mountain Home | 1.25% | 0.018%(+1.23)#22 | 0.011%(+1.24)#4,771 |
| 8. | Okabena | 1.11% | 0.0033%(+1.11)#-1 | 0.011%(+1.10)#4,772 |
| 9. | The Pinery | 1.07% | 0.0098%(+1.06)#-1 | 0.011%(+1.06)#4,773 |
| 10. | La Huerta | 1.02% | 0.0018%(+1.02)#-1 | 0.011%(+1.01)#4,774 |
| 11. | Fallon | 1.02% | 0.019%(+0.998)#16 | 0.011%(+1.01)#4,775 |
| 12. | Stormstown | 0.97% | 0.0064%(+0.968)#4 | 0.011%(+0.963)#4,776 |
| 13. | Princeton | 0.95% | 0.016%(+0.930)#222 | 0.011%(+0.935)#4,777 |
| 14. | Siasconset | 0.87% | 0.021%(+0.848)#-1 | 0.011%(+0.859)#4,778 |
| 15. | Brooklawn Borough | 0.84% | 0.016%(+0.829)#223 | 0.011%(+0.834)#4,779 |
| 16. | Copper Canyon | 0.80% | 0.010%(+0.790)#-1 | 0.011%(+0.789)#4,780 |
| 17. | Brilliant | 0.75% | 0.0047%(+0.744)#-1 | 0.011%(+0.738)#4,781 |
| 18. | Belle Mead | 0.73% | 0.016%(+0.717)#224 | 0.011%(+0.722)#4,782 |
| 19. | Dorchester | 0.73% | 0.00020%(+0.731)#-1 | 0.011%(+0.721)#4,783 |
| 20. | Rivergrove | 0.72% | 0.017%(+0.700)#-1 | 0.011%(+0.706)#4,784 |
| 21. | Lake Odessa | 0.66% | 0.0046%(+0.653)#-1 | 0.011%(+0.647)#4,785 |
| 22. | Avondale Estates | 0.66% | 0.0097%(+0.646)#-1 | 0.011%(+0.645)#4,786 |
| 23. | Oxford | 0.63% | 0.0047%(+0.621)#160 | 0.011%(+0.615)#5,571 |
| 24. | Haverford College | 0.62% | 0.0064%(+0.609)#112 | 0.011%(+0.604)#5,572 |
| 25. | Berrien Springs | 0.59% | 0.0046%(+0.589)#84 | 0.011%(+0.583)#5,573 |
| 26. | Strawberry Cdp Marin County | 0.59% | 0.026%(+0.560)#581 | 0.011%(+0.575)#5,574 |
| 27. | Hot Springs | 0.58% | 0.0022%(+0.575)#-1 | 0.011%(+0.566)#5,575 |
| 28. | Prunedale | 0.57% | 0.026%(+0.542)#582 | 0.011%(+0.557)#5,576 |
| 29. | Bannockburn | 0.56% | 0.0092%(+0.554)#-1 | 0.011%(+0.553)#5,577 |
| 30. | North Barrington | 0.55% | 0.0092%(+0.536)#353 | 0.011%(+0.534)#5,993 |
| 31. | Grantsville | 0.54% | 0.0016%(+0.538)#-1 | 0.011%(+0.528)#5,994 |
| 32. | Atherton | 0.53% | 0.026%(+0.507)#583 | 0.011%(+0.523)#5,995 |
| 33. | Fort Leonard Wood | 0.53% | 0.0023%(+0.523)#31 | 0.011%(+0.514)#5,996 |
| 34. | Tenafly Borough | 0.52% | 0.016%(+0.507)#225 | 0.011%(+0.512)#5,997 |
| 35. | Riverside | 0.51% | 0.0075%(+0.498)#20 | 0.011%(+0.495)#5,998 |
| 36. | Floyds Knobs | 0.48% | 0.0061%(+0.475)#37 | 0.011%(+0.470)#5,999 |
| 37. | St. John Fisher College | 0.47% | 0.019%(+0.451)#0 | 0.011%(+0.460)#6,000 |
| 38. | Troutville Borough | 0.46% | 0.0064%(+0.452)#113 | 0.011%(+0.448)#6,001 |
| 39. | Barton Hills | 0.45% | 0.0046%(+0.446)#85 | 0.011%(+0.440)#6,002 |
| 40. | Micco | 0.45% | 0.0056%(+0.442)#-1 | 0.011%(+0.437)#6,003 |
| 41. | Amherst | 0.44% | 0.021%(+0.419)#49 | 0.011%(+0.430)#6,004 |
| 42. | Mountain View | 0.44% | 0.0098%(+0.430)#0 | 0.011%(+0.429)#6,005 |
| 43. | Pepperdine University | 0.44% | 0.026%(+0.412)#666 | 0.011%(+0.427)#6,006 |
| 44. | Meadow Vale | 0.43% | 0.0025%(+0.431)#1 | 0.011%(+0.423)#6,007 |
| 45. | Conesville | 0.43% | 0.0046%(+0.424)#-1 | 0.011%(+0.418)#6,008 |
| 46. | Spring Valley Village | 0.43% | 0.010%(+0.416)#0 | 0.011%(+0.416)#6,009 |
| 47. | Park Ridge | 0.42% | 0.0027%(+0.415)#-1 | 0.011%(+0.407)#6,010 |
| 48. | Cordaville | 0.42% | 0.021%(+0.395)#50 | 0.011%(+0.405)#6,011 |
| 49. | Foster City | 0.42% | 0.026%(+0.390)#667 | 0.011%(+0.405)#6,012 |
| 50. | Colmesneil | 0.41% | 0.010%(+0.402)#1 | 0.011%(+0.401)#6,013 |
| 51. | West Menlo Park | 0.41% | 0.026%(+0.386)#668 | 0.011%(+0.401)#6,014 |
| 52. | Lexington | 0.41% | 0.0033%(+0.405)#0 | 0.011%(+0.398)#6,015 |
| 53. | Lake Of The Pines | 0.40% | 0.026%(+0.378)#669 | 0.011%(+0.393)#6,016 |
| 54. | Short Hills | 0.40% | 0.016%(+0.385)#285 | 0.011%(+0.391)#6,017 |
| 55. | Noroton Heights | 0.40% | 0.0075%(+0.392)#21 | 0.011%(+0.388)#6,018 |
| 56. | The Village Of Indian Hill | 0.40% | 0.0047%(+0.392)#161 | 0.011%(+0.386)#6,019 |
| 57. | Beaux Arts Village | 0.39% | 0.022%(+0.366)#-1 | 0.011%(+0.377)#6,020 |
| 58. | East Dundee | 0.38% | 0.0092%(+0.371)#354 | 0.011%(+0.369)#6,021 |
| 59. | Windsor | 0.37% | 0.0050%(+0.369)#-1 | 0.011%(+0.363)#6,022 |
| 60. | Mantua | 0.37% | 0.0082%(+0.364)#-1 | 0.011%(+0.361)#6,023 |
| 61. | Lake Bluff | 0.37% | 0.0092%(+0.363)#355 | 0.011%(+0.361)#6,024 |
| 62. | Molalla | 0.35% | 0.017%(+0.338)#0 | 0.011%(+0.344)#6,025 |
| 63. | Darnestown | 0.34% | 0.011%(+0.333)#92 | 0.011%(+0.334)#6,026 |
| 64. | Hillandale | 0.34% | 0.011%(+0.328)#93 | 0.011%(+0.329)#6,027 |
| 65. | Long Beach | 0.34% | 0.0061%(+0.332)#38 | 0.011%(+0.327)#6,028 |
| 66. | San Martin | 0.33% | 0.026%(+0.308)#732 | 0.011%(+0.323)#6,202 |
| 67. | Hauppauge | 0.33% | 0.019%(+0.314)#1 | 0.011%(+0.323)#6,203 |
| 68. | Ladera Heights | 0.33% | 0.026%(+0.302)#733 | 0.011%(+0.317)#6,204 |
| 69. | Blue Point | 0.32% | 0.019%(+0.306)#2 | 0.011%(+0.314)#6,205 |
| 70. | Ladonia | 0.32% | 0.0029%(+0.320)#-1 | 0.011%(+0.312)#6,206 |
| 71. | Fairton | 0.32% | 0.016%(+0.307)#286 | 0.011%(+0.312)#6,207 |
| 72. | Hillsborough | 0.32% | 0.026%(+0.294)#734 | 0.011%(+0.309)#6,208 |
| 73. | Saddlebrooke | 0.32% | 0.0023%(+0.316)#32 | 0.011%(+0.308)#6,209 |
| 74. | Perry Hall | 0.31% | 0.011%(+0.303)#94 | 0.011%(+0.304)#6,210 |
| 75. | Penn Wynne | 0.31% | 0.0064%(+0.304)#218 | 0.011%(+0.299)#6,211 |
| 76. | Hollymead | 0.31% | 0.0082%(+0.301)#197 | 0.011%(+0.298)#6,942 |
| 77. | Clayton | 0.31% | 0.026%(+0.281)#735 | 0.011%(+0.296)#6,943 |
| 78. | Glen Allen | 0.30% | 0.0082%(+0.287)#198 | 0.011%(+0.285)#6,944 |
| 79. | Palo Alto | 0.29% | 0.026%(+0.269)#736 | 0.011%(+0.284)#6,945 |
| 80. | Southampton | 0.29% | 0.019%(+0.271)#100 | 0.011%(+0.279)#6,946 |
| 81. | Early | 0.29% | 0.010%(+0.279)#2 | 0.011%(+0.278)#6,947 |
| 82. | San Carlos | 0.29% | 0.026%(+0.259)#737 | 0.011%(+0.275)#6,948 |
| 83. | Albany | 0.28% | 0.026%(+0.259)#738 | 0.011%(+0.274)#6,949 |
| 84. | New Paltz | 0.28% | 0.019%(+0.265)#379 | 0.011%(+0.274)#7,120 |
| 85. | Dundee | 0.28% | 0.017%(+0.263)#1 | 0.011%(+0.268)#7,121 |
| 86. | Union City | 0.27% | 0.0046%(+0.269)#86 | 0.011%(+0.263)#7,122 |
| 87. | Alamo | 0.27% | 0.026%(+0.246)#739 | 0.011%(+0.261)#7,123 |
| 88. | Mill Neck | 0.27% | 0.019%(+0.251)#380 | 0.011%(+0.260)#7,124 |
| 89. | Rancho Palos Verdes | 0.27% | 0.026%(+0.244)#740 | 0.011%(+0.260)#7,125 |
| 90. | Auburn | 0.27% | 0.026%(+0.243)#741 | 0.011%(+0.258)#7,126 |
| 91. | Kings Point | 0.27% | 0.019%(+0.249)#381 | 0.011%(+0.257)#7,127 |
| 92. | Rolling Meadows | 0.27% | 0.0092%(+0.257)#356 | 0.011%(+0.255)#7,128 |
| 93. | Prineville | 0.27% | 0.017%(+0.249)#105 | 0.011%(+0.255)#7,129 |
| 94. | Holloman Afb | 0.26% | 0.0018%(+0.261)#26 | 0.011%(+0.252)#7,130 |
| 95. | Southside Place | 0.26% | 0.010%(+0.250)#68 | 0.011%(+0.250)#7,131 |
| 96. | Bowling Green | 0.26% | 0.0082%(+0.252)#199 | 0.011%(+0.249)#7,132 |
| 97. | Clyde Hill | 0.26% | 0.022%(+0.236)#21 | 0.011%(+0.247)#7,133 |
| 98. | Menlo Park Terrace | 0.26% | 0.016%(+0.241)#287 | 0.011%(+0.246)#7,134 |
| 99. | Haymarket | 0.25% | 0.0082%(+0.246)#200 | 0.011%(+0.244)#7,135 |
| 100. | Milpitas | 0.25% | 0.026%(+0.228)#742 | 0.011%(+0.243)#7,136 |
Common Questions
What are the Top 10 Cities with the Highest Percentage of Immigrants from Singapore in the United States?
Top 10 Cities with the Highest Percentage of Immigrants from Singapore in the United States are:
#1
4.61%
#2
3.87%
#3
3.63%
#4
3.22%
#5
1.52%
#6
1.48%
#7
1.25%
#8
1.11%
#9
1.07%
#10
1.02%
What city has the Highest Percentage of Immigrants from Singapore in the United States?
Cheyney University has the Highest Percentage of Immigrants from Singapore in the United States with 4.61%.
What is the Percentage of Immigrants from Singapore in the United States?
Percentage of Immigrants from Singapore in the United States is 0.011%.