Cities with the Highest Percentage of Asian Population in the United States
RELATED REPORTS & OPTIONS
Asian
United States
Compare Cities
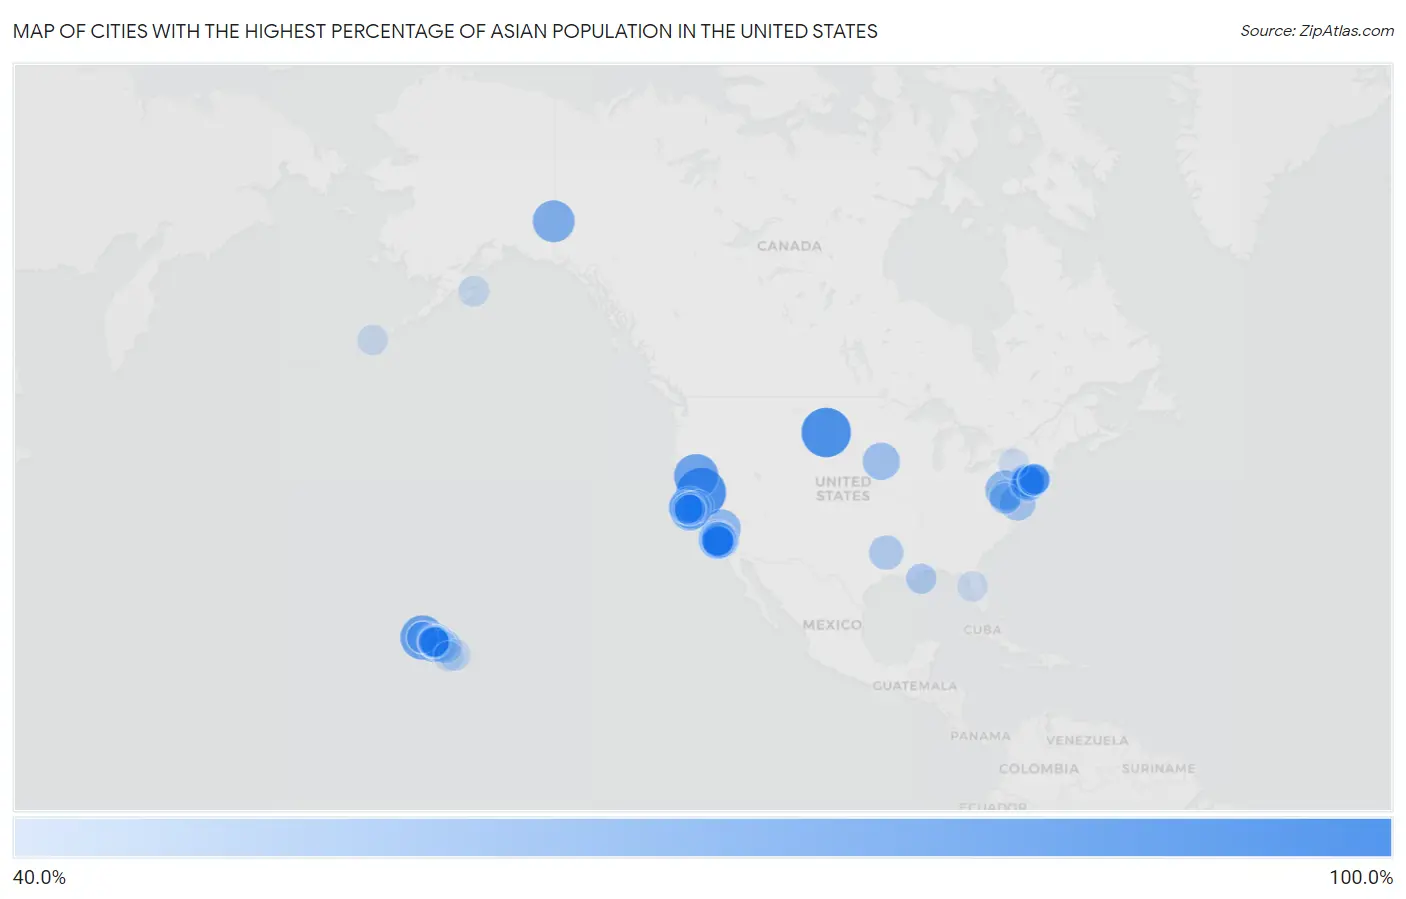
Map of Cities with the Highest Percentage of Asian Population in the United States
0.0%
100.0%
Cities with the Highest Percentage of Asian Population in the United States
| City | Asian | vs State | vs National | |
| 1. | Soda Springs | 100.0% | 15.1%(+84.9)#1 | 5.8%(+94.2)#1 |
| 2. | Prairie City | 100.0% | 1.4%(+98.6)#1 | 5.8%(+94.2)#2 |
| 3. | Nubieber | 85.7% | 15.1%(+70.6)#2 | 5.8%(+79.9)#3 |
| 4. | Kaumakani | 85.1% | 37.2%(+48.0)#1 | 5.8%(+79.3)#4 |
| 5. | Eagle Lake | 81.0% | 5.8%(+75.2)#1 | 5.8%(+75.3)#5 |
| 6. | Norris Canyon | 79.1% | 15.1%(+64.0)#3 | 5.8%(+73.4)#6 |
| 7. | Alcan Border | 78.1% | 6.5%(+71.6)#1 | 5.8%(+72.3)#7 |
| 8. | Monroe Manor | 75.5% | 9.9%(+65.6)#1 | 5.8%(+69.7)#8 |
| 9. | Cearfoss | 70.7% | 6.5%(+64.3)#1 | 5.8%(+65.0)#9 |
| 10. | Forsgate | 70.5% | 9.9%(+60.6)#2 | 5.8%(+64.7)#10 |
| 11. | Johannesburg | 70.2% | 15.1%(+55.1)#4 | 5.8%(+64.4)#11 |
| 12. | Ewa Villages | 70.2% | 37.2%(+33.0)#2 | 5.8%(+64.4)#12 |
| 13. | Cupertino | 70.2% | 15.1%(+55.0)#5 | 5.8%(+64.4)#13 |
| 14. | Milpitas | 69.9% | 15.1%(+54.8)#6 | 5.8%(+64.1)#14 |
| 15. | South San Gabriel | 69.5% | 15.1%(+54.3)#7 | 5.8%(+63.7)#15 |
| 16. | Deans | 69.3% | 9.9%(+59.4)#3 | 5.8%(+63.5)#16 |
| 17. | San Marino | 68.5% | 15.1%(+53.3)#8 | 5.8%(+62.7)#17 |
| 18. | Mongaup Valley | 67.5% | 8.8%(+58.6)#1 | 5.8%(+61.7)#18 |
| 19. | Waipahu | 67.2% | 37.2%(+30.1)#3 | 5.8%(+61.5)#19 |
| 20. | Walnut | 65.9% | 15.1%(+50.8)#9 | 5.8%(+60.1)#20 |
| 21. | Temple City | 65.5% | 15.1%(+50.4)#10 | 5.8%(+59.7)#21 |
| 22. | Truesdale | 65.2% | 2.5%(+62.8)#1 | 5.8%(+59.5)#22 |
| 23. | Monterey Park | 64.8% | 15.1%(+49.7)#11 | 5.8%(+59.0)#23 |
| 24. | Rosemead | 63.4% | 15.1%(+48.2)#12 | 5.8%(+57.6)#24 |
| 25. | Belle Mead | 63.1% | 9.9%(+53.2)#4 | 5.8%(+57.3)#25 |
| 26. | Ten Mile Run | 63.1% | 9.9%(+53.2)#5 | 5.8%(+57.3)#26 |
| 27. | Palisades Park Borough | 62.7% | 9.9%(+52.8)#6 | 5.8%(+56.9)#27 |
| 28. | Camino Tassajara | 62.3% | 15.1%(+47.2)#13 | 5.8%(+56.6)#28 |
| 29. | Bivalve | 62.3% | 6.5%(+55.8)#2 | 5.8%(+56.5)#29 |
| 30. | Princeton Meadows | 62.1% | 9.9%(+52.2)#7 | 5.8%(+56.3)#30 |
| 31. | Fremont | 61.8% | 15.1%(+46.7)#14 | 5.8%(+56.0)#31 |
| 32. | Cerritos | 60.7% | 15.1%(+45.5)#15 | 5.8%(+54.9)#32 |
| 33. | Rowland Heights | 60.5% | 15.1%(+45.3)#16 | 5.8%(+54.7)#33 |
| 34. | Marley | 60.0% | 5.8%(+54.2)#2 | 5.8%(+54.2)#34 |
| 35. | San Gabriel | 59.4% | 15.1%(+44.3)#17 | 5.8%(+53.7)#35 |
| 36. | Diamond Bar | 59.4% | 15.1%(+44.3)#18 | 5.8%(+53.6)#36 |
| 37. | Daly City | 58.9% | 15.1%(+43.8)#19 | 5.8%(+53.1)#37 |
| 38. | Waipio | 58.8% | 37.2%(+21.7)#4 | 5.8%(+53.1)#38 |
| 39. | Millbourne Borough | 58.4% | 3.6%(+54.7)#1 | 5.8%(+52.6)#39 |
| 40. | Sully Square | 58.1% | 6.9%(+51.2)#1 | 5.8%(+52.3)#40 |
| 41. | Royal Kunia | 57.9% | 37.2%(+20.7)#5 | 5.8%(+52.1)#41 |
| 42. | Nesbitt | 57.6% | 5.2%(+52.5)#1 | 5.8%(+51.8)#42 |
| 43. | Arcadia | 57.1% | 15.1%(+42.0)#20 | 5.8%(+51.4)#43 |
| 44. | Dayton | 56.0% | 9.9%(+46.1)#8 | 5.8%(+50.2)#44 |
| 45. | Loudoun Valley Estates | 55.9% | 6.9%(+49.0)#2 | 5.8%(+50.1)#45 |
| 46. | Union City | 55.8% | 15.1%(+40.7)#21 | 5.8%(+50.1)#46 |
| 47. | Kingsbury Colony | 55.6% | 0.84%(+54.7)#1 | 5.8%(+49.8)#47 |
| 48. | Saratoga | 55.5% | 15.1%(+40.4)#22 | 5.8%(+49.7)#48 |
| 49. | Harlingen | 55.2% | 9.9%(+45.4)#9 | 5.8%(+49.5)#49 |
| 50. | Whitmore Village | 55.1% | 37.2%(+17.9)#6 | 5.8%(+49.3)#50 |
| 51. | Monmouth Junction | 54.9% | 9.9%(+45.0)#10 | 5.8%(+49.1)#51 |
| 52. | Pearl City | 54.6% | 37.2%(+17.5)#7 | 5.8%(+48.8)#52 |
| 53. | Halawa | 54.4% | 37.2%(+17.3)#8 | 5.8%(+48.7)#53 |
| 54. | Ewa Beach | 54.4% | 37.2%(+17.3)#9 | 5.8%(+48.6)#54 |
| 55. | Puhi | 54.1% | 37.2%(+16.9)#10 | 5.8%(+48.3)#55 |
| 56. | Waikele | 54.1% | 37.2%(+16.9)#11 | 5.8%(+48.3)#56 |
| 57. | Kahului | 53.9% | 37.2%(+16.7)#12 | 5.8%(+48.1)#57 |
| 58. | East San Gabriel | 53.8% | 15.1%(+38.6)#23 | 5.8%(+48.0)#58 |
| 59. | Lake Success | 53.6% | 8.8%(+44.8)#2 | 5.8%(+47.8)#59 |
| 60. | Dublin | 53.5% | 15.1%(+38.4)#24 | 5.8%(+47.7)#60 |
| 61. | Farmington | 53.2% | 15.1%(+38.0)#25 | 5.8%(+47.4)#61 |
| 62. | Foster City | 53.1% | 15.1%(+38.0)#26 | 5.8%(+47.3)#62 |
| 63. | Manhasset Hills | 53.1% | 8.8%(+44.2)#3 | 5.8%(+47.3)#63 |
| 64. | Heathcote | 52.9% | 9.9%(+43.0)#11 | 5.8%(+47.1)#64 |
| 65. | Broadmoor | 52.8% | 15.1%(+37.7)#27 | 5.8%(+47.1)#65 |
| 66. | Mililani Mauka | 52.8% | 37.2%(+15.6)#13 | 5.8%(+47.0)#66 |
| 67. | Urban Honolulu | 52.3% | 37.2%(+15.1)#14 | 5.8%(+46.5)#67 |
| 68. | Waimalu | 52.3% | 37.2%(+15.1)#15 | 5.8%(+46.5)#68 |
| 69. | Mountain House | 52.2% | 15.1%(+37.1)#28 | 5.8%(+46.4)#69 |
| 70. | Iselin | 51.8% | 9.9%(+42.0)#12 | 5.8%(+46.1)#70 |
| 71. | Alhambra | 51.3% | 15.1%(+36.2)#29 | 5.8%(+45.5)#71 |
| 72. | Lanai City | 51.0% | 37.2%(+13.9)#16 | 5.8%(+45.3)#72 |
| 73. | Westminster | 50.7% | 15.1%(+35.6)#30 | 5.8%(+45.0)#73 |
| 74. | La Palma | 50.6% | 15.1%(+35.5)#31 | 5.8%(+44.9)#74 |
| 75. | Navy | 50.6% | 6.9%(+43.7)#3 | 5.8%(+44.8)#75 |
| 76. | Keaau | 49.6% | 37.2%(+12.5)#17 | 5.8%(+43.8)#76 |
| 77. | Sunnyvale | 49.6% | 15.1%(+34.5)#32 | 5.8%(+43.8)#77 |
| 78. | Hanapepe | 49.4% | 37.2%(+12.3)#18 | 5.8%(+43.6)#78 |
| 79. | Eleele | 49.2% | 37.2%(+12.0)#19 | 5.8%(+43.4)#79 |
| 80. | Aiea | 49.1% | 37.2%(+11.9)#20 | 5.8%(+43.3)#80 |
| 81. | Catlett | 48.9% | 6.9%(+42.1)#4 | 5.8%(+43.2)#81 |
| 82. | Bellerose Terrace | 48.9% | 8.8%(+40.0)#4 | 5.8%(+43.1)#82 |
| 83. | Garden City Park | 48.6% | 8.8%(+39.8)#5 | 5.8%(+42.9)#83 |
| 84. | Searingtown | 48.5% | 8.8%(+39.7)#6 | 5.8%(+42.8)#84 |
| 85. | San Ramon | 48.1% | 15.1%(+33.0)#33 | 5.8%(+42.3)#85 |
| 86. | Kodiak | 47.9% | 6.5%(+41.5)#2 | 5.8%(+42.2)#86 |
| 87. | West Loch Estate | 47.9% | 37.2%(+10.8)#21 | 5.8%(+42.1)#87 |
| 88. | East Honolulu | 47.9% | 37.2%(+10.7)#22 | 5.8%(+42.1)#88 |
| 89. | Millbrae | 47.7% | 15.1%(+32.5)#34 | 5.8%(+41.9)#89 |
| 90. | Ewa Gentry | 47.6% | 37.2%(+10.5)#23 | 5.8%(+41.9)#90 |
| 91. | Unalaska | 47.4% | 6.5%(+40.9)#3 | 5.8%(+41.6)#91 |
| 92. | Mililani Town | 47.2% | 37.2%(+10.1)#24 | 5.8%(+41.4)#92 |
| 93. | Santa Clara | 47.2% | 15.1%(+32.1)#35 | 5.8%(+41.4)#93 |
| 94. | Forest Home | 46.9% | 8.8%(+38.0)#7 | 5.8%(+41.1)#94 |
| 95. | Troy Hills | 46.8% | 9.9%(+37.0)#13 | 5.8%(+41.1)#95 |
| 96. | Triumph | 46.8% | 1.7%(+45.1)#1 | 5.8%(+41.0)#96 |
| 97. | Trilby | 46.8% | 2.8%(+44.0)#1 | 5.8%(+41.0)#97 |
| 98. | Kealakekua | 46.7% | 37.2%(+9.55)#25 | 5.8%(+40.9)#98 |
| 99. | Jericho | 46.5% | 8.8%(+37.7)#8 | 5.8%(+40.7)#99 |
| 100. | Buras | 46.0% | 1.7%(+44.3)#2 | 5.8%(+40.3)#100 |
Common Questions
What are the Top 10 Cities with the Highest Percentage of Asian Population in the United States?
Top 10 Cities with the Highest Percentage of Asian Population in the United States are:
#1
100.0%
#2
100.0%
#3
85.7%
#4
85.1%
#5
79.1%
#6
78.1%
#7
70.7%
#8
70.2%
#9
70.2%
#10
70.2%
What city has the Highest Percentage of Asian Population in the United States?
Soda Springs has the Highest Percentage of Asian Population in the United States with 100.0%.
What is the Percentage of Asian Population in the United States?
Percentage of Asian Population in the United States is 5.8%.