Cities with the Highest Percentage of Scandinavian Population in the United States
RELATED REPORTS & OPTIONS
Scandinavian
United States
Compare Cities
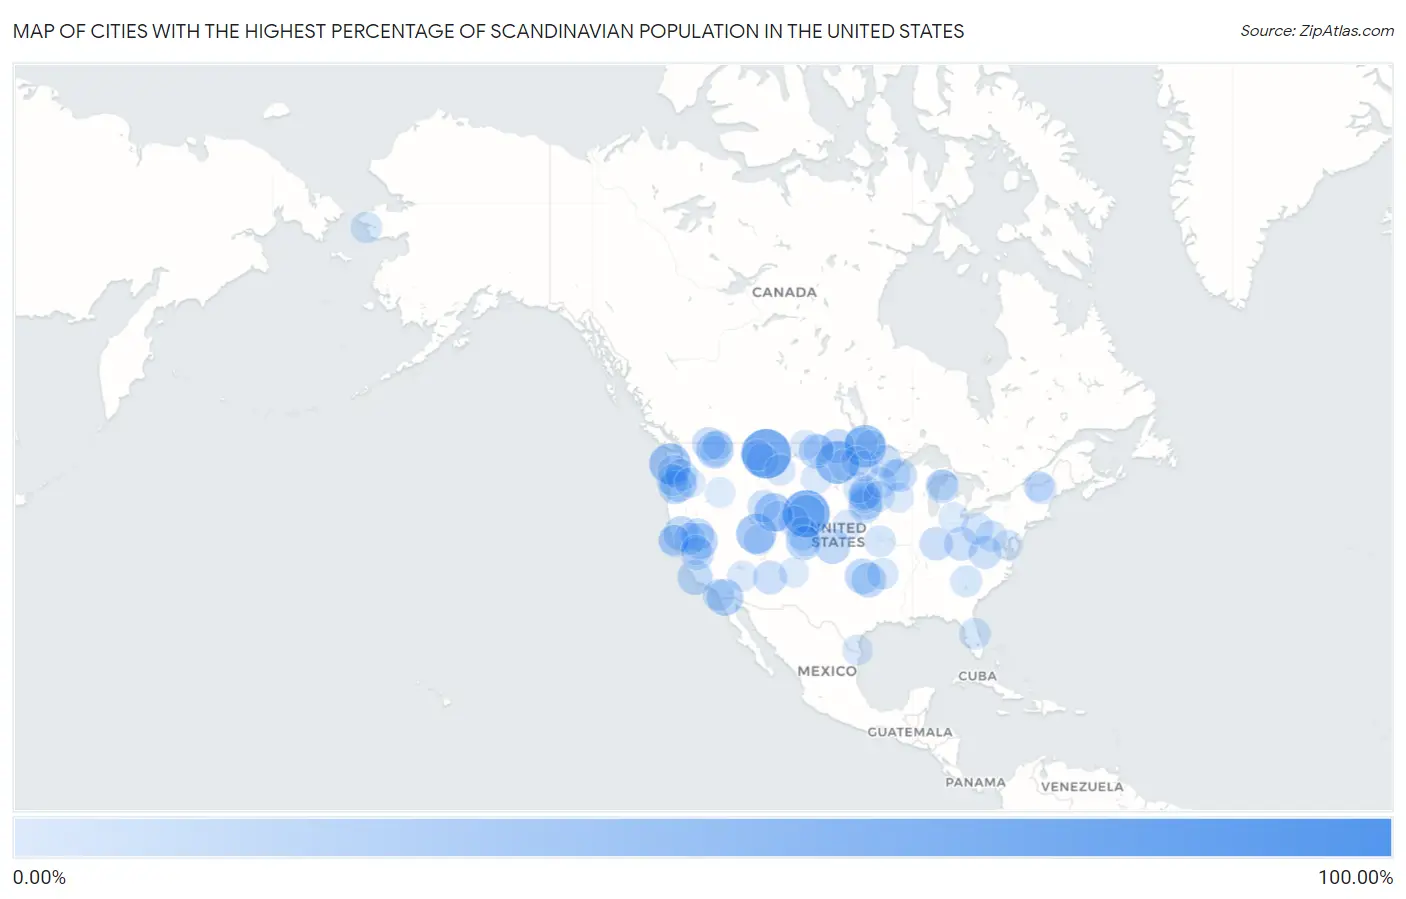
Map of Cities with the Highest Percentage of Scandinavian Population in the United States
0.00%
100.00%
Cities with the Highest Percentage of Scandinavian Population in the United States
| City | Scandinavian | vs State | vs National | |
| 1. | Millwood | 100.00% | 0.17%(+99.8)#1 | 0.30%(+99.7)#1 |
| 2. | Loma | 75.31% | 1.27%(+74.0)#1 | 0.30%(+75.0)#2 |
| 3. | Chugcreek | 66.67% | 1.12%(+65.5)#1 | 0.30%(+66.4)#3 |
| 4. | Regan | 52.27% | 1.69%(+50.6)#1 | 0.30%(+52.0)#4 |
| 5. | Halma | 51.35% | 1.78%(+49.6)#1 | 0.30%(+51.0)#5 |
| 6. | Oyehut | 47.06% | 0.94%(+46.1)#1 | 0.30%(+46.8)#6 |
| 7. | Elberta | 43.27% | 1.50%(+41.8)#1 | 0.30%(+43.0)#7 |
| 8. | Farson | 37.79% | 1.12%(+36.7)#2 | 0.30%(+37.5)#8 |
| 9. | Lakeview North | 35.63% | 1.12%(+34.5)#3 | 0.30%(+35.3)#9 |
| 10. | Addy | 33.33% | 0.94%(+32.4)#2 | 0.30%(+33.0)#10 |
| 11. | Canton | 32.33% | 0.21%(+32.1)#1 | 0.30%(+32.0)#11 |
| 12. | Boulevard | 32.03% | 0.25%(+31.8)#1 | 0.30%(+31.7)#12 |
| 13. | Fishtail | 31.48% | 1.27%(+30.2)#2 | 0.30%(+31.2)#13 |
| 14. | Brooks | 30.23% | 0.91%(+29.3)#1 | 0.30%(+29.9)#14 |
| 15. | Logan Creek | 28.57% | 0.37%(+28.2)#1 | 0.30%(+28.3)#15 |
| 16. | Willsboro Point | 28.03% | 0.12%(+27.9)#1 | 0.30%(+27.7)#16 |
| 17. | Marienthal | 27.91% | 0.32%(+27.6)#1 | 0.30%(+27.6)#17 |
| 18. | Macomb | 27.78% | 0.29%(+27.5)#1 | 0.30%(+27.5)#18 |
| 19. | Flournoy | 27.37% | 0.25%(+27.1)#2 | 0.30%(+27.1)#19 |
| 20. | Florissant | 27.17% | 0.55%(+26.6)#1 | 0.30%(+26.9)#20 |
| 21. | Los Berros | 26.92% | 0.25%(+26.7)#3 | 0.30%(+26.6)#21 |
| 22. | Ashland | 26.09% | 0.29%(+25.8)#2 | 0.30%(+25.8)#22 |
| 23. | Springbrook | 25.81% | 1.69%(+24.1)#2 | 0.30%(+25.5)#23 |
| 24. | Gardena | 24.32% | 1.69%(+22.6)#3 | 0.30%(+24.0)#24 |
| 25. | Chemult | 22.92% | 0.91%(+22.0)#2 | 0.30%(+22.6)#25 |
| 26. | Fairview | 22.73% | 1.03%(+21.7)#1 | 0.30%(+22.4)#26 |
| 27. | Otway | 22.67% | 0.20%(+22.5)#1 | 0.30%(+22.4)#27 |
| 28. | Glenwood | 22.14% | 0.21%(+21.9)#1 | 0.30%(+21.8)#28 |
| 29. | Richland | 22.02% | 1.03%(+21.0)#2 | 0.30%(+21.7)#29 |
| 30. | Cedar | 21.95% | 0.26%(+21.7)#1 | 0.30%(+21.6)#30 |
| 31. | Sun Valley | 21.90% | 0.41%(+21.5)#1 | 0.30%(+21.6)#31 |
| 32. | Williams | 21.74% | 0.21%(+21.5)#2 | 0.30%(+21.4)#32 |
| 33. | Springbrook | 21.62% | 0.56%(+21.1)#1 | 0.30%(+21.3)#33 |
| 34. | Curlew | 21.30% | 0.94%(+20.4)#3 | 0.30%(+21.0)#34 |
| 35. | Kings Valley | 21.09% | 0.91%(+20.2)#3 | 0.30%(+20.8)#35 |
| 36. | Chilcoot Vinton | 20.86% | 0.25%(+20.6)#4 | 0.30%(+20.6)#36 |
| 37. | Stockett | 20.67% | 1.27%(+19.4)#3 | 0.30%(+20.4)#37 |
| 38. | Bonanza Mountain Estates | 20.30% | 0.55%(+19.7)#2 | 0.30%(+20.0)#38 |
| 39. | Low Moor | 20.05% | 0.24%(+19.8)#1 | 0.30%(+19.7)#39 |
| 40. | Broadview | 20.00% | 0.31%(+19.7)#1 | 0.30%(+19.7)#40 |
| 41. | Coulterville | 20.00% | 0.25%(+19.7)#5 | 0.30%(+19.7)#41 |
| 42. | Ward | 19.35% | 1.03%(+18.3)#3 | 0.30%(+19.1)#42 |
| 43. | Ball Club | 19.33% | 1.78%(+17.5)#2 | 0.30%(+19.0)#43 |
| 44. | Philo | 18.87% | 0.25%(+18.6)#6 | 0.30%(+18.6)#44 |
| 45. | Altoona | 18.87% | 0.94%(+17.9)#4 | 0.30%(+18.6)#45 |
| 46. | St Vincent | 18.60% | 1.78%(+16.8)#3 | 0.30%(+18.3)#46 |
| 47. | Grover | 18.22% | 1.12%(+17.1)#4 | 0.30%(+17.9)#47 |
| 48. | Arthur | 18.18% | 0.21%(+18.0)#3 | 0.30%(+17.9)#48 |
| 49. | Amboy | 17.26% | 0.94%(+16.3)#5 | 0.30%(+17.0)#49 |
| 50. | Dobbins | 17.14% | 0.25%(+16.9)#7 | 0.30%(+16.8)#50 |
| 51. | East Springfield | 17.12% | 0.20%(+16.9)#2 | 0.30%(+16.8)#51 |
| 52. | Fairbanks Ranch | 16.59% | 0.25%(+16.3)#8 | 0.30%(+16.3)#52 |
| 53. | Fairview | 16.57% | 0.91%(+15.7)#4 | 0.30%(+16.3)#53 |
| 54. | Lake Hart | 15.78% | 0.19%(+15.6)#1 | 0.30%(+15.5)#54 |
| 55. | Ware Place | 15.62% | 0.20%(+15.4)#1 | 0.30%(+15.3)#55 |
| 56. | Renner Corner | 15.50% | 1.03%(+14.5)#4 | 0.30%(+15.2)#56 |
| 57. | Danbury | 15.22% | 0.56%(+14.7)#2 | 0.30%(+14.9)#57 |
| 58. | Rudy | 15.13% | 0.20%(+14.9)#1 | 0.30%(+14.8)#58 |
| 59. | Port Clarence | 15.00% | 0.86%(+14.1)#1 | 0.30%(+14.7)#59 |
| 60. | Randolph | 15.00% | 0.29%(+14.7)#1 | 0.30%(+14.7)#60 |
| 61. | Klondike | 14.91% | 0.18%(+14.7)#1 | 0.30%(+14.6)#61 |
| 62. | Dutton | 14.72% | 1.27%(+13.5)#4 | 0.30%(+14.4)#62 |
| 63. | Vanndale | 14.58% | 0.20%(+14.4)#2 | 0.30%(+14.3)#63 |
| 64. | East Burke | 14.55% | 0.33%(+14.2)#1 | 0.30%(+14.2)#64 |
| 65. | Brant Lake | 14.47% | 1.03%(+13.4)#5 | 0.30%(+14.2)#65 |
| 66. | Naples | 14.47% | 1.03%(+13.4)#6 | 0.30%(+14.2)#66 |
| 67. | Kingston | 14.42% | 1.78%(+12.6)#4 | 0.30%(+14.1)#67 |
| 68. | Tappen | 14.34% | 1.69%(+12.6)#4 | 0.30%(+14.0)#68 |
| 69. | Manti | 14.08% | 1.50%(+12.6)#2 | 0.30%(+13.8)#69 |
| 70. | Prairie Rose | 13.89% | 1.69%(+12.2)#5 | 0.30%(+13.6)#71 |
| 71. | Riverside | 13.89% | 1.12%(+12.8)#5 | 0.30%(+13.6)#72 |
| 72. | Stanley | 13.64% | 0.31%(+13.3)#2 | 0.30%(+13.3)#73 |
| 73. | Cameron | 13.60% | 0.22%(+13.4)#1 | 0.30%(+13.3)#74 |
| 74. | Camp Three | 13.55% | 1.27%(+12.3)#5 | 0.30%(+13.2)#75 |
| 75. | Odin | 13.33% | 1.78%(+11.6)#5 | 0.30%(+13.0)#76 |
| 76. | Superior | 13.18% | 1.12%(+12.1)#6 | 0.30%(+12.9)#77 |
| 77. | Nelagoney | 13.11% | 0.29%(+12.8)#3 | 0.30%(+12.8)#78 |
| 78. | Buffalo | 12.80% | 1.03%(+11.8)#7 | 0.30%(+12.5)#79 |
| 79. | Lasana | 12.66% | 0.18%(+12.5)#1 | 0.30%(+12.4)#80 |
| 80. | Friendship | 12.58% | 0.18%(+12.4)#2 | 0.30%(+12.3)#81 |
| 81. | Pinion Pines | 12.57% | 0.41%(+12.2)#2 | 0.30%(+12.3)#82 |
| 82. | Leland | 12.50% | 0.26%(+12.2)#2 | 0.30%(+12.2)#83 |
| 83. | Comptche | 12.50% | 0.25%(+12.2)#9 | 0.30%(+12.2)#84 |
| 84. | Avery | 12.32% | 0.25%(+12.1)#10 | 0.30%(+12.0)#85 |
| 85. | Irasburg | 12.17% | 0.33%(+11.8)#2 | 0.30%(+11.9)#86 |
| 86. | Riverdale | 12.14% | 0.37%(+11.8)#1 | 0.30%(+11.8)#87 |
| 87. | Luverne | 12.12% | 1.69%(+10.4)#6 | 0.30%(+11.8)#88 |
| 88. | Ray | 12.11% | 1.69%(+10.4)#7 | 0.30%(+11.8)#89 |
| 89. | Valley | 11.96% | 0.94%(+11.0)#6 | 0.30%(+11.7)#90 |
| 90. | Annex | 11.71% | 0.91%(+10.8)#5 | 0.30%(+11.4)#91 |
| 91. | Radley | 11.61% | 0.32%(+11.3)#2 | 0.30%(+11.3)#92 |
| 92. | Tedrow | 11.60% | 0.20%(+11.4)#3 | 0.30%(+11.3)#93 |
| 93. | Wamic | 11.54% | 0.91%(+10.6)#6 | 0.30%(+11.2)#94 |
| 94. | Badger | 11.52% | 1.78%(+9.74)#6 | 0.30%(+11.2)#95 |
| 95. | Westcreek | 11.39% | 0.55%(+10.8)#3 | 0.30%(+11.1)#96 |
| 96. | Apple Valley | 11.31% | 1.69%(+9.63)#8 | 0.30%(+11.0)#97 |
| 97. | Flaxville | 11.29% | 1.27%(+10.0)#6 | 0.30%(+11.0)#98 |
| 98. | Whalan | 11.27% | 1.78%(+9.49)#7 | 0.30%(+11.0)#99 |
| 99. | Ponderosa | 11.25% | 0.31%(+10.9)#3 | 0.30%(+10.9)#100 |
| 100. | Metaline | 11.11% | 0.94%(+10.2)#7 | 0.30%(+10.8)#101 |
Common Questions
What are the Top 10 Cities with the Highest Percentage of Scandinavian Population in the United States?
Top 10 Cities with the Highest Percentage of Scandinavian Population in the United States are:
What city has the Highest Percentage of Scandinavian Population in the United States?
Loma has the Highest Percentage of Scandinavian Population in the United States with 75.31%.
What is the Percentage of Scandinavian Population in the United States?
Percentage of Scandinavian Population in the United States is 0.30%.