Cities with the Most Immigrants from England in the United States
RELATED REPORTS & OPTIONS
England
United States
Compare Cities
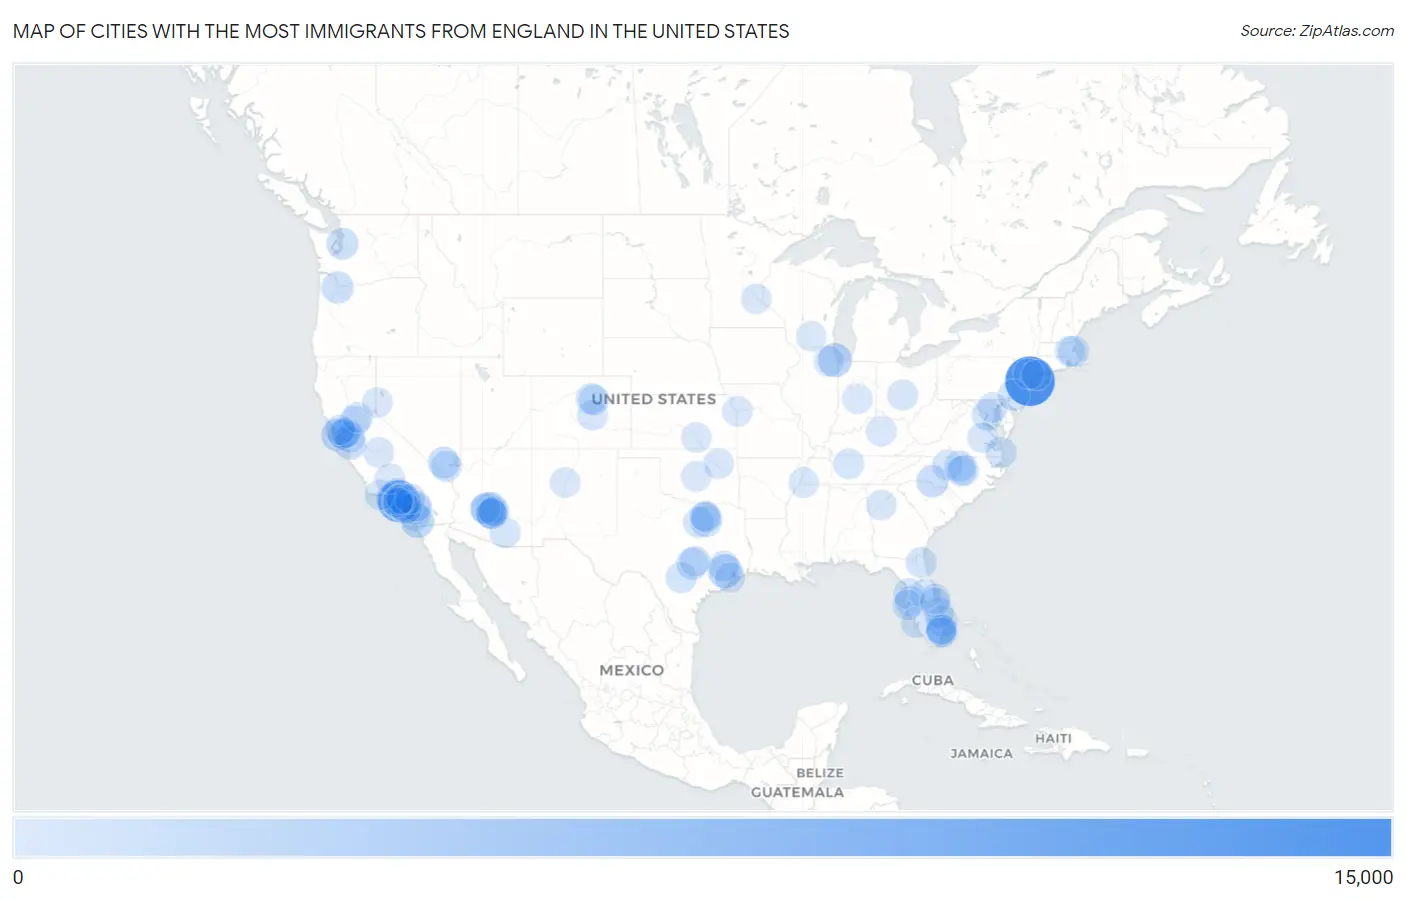
Map of Cities with the Most Immigrants from England in the United States
0
15,000
Cities with the Most Immigrants from England in the United States
| City | England | vs State | vs National | |
| 1. | New York | 10,617 | 23,058(46.04%)#1 | 318,896(3.33%)#1 |
| 2. | Los Angeles | 6,510 | 57,953(11.23%)#1 | 318,896(2.04%)#2 |
| 3. | Chicago | 2,180 | 8,551(25.49%)#1 | 318,896(0.68%)#3 |
| 4. | Houston | 2,121 | 20,885(10.16%)#1 | 318,896(0.67%)#4 |
| 5. | San Diego | 1,898 | 57,953(3.28%)#2 | 318,896(0.60%)#5 |
| 6. | San Francisco | 1,548 | 57,953(2.67%)#3 | 318,896(0.49%)#6 |
| 7. | Phoenix | 1,543 | 9,889(15.60%)#1 | 318,896(0.48%)#7 |
| 8. | Charlotte | 1,329 | 10,140(13.11%)#1 | 318,896(0.42%)#8 |
| 9. | San Jose | 1,178 | 57,953(2.03%)#4 | 318,896(0.37%)#9 |
| 10. | Portland | 1,151 | 6,313(18.23%)#1 | 318,896(0.36%)#10 |
| 11. | Seattle | 1,114 | 9,457(11.78%)#1 | 318,896(0.35%)#11 |
| 12. | Austin | 1,064 | 20,885(5.09%)#2 | 318,896(0.33%)#12 |
| 13. | Las Vegas | 992 | 4,038(24.57%)#1 | 318,896(0.31%)#13 |
| 14. | Dallas | 967 | 20,885(4.63%)#3 | 318,896(0.30%)#14 |
| 15. | Philadelphia | 835 | 9,205(9.07%)#1 | 318,896(0.26%)#15 |
| 16. | Fort Lauderdale | 833 | 37,723(2.21%)#1 | 318,896(0.26%)#16 |
| 17. | Murrieta | 784 | 57,953(1.35%)#5 | 318,896(0.25%)#17 |
| 18. | Washington | 762 | 762(100.00%)#1 | 318,896(0.24%)#18 |
| 19. | Denver | 748 | 6,672(11.21%)#1 | 318,896(0.23%)#19 |
| 20. | Scottsdale | 741 | 9,889(7.49%)#2 | 318,896(0.23%)#20 |
| 21. | West Palm Beach | 725 | 37,723(1.92%)#2 | 318,896(0.23%)#21 |
| 22. | Irvine | 724 | 57,953(1.25%)#6 | 318,896(0.23%)#22 |
| 23. | Tucson | 702 | 9,889(7.10%)#3 | 318,896(0.22%)#23 |
| 24. | San Antonio | 698 | 20,885(3.34%)#4 | 318,896(0.22%)#24 |
| 25. | Gilbert | 675 | 9,889(6.83%)#4 | 318,896(0.21%)#25 |
| 26. | Boston | 670 | 10,698(6.26%)#1 | 318,896(0.21%)#26 |
| 27. | Huntington Beach | 657 | 57,953(1.13%)#7 | 318,896(0.21%)#27 |
| 28. | Long Beach | 656 | 57,953(1.13%)#8 | 318,896(0.21%)#28 |
| 29. | Henderson | 652 | 4,038(16.15%)#2 | 318,896(0.20%)#29 |
| 30. | Santa Monica | 651 | 57,953(1.12%)#9 | 318,896(0.20%)#30 |
| 31. | Jacksonville | 628 | 37,723(1.66%)#3 | 318,896(0.20%)#31 |
| 32. | Virginia Beach | 627 | 9,842(6.37%)#1 | 318,896(0.20%)#32 |
| 33. | Spring Hill | 627 | 37,723(1.66%)#4 | 318,896(0.20%)#33 |
| 34. | Tempe | 622 | 9,889(6.29%)#5 | 318,896(0.20%)#34 |
| 35. | Durham | 620 | 10,140(6.11%)#2 | 318,896(0.19%)#35 |
| 36. | Tampa | 593 | 37,723(1.57%)#5 | 318,896(0.19%)#36 |
| 37. | The Woodlands | 566 | 20,885(2.71%)#5 | 318,896(0.18%)#37 |
| 38. | Coral Springs | 558 | 37,723(1.48%)#6 | 318,896(0.17%)#38 |
| 39. | Greensboro | 552 | 10,140(5.44%)#3 | 318,896(0.17%)#39 |
| 40. | Sacramento | 547 | 57,953(0.94%)#10 | 318,896(0.17%)#40 |
| 41. | Fort Worth | 541 | 20,885(2.59%)#6 | 318,896(0.17%)#41 |
| 42. | Cape Coral | 540 | 37,723(1.43%)#7 | 318,896(0.17%)#42 |
| 43. | Columbus | 537 | 5,979(8.98%)#1 | 318,896(0.17%)#43 |
| 44. | Colorado Springs | 529 | 6,672(7.93%)#2 | 318,896(0.17%)#44 |
| 45. | Oakland | 527 | 57,953(0.91%)#11 | 318,896(0.17%)#45 |
| 46. | Thousand Oaks | 515 | 57,953(0.89%)#12 | 318,896(0.16%)#46 |
| 47. | Santa Clarita | 505 | 57,953(0.87%)#13 | 318,896(0.16%)#47 |
| 48. | Pasadena | 503 | 57,953(0.87%)#14 | 318,896(0.16%)#48 |
| 49. | Port St Lucie | 497 | 37,723(1.32%)#8 | 318,896(0.16%)#49 |
| 50. | Redondo Beach | 482 | 57,953(0.83%)#15 | 318,896(0.15%)#50 |
| 51. | Chandler | 477 | 9,889(4.82%)#6 | 318,896(0.15%)#51 |
| 52. | Nashville | 470 | 4,587(10.25%)#1 | 318,896(0.15%)#52 |
| 53. | Plano | 454 | 20,885(2.17%)#7 | 318,896(0.14%)#53 |
| 54. | Aurora | 443 | 6,672(6.64%)#3 | 318,896(0.14%)#54 |
| 55. | Carlsbad | 442 | 57,953(0.76%)#16 | 318,896(0.14%)#55 |
| 56. | Orlando | 438 | 37,723(1.16%)#9 | 318,896(0.14%)#56 |
| 57. | Santa Barbara | 437 | 57,953(0.75%)#17 | 318,896(0.14%)#57 |
| 58. | Raleigh | 435 | 10,140(4.29%)#4 | 318,896(0.14%)#58 |
| 59. | Airmont | 429 | 23,058(1.86%)#2 | 318,896(0.13%)#59 |
| 60. | Oklahoma City | 427 | 1,922(22.22%)#1 | 318,896(0.13%)#60 |
| 61. | Menifee | 423 | 57,953(0.73%)#18 | 318,896(0.13%)#61 |
| 62. | Lexington | 422 | 1,743(24.21%)#1 | 318,896(0.13%)#62 |
| 63. | Frisco | 422 | 20,885(2.02%)#8 | 318,896(0.13%)#63 |
| 64. | Newport Beach | 420 | 57,953(0.72%)#19 | 318,896(0.13%)#64 |
| 65. | Albuquerque | 419 | 1,770(23.67%)#1 | 318,896(0.13%)#65 |
| 66. | Glendale | 417 | 9,889(4.22%)#7 | 318,896(0.13%)#66 |
| 67. | Livermore | 412 | 57,953(0.71%)#20 | 318,896(0.13%)#67 |
| 68. | St Petersburg | 409 | 37,723(1.08%)#10 | 318,896(0.13%)#68 |
| 69. | Tulsa | 406 | 1,922(21.12%)#2 | 318,896(0.13%)#69 |
| 70. | Fresno | 402 | 57,953(0.69%)#21 | 318,896(0.13%)#70 |
| 71. | Mesa | 399 | 9,889(4.03%)#8 | 318,896(0.13%)#71 |
| 72. | Naperville | 396 | 8,551(4.63%)#2 | 318,896(0.12%)#72 |
| 73. | Berkeley | 389 | 57,953(0.67%)#22 | 318,896(0.12%)#73 |
| 74. | Walnut Creek | 385 | 57,953(0.66%)#23 | 318,896(0.12%)#74 |
| 75. | Glendale | 375 | 57,953(0.65%)#24 | 318,896(0.12%)#75 |
| 76. | Wichita | 372 | 1,646(22.60%)#1 | 318,896(0.12%)#76 |
| 77. | Madison | 371 | 2,478(14.97%)#1 | 318,896(0.12%)#77 |
| 78. | Baltimore | 367 | 5,828(6.30%)#1 | 318,896(0.12%)#78 |
| 79. | Roseville | 367 | 57,953(0.63%)#25 | 318,896(0.12%)#79 |
| 80. | Newton | 363 | 10,698(3.39%)#2 | 318,896(0.11%)#80 |
| 81. | Indianapolis | 362 | 2,847(12.72%)#1 | 318,896(0.11%)#81 |
| 82. | Atlanta | 362 | 8,849(4.09%)#1 | 318,896(0.11%)#82 |
| 83. | Stamford | 361 | 6,551(5.51%)#1 | 318,896(0.11%)#83 |
| 84. | Melbourne | 359 | 37,723(0.95%)#11 | 318,896(0.11%)#84 |
| 85. | Cary | 354 | 10,140(3.49%)#5 | 318,896(0.11%)#85 |
| 86. | Reno | 352 | 4,038(8.72%)#3 | 318,896(0.11%)#86 |
| 87. | Bakersfield | 351 | 57,953(0.61%)#26 | 318,896(0.11%)#87 |
| 88. | Rancho Cucamonga | 341 | 57,953(0.59%)#27 | 318,896(0.11%)#88 |
| 89. | Palm Bay | 338 | 37,723(0.90%)#12 | 318,896(0.11%)#89 |
| 90. | Pflugerville | 334 | 20,885(1.60%)#9 | 318,896(0.10%)#90 |
| 91. | Novato | 334 | 57,953(0.58%)#28 | 318,896(0.10%)#91 |
| 92. | Davie | 330 | 37,723(0.87%)#13 | 318,896(0.10%)#92 |
| 93. | Kansas City | 326 | 2,796(11.66%)#1 | 318,896(0.10%)#93 |
| 94. | West Hollywood | 323 | 57,953(0.56%)#29 | 318,896(0.10%)#94 |
| 95. | Memphis | 319 | 4,587(6.95%)#2 | 318,896(0.10%)#95 |
| 96. | League City | 319 | 20,885(1.53%)#10 | 318,896(0.10%)#96 |
| 97. | Marina Del Rey | 318 | 57,953(0.55%)#30 | 318,896(0.10%)#97 |
| 98. | Mechanicsville | 315 | 9,842(3.20%)#2 | 318,896(0.10%)#98 |
| 99. | Tamarac | 313 | 37,723(0.83%)#14 | 318,896(0.10%)#99 |
| 100. | Minneapolis | 310 | 2,636(11.76%)#1 | 318,896(0.10%)#100 |
Common Questions
What are the Top 10 Cities with the Most Immigrants from England in the United States?
Top 10 Cities with the Most Immigrants from England in the United States are:
What city has the Most Immigrants from England in the United States?
New York has the Most Immigrants from England in the United States with 10,617.
What is the Total Immigrants from England in the United States?
Total Immigrants from England in the United States is 318,896.