Cities with the Highest Percentage of Population Employed in Personal Care and Service in the United States
RELATED REPORTS & OPTIONS
Personal Care and Service
United States
Compare Cities
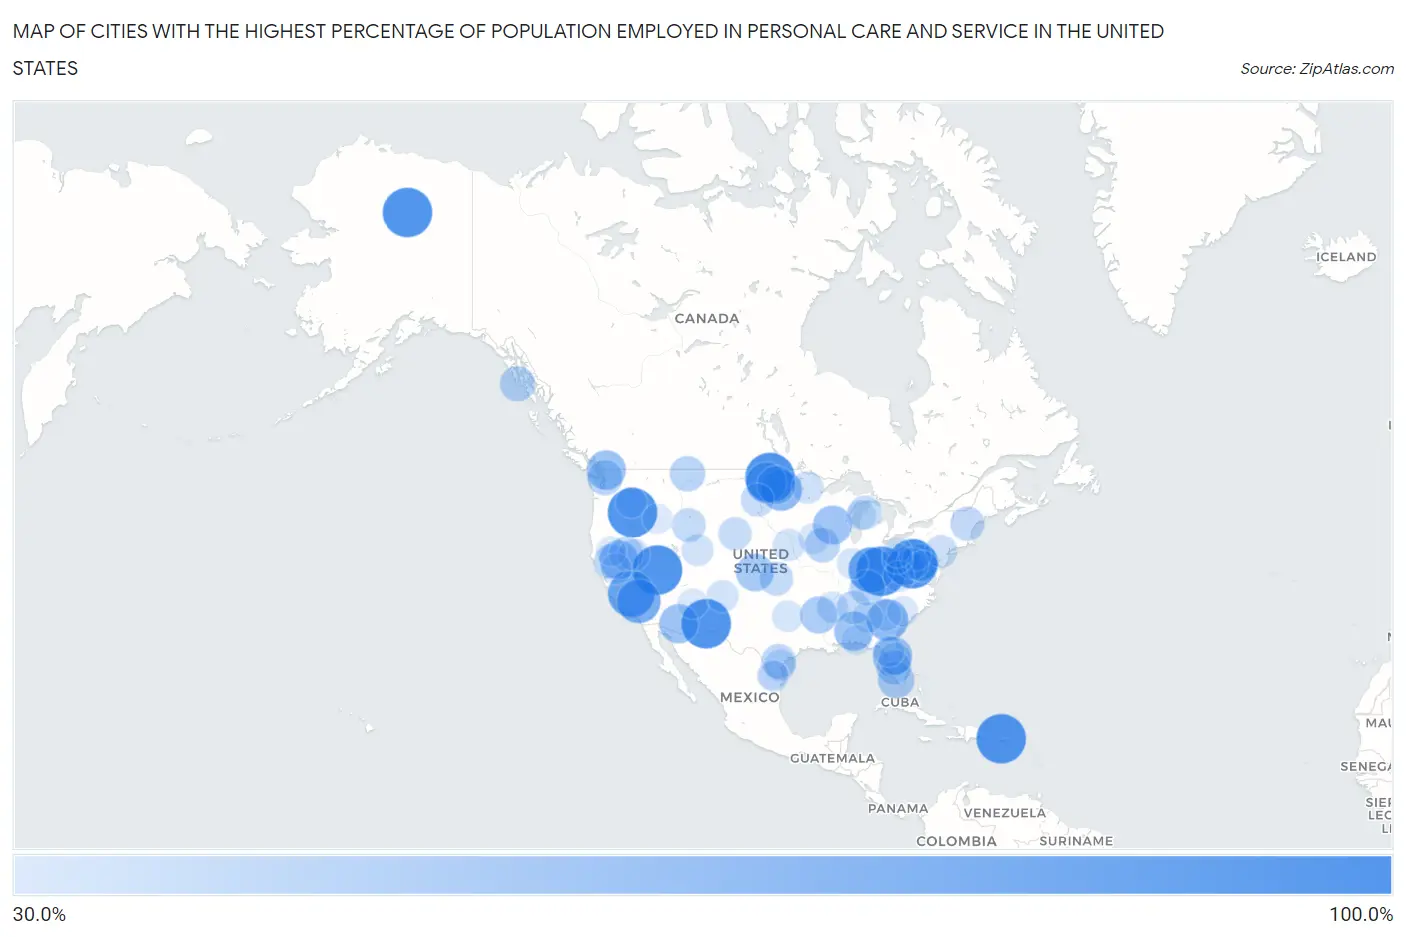
Map of Cities with the Highest Percentage of Population Employed in Personal Care and Service in the United States
0.0%
100.0%
Cities with the Highest Percentage of Population Employed in Personal Care and Service in the United States
| City | % Employed | vs State | vs National | |
| 1. | Franklin | 100.0% | 2.6%(+97.4)#1 | 2.6%(+97.4)#1 |
| 2. | Lund | 100.0% | 4.4%(+95.6)#1 | 2.6%(+97.4)#2 |
| 3. | Eagle Lake | 100.0% | 2.6%(+97.4)#1 | 2.6%(+97.4)#3 |
| 4. | North Hurley | 100.0% | 2.4%(+97.6)#1 | 2.6%(+97.4)#5 |
| 5. | Corral Viejo | 100.0% | 2.4%(+97.6)#1 | 2.6%(+97.4)#6 |
| 6. | La Boca | 100.0% | 2.4%(+97.6)#2 | 2.6%(+97.4)#7 |
| 7. | Wiseman | 100.0% | 2.9%(+97.1)#1 | 2.6%(+97.4)#8 |
| 8. | Niota | 100.0% | 2.6%(+97.4)#2 | 2.6%(+97.4)#9 |
| 9. | Concord | 100.0% | 2.3%(+97.7)#1 | 2.6%(+97.4)#10 |
| 10. | Granite | 100.0% | 2.4%(+97.6)#1 | 2.6%(+97.4)#11 |
| 11. | Centerville | 100.0% | 2.6%(+97.4)#1 | 2.6%(+97.4)#12 |
| 12. | Churchs Ferry | 100.0% | 2.9%(+97.1)#1 | 2.6%(+97.4)#13 |
| 13. | Lake Bruce | 91.2% | 2.3%(+89.0)#1 | 2.6%(+88.7)#14 |
| 14. | Camp Nelson | 89.0% | 2.7%(+86.3)#1 | 2.6%(+86.5)#15 |
| 15. | Florence | 85.0% | 2.3%(+82.7)#2 | 2.6%(+82.4)#16 |
| 16. | Johannesburg | 79.4% | 2.7%(+76.7)#2 | 2.6%(+76.8)#17 |
| 17. | Double Horn | 78.3% | 2.3%(+76.0)#1 | 2.6%(+75.8)#18 |
| 18. | Clark Colony | 77.8% | 2.7%(+75.1)#1 | 2.6%(+75.2)#19 |
| 19. | Bethlehem | 72.3% | 2.4%(+69.9)#1 | 2.6%(+69.8)#20 |
| 20. | Edge Hill | 71.4% | 2.3%(+69.1)#1 | 2.6%(+68.9)#21 |
| 21. | Ayr | 71.4% | 2.9%(+68.6)#2 | 2.6%(+68.9)#22 |
| 22. | Heimdal | 67.7% | 2.9%(+64.9)#3 | 2.6%(+65.2)#23 |
| 23. | Okahumpka | 64.6% | 2.8%(+61.8)#1 | 2.6%(+62.0)#24 |
| 24. | Maple Falls | 63.6% | 2.4%(+61.2)#1 | 2.6%(+61.0)#25 |
| 25. | Vaiva Vo | 63.3% | 2.5%(+60.8)#1 | 2.6%(+60.8)#26 |
| 26. | Vredenburgh | 63.2% | 2.3%(+60.9)#1 | 2.6%(+60.6)#27 |
| 27. | Yuba | 62.5% | 2.2%(+60.3)#1 | 2.6%(+59.9)#28 |
| 28. | Lake Davis | 61.7% | 2.7%(+59.0)#3 | 2.6%(+59.2)#29 |
| 29. | Jessie | 60.0% | 2.9%(+57.1)#4 | 2.6%(+57.4)#30 |
| 30. | Galloway | 58.8% | 2.2%(+56.6)#1 | 2.6%(+56.3)#31 |
| 31. | Puzzletown | 58.6% | 2.4%(+56.2)#1 | 2.6%(+56.1)#32 |
| 32. | Marienthal | 58.1% | 2.6%(+55.5)#1 | 2.6%(+55.5)#33 |
| 33. | New Edinburg | 56.2% | 2.1%(+54.1)#1 | 2.6%(+53.6)#34 |
| 34. | Fairview | 56.0% | 2.3%(+53.7)#3 | 2.6%(+53.4)#35 |
| 35. | Ernstville | 55.0% | 2.6%(+52.4)#2 | 2.6%(+52.4)#36 |
| 36. | Chokoloskee | 54.6% | 2.8%(+51.8)#2 | 2.6%(+52.1)#37 |
| 37. | Lenox Dale | 53.2% | 2.8%(+50.4)#1 | 2.6%(+50.6)#38 |
| 38. | Marrowbone | 50.0% | 2.3%(+47.7)#2 | 2.6%(+47.4)#39 |
| 39. | Northwest Stanwood | 50.0% | 2.4%(+47.6)#2 | 2.6%(+47.4)#40 |
| 40. | Port Alexander | 50.0% | 2.9%(+47.1)#2 | 2.6%(+47.4)#41 |
| 41. | Inverness | 50.0% | 2.6%(+47.4)#2 | 2.6%(+47.4)#42 |
| 42. | The Ponds | 49.3% | 2.7%(+46.6)#1 | 2.6%(+46.7)#43 |
| 43. | Fountaintown | 48.8% | 2.3%(+46.5)#4 | 2.6%(+46.2)#44 |
| 44. | Gardner | 48.6% | 2.8%(+45.8)#3 | 2.6%(+46.1)#45 |
| 45. | Frytown | 48.6% | 2.7%(+45.8)#1 | 2.6%(+46.0)#46 |
| 46. | Paisano Park | 47.4% | 2.3%(+45.0)#2 | 2.6%(+44.8)#47 |
| 47. | Concow | 47.2% | 2.7%(+44.5)#4 | 2.6%(+44.7)#48 |
| 48. | Empire | 46.9% | 4.4%(+42.5)#2 | 2.6%(+44.4)#49 |
| 49. | Proctor | 46.7% | 2.3%(+44.3)#3 | 2.6%(+44.1)#50 |
| 50. | Roosevelt Estates | 46.3% | 2.5%(+43.8)#2 | 2.6%(+43.7)#51 |
| 51. | Melvin Village | 45.8% | 2.5%(+43.4)#1 | 2.6%(+43.3)#52 |
| 52. | Hatton | 45.3% | 2.3%(+43.0)#2 | 2.6%(+42.7)#53 |
| 53. | Kelly | 45.0% | 2.7%(+42.3)#1 | 2.6%(+42.4)#54 |
| 54. | Cedar | 45.0% | 2.4%(+42.6)#1 | 2.6%(+42.4)#55 |
| 55. | Langdon | 45.0% | 2.6%(+42.4)#2 | 2.6%(+42.4)#56 |
| 56. | Paris | 44.4% | 2.4%(+42.0)#2 | 2.6%(+41.9)#57 |
| 57. | Selfridge | 43.4% | 2.9%(+40.6)#5 | 2.6%(+40.9)#58 |
| 58. | Dukedom | 42.9% | 2.2%(+40.6)#1 | 2.6%(+40.3)#59 |
| 59. | Van Tassell | 42.9% | 2.7%(+40.1)#2 | 2.6%(+40.3)#60 |
| 60. | Bay Lake | 41.0% | 2.8%(+38.2)#4 | 2.6%(+38.5)#61 |
| 61. | Brookfield | 40.4% | 2.7%(+37.8)#2 | 2.6%(+37.8)#62 |
| 62. | Rayle | 39.4% | 2.3%(+37.1)#2 | 2.6%(+36.8)#63 |
| 63. | Ball Club | 39.4% | 2.5%(+36.9)#1 | 2.6%(+36.8)#64 |
| 64. | Brandt | 38.9% | 2.2%(+36.7)#1 | 2.6%(+36.3)#65 |
| 65. | Fontanelle | 38.9% | 2.8%(+36.1)#1 | 2.6%(+36.3)#66 |
| 66. | Rio En Medio | 38.8% | 2.4%(+36.4)#3 | 2.6%(+36.2)#67 |
| 67. | Bloomington | 38.7% | 2.6%(+36.1)#3 | 2.6%(+36.1)#68 |
| 68. | Revloc | 38.6% | 2.4%(+36.2)#2 | 2.6%(+36.1)#69 |
| 69. | Humboldt River Ranch | 38.5% | 4.4%(+34.0)#3 | 2.6%(+35.9)#70 |
| 70. | Dutch John | 38.5% | 2.5%(+35.9)#1 | 2.6%(+35.9)#71 |
| 71. | Driscoll | 37.9% | 2.3%(+35.6)#4 | 2.6%(+35.4)#72 |
| 72. | White Oak | 37.9% | 2.4%(+35.4)#2 | 2.6%(+35.3)#73 |
| 73. | Fair Oaks | 37.0% | 2.3%(+34.8)#5 | 2.6%(+34.5)#74 |
| 74. | Hillsboro | 37.0% | 2.6%(+34.4)#1 | 2.6%(+34.4)#75 |
| 75. | Bridgeville | 36.8% | 3.0%(+33.8)#1 | 2.6%(+34.2)#76 |
| 76. | Fort Wingate | 36.4% | 2.4%(+33.9)#4 | 2.6%(+33.8)#77 |
| 77. | Dorchester | 36.4% | 2.3%(+34.0)#5 | 2.6%(+33.8)#78 |
| 78. | Toad Hop | 36.1% | 2.3%(+33.8)#6 | 2.6%(+33.5)#79 |
| 79. | Hico | 36.1% | 2.2%(+33.9)#2 | 2.6%(+33.5)#80 |
| 80. | Heritage Bay | 36.1% | 2.8%(+33.2)#5 | 2.6%(+33.5)#81 |
| 81. | Crooked Creek | 36.0% | 2.2%(+33.9)#3 | 2.6%(+33.5)#82 |
| 82. | Raleigh | 35.8% | 2.8%(+32.9)#6 | 2.6%(+33.2)#83 |
| 83. | Foresthill | 35.5% | 2.7%(+32.8)#5 | 2.6%(+32.9)#84 |
| 84. | Woodland | 35.4% | 2.3%(+33.2)#3 | 2.6%(+32.9)#85 |
| 85. | Albion | 35.4% | 2.7%(+32.6)#2 | 2.6%(+32.8)#86 |
| 86. | Acton | 35.1% | 2.6%(+32.6)#3 | 2.6%(+32.6)#87 |
| 87. | Olmito And Olmito | 34.9% | 2.3%(+32.5)#6 | 2.6%(+32.3)#88 |
| 88. | Helix | 34.9% | 2.4%(+32.5)#2 | 2.6%(+32.3)#89 |
| 89. | Boykin | 34.3% | 2.4%(+31.9)#1 | 2.6%(+31.8)#90 |
| 90. | Sun Valley | 34.3% | 2.5%(+31.8)#3 | 2.6%(+31.7)#91 |
| 91. | El Rancho Vela | 34.0% | 2.3%(+31.7)#7 | 2.6%(+31.5)#92 |
| 92. | Gause | 34.0% | 2.3%(+31.6)#8 | 2.6%(+31.4)#93 |
| 93. | Elberta | 33.3% | 2.4%(+30.9)#3 | 2.6%(+30.8)#94 |
| 94. | Glenn Springs | 33.3% | 2.4%(+30.9)#2 | 2.6%(+30.8)#95 |
| 95. | Shawneetown | 33.3% | 2.4%(+30.9)#1 | 2.6%(+30.8)#96 |
| 96. | Springhill | 33.3% | 2.8%(+30.5)#7 | 2.6%(+30.8)#97 |
| 97. | Hat Creek | 33.3% | 2.7%(+30.6)#6 | 2.6%(+30.8)#98 |
| 98. | Fairview | 33.3% | 2.2%(+31.1)#2 | 2.6%(+30.8)#99 |
| 99. | Stanley | 33.0% | 2.4%(+30.6)#1 | 2.6%(+30.5)#100 |
| 100. | Robertsville | 32.8% | 2.2%(+30.7)#3 | 2.6%(+30.3)#101 |
Common Questions
What are the Top 10 Cities with the Highest Percentage of Population Employed in Personal Care and Service in the United States?
Top 10 Cities with the Highest Percentage of Population Employed in Personal Care and Service in the United States are:
#1
100.0%
#2
100.0%
#3
100.0%
#4
100.0%
#5
100.0%
#6
100.0%
#7
100.0%
#8
100.0%
#9
89.0%
#10
85.0%
What city has the Highest Percentage of Population Employed in Personal Care and Service in the United States?
Franklin has the Highest Percentage of Population Employed in Personal Care and Service in the United States with 100.0%.
What is the Percentage of Population Employed in Personal Care and Service in the United States?
Percentage of Population Employed in Personal Care and Service in the United States is 2.6%.