Cities with the Highest Percentage of Households Residing in Detached Homes in the United States
RELATED REPORTS & OPTIONS
Detached Home Residency
United States
Compare Cities
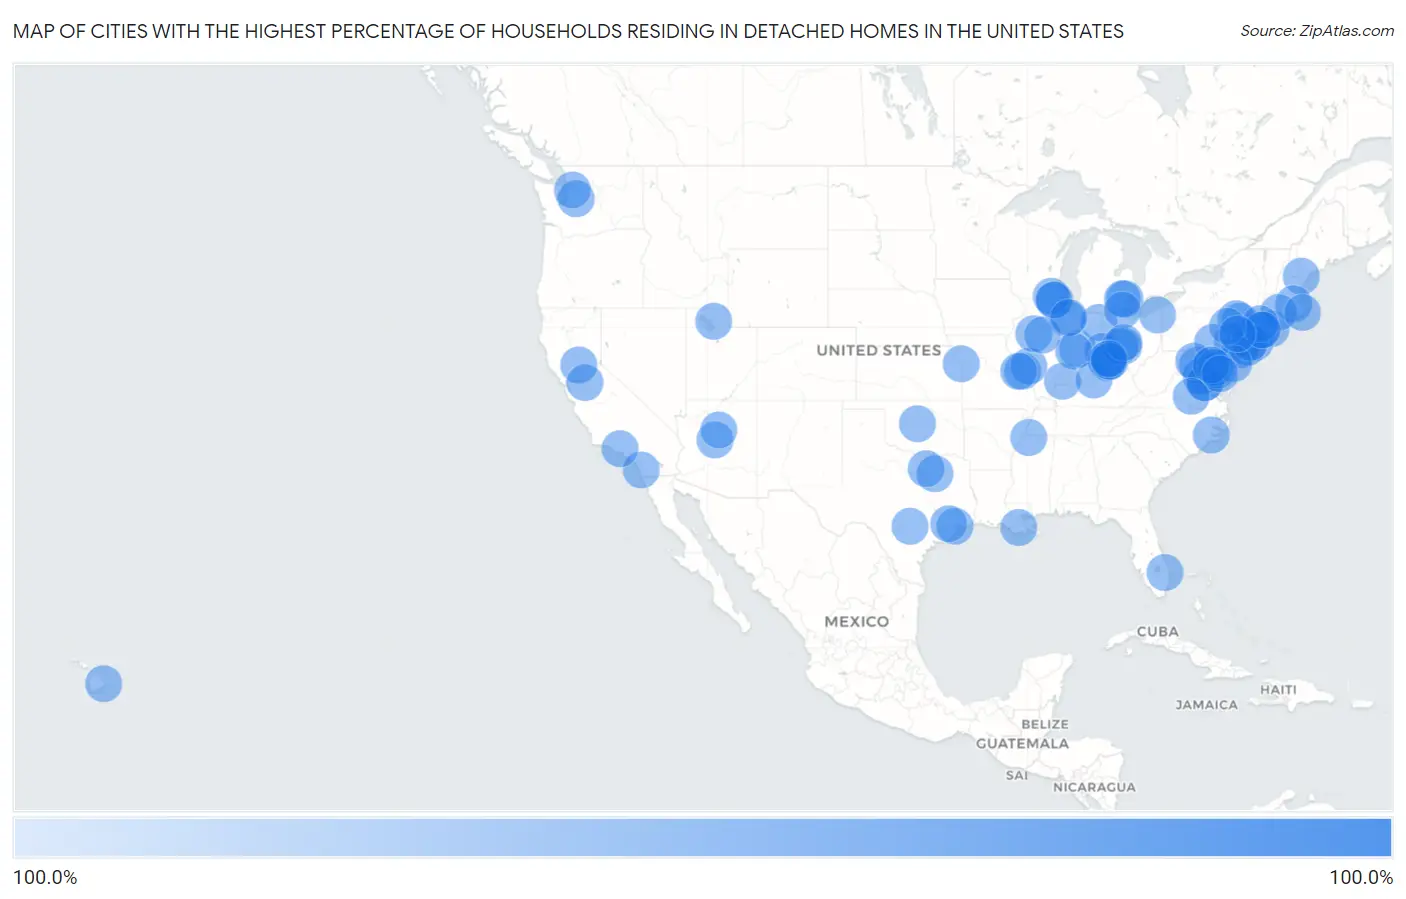
Map of Cities with the Highest Percentage of Households Residing in Detached Homes in the United States
0.0%
100.0%
Cities with the Highest Percentage of Households Residing in Detached Homes in the United States
| City | Detached Home Residency | vs State | vs National | |
| 1. | Cottonwood | 100.0% | 65.6%(+34.4)#1 | 62.5%(+37.5)#1 |
| 2. | Blackwells Mills | 100.0% | 53.5%(+46.5)#1 | 62.5%(+37.5)#2 |
| 3. | Travis Ranch | 100.0% | 66.1%(+33.9)#1 | 62.5%(+37.5)#3 |
| 4. | Lake Of The Woods | 100.0% | 61.8%(+38.2)#1 | 62.5%(+37.5)#4 |
| 5. | Plumas Lake | 100.0% | 58.0%(+42.0)#1 | 62.5%(+37.5)#5 |
| 6. | Villanova | 100.0% | 57.5%(+42.5)#1 | 62.5%(+37.5)#6 |
| 7. | Plain City | 100.0% | 69.0%(+31.0)#1 | 62.5%(+37.5)#7 |
| 8. | Piedmont | 100.0% | 74.4%(+25.6)#1 | 62.5%(+37.5)#8 |
| 9. | Dry Run | 100.0% | 70.5%(+29.5)#1 | 62.5%(+37.5)#9 |
| 10. | East Shoreham | 100.0% | 41.6%(+58.4)#1 | 62.5%(+37.5)#10 |
| 11. | Aquia Harbour | 100.0% | 61.8%(+38.2)#2 | 62.5%(+37.5)#11 |
| 12. | Belterra | 100.0% | 66.1%(+33.9)#2 | 62.5%(+37.5)#12 |
| 13. | Huntington Woods | 100.0% | 72.4%(+27.6)#1 | 62.5%(+37.5)#13 |
| 14. | Glendale | 100.0% | 71.9%(+28.1)#1 | 62.5%(+37.5)#14 |
| 15. | Kings Point | 100.0% | 41.6%(+58.4)#2 | 62.5%(+37.5)#15 |
| 16. | Highland | 100.0% | 74.4%(+25.6)#1 | 62.5%(+37.5)#16 |
| 17. | Lake Darby | 100.0% | 70.5%(+29.5)#2 | 62.5%(+37.5)#17 |
| 18. | Medford Lakes Borough | 100.0% | 53.5%(+46.5)#2 | 62.5%(+37.5)#18 |
| 19. | Garden Ridge | 100.0% | 66.1%(+33.9)#3 | 62.5%(+37.5)#19 |
| 20. | Shenandoah Farms | 100.0% | 61.8%(+38.2)#3 | 62.5%(+37.5)#20 |
| 21. | Ainaloa | 100.0% | 56.0%(+44.0)#1 | 62.5%(+37.5)#21 |
| 22. | Pittsboro | 100.0% | 74.4%(+25.6)#2 | 62.5%(+37.5)#22 |
| 23. | Brices Creek | 100.0% | 66.4%(+33.6)#1 | 62.5%(+37.5)#23 |
| 24. | Taylor Lake Village | 100.0% | 66.1%(+33.9)#4 | 62.5%(+37.5)#24 |
| 25. | Santa Rita Ranch | 100.0% | 66.1%(+33.9)#5 | 62.5%(+37.5)#25 |
| 26. | Leo Cedarville | 100.0% | 74.4%(+25.6)#3 | 62.5%(+37.5)#26 |
| 27. | Hemlock Farms | 100.0% | 57.5%(+42.5)#2 | 62.5%(+37.5)#27 |
| 28. | Mission Hills | 100.0% | 73.4%(+26.6)#1 | 62.5%(+37.5)#28 |
| 29. | Lake Lakengren | 100.0% | 70.5%(+29.5)#3 | 62.5%(+37.5)#29 |
| 30. | Muttontown | 100.0% | 41.6%(+58.4)#3 | 62.5%(+37.5)#30 |
| 31. | Pottsgrove | 100.0% | 57.5%(+42.5)#3 | 62.5%(+37.5)#31 |
| 32. | Madera Ranchos | 100.0% | 58.0%(+42.0)#2 | 62.5%(+37.5)#32 |
| 33. | Holiday Shores | 100.0% | 59.6%(+40.4)#1 | 62.5%(+37.5)#33 |
| 34. | Shorewood Forest | 100.0% | 74.4%(+25.6)#4 | 62.5%(+37.5)#34 |
| 35. | Lake Land Or | 100.0% | 61.8%(+38.2)#4 | 62.5%(+37.5)#35 |
| 36. | Red Rock Cdp Pinal County | 100.0% | 65.6%(+34.4)#2 | 62.5%(+37.5)#36 |
| 37. | Piney Point Village | 100.0% | 66.1%(+33.9)#6 | 62.5%(+37.5)#37 |
| 38. | Double Oak | 100.0% | 66.1%(+33.9)#7 | 62.5%(+37.5)#38 |
| 39. | Fairbanks Ranch | 100.0% | 58.0%(+42.0)#3 | 62.5%(+37.5)#39 |
| 40. | Shark River Hills | 100.0% | 53.5%(+46.5)#3 | 62.5%(+37.5)#40 |
| 41. | Turnersville | 100.0% | 53.5%(+46.5)#4 | 62.5%(+37.5)#41 |
| 42. | Lake Arrowhead | 100.0% | 67.4%(+32.6)#1 | 62.5%(+37.5)#42 |
| 43. | Bridgetown | 100.0% | 70.8%(+29.2)#1 | 62.5%(+37.5)#43 |
| 44. | Stockton University | 100.0% | 53.5%(+46.5)#5 | 62.5%(+37.5)#44 |
| 45. | Heritage Lake | 100.0% | 74.4%(+25.6)#5 | 62.5%(+37.5)#45 |
| 46. | Venetian Village | 100.0% | 59.6%(+40.4)#2 | 62.5%(+37.5)#46 |
| 47. | Marquette Heights | 100.0% | 59.6%(+40.4)#3 | 62.5%(+37.5)#47 |
| 48. | Evendale | 100.0% | 70.5%(+29.5)#4 | 62.5%(+37.5)#48 |
| 49. | Ravensworth | 100.0% | 61.8%(+38.2)#5 | 62.5%(+37.5)#49 |
| 50. | Franklin | 100.0% | 72.4%(+27.6)#2 | 62.5%(+37.5)#50 |
| 51. | Lake Caroline | 100.0% | 61.8%(+38.2)#6 | 62.5%(+37.5)#51 |
| 52. | Bushland | 100.0% | 66.1%(+33.9)#8 | 62.5%(+37.5)#52 |
| 53. | Clarkson Valley | 100.0% | 71.9%(+28.1)#2 | 62.5%(+37.5)#53 |
| 54. | Dover | 100.0% | 51.3%(+48.7)#1 | 62.5%(+37.5)#54 |
| 55. | Pleasantdale | 100.0% | 53.5%(+46.5)#6 | 62.5%(+37.5)#55 |
| 56. | Cedar Crest | 100.0% | 51.3%(+48.7)#2 | 62.5%(+37.5)#56 |
| 57. | Presidential Lakes Estates | 100.0% | 53.5%(+46.5)#7 | 62.5%(+37.5)#57 |
| 58. | Vista Center | 100.0% | 53.5%(+46.5)#8 | 62.5%(+37.5)#58 |
| 59. | Bohners Lake | 100.0% | 66.5%(+33.5)#1 | 62.5%(+37.5)#59 |
| 60. | Fox Lake Hills | 100.0% | 59.6%(+40.4)#4 | 62.5%(+37.5)#60 |
| 61. | Shawneeland | 100.0% | 61.8%(+38.2)#7 | 62.5%(+37.5)#61 |
| 62. | Elk Creek | 100.0% | 69.1%(+30.9)#1 | 62.5%(+37.5)#62 |
| 63. | Day Heights | 100.0% | 70.5%(+29.5)#5 | 62.5%(+37.5)#63 |
| 64. | Dunkirk | 100.0% | 52.9%(+47.1)#1 | 62.5%(+37.5)#64 |
| 65. | Riverview | 100.0% | 60.5%(+39.5)#1 | 62.5%(+37.5)#65 |
| 66. | Messiah College | 100.0% | 57.5%(+42.5)#4 | 62.5%(+37.5)#66 |
| 67. | Coventry Lake | 100.0% | 59.8%(+40.2)#1 | 62.5%(+37.5)#67 |
| 68. | Hudson | 100.0% | 59.6%(+40.4)#5 | 62.5%(+37.5)#68 |
| 69. | White Island Shores | 100.0% | 51.3%(+48.7)#3 | 62.5%(+37.5)#69 |
| 70. | Detroit Beach | 100.0% | 72.4%(+27.6)#3 | 62.5%(+37.5)#70 |
| 71. | Bear Creek Ranch | 100.0% | 66.1%(+33.9)#9 | 62.5%(+37.5)#71 |
| 72. | Putnamville | 100.0% | 74.4%(+25.6)#6 | 62.5%(+37.5)#72 |
| 73. | Choctaw Lake | 100.0% | 70.5%(+29.5)#6 | 62.5%(+37.5)#73 |
| 74. | Terrace Park | 100.0% | 70.5%(+29.5)#7 | 62.5%(+37.5)#74 |
| 75. | Presquille | 100.0% | 68.1%(+31.9)#1 | 62.5%(+37.5)#75 |
| 76. | The Hideout | 100.0% | 57.5%(+42.5)#5 | 62.5%(+37.5)#76 |
| 77. | Bedford | 100.0% | 41.6%(+58.4)#4 | 62.5%(+37.5)#77 |
| 78. | Laurel Hollow | 100.0% | 41.6%(+58.4)#5 | 62.5%(+37.5)#78 |
| 79. | Kent Estates | 100.0% | 73.8%(+26.2)#1 | 62.5%(+37.5)#79 |
| 80. | Riverbend | 100.0% | 63.1%(+36.9)#1 | 62.5%(+37.5)#80 |
| 81. | Queensland | 100.0% | 52.9%(+47.1)#2 | 62.5%(+37.5)#81 |
| 82. | Roaming Shores | 100.0% | 70.5%(+29.5)#8 | 62.5%(+37.5)#82 |
| 83. | Mickleton | 100.0% | 53.5%(+46.5)#9 | 62.5%(+37.5)#83 |
| 84. | Beech Mountain Lakes | 100.0% | 57.5%(+42.5)#6 | 62.5%(+37.5)#84 |
| 85. | Hampden Sydney | 100.0% | 61.8%(+38.2)#8 | 62.5%(+37.5)#85 |
| 86. | New California | 100.0% | 70.5%(+29.5)#9 | 62.5%(+37.5)#86 |
| 87. | Chevy Chase Village | 100.0% | 52.9%(+47.1)#3 | 62.5%(+37.5)#87 |
| 88. | Monroe North | 100.0% | 63.1%(+36.9)#2 | 62.5%(+37.5)#88 |
| 89. | Westlake | 100.0% | 58.2%(+41.8)#1 | 62.5%(+37.5)#89 |
| 90. | Salt Creek Commons | 100.0% | 74.4%(+25.6)#7 | 62.5%(+37.5)#90 |
| 91. | Linden | 100.0% | 58.0%(+42.0)#4 | 62.5%(+37.5)#91 |
| 92. | Mill Plain | 100.0% | 59.8%(+40.2)#2 | 62.5%(+37.5)#92 |
| 93. | Raintree Plantation | 100.0% | 71.9%(+28.1)#3 | 62.5%(+37.5)#93 |
| 94. | Old Orchard | 100.0% | 57.5%(+42.5)#7 | 62.5%(+37.5)#94 |
| 95. | Loveland Park | 100.0% | 70.5%(+29.5)#10 | 62.5%(+37.5)#95 |
| 96. | North Industry | 100.0% | 70.5%(+29.5)#11 | 62.5%(+37.5)#96 |
| 97. | Bell Canyon | 100.0% | 58.0%(+42.0)#5 | 62.5%(+37.5)#97 |
| 98. | Long Beach | 100.0% | 52.9%(+47.1)#4 | 62.5%(+37.5)#98 |
| 99. | Fort Valley | 100.0% | 65.6%(+34.4)#3 | 62.5%(+37.5)#99 |
| 100. | Berry College | 100.0% | 68.0%(+32.0)#1 | 62.5%(+37.5)#100 |
Common Questions
What are the Top 10 Cities with the Highest Percentage of Households Residing in Detached Homes in the United States?
Top 10 Cities with the Highest Percentage of Households Residing in Detached Homes in the United States are:
#1
100.0%
#2
100.0%
#3
100.0%
#4
100.0%
#5
100.0%
#6
100.0%
#7
100.0%
#8
100.0%
#9
100.0%
#10
100.0%
What city has the Highest Percentage of Households Residing in Detached Homes in the United States?
Cottonwood has the Highest Percentage of Households Residing in Detached Homes in the United States with 100.0%.
What is the Percentage of Households Residing in Detached Homes in the United States?
Percentage of Households Residing in Detached Homes in the United States is 62.5%.