Cities with the Most Immigrants from South Africa in the United States
RELATED REPORTS & OPTIONS
South Africa
United States
Compare Cities
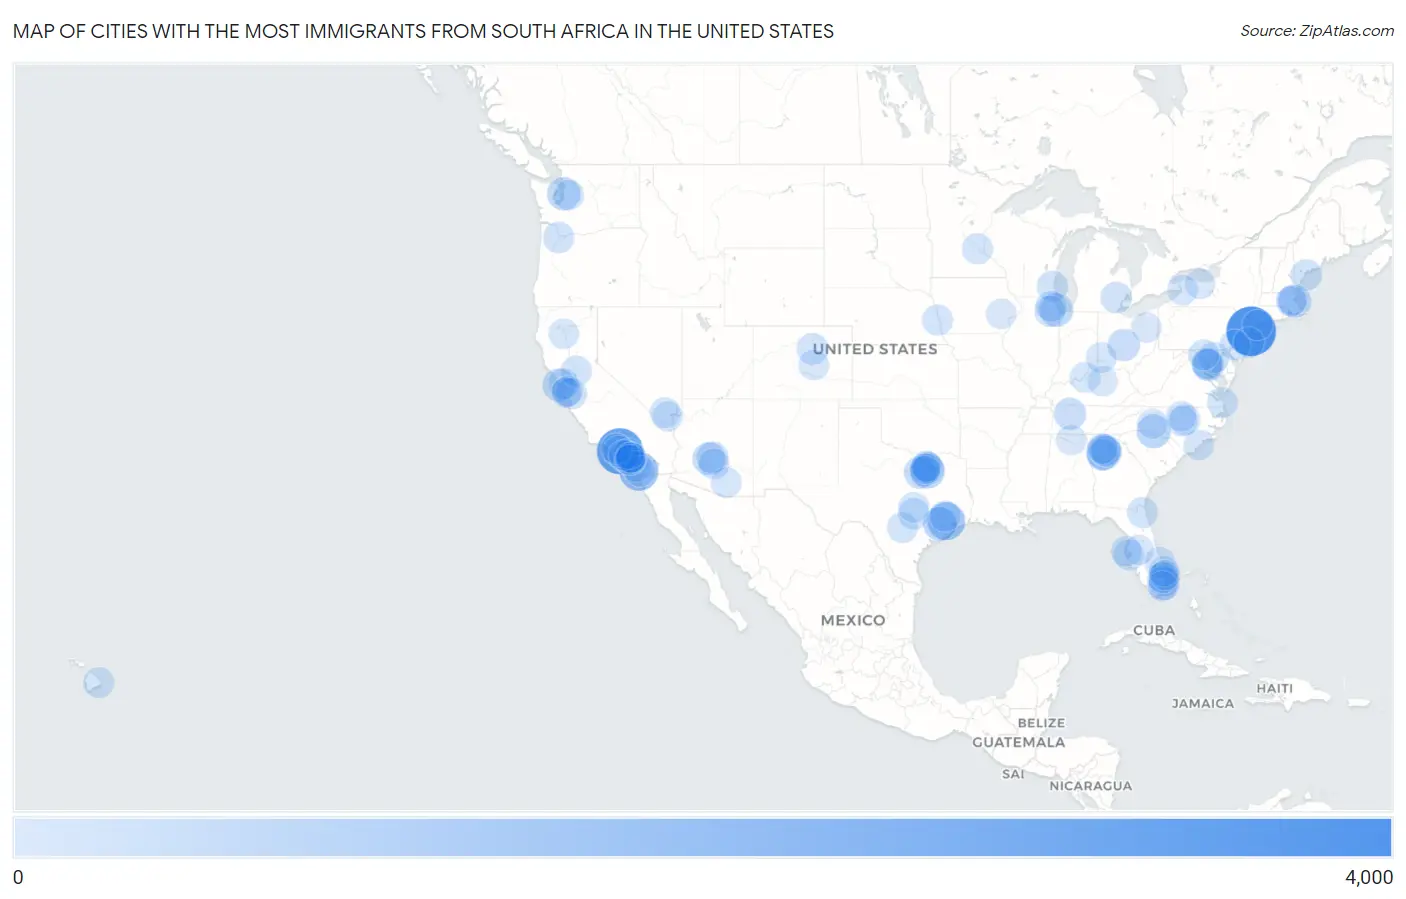
Map of Cities with the Most Immigrants from South Africa in the United States
0
4,000
Cities with the Most Immigrants from South Africa in the United States
| City | South Africa | vs State | vs National | |
| 1. | New York | 3,931 | 8,010(49.08%)#1 | 117,055(3.36%)#1 |
| 2. | Los Angeles | 3,232 | 20,614(15.68%)#1 | 117,055(2.76%)#2 |
| 3. | San Diego | 1,810 | 20,614(8.78%)#2 | 117,055(1.55%)#3 |
| 4. | Houston | 1,578 | 11,402(13.84%)#1 | 117,055(1.35%)#4 |
| 5. | Sandy Springs | 956 | 6,116(15.63%)#1 | 117,055(0.82%)#5 |
| 6. | Dallas | 933 | 11,402(8.18%)#2 | 117,055(0.80%)#6 |
| 7. | Charlotte | 855 | 4,673(18.30%)#1 | 117,055(0.73%)#7 |
| 8. | Fulshear | 826 | 11,402(7.24%)#3 | 117,055(0.71%)#8 |
| 9. | Irvine | 784 | 20,614(3.80%)#3 | 117,055(0.67%)#9 |
| 10. | Chicago | 767 | 2,988(25.67%)#1 | 117,055(0.66%)#10 |
| 11. | Seattle | 710 | 3,373(21.05%)#1 | 117,055(0.61%)#11 |
| 12. | San Francisco | 582 | 20,614(2.82%)#4 | 117,055(0.50%)#12 |
| 13. | Boston | 581 | 3,270(17.77%)#1 | 117,055(0.50%)#13 |
| 14. | Phoenix | 568 | 2,667(21.30%)#1 | 117,055(0.49%)#14 |
| 15. | Fort Worth | 539 | 11,402(4.73%)#4 | 117,055(0.46%)#15 |
| 16. | Columbus | 512 | 2,071(24.72%)#1 | 117,055(0.44%)#16 |
| 17. | Aventura | 502 | 11,243(4.47%)#1 | 117,055(0.43%)#17 |
| 18. | Nashville | 494 | 1,731(28.54%)#1 | 117,055(0.42%)#18 |
| 19. | Washington | 492 | 492(100.00%)#1 | 117,055(0.42%)#19 |
| 20. | Scottsdale | 425 | 2,667(15.94%)#2 | 117,055(0.36%)#20 |
| 21. | Atlanta | 361 | 6,116(5.90%)#2 | 117,055(0.31%)#21 |
| 22. | Denver | 358 | 2,472(14.48%)#1 | 117,055(0.31%)#22 |
| 23. | Novi | 357 | 1,677(21.29%)#1 | 117,055(0.30%)#23 |
| 24. | Alpharetta | 355 | 6,116(5.80%)#3 | 117,055(0.30%)#24 |
| 25. | Portland | 338 | 612(55.23%)#1 | 117,055(0.29%)#25 |
| 26. | San Jose | 309 | 20,614(1.50%)#5 | 117,055(0.26%)#26 |
| 27. | Milwaukee | 305 | 1,211(25.19%)#1 | 117,055(0.26%)#27 |
| 28. | Portland | 304 | 1,690(17.99%)#1 | 117,055(0.26%)#28 |
| 29. | Huntington Beach | 297 | 20,614(1.44%)#6 | 117,055(0.25%)#29 |
| 30. | Arlington | 293 | 2,829(10.36%)#1 | 117,055(0.25%)#30 |
| 31. | Mission Viejo | 293 | 20,614(1.42%)#7 | 117,055(0.25%)#31 |
| 32. | Austin | 292 | 11,402(2.56%)#5 | 117,055(0.25%)#32 |
| 33. | Richardson | 292 | 11,402(2.56%)#6 | 117,055(0.25%)#33 |
| 34. | Sacramento | 288 | 20,614(1.40%)#8 | 117,055(0.25%)#34 |
| 35. | Minneapolis | 288 | 1,401(20.56%)#1 | 117,055(0.25%)#35 |
| 36. | Baltimore | 283 | 3,203(8.84%)#1 | 117,055(0.24%)#36 |
| 37. | Plano | 279 | 11,402(2.45%)#7 | 117,055(0.24%)#37 |
| 38. | The Woodlands | 274 | 11,402(2.40%)#8 | 117,055(0.23%)#38 |
| 39. | Naperville | 273 | 2,988(9.14%)#2 | 117,055(0.23%)#39 |
| 40. | Boca Raton | 269 | 11,243(2.39%)#2 | 117,055(0.23%)#40 |
| 41. | Santa Monica | 268 | 20,614(1.30%)#9 | 117,055(0.23%)#41 |
| 42. | Schaumburg | 268 | 2,988(8.97%)#3 | 117,055(0.23%)#42 |
| 43. | Philadelphia | 266 | 2,787(9.54%)#1 | 117,055(0.23%)#43 |
| 44. | Johns Creek | 266 | 6,116(4.35%)#4 | 117,055(0.23%)#44 |
| 45. | Carlsbad | 263 | 20,614(1.28%)#10 | 117,055(0.22%)#45 |
| 46. | Bethesda | 263 | 3,203(8.21%)#2 | 117,055(0.22%)#46 |
| 47. | Jacksonville | 259 | 11,243(2.30%)#3 | 117,055(0.22%)#47 |
| 48. | Hawaiian Acres | 255 | 787(32.40%)#1 | 117,055(0.22%)#48 |
| 49. | Omaha | 249 | 636(39.15%)#1 | 117,055(0.21%)#49 |
| 50. | Port St Lucie | 244 | 11,243(2.17%)#4 | 117,055(0.21%)#50 |
| 51. | St Petersburg | 238 | 11,243(2.12%)#5 | 117,055(0.20%)#51 |
| 52. | Berkeley | 238 | 20,614(1.15%)#11 | 117,055(0.20%)#52 |
| 53. | Fort Lauderdale | 237 | 11,243(2.11%)#6 | 117,055(0.20%)#53 |
| 54. | Santee | 237 | 20,614(1.15%)#12 | 117,055(0.20%)#54 |
| 55. | San Antonio | 235 | 11,402(2.06%)#9 | 117,055(0.20%)#55 |
| 56. | Gilbert | 234 | 2,667(8.77%)#3 | 117,055(0.20%)#56 |
| 57. | Linganore | 230 | 3,203(7.18%)#3 | 117,055(0.20%)#57 |
| 58. | Lake Forest | 229 | 20,614(1.11%)#13 | 117,055(0.20%)#58 |
| 59. | Mountain View | 226 | 20,614(1.10%)#14 | 117,055(0.19%)#59 |
| 60. | Sammamish | 218 | 3,373(6.46%)#2 | 117,055(0.19%)#60 |
| 61. | Louisville | 216 | 723(29.88%)#1 | 117,055(0.18%)#61 |
| 62. | Fairfield | 216 | 2,071(10.43%)#2 | 117,055(0.18%)#62 |
| 63. | Virginia Beach | 207 | 2,829(7.32%)#2 | 117,055(0.18%)#63 |
| 64. | Lakewood | 206 | 3,369(6.11%)#1 | 117,055(0.18%)#64 |
| 65. | Yorba Linda | 204 | 20,614(0.99%)#15 | 117,055(0.17%)#65 |
| 66. | Calabasas | 203 | 20,614(0.98%)#16 | 117,055(0.17%)#66 |
| 67. | Parkland | 199 | 11,243(1.77%)#7 | 117,055(0.17%)#67 |
| 68. | Colorado Springs | 197 | 2,472(7.97%)#2 | 117,055(0.17%)#68 |
| 69. | Tucson | 194 | 2,667(7.27%)#4 | 117,055(0.17%)#69 |
| 70. | Long Beach | 192 | 20,614(0.93%)#17 | 117,055(0.16%)#70 |
| 71. | Raleigh | 190 | 4,673(4.07%)#2 | 117,055(0.16%)#71 |
| 72. | Cambridge | 187 | 3,270(5.72%)#2 | 117,055(0.16%)#72 |
| 73. | Las Vegas | 183 | 773(23.67%)#1 | 117,055(0.16%)#73 |
| 74. | Hampstead | 183 | 4,673(3.92%)#3 | 117,055(0.16%)#74 |
| 75. | Cary | 180 | 4,673(3.85%)#4 | 117,055(0.15%)#75 |
| 76. | Durham | 178 | 4,673(3.81%)#5 | 117,055(0.15%)#76 |
| 77. | Frisco | 178 | 11,402(1.56%)#10 | 117,055(0.15%)#77 |
| 78. | Georgetown | 177 | 11,402(1.55%)#11 | 117,055(0.15%)#78 |
| 79. | Clearwater | 176 | 11,243(1.57%)#8 | 117,055(0.15%)#79 |
| 80. | Buffalo | 173 | 8,010(2.16%)#2 | 117,055(0.15%)#80 |
| 81. | West Palm Beach | 170 | 11,243(1.51%)#9 | 117,055(0.15%)#81 |
| 82. | Redding | 168 | 20,614(0.81%)#18 | 117,055(0.14%)#82 |
| 83. | Henderson | 167 | 773(21.60%)#2 | 117,055(0.14%)#83 |
| 84. | Irving | 164 | 11,402(1.44%)#12 | 117,055(0.14%)#84 |
| 85. | Newton | 163 | 3,270(4.98%)#3 | 117,055(0.14%)#85 |
| 86. | Huntsville | 162 | 674(24.04%)#1 | 117,055(0.14%)#86 |
| 87. | Lake Norman Of Catawba | 161 | 4,673(3.45%)#6 | 117,055(0.14%)#87 |
| 88. | Holly Springs | 160 | 6,116(2.62%)#5 | 117,055(0.14%)#88 |
| 89. | Lakeland | 159 | 11,243(1.41%)#10 | 117,055(0.14%)#89 |
| 90. | Greentown | 158 | 2,071(7.63%)#3 | 117,055(0.13%)#90 |
| 91. | Coppell | 157 | 11,402(1.38%)#13 | 117,055(0.13%)#91 |
| 92. | Miami | 154 | 11,243(1.37%)#11 | 117,055(0.13%)#92 |
| 93. | Lexington | 152 | 723(21.02%)#2 | 117,055(0.13%)#93 |
| 94. | Boynton Beach | 152 | 11,243(1.35%)#12 | 117,055(0.13%)#94 |
| 95. | Iowa City | 151 | 719(21.00%)#1 | 117,055(0.13%)#95 |
| 96. | Old Greenwich | 151 | 1,972(7.66%)#1 | 117,055(0.13%)#96 |
| 97. | Rochester | 150 | 8,010(1.87%)#3 | 117,055(0.13%)#97 |
| 98. | Palo Alto | 149 | 20,614(0.72%)#19 | 117,055(0.13%)#98 |
| 99. | Laguna Niguel | 149 | 20,614(0.72%)#20 | 117,055(0.13%)#99 |
| 100. | Rancho Santa Margarita | 149 | 20,614(0.72%)#21 | 117,055(0.13%)#100 |
Common Questions
What are the Top 10 Cities with the Most Immigrants from South Africa in the United States?
Top 10 Cities with the Most Immigrants from South Africa in the United States are:
What city has the Most Immigrants from South Africa in the United States?
New York has the Most Immigrants from South Africa in the United States with 3,931.
What is the Total Immigrants from South Africa in the United States?
Total Immigrants from South Africa in the United States is 117,055.