Alaska Map & Demographics
Alaska Map
Alaska Overview
Jan 3, 1959
INCORPORATED
664,988
TOTAL AREA [ SQ MI ]
570,665
LAND AREA [ SQ MI ]
94,343
WATER AREA [ SQ MI ]
1,900
ELEVATION AVG [ FT ]
20,320
ELEVATION HIGH [ FT ]
Sea Level
ELEVATION LOW [ FT ]
1.3
POP DENSITY [ PPL / SQ MI ]
$42,828
PER CAPITA INCOME
$104,081
AVG FAMILY INCOME
$86,370
AVG HOUSEHOLD INCOME
24.7%
WAGE / INCOME GAP [ % ]
75.3¢/ $1
WAGE / INCOME GAP [ $ ]
$10,881
FAMILY INCOME DEFICIT
0.43
INEQUALITY / GINI INDEX
99654
LARGEST ZIP CODE
Anchorage
LARGEST CITY
Anchorage Municipality
LARGEST COUNTY
734,821
TOTAL POPULATION
386,649
MALE POPULATION
348,172
FEMALE POPULATION
111.05
MALES / 100 FEMALES
90.05
FEMALES / 100 MALES
35.3
MEDIAN AGE
3.3
AVG FAMILY SIZE
2.7
AVG HOUSEHOLD SIZE
382,857
LABOR FORCE [ PEOPLE ]
66.7%
PERCENT IN LABOR FORCE
6.4%
UNEMPLOYMENT RATE
Alaska Area Codes
Income in Alaska
Income Overview in Alaska
Per Capita Income in Alaska is $42,828, while median incomes of families and households are $104,081 and $86,370 respectively.
| Characteristic | Number | Measure |
| Per Capita Income | 734,821 | $42,828 |
| Median Family Income | 170,971 | $104,081 |
| Mean Family Income | 170,971 | $127,741 |
| Median Household Income | 264,376 | $86,370 |
| Mean Household Income | 264,376 | $110,602 |
| Income Deficit | 170,971 | $10,881 |
| Wage / Income Gap (%) | 734,821 | 24.66% |
| Wage / Income Gap ($) | 734,821 | 75.34¢ per $1 |
| Gini / Inequality Index | 734,821 | 0.43 |
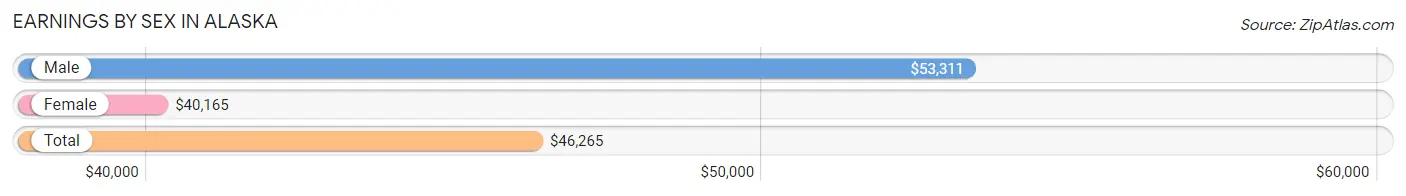
Earnings by Sex in Alaska
Average Earnings in Alaska are $46,265, $53,311 for men and $40,165 for women, a difference of 24.7%.
| Sex | Number | Average Earnings |
| Male | 228,031 (56.0%) | $53,311 |
| Female | 179,153 (44.0%) | $40,165 |
| Total | 407,184 (100.0%) | $46,265 |
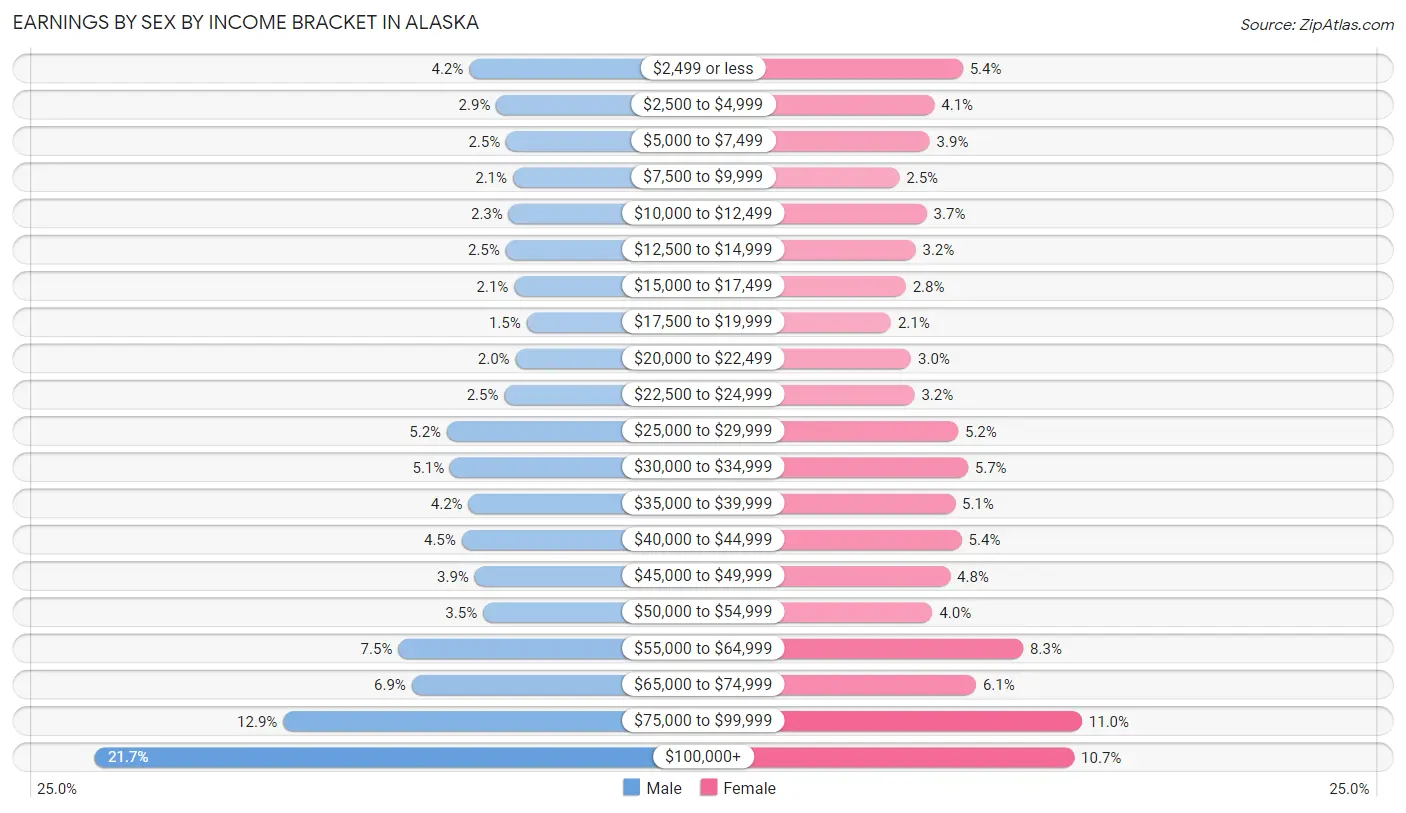
Earnings by Sex by Income Bracket in Alaska
The most common earnings brackets in Alaska are $100,000+ for men (49,492 | 21.7%) and $75,000 to $99,999 for women (19,727 | 11.0%).
| Income | Male | Female |
| $2,499 or less | 9,543 (4.2%) | 9,729 (5.4%) |
| $2,500 to $4,999 | 6,634 (2.9%) | 7,342 (4.1%) |
| $5,000 to $7,499 | 5,590 (2.5%) | 6,947 (3.9%) |
| $7,500 to $9,999 | 4,850 (2.1%) | 4,411 (2.5%) |
| $10,000 to $12,499 | 5,312 (2.3%) | 6,698 (3.7%) |
| $12,500 to $14,999 | 5,631 (2.5%) | 5,769 (3.2%) |
| $15,000 to $17,499 | 4,722 (2.1%) | 4,948 (2.8%) |
| $17,500 to $19,999 | 3,402 (1.5%) | 3,707 (2.1%) |
| $20,000 to $22,499 | 4,578 (2.0%) | 5,397 (3.0%) |
| $22,500 to $24,999 | 5,764 (2.5%) | 5,688 (3.2%) |
| $25,000 to $29,999 | 11,901 (5.2%) | 9,327 (5.2%) |
| $30,000 to $34,999 | 11,561 (5.1%) | 10,157 (5.7%) |
| $35,000 to $39,999 | 9,589 (4.2%) | 9,085 (5.1%) |
| $40,000 to $44,999 | 10,326 (4.5%) | 9,644 (5.4%) |
| $45,000 to $49,999 | 8,928 (3.9%) | 8,672 (4.8%) |
| $50,000 to $54,999 | 8,058 (3.5%) | 7,178 (4.0%) |
| $55,000 to $64,999 | 17,092 (7.5%) | 14,798 (8.3%) |
| $65,000 to $74,999 | 15,657 (6.9%) | 10,843 (6.0%) |
| $75,000 to $99,999 | 29,401 (12.9%) | 19,727 (11.0%) |
| $100,000+ | 49,492 (21.7%) | 19,086 (10.6%) |
| Total | 228,031 (100.0%) | 179,153 (100.0%) |
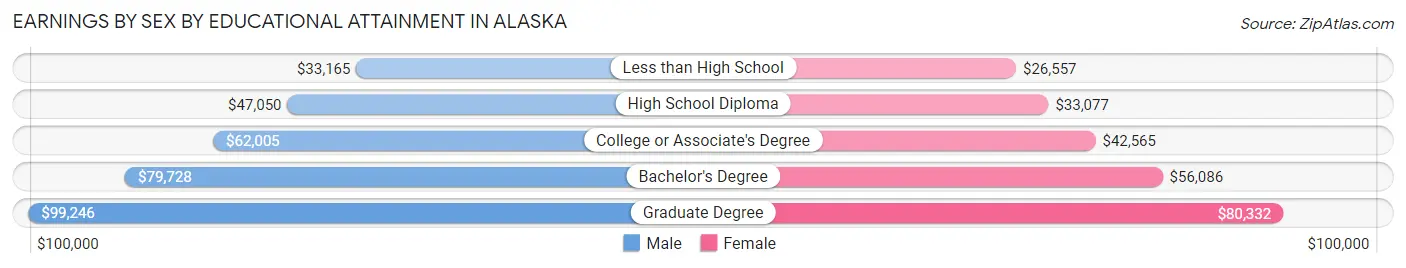
Earnings by Sex by Educational Attainment in Alaska
Average earnings in Alaska are $62,143 for men and $46,093 for women, a difference of 25.8%. Men with an educational attainment of graduate degree enjoy the highest average annual earnings of $99,246, while those with less than high school education earn the least with $33,165. Women with an educational attainment of graduate degree earn the most with the average annual earnings of $80,332, while those with less than high school education have the smallest earnings of $26,557.
| Educational Attainment | Male Income | Female Income |
| Less than High School | $33,165 | $26,557 |
| High School Diploma | $47,050 | $33,077 |
| College or Associate's Degree | $62,005 | $42,565 |
| Bachelor's Degree | $79,728 | $56,086 |
| Graduate Degree | $99,246 | $80,332 |
| Total | $62,143 | $46,093 |
Family Income in Alaska
Family Income Brackets in Alaska
According to the Alaska family income data, there are 38,981 families falling into the $100,000 to $149,999 income range, which is the most common income bracket and makes up 22.8% of all families. Conversely, the $10,000 to $14,999 income bracket is the least frequent group with only 2,394 families (1.4%) belonging to this category.
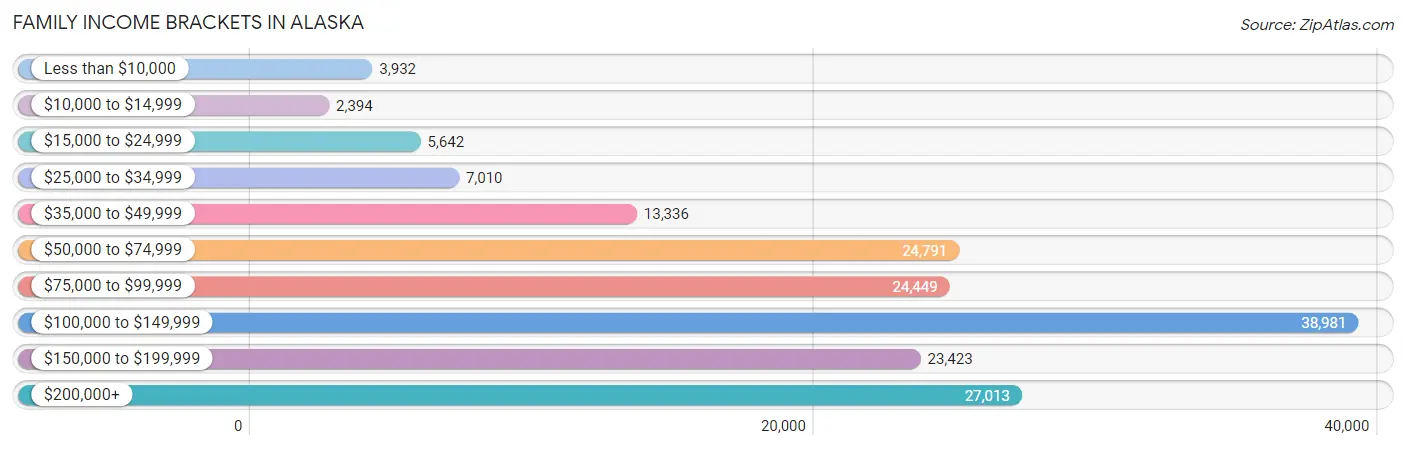
| Income Bracket | # Families | % Families |
| Less than $10,000 | 3,932 | 2.3% |
| $10,000 to $14,999 | 2,394 | 1.4% |
| $15,000 to $24,999 | 5,642 | 3.3% |
| $25,000 to $34,999 | 7,010 | 4.1% |
| $35,000 to $49,999 | 13,336 | 7.8% |
| $50,000 to $74,999 | 24,791 | 14.5% |
| $75,000 to $99,999 | 24,449 | 14.3% |
| $100,000 to $149,999 | 38,981 | 22.8% |
| $150,000 to $199,999 | 23,423 | 13.7% |
| $200,000+ | 27,013 | 15.8% |
Family Income by Famaliy Size in Alaska
4-person families (30,400 | 17.8%) account for the highest median family income in Alaska with $121,634 per family, while 2-person families (77,871 | 45.6%) have the highest median income of $46,266 per family member.
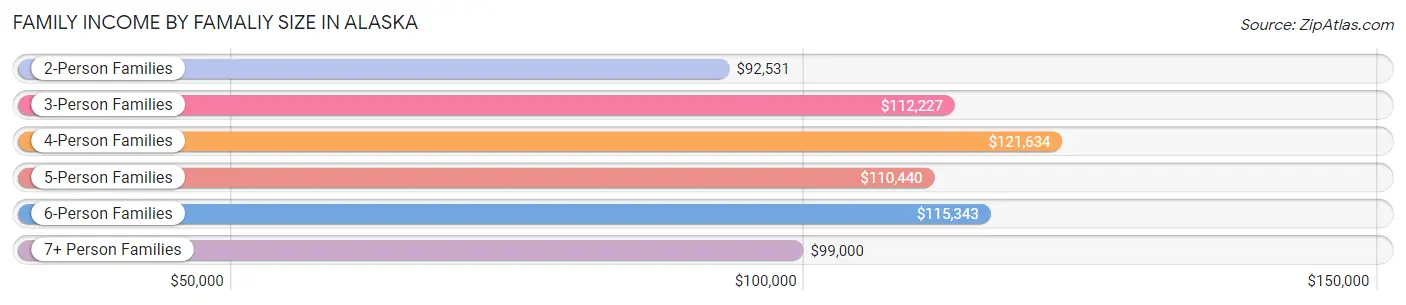
| Income Bracket | # Families | Median Income |
| 2-Person Families | 77,871 (45.6%) | $92,531 |
| 3-Person Families | 35,296 (20.6%) | $112,227 |
| 4-Person Families | 30,400 (17.8%) | $121,634 |
| 5-Person Families | 15,432 (9.0%) | $110,440 |
| 6-Person Families | 6,716 (3.9%) | $115,343 |
| 7+ Person Families | 5,256 (3.1%) | $99,000 |
| Total | 170,971 (100.0%) | $104,081 |
Family Income by Number of Earners in Alaska
The median family income in Alaska is $104,081, with families comprising 3+ earners (20,090) having the highest median family income of $160,157, while families with no earners (20,920) have the lowest median family income of $60,841, accounting for 11.7% and 12.2% of families, respectively.
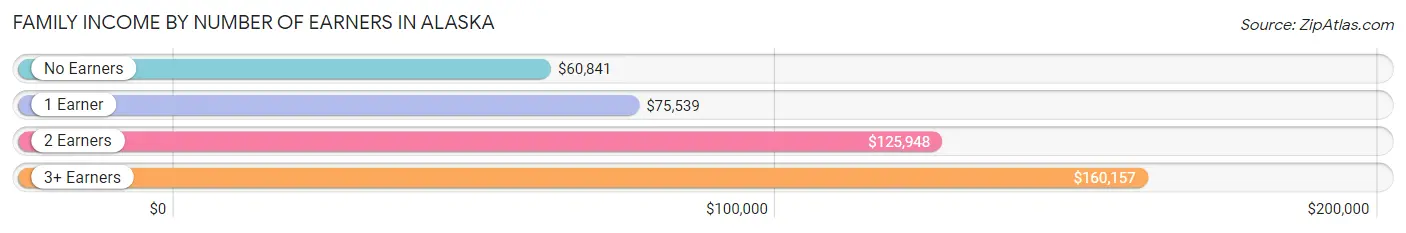
| Number of Earners | # Families | Median Income |
| No Earners | 20,920 (12.2%) | $60,841 |
| 1 Earner | 54,022 (31.6%) | $75,539 |
| 2 Earners | 75,939 (44.4%) | $125,948 |
| 3+ Earners | 20,090 (11.7%) | $160,157 |
| Total | 170,971 (100.0%) | $104,081 |
Household Income in Alaska
Household Income Brackets in Alaska
With 52,082 households falling in the category, the $100,000 to $149,999 income range is the most frequent in Alaska, accounting for 19.7% of all households. In contrast, only 6,609 households (2.5%) fall into the $10,000 to $14,999 income bracket, making it the least populous group.
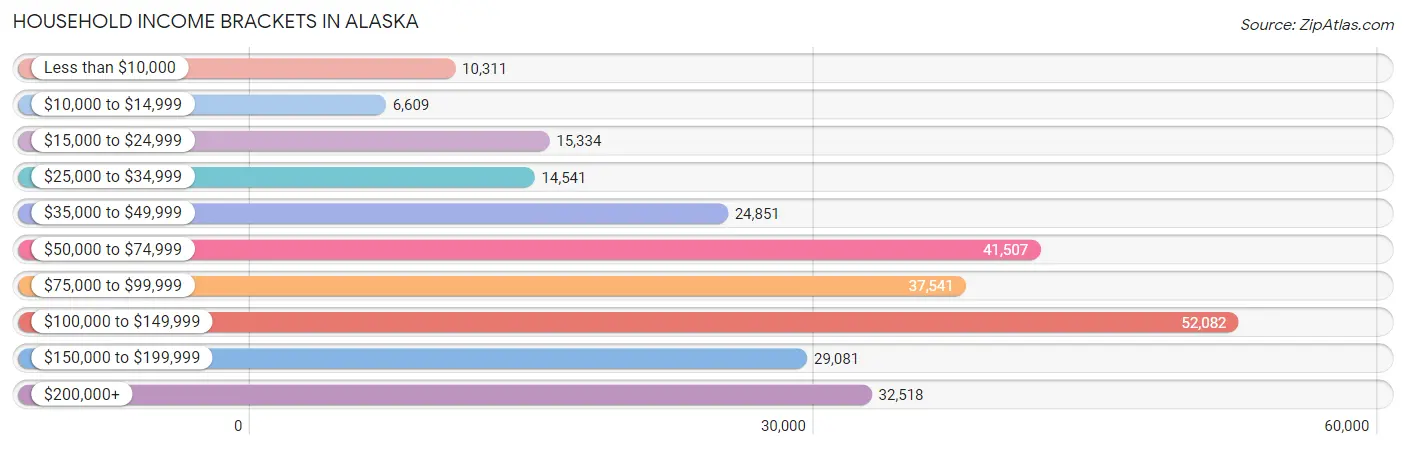
| Income Bracket | # Households | % Households |
| Less than $10,000 | 10,311 | 3.9% |
| $10,000 to $14,999 | 6,609 | 2.5% |
| $15,000 to $24,999 | 15,334 | 5.8% |
| $25,000 to $34,999 | 14,541 | 5.5% |
| $35,000 to $49,999 | 24,851 | 9.4% |
| $50,000 to $74,999 | 41,507 | 15.7% |
| $75,000 to $99,999 | 37,541 | 14.2% |
| $100,000 to $149,999 | 52,082 | 19.7% |
| $150,000 to $199,999 | 29,081 | 11.0% |
| $200,000+ | 32,518 | 12.3% |
Household Income by Householder Age in Alaska
The median household income in Alaska is $86,370, with the highest median household income of $101,971 found in the 45 to 64 years age bracket for the primary householder. A total of 96,957 households (36.7%) fall into this category. Meanwhile, the 15 to 24 years age bracket for the primary householder has the lowest median household income of $52,562, with 12,745 households (4.8%) in this group.
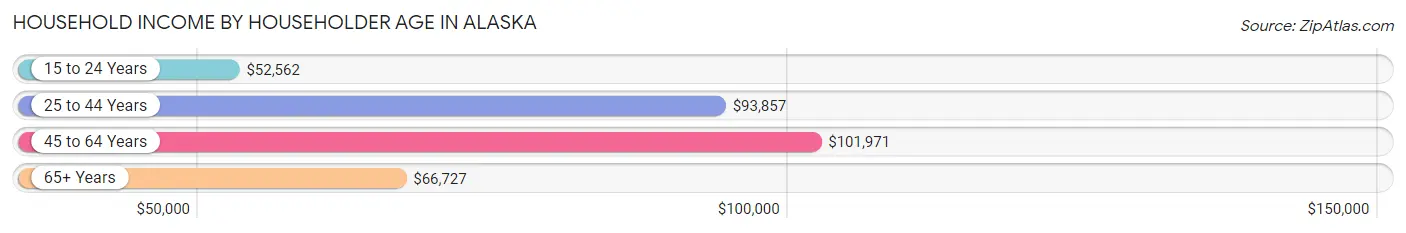
| Income Bracket | # Households | Median Income |
| 15 to 24 Years | 12,745 (4.8%) | $52,562 |
| 25 to 44 Years | 95,966 (36.3%) | $93,857 |
| 45 to 64 Years | 96,957 (36.7%) | $101,971 |
| 65+ Years | 58,708 (22.2%) | $66,727 |
| Total | 264,376 (100.0%) | $86,370 |
Poverty in Alaska
Income Below Poverty by Sex and Age in Alaska
With 9.7% poverty level for males and 11.3% for females among the residents of Alaska, under 5 year old males and under 5 year old females are the most vulnerable to poverty, with 3,842 males (15.5%) and 4,267 females (18.3%) in their respective age groups living below the poverty level.
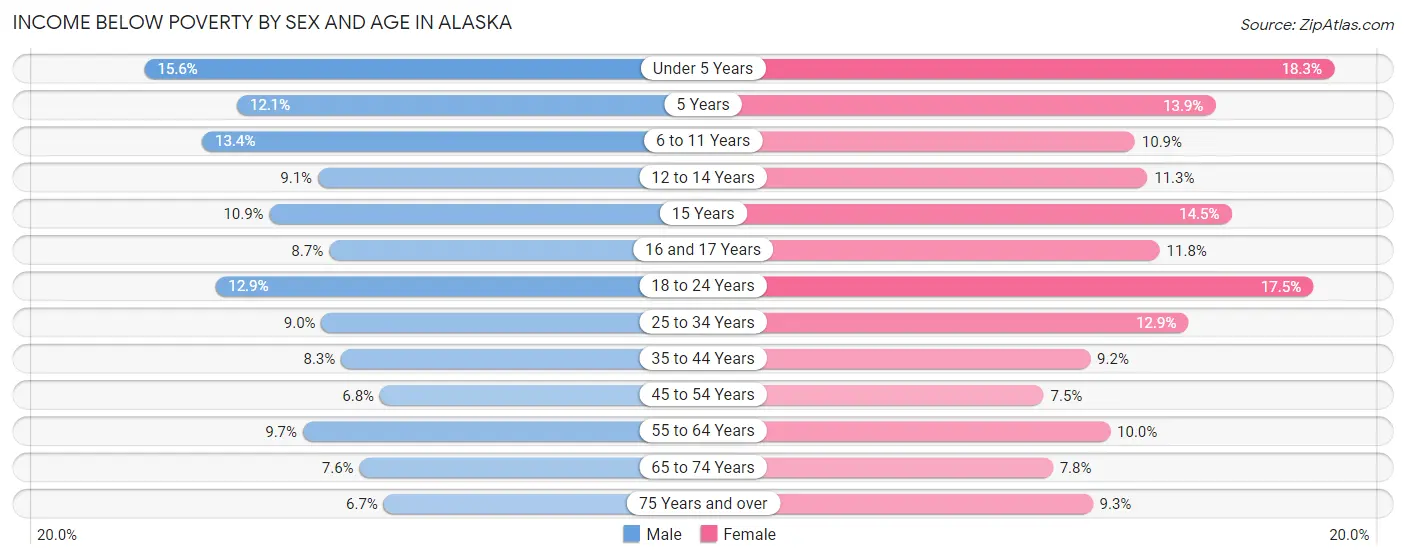
| Age Bracket | Male | Female |
| Under 5 Years | 3,842 (15.5%) | 4,267 (18.3%) |
| 5 Years | 579 (12.1%) | 752 (13.9%) |
| 6 to 11 Years | 4,178 (13.4%) | 3,201 (10.9%) |
| 12 to 14 Years | 1,360 (9.1%) | 1,521 (11.3%) |
| 15 Years | 565 (10.9%) | 749 (14.5%) |
| 16 and 17 Years | 827 (8.7%) | 1,037 (11.8%) |
| 18 to 24 Years | 4,523 (12.9%) | 5,005 (17.5%) |
| 25 to 34 Years | 5,322 (9.0%) | 6,810 (12.9%) |
| 35 to 44 Years | 4,181 (8.3%) | 4,304 (9.2%) |
| 45 to 54 Years | 3,074 (6.8%) | 2,977 (7.5%) |
| 55 to 64 Years | 4,581 (9.7%) | 4,332 (10.0%) |
| 65 to 74 Years | 2,469 (7.6%) | 2,368 (7.8%) |
| 75 Years and over | 902 (6.7%) | 1,501 (9.3%) |
| Total | 36,403 (9.7%) | 38,824 (11.3%) |
Income Above Poverty by Sex and Age in Alaska
According to the poverty statistics in Alaska, males aged 75 years and over and females aged 45 to 54 years are the age groups that are most secure financially, with 93.3% of males and 92.5% of females in these age groups living above the poverty line.
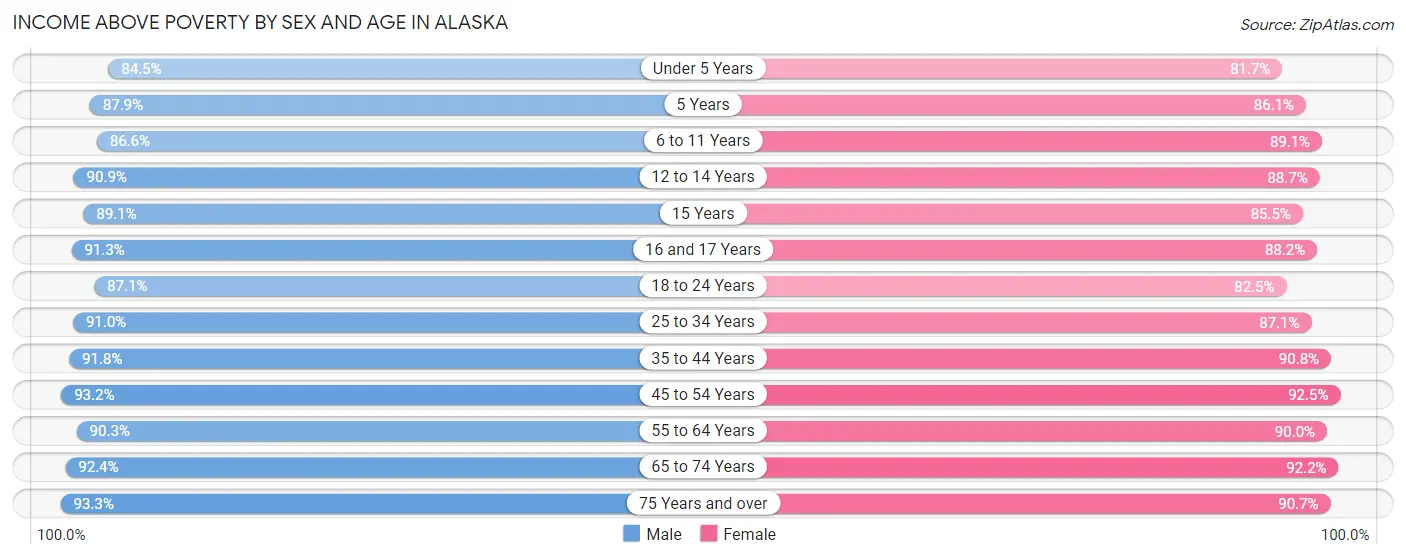
| Age Bracket | Male | Female |
| Under 5 Years | 20,866 (84.5%) | 19,103 (81.7%) |
| 5 Years | 4,200 (87.9%) | 4,675 (86.1%) |
| 6 to 11 Years | 26,984 (86.6%) | 26,228 (89.1%) |
| 12 to 14 Years | 13,575 (90.9%) | 11,892 (88.7%) |
| 15 Years | 4,613 (89.1%) | 4,431 (85.5%) |
| 16 and 17 Years | 8,684 (91.3%) | 7,753 (88.2%) |
| 18 to 24 Years | 30,485 (87.1%) | 23,609 (82.5%) |
| 25 to 34 Years | 53,941 (91.0%) | 46,154 (87.1%) |
| 35 to 44 Years | 46,507 (91.7%) | 42,356 (90.8%) |
| 45 to 54 Years | 42,036 (93.2%) | 36,776 (92.5%) |
| 55 to 64 Years | 42,772 (90.3%) | 39,162 (90.0%) |
| 65 to 74 Years | 30,130 (92.4%) | 27,891 (92.2%) |
| 75 Years and over | 12,618 (93.3%) | 14,625 (90.7%) |
| Total | 337,411 (90.3%) | 304,655 (88.7%) |
Income Below Poverty Among Married-Couple Families in Alaska
The poverty statistics for married-couple families in Alaska show that 3.7% or 4,743 of the total 129,605 families live below the poverty line. Families with 5 or more children have the highest poverty rate of 16.4%, comprising of 388 families. On the other hand, families with no children have the lowest poverty rate of 2.8%, which includes 1,985 families.
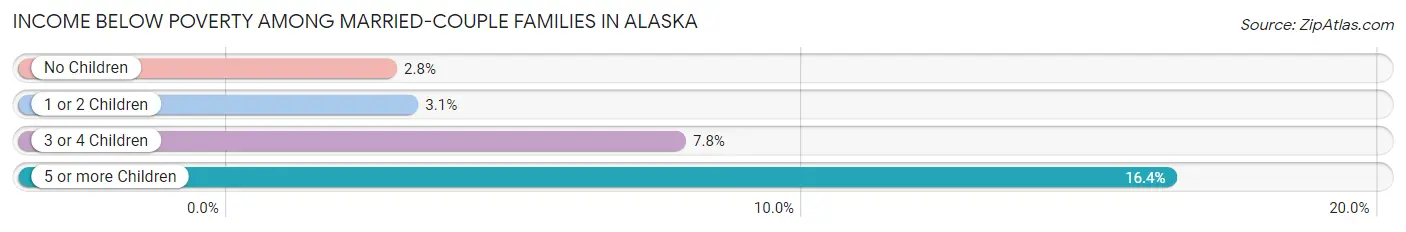
| Children | Above Poverty | Below Poverty |
| No Children | 69,613 (97.2%) | 1,985 (2.8%) |
| 1 or 2 Children | 40,929 (96.9%) | 1,326 (3.1%) |
| 3 or 4 Children | 12,335 (92.2%) | 1,044 (7.8%) |
| 5 or more Children | 1,985 (83.7%) | 388 (16.4%) |
| Total | 124,862 (96.3%) | 4,743 (3.7%) |
Income Below Poverty Among Single-Parent Households in Alaska
According to the poverty data in Alaska, 13.7% or 2,085 single-father households and 20.7% or 5,428 single-mother households are living below the poverty line. Among single-father households, those with 5 or more children have the highest poverty rate, with 55 households (39.0%) experiencing poverty. Likewise, among single-mother households, those with 5 or more children have the highest poverty rate, with 361 households (63.4%) falling below the poverty line.
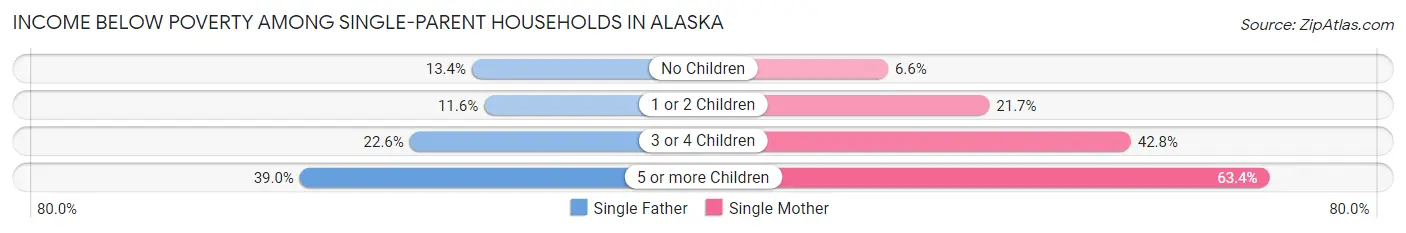
| Children | Single Father | Single Mother |
| No Children | 807 (13.4%) | 532 (6.6%) |
| 1 or 2 Children | 848 (11.6%) | 3,067 (21.7%) |
| 3 or 4 Children | 375 (22.6%) | 1,468 (42.8%) |
| 5 or more Children | 55 (39.0%) | 361 (63.4%) |
| Total | 2,085 (13.7%) | 5,428 (20.7%) |
Income Below Poverty Among Married-Couple vs Single-Parent Households in Alaska
The poverty data for Alaska shows that 4,743 of the married-couple family households (3.7%) and 7,513 of the single-parent households (18.2%) are living below the poverty level. Within the married-couple family households, those with 5 or more children have the highest poverty rate, with 388 households (16.4%) falling below the poverty line. Among the single-parent households, those with 5 or more children have the highest poverty rate, with 416 household (58.6%) living below poverty.
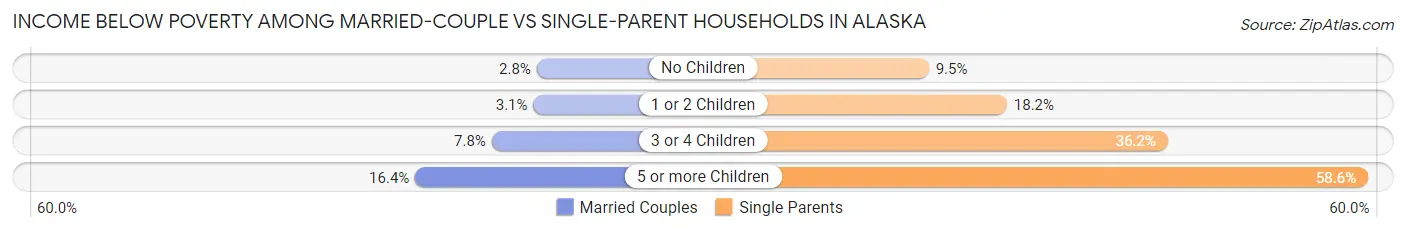
| Children | Married-Couple Families | Single-Parent Households |
| No Children | 1,985 (2.8%) | 1,339 (9.5%) |
| 1 or 2 Children | 1,326 (3.1%) | 3,915 (18.2%) |
| 3 or 4 Children | 1,044 (7.8%) | 1,843 (36.2%) |
| 5 or more Children | 388 (16.4%) | 416 (58.6%) |
| Total | 4,743 (3.7%) | 7,513 (18.2%) |
Largest Zip Codes by Population in Alaska
The largest zip codes in Alaska by population are 99654 (43,606), 99504 (40,938), 99508 (38,142), 99507 (35,708), and 99645 (30,849).
1.99654
43,606 (5.93%)
2.99504
40,938 (5.57%)
3.99508
38,142 (5.19%)
4.99507
35,708 (4.86%)
5.99645
30,849 (4.20%)
6.99801
29,933 (4.07%)
7.99709
28,343 (3.86%)
8.99577
28,124 (3.83%)
9.99502
26,257 (3.57%)
10.99705
22,872 (3.11%)
11.99623
22,466 (3.06%)
12.99516
21,788 (2.97%)
13.99515
21,629 (2.94%)
14.99701
18,295 (2.49%)
15.99669
17,382 (2.37%)
16.99501
16,500 (2.25%)
17.99517
16,347 (2.22%)
18.99611
15,188 (2.07%)
19.99901
13,913 (1.89%)
20.99712
12,683 (1.73%)
21.99503
12,620 (1.72%)
22.99615
12,618 (1.72%)
23.99603
11,234 (1.53%)
24.99518
10,351 (1.41%)
25.99703
8,807 (1.20%)
26.99835
8,457 (1.15%)
27.99559
7,465 (1.02%)
28.99567
7,382 (1.00%)
29.99506
6,991 (0.95%)
30.99505
5,703 (0.78%)
Largest Cities by Population in Alaska
The largest cities in Alaska by population are Anchorage (290,674), Fairbanks (32,496), Juneau city and borough (32,108), Badger (19,182), and Knik Fairview (18,619).
290,674 (39.56%)
32,496 (4.42%)
32,108 (4.37%)
4.Badger
19,182 (2.61%)
18,619 (2.53%)
6.College
12,376 (1.68%)
10,262 (1.40%)
8.Tanaina
9,682 (1.32%)
9.Wasilla
9,267 (1.26%)
10.Meadow Lakes
8,773 (1.19%)
8,462 (1.15%)
12.Kalifornsky
8,380 (1.14%)
13.Ketchikan
8,168 (1.11%)
14.Kenai
7,477 (1.02%)
15.Steele Creek
6,542 (0.89%)
16.South Lakes
6,414 (0.87%)
17.Bethel
6,312 (0.86%)
18.Sterling
6,307 (0.86%)
19.Gateway
6,241 (0.85%)
20.Palmer
6,091 (0.83%)
21.Homer
5,623 (0.77%)
22.Kodiak
5,584 (0.76%)
23.Chena Ridge
5,321 (0.72%)
24.Fishhook
5,115 (0.70%)
25.Utqiagvik
4,876 (0.66%)
26.Nikiski
4,405 (0.60%)
27.Soldotna
4,394 (0.60%)
28.Unalaska
4,342 (0.59%)
29.Farmers Loop
4,179 (0.57%)
30.Valdez
3,935 (0.54%)
Largest Counties by Population in Alaska
The largest counties in Alaska by population are Anchorage Municipality (290,674), Matanuska-Susitna Borough (108,661), Fairbanks North Star Borough (96,299), Kenai Peninsula Borough (59,235), and Juneau City and Borough (32,108).
290,674 (39.56%)
108,661 (14.79%)
96,299 (13.11%)
59,235 (8.06%)
32,108 (4.37%)
18,538 (2.52%)
13,910 (1.89%)
13,065 (1.78%)
10,924 (1.49%)
10,018 (1.36%)
8,462 (1.15%)
8,372 (1.14%)
7,682 (1.05%)
7,000 (0.95%)
6,888 (0.94%)
5,799 (0.79%)
5,355 (0.73%)
5,219 (0.71%)
4,854 (0.66%)
3,407 (0.46%)
3,374 (0.46%)
2,614 (0.36%)
2,329 (0.32%)
2,134 (0.29%)
2,101 (0.29%)
2,079 (0.28%)
1,303 (0.18%)
999 (0.14%)
854 (0.12%)
564 (0.08%)
Race in Alaska
The most populous races in Alaska are White / Caucasian (450,472 | 61.3%), Native / Alaskan (104,957 | 14.3%), and Two or more Races (82,727 | 11.3%).
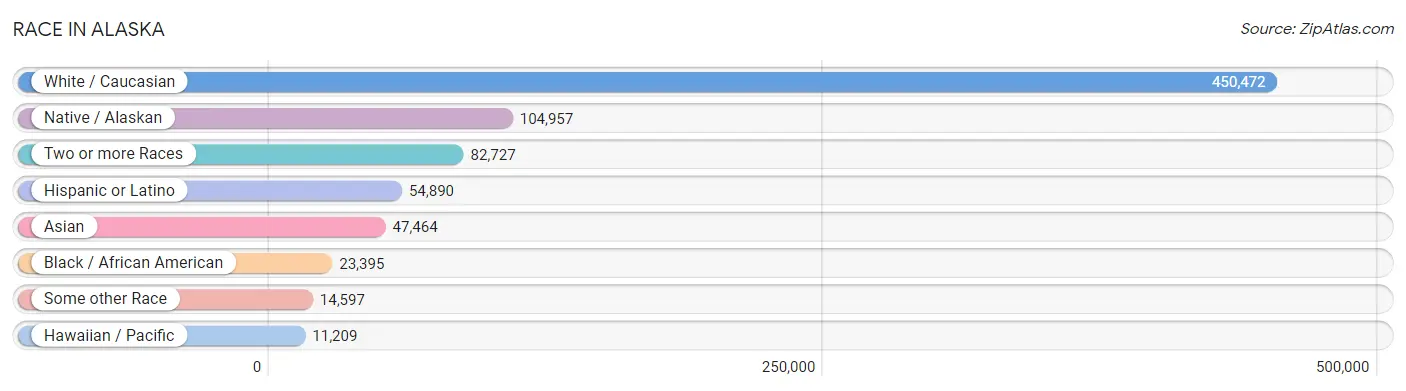
| Race | # Population | % Population |
| Asian | 47,464 | 6.5% |
| Black / African American | 23,395 | 3.2% |
| Hawaiian / Pacific | 11,209 | 1.5% |
| Hispanic or Latino | 54,890 | 7.5% |
| Native / Alaskan | 104,957 | 14.3% |
| White / Caucasian | 450,472 | 61.3% |
| Two or more Races | 82,727 | 11.3% |
| Some other Race | 14,597 | 2.0% |
| Total | 734,821 | 100.0% |
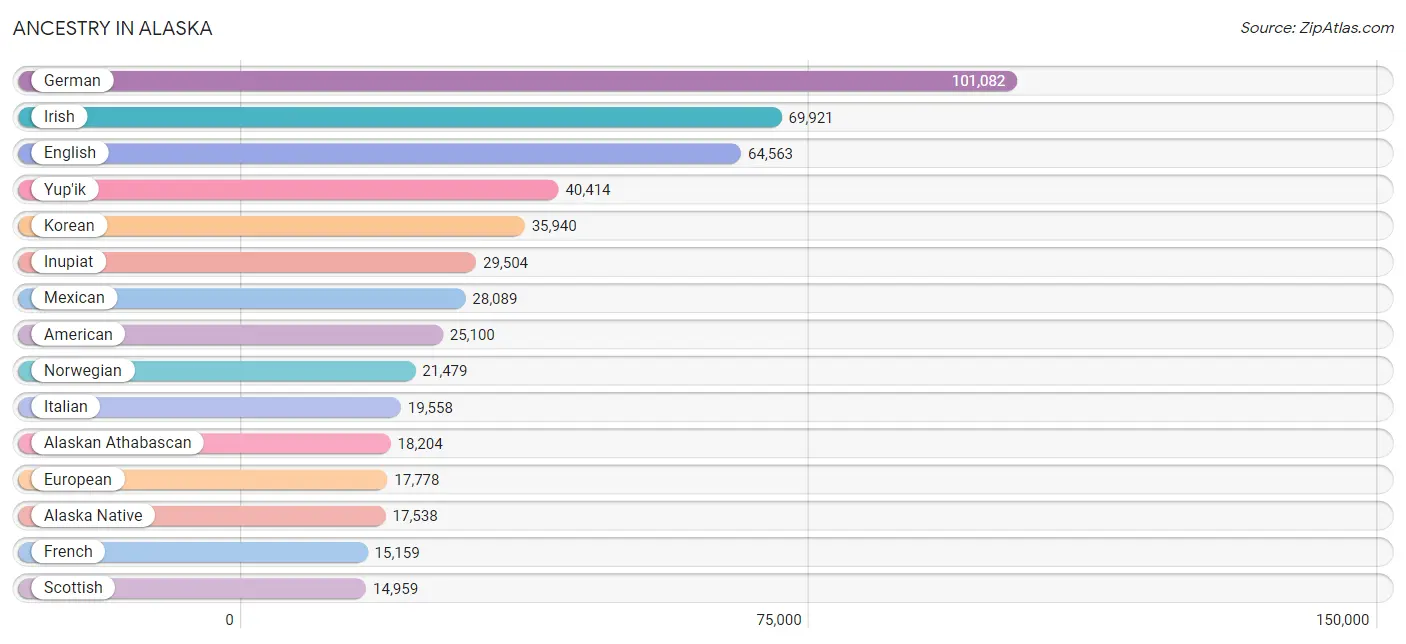
Ancestry in Alaska
The most populous ancestries reported in Alaska are German (101,082 | 13.8%), Irish (69,921 | 9.5%), English (64,563 | 8.8%), Yup'ik (40,414 | 5.5%), and Korean (35,940 | 4.9%), together accounting for 42.5% of all Alaska residents.
| Ancestry | # Population | % Population |
| Afghan | 43 | 0.0% |
| African | 2,111 | 0.3% |
| Alaska Native | 17,538 | 2.4% |
| Alaskan Athabascan | 18,204 | 2.5% |
| Albanian | 333 | 0.1% |
| Aleut | 12,836 | 1.8% |
| Alsatian | 12 | 0.0% |
| American | 25,100 | 3.4% |
| Apache | 551 | 0.1% |
| Arab | 905 | 0.1% |
| Arapaho | 126 | 0.0% |
| Argentinean | 246 | 0.0% |
| Armenian | 223 | 0.0% |
| Australian | 394 | 0.1% |
| Austrian | 1,356 | 0.2% |
| Bahamian | 42 | 0.0% |
| Bangladeshi | 5,909 | 0.8% |
| Barbadian | 49 | 0.0% |
| Basque | 40 | 0.0% |
| Belgian | 613 | 0.1% |
| Belizean | 60 | 0.0% |
| Bhutanese | 5,438 | 0.7% |
| Blackfeet | 1,080 | 0.2% |
| Bolivian | 57 | 0.0% |
| Brazilian | 297 | 0.0% |
| British | 5,855 | 0.8% |
| British West Indian | 45 | 0.0% |
| Bulgarian | 191 | 0.0% |
| Burmese | 6,860 | 0.9% |
| Cajun | 131 | 0.0% |
| Cambodian | 81 | 0.0% |
| Canadian | 1,854 | 0.3% |
| Cape Verdean | 31 | 0.0% |
| Carpatho Rusyn | 30 | 0.0% |
| Celtic | 197 | 0.0% |
| Central American | 3,632 | 0.5% |
| Central American Indian | 549 | 0.1% |
| Cherokee | 4,822 | 0.7% |
| Cheyenne | 168 | 0.0% |
| Chickasaw | 300 | 0.0% |
| Chilean | 50 | 0.0% |
| Chinese | 56 | 0.0% |
| Chippewa | 1,299 | 0.2% |
| Choctaw | 1,179 | 0.2% |
| Colombian | 1,990 | 0.3% |
| Colville | 21 | 0.0% |
| Comanche | 107 | 0.0% |
| Costa Rican | 218 | 0.0% |
| Cree | 200 | 0.0% |
| Creek | 346 | 0.1% |
| Croatian | 618 | 0.1% |
| Crow | 242 | 0.0% |
| Cuban | 2,360 | 0.3% |
| Cypriot | 10 | 0.0% |
| Czech | 3,493 | 0.5% |
| Czechoslovakian | 603 | 0.1% |
| Danish | 4,762 | 0.6% |
| Delaware | 18 | 0.0% |
| Dominican | 2,084 | 0.3% |
| Dutch | 9,354 | 1.3% |
| Dutch West Indian | 57 | 0.0% |
| Eastern European | 1,892 | 0.3% |
| Ecuadorian | 1,091 | 0.2% |
| Egyptian | 116 | 0.0% |
| English | 64,563 | 8.8% |
| Estonian | 98 | 0.0% |
| Ethiopian | 134 | 0.0% |
| European | 17,778 | 2.4% |
| Fijian | 69 | 0.0% |
| Filipino | 312 | 0.0% |
| Finnish | 4,112 | 0.6% |
| French | 15,159 | 2.1% |
| French American Indian | 437 | 0.1% |
| French Canadian | 5,019 | 0.7% |
| German | 101,082 | 13.8% |
| German Russian | 83 | 0.0% |
| Ghanaian | 6 | 0.0% |
| Greek | 1,190 | 0.2% |
| Guamanian / Chamorro | 1,081 | 0.2% |
| Guatemalan | 691 | 0.1% |
| Guyanese | 118 | 0.0% |
| Haitian | 355 | 0.1% |
| Hmong | 10 | 0.0% |
| Honduran | 472 | 0.1% |
| Hopi | 168 | 0.0% |
| Houma | 59 | 0.0% |
| Hungarian | 2,101 | 0.3% |
| Icelander | 287 | 0.0% |
| Indian (Asian) | 4,928 | 0.7% |
| Indonesian | 17 | 0.0% |
| Inupiat | 29,504 | 4.0% |
| Iranian | 424 | 0.1% |
| Iraqi | 5 | 0.0% |
| Irish | 69,921 | 9.5% |
| Iroquois | 269 | 0.0% |
| Israeli | 46 | 0.0% |
| Italian | 19,558 | 2.7% |
| Jamaican | 504 | 0.1% |
| Japanese | 538 | 0.1% |
| Kenyan | 52 | 0.0% |
| Kiowa | 14 | 0.0% |
| Korean | 35,940 | 4.9% |
| Laotian | 290 | 0.0% |
| Latvian | 156 | 0.0% |
| Lebanese | 290 | 0.0% |
| Liberian | 135 | 0.0% |
| Lithuanian | 970 | 0.1% |
| Lumbee | 140 | 0.0% |
| Luxembourger | 49 | 0.0% |
| Macedonian | 264 | 0.0% |
| Malaysian | 1,053 | 0.1% |
| Maltese | 3 | 0.0% |
| Marshallese | 47 | 0.0% |
| Menominee | 33 | 0.0% |
| Mexican | 28,089 | 3.8% |
| Mexican American Indian | 435 | 0.1% |
| Mongolian | 94 | 0.0% |
| Moroccan | 89 | 0.0% |
| Native Hawaiian | 4,076 | 0.5% |
| Navajo | 388 | 0.1% |
| Nepalese | 45 | 0.0% |
| New Zealander | 163 | 0.0% |
| Nicaraguan | 295 | 0.0% |
| Nigerian | 408 | 0.1% |
| Northern European | 2,887 | 0.4% |
| Norwegian | 21,479 | 2.9% |
| Okinawan | 13 | 0.0% |
| Osage | 172 | 0.0% |
| Ottawa | 11 | 0.0% |
| Paiute | 29 | 0.0% |
| Pakistani | 1,507 | 0.2% |
| Palestinian | 9 | 0.0% |
| Panamanian | 663 | 0.1% |
| Paraguayan | 37 | 0.0% |
| Pennsylvania German | 76 | 0.0% |
| Peruvian | 585 | 0.1% |
| Pima | 5 | 0.0% |
| Polish | 12,973 | 1.8% |
| Portuguese | 1,832 | 0.3% |
| Potawatomi | 170 | 0.0% |
| Pueblo | 162 | 0.0% |
| Puerto Rican | 8,133 | 1.1% |
| Puget Sound Salish | 418 | 0.1% |
| Romanian | 678 | 0.1% |
| Russian | 7,505 | 1.0% |
| Salvadoran | 1,293 | 0.2% |
| Samoan | 9,032 | 1.2% |
| Scandinavian | 6,283 | 0.9% |
| Scotch-Irish | 8,093 | 1.1% |
| Scottish | 14,959 | 2.0% |
| Seminole | 57 | 0.0% |
| Senegalese | 3 | 0.0% |
| Serbian | 589 | 0.1% |
| Shoshone | 163 | 0.0% |
| Sierra Leonean | 45 | 0.0% |
| Sioux | 1,180 | 0.2% |
| Slavic | 436 | 0.1% |
| Slovak | 610 | 0.1% |
| Slovene | 254 | 0.0% |
| Somali | 242 | 0.0% |
| South African | 62 | 0.0% |
| South American | 4,343 | 0.6% |
| South American Indian | 186 | 0.0% |
| Spaniard | 1,959 | 0.3% |
| Spanish | 2,152 | 0.3% |
| Spanish American | 32 | 0.0% |
| Sri Lankan | 1,989 | 0.3% |
| Subsaharan African | 5,158 | 0.7% |
| Sudanese | 1,259 | 0.2% |
| Swedish | 14,170 | 1.9% |
| Swiss | 2,631 | 0.4% |
| Syrian | 120 | 0.0% |
| Thai | 1,679 | 0.2% |
| Tlingit-Haida | 12,512 | 1.7% |
| Tohono O'Odham | 75 | 0.0% |
| Tongan | 1,919 | 0.3% |
| Trinidadian and Tobagonian | 102 | 0.0% |
| Tsimshian | 2,260 | 0.3% |
| Turkish | 98 | 0.0% |
| Ugandan | 29 | 0.0% |
| Ukrainian | 2,641 | 0.4% |
| Uruguayan | 33 | 0.0% |
| Ute | 181 | 0.0% |
| Venezuelan | 212 | 0.0% |
| Vietnamese | 47 | 0.0% |
| Welsh | 4,980 | 0.7% |
| West Indian | 115 | 0.0% |
| Yakama | 136 | 0.0% |
| Yaqui | 88 | 0.0% |
| Yugoslavian | 296 | 0.0% |
| Yuman | 105 | 0.0% |
| Yup'ik | 40,414 | 5.5% |
| Zimbabwean | 113 | 0.0% | View All 193 Rows |
Immigrants in Alaska
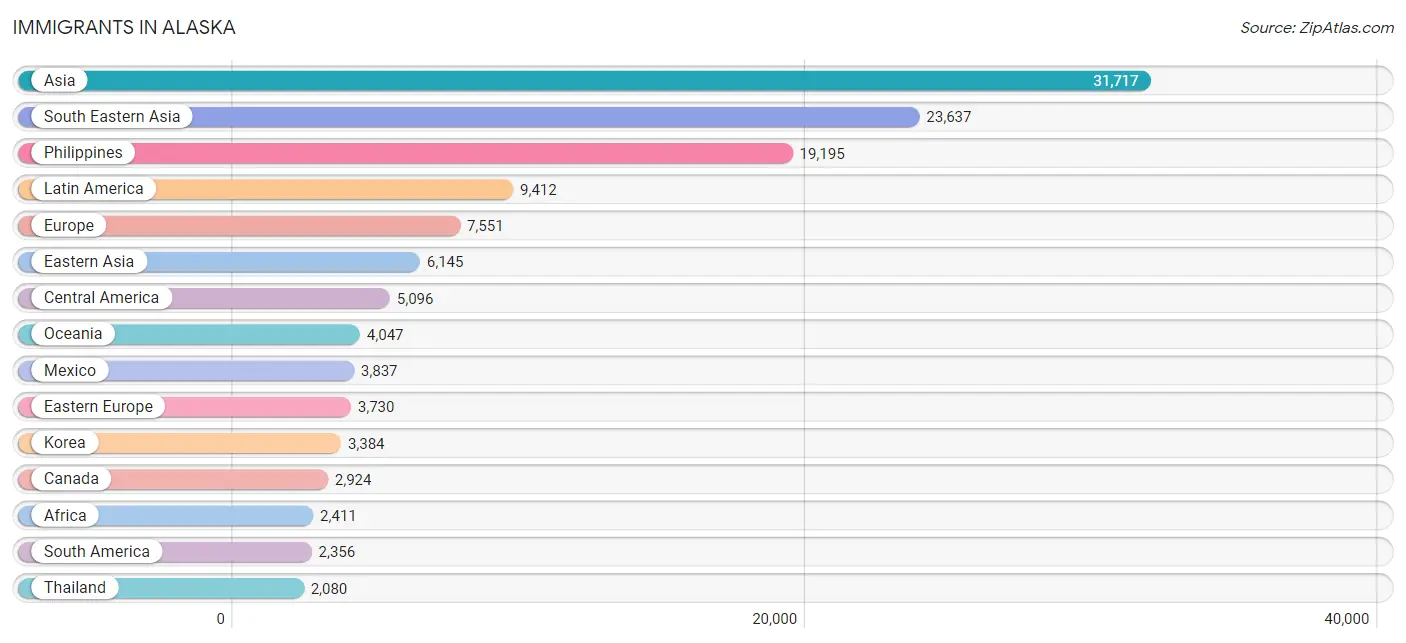
The most numerous immigrant groups reported in Alaska came from Asia (31,717 | 4.3%), South Eastern Asia (23,637 | 3.2%), Philippines (19,195 | 2.6%), Latin America (9,412 | 1.3%), and Europe (7,551 | 1.0%), together accounting for 12.5% of all Alaska residents.
| Immigration Origin | # Population | % Population |
| Afghanistan | 18 | 0.0% |
| Africa | 2,411 | 0.3% |
| Albania | 16 | 0.0% |
| Argentina | 137 | 0.0% |
| Armenia | 1 | 0.0% |
| Asia | 31,717 | 4.3% |
| Australia | 299 | 0.0% |
| Austria | 16 | 0.0% |
| Azores | 13 | 0.0% |
| Bahamas | 6 | 0.0% |
| Bangladesh | 47 | 0.0% |
| Barbados | 6 | 0.0% |
| Belarus | 34 | 0.0% |
| Belgium | 33 | 0.0% |
| Belize | 53 | 0.0% |
| Bolivia | 3 | 0.0% |
| Bosnia and Herzegovina | 52 | 0.0% |
| Brazil | 512 | 0.1% |
| Bulgaria | 107 | 0.0% |
| Cambodia | 160 | 0.0% |
| Cameroon | 94 | 0.0% |
| Canada | 2,924 | 0.4% |
| Caribbean | 1,960 | 0.3% |
| Central America | 5,096 | 0.7% |
| Chile | 15 | 0.0% |
| China | 1,815 | 0.3% |
| Colombia | 599 | 0.1% |
| Costa Rica | 2 | 0.0% |
| Cuba | 495 | 0.1% |
| Czechoslovakia | 170 | 0.0% |
| Denmark | 21 | 0.0% |
| Dominica | 97 | 0.0% |
| Dominican Republic | 840 | 0.1% |
| Eastern Africa | 716 | 0.1% |
| Eastern Asia | 6,145 | 0.8% |
| Eastern Europe | 3,730 | 0.5% |
| Ecuador | 242 | 0.0% |
| Egypt | 38 | 0.0% |
| El Salvador | 483 | 0.1% |
| England | 376 | 0.1% |
| Ethiopia | 116 | 0.0% |
| Europe | 7,551 | 1.0% |
| Fiji | 195 | 0.0% |
| France | 188 | 0.0% |
| Germany | 1,382 | 0.2% |
| Ghana | 125 | 0.0% |
| Greece | 10 | 0.0% |
| Grenada | 39 | 0.0% |
| Guatemala | 270 | 0.0% |
| Guyana | 76 | 0.0% |
| Haiti | 158 | 0.0% |
| Honduras | 192 | 0.0% |
| Hong Kong | 202 | 0.0% |
| Hungary | 21 | 0.0% |
| India | 615 | 0.1% |
| Indonesia | 76 | 0.0% |
| Iran | 310 | 0.0% |
| Iraq | 27 | 0.0% |
| Ireland | 196 | 0.0% |
| Israel | 7 | 0.0% |
| Italy | 205 | 0.0% |
| Jamaica | 206 | 0.0% |
| Japan | 910 | 0.1% |
| Jordan | 4 | 0.0% |
| Kazakhstan | 56 | 0.0% |
| Kenya | 159 | 0.0% |
| Korea | 3,384 | 0.5% |
| Kuwait | 21 | 0.0% |
| Laos | 1,137 | 0.2% |
| Latin America | 9,412 | 1.3% |
| Latvia | 19 | 0.0% |
| Lebanon | 1 | 0.0% |
| Liberia | 90 | 0.0% |
| Lithuania | 133 | 0.0% |
| Malaysia | 95 | 0.0% |
| Mexico | 3,837 | 0.5% |
| Micronesia | 197 | 0.0% |
| Middle Africa | 209 | 0.0% |
| Moldova | 368 | 0.1% |
| Morocco | 1 | 0.0% |
| Nepal | 258 | 0.0% |
| Netherlands | 122 | 0.0% |
| Nicaragua | 78 | 0.0% |
| Nigeria | 281 | 0.0% |
| North Macedonia | 171 | 0.0% |
| Northern Africa | 494 | 0.1% |
| Northern Europe | 1,564 | 0.2% |
| Norway | 159 | 0.0% |
| Oceania | 4,047 | 0.5% |
| Pakistan | 138 | 0.0% |
| Panama | 181 | 0.0% |
| Peru | 464 | 0.1% |
| Philippines | 19,195 | 2.6% |
| Poland | 389 | 0.1% |
| Portugal | 36 | 0.0% |
| Romania | 114 | 0.0% |
| Russia | 863 | 0.1% |
| Scotland | 147 | 0.0% |
| Senegal | 3 | 0.0% |
| Serbia | 91 | 0.0% |
| Somalia | 86 | 0.0% |
| South Africa | 177 | 0.0% |
| South America | 2,356 | 0.3% |
| South Central Asia | 1,546 | 0.2% |
| South Eastern Asia | 23,637 | 3.2% |
| Southern Europe | 334 | 0.1% |
| Spain | 83 | 0.0% |
| Sri Lanka | 43 | 0.0% |
| St. Vincent and the Grenadines | 1 | 0.0% |
| Sudan | 391 | 0.1% |
| Sweden | 192 | 0.0% |
| Switzerland | 129 | 0.0% |
| Syria | 95 | 0.0% |
| Taiwan | 313 | 0.0% |
| Thailand | 2,080 | 0.3% |
| Trinidad and Tobago | 48 | 0.0% |
| Turkey | 158 | 0.0% |
| Uganda | 42 | 0.0% |
| Ukraine | 1,059 | 0.1% |
| Uruguay | 19 | 0.0% |
| Uzbekistan | 31 | 0.0% |
| Venezuela | 218 | 0.0% |
| Vietnam | 868 | 0.1% |
| Western Africa | 709 | 0.1% |
| Western Asia | 377 | 0.1% |
| Western Europe | 1,870 | 0.3% |
| Zimbabwe | 96 | 0.0% | View All 127 Rows |
Sex and Age in Alaska
Sex and Age in Alaska
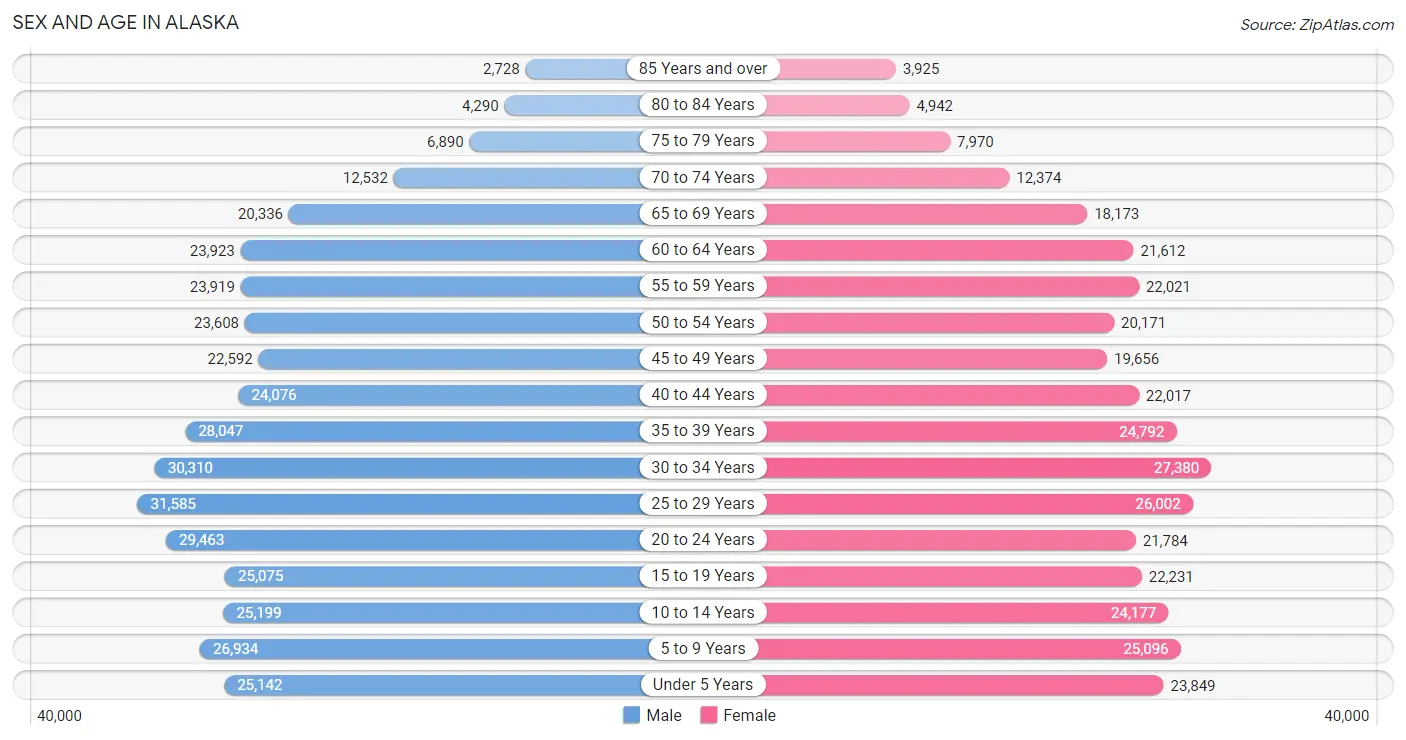
The most populous age groups in Alaska are 25 to 29 Years (31,585 | 8.2%) for men and 30 to 34 Years (27,380 | 7.9%) for women.
| Age Bracket | Male | Female |
| Under 5 Years | 25,142 (6.5%) | 23,849 (6.9%) |
| 5 to 9 Years | 26,934 (7.0%) | 25,096 (7.2%) |
| 10 to 14 Years | 25,199 (6.5%) | 24,177 (6.9%) |
| 15 to 19 Years | 25,075 (6.5%) | 22,231 (6.4%) |
| 20 to 24 Years | 29,463 (7.6%) | 21,784 (6.3%) |
| 25 to 29 Years | 31,585 (8.2%) | 26,002 (7.5%) |
| 30 to 34 Years | 30,310 (7.8%) | 27,380 (7.9%) |
| 35 to 39 Years | 28,047 (7.2%) | 24,792 (7.1%) |
| 40 to 44 Years | 24,076 (6.2%) | 22,017 (6.3%) |
| 45 to 49 Years | 22,592 (5.8%) | 19,656 (5.7%) |
| 50 to 54 Years | 23,608 (6.1%) | 20,171 (5.8%) |
| 55 to 59 Years | 23,919 (6.2%) | 22,021 (6.3%) |
| 60 to 64 Years | 23,923 (6.2%) | 21,612 (6.2%) |
| 65 to 69 Years | 20,336 (5.3%) | 18,173 (5.2%) |
| 70 to 74 Years | 12,532 (3.2%) | 12,374 (3.5%) |
| 75 to 79 Years | 6,890 (1.8%) | 7,970 (2.3%) |
| 80 to 84 Years | 4,290 (1.1%) | 4,942 (1.4%) |
| 85 Years and over | 2,728 (0.7%) | 3,925 (1.1%) |
| Total | 386,649 (100.0%) | 348,172 (100.0%) |
Families and Households in Alaska
Median Family Size in Alaska
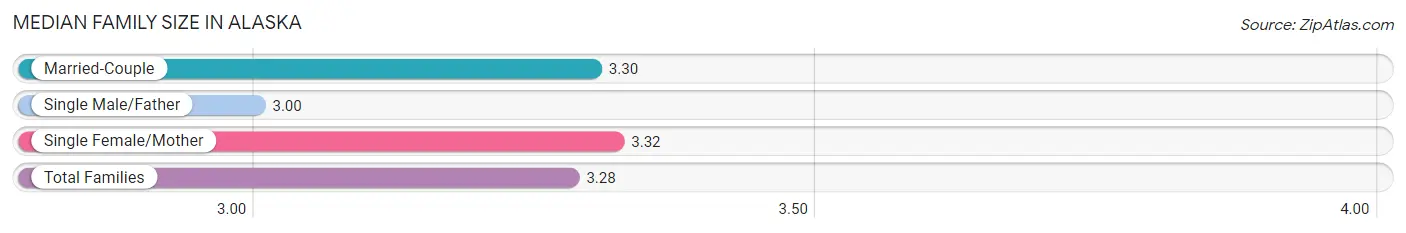
The median family size in Alaska is 3.28 persons per family, with single female/mother families (26,188 | 15.3%) accounting for the largest median family size of 3.32 persons per family. On the other hand, single male/father families (15,178 | 8.9%) represent the smallest median family size with 3.00 persons per family.
| Family Type | # Families | Family Size |
| Married-Couple | 129,605 (75.8%) | 3.30 |
| Single Male/Father | 15,178 (8.9%) | 3.00 |
| Single Female/Mother | 26,188 (15.3%) | 3.32 |
| Total Families | 170,971 (100.0%) | 3.28 |
Median Household Size in Alaska
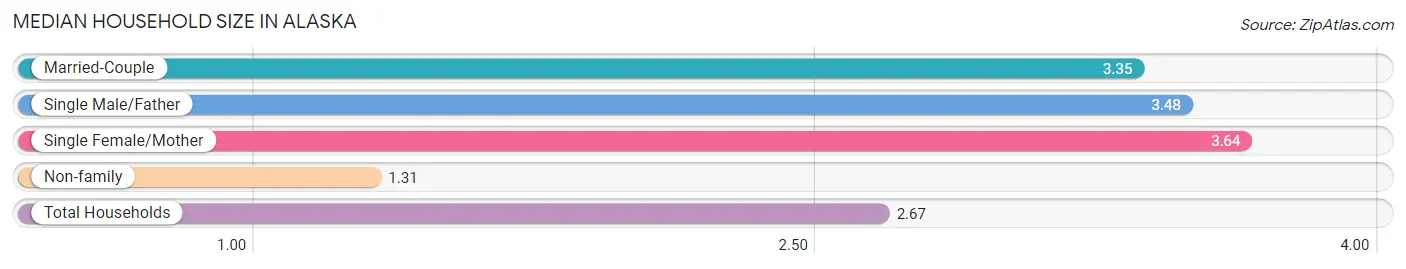
The median household size in Alaska is 2.67 persons per household, with single female/mother households (26,188 | 9.9%) accounting for the largest median household size of 3.64 persons per household. non-family households (93,405 | 35.3%) represent the smallest median household size with 1.31 persons per household.
| Household Type | # Households | Household Size |
| Married-Couple | 129,605 (49.0%) | 3.35 |
| Single Male/Father | 15,178 (5.7%) | 3.48 |
| Single Female/Mother | 26,188 (9.9%) | 3.64 |
| Non-family | 93,405 (35.3%) | 1.31 |
| Total Households | 264,376 (100.0%) | 2.67 |
Household Size by Marriage Status in Alaska
Out of a total of 264,376 households in Alaska, 170,971 (64.7%) are family households, while 93,405 (35.3%) are nonfamily households. The most numerous type of family households are 2-person households, comprising 71,280, and the most common type of nonfamily households are 1-person households, comprising 72,802.
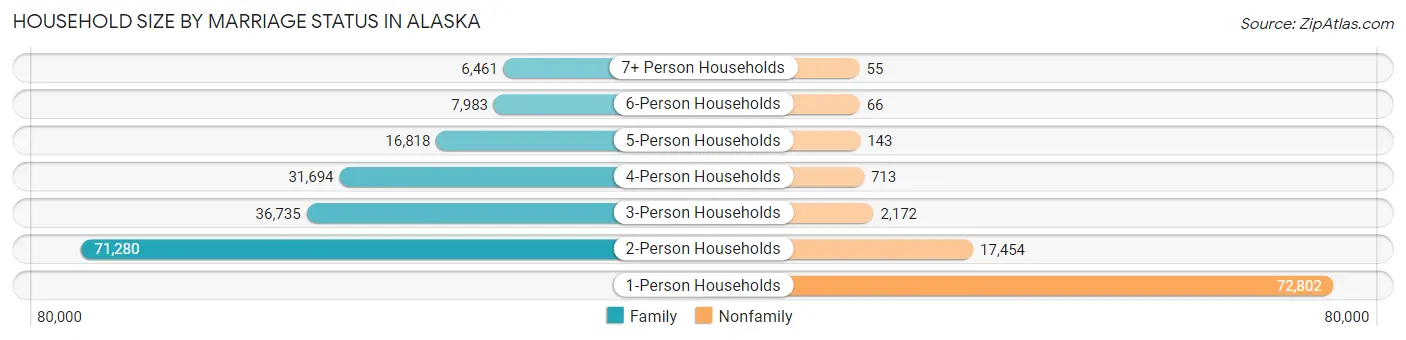
| Household Size | Family Households | Nonfamily Households |
| 1-Person Households | - | 72,802 (27.5%) |
| 2-Person Households | 71,280 (27.0%) | 17,454 (6.6%) |
| 3-Person Households | 36,735 (13.9%) | 2,172 (0.8%) |
| 4-Person Households | 31,694 (12.0%) | 713 (0.3%) |
| 5-Person Households | 16,818 (6.4%) | 143 (0.1%) |
| 6-Person Households | 7,983 (3.0%) | 66 (0.0%) |
| 7+ Person Households | 6,461 (2.4%) | 55 (0.0%) |
| Total | 170,971 (64.7%) | 93,405 (35.3%) |
Female Fertility in Alaska
Fertility by Age in Alaska
Average fertility rate in Alaska is 62.0 births per 1,000 women. Women in the age bracket of 20 to 34 years have the highest fertility rate with 98.0 births per 1,000 women. Women in the age bracket of 20 to 34 years acount for 70.7% of all women with births.
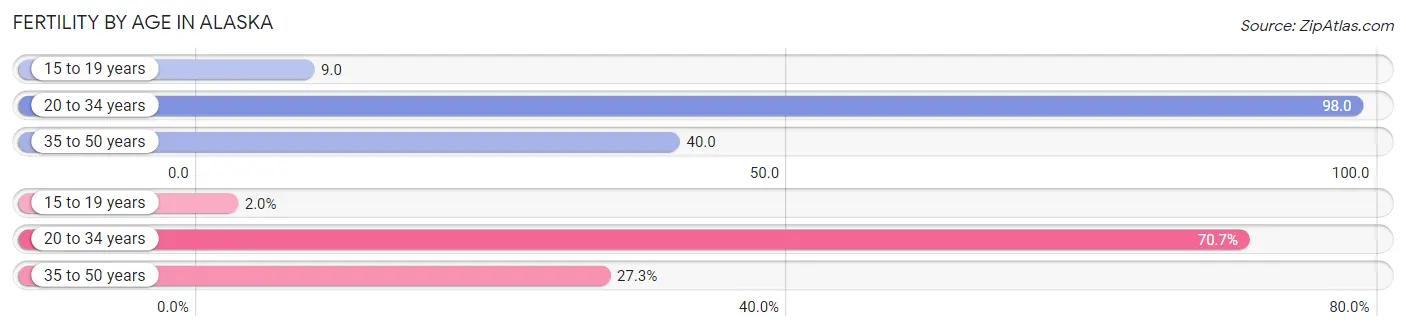
| Age Bracket | Women with Births | Births / 1,000 Women |
| 15 to 19 years | 211 (2.0%) | 9.0 |
| 20 to 34 years | 7,391 (70.7%) | 98.0 |
| 35 to 50 years | 2,852 (27.3%) | 40.0 |
| Total | 10,454 (100.0%) | 62.0 |
Fertility by Age by Marriage Status in Alaska
69.9% of women with births (10,454) in Alaska are married. The highest percentage of unmarried women with births falls into 15 to 19 years age bracket with 90.0% of them unmarried at the time of birth, while the lowest percentage of unmarried women with births belong to 35 to 50 years age bracket with 24.9% of them unmarried.
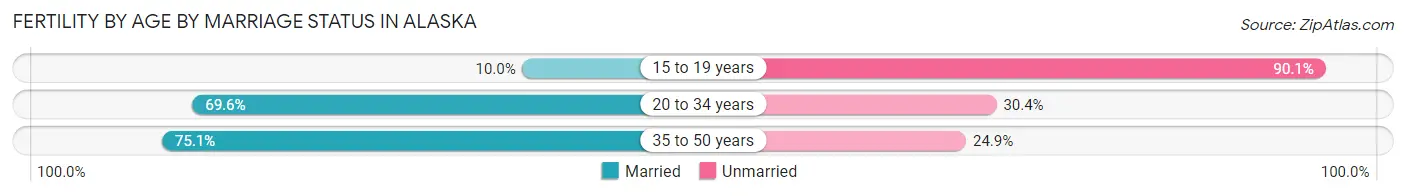
| Age Bracket | Married | Unmarried |
| 15 to 19 years | 21 (10.0%) | 190 (90.0%) |
| 20 to 34 years | 5,144 (69.6%) | 2,247 (30.4%) |
| 35 to 50 years | 2,142 (75.1%) | 710 (24.9%) |
| Total | 7,307 (69.9%) | 3,147 (30.1%) |
Fertility by Education in Alaska
Average fertility rate in Alaska is 62.0 births per 1,000 women. Women with the education attainment of graduate degree have the highest fertility rate of 76.0 births per 1,000 women, while women with the education attainment of less than high school have the lowest fertility at 33.0 births per 1,000 women. Women with the education attainment of college or associate's degree represent 31.5% of all women with births.
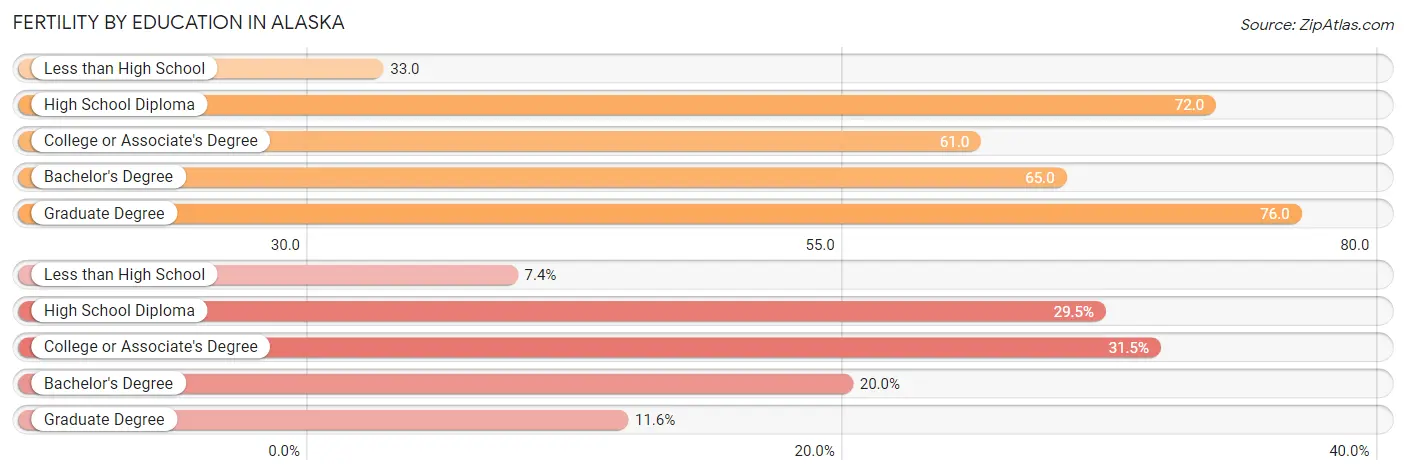
| Educational Attainment | Women with Births | Births / 1,000 Women |
| Less than High School | 777 (7.4%) | 33.0 |
| High School Diploma | 3,081 (29.5%) | 72.0 |
| College or Associate's Degree | 3,296 (31.5%) | 61.0 |
| Bachelor's Degree | 2,090 (20.0%) | 65.0 |
| Graduate Degree | 1,210 (11.6%) | 76.0 |
| Total | 10,454 (100.0%) | 62.0 |
Fertility by Education by Marriage Status in Alaska
30.1% of women with births in Alaska are unmarried. Women with the educational attainment of graduate degree are most likely to be married with 88.2% of them married at childbirth, while women with the educational attainment of less than high school are least likely to be married with 66.1% of them unmarried at childbirth.
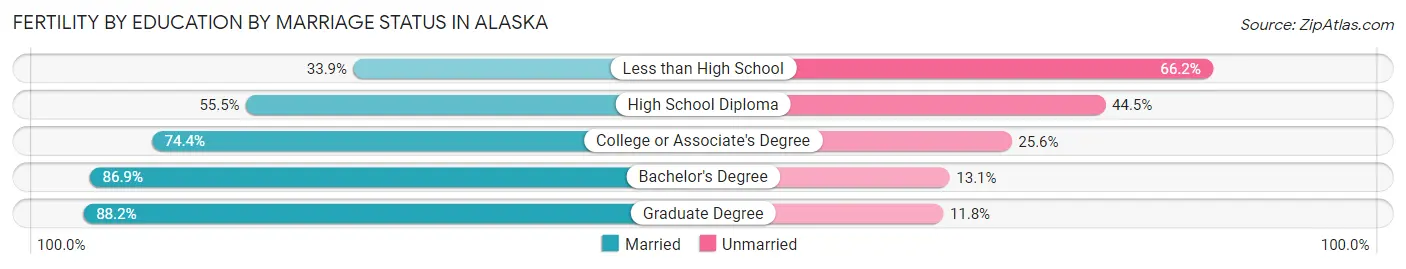
| Educational Attainment | Married | Unmarried |
| Less than High School | 263 (33.9%) | 514 (66.1%) |
| High School Diploma | 1,710 (55.5%) | 1,371 (44.5%) |
| College or Associate's Degree | 2,452 (74.4%) | 844 (25.6%) |
| Bachelor's Degree | 1,816 (86.9%) | 274 (13.1%) |
| Graduate Degree | 1,067 (88.2%) | 143 (11.8%) |
| Total | 7,307 (69.9%) | 3,147 (30.1%) |
Employment Characteristics in Alaska
Employment by Class of Employer in Alaska
Among the 351,067 employed individuals in Alaska, private company employees (179,099 | 51.0%), federal government employees (42,717 | 12.2%), and not-for-profit organizations (34,145 | 9.7%) make up the most common classes of employment.
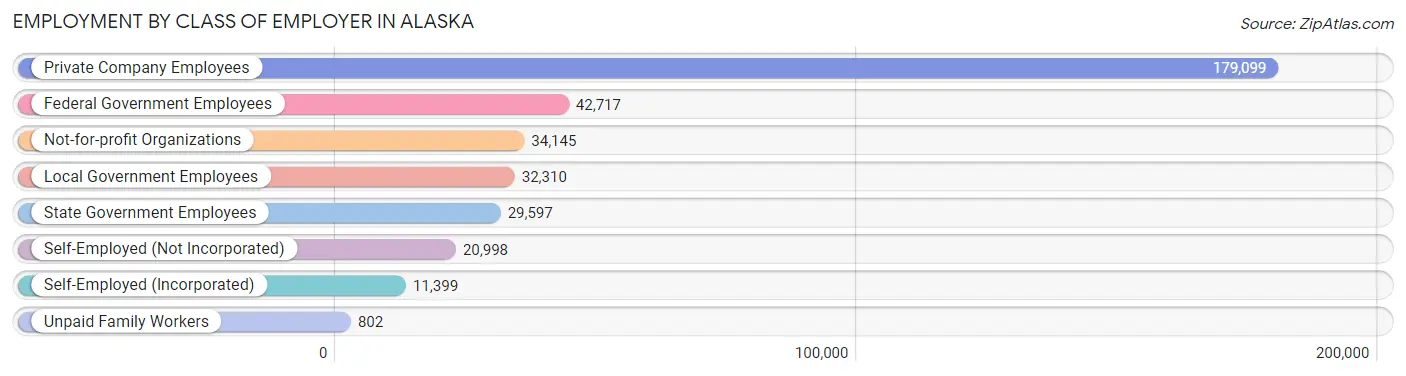
| Employer Class | # Employees | % Employees |
| Private Company Employees | 179,099 | 51.0% |
| Self-Employed (Incorporated) | 11,399 | 3.3% |
| Self-Employed (Not Incorporated) | 20,998 | 6.0% |
| Not-for-profit Organizations | 34,145 | 9.7% |
| Local Government Employees | 32,310 | 9.2% |
| State Government Employees | 29,597 | 8.4% |
| Federal Government Employees | 42,717 | 12.2% |
| Unpaid Family Workers | 802 | 0.2% |
| Total | 351,067 | 100.0% |
Employment Status by Age in Alaska
According to the labor force statistics for Alaska, out of the total population over 16 years of age (573,998), 66.7% or 382,857 individuals are in the labor force, with 6.4% or 24,503 of them unemployed. The age group with the highest labor force participation rate is 45 to 54 years, with 83.0% or 71,402 individuals in the labor force. Within the labor force, the 16 to 19 years age range has the highest percentage of unemployed individuals, with 16.6% or 2,614 of them being unemployed.
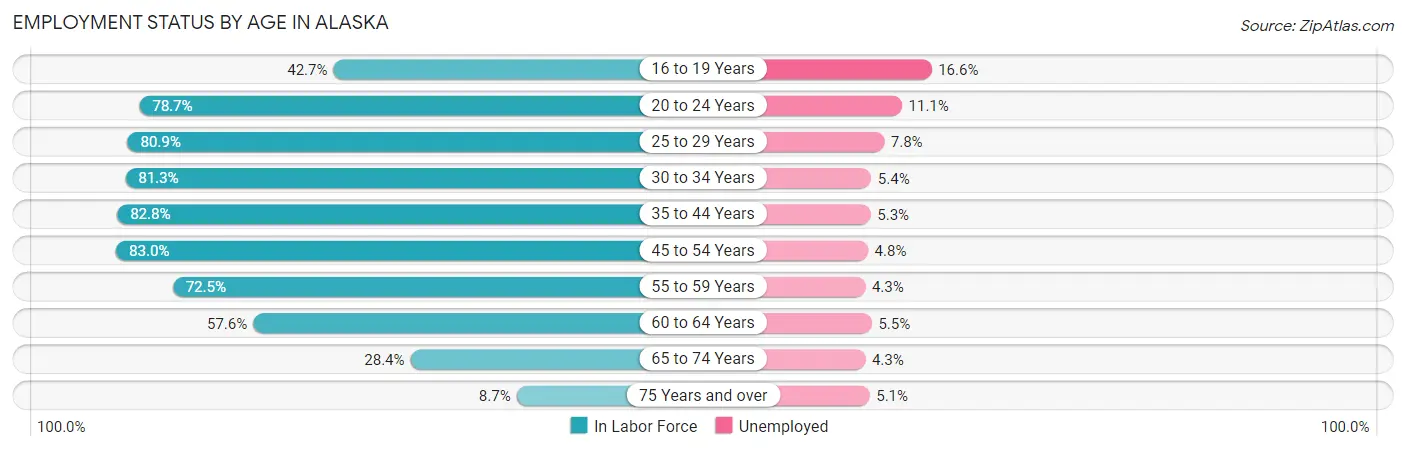
| Age Bracket | In Labor Force | Unemployed |
| 16 to 19 Years | 15,748 (42.7%) | 2,614 (16.6%) |
| 20 to 24 Years | 40,331 (78.7%) | 4,477 (11.1%) |
| 25 to 29 Years | 46,588 (80.9%) | 3,634 (7.8%) |
| 30 to 34 Years | 46,902 (81.3%) | 2,533 (5.4%) |
| 35 to 44 Years | 81,916 (82.8%) | 4,342 (5.3%) |
| 45 to 54 Years | 71,402 (83.0%) | 3,427 (4.8%) |
| 55 to 59 Years | 33,306 (72.5%) | 1,432 (4.3%) |
| 60 to 64 Years | 26,228 (57.6%) | 1,443 (5.5%) |
| 65 to 74 Years | 18,010 (28.4%) | 774 (4.3%) |
| 75 Years and over | 2,675 (8.7%) | 136 (5.1%) |
| Total | 382,857 (66.7%) | 24,503 (6.4%) |
Employment Status by Educational Attainment in Alaska
According to labor force statistics for Alaska, 78.2% of individuals (306,318) out of the total population between 25 and 64 years of age (391,711) are in the labor force, with 5.4% or 16,541 of them being unemployed. The group with the highest labor force participation rate are those with the educational attainment of bachelor's degree or higher, with 86.0% or 102,140 individuals in the labor force. Within the labor force, individuals with less than high school education have the highest percentage of unemployment, with 12.2% or 1,606 of them being unemployed.
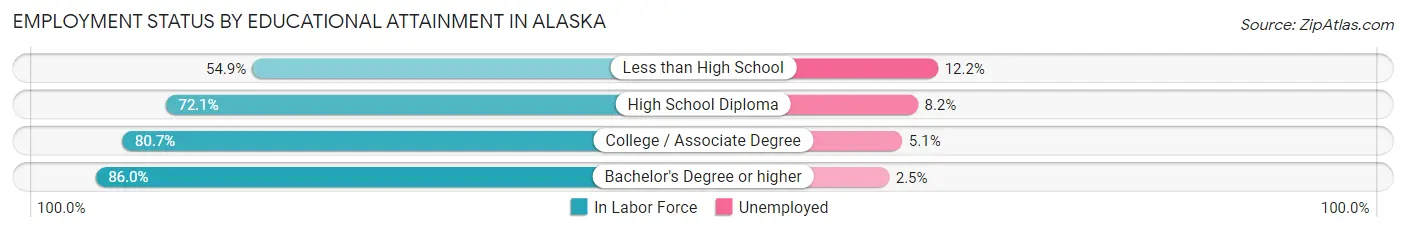
| Educational Attainment | In Labor Force | Unemployed |
| Less than High School | 13,161 (54.9%) | 2,925 (12.2%) |
| High School Diploma | 82,389 (72.1%) | 9,370 (8.2%) |
| College / Associate Degree | 108,705 (80.7%) | 6,870 (5.1%) |
| Bachelor's Degree or higher | 102,140 (86.0%) | 2,969 (2.5%) |
| Total | 306,318 (78.2%) | 21,152 (5.4%) |
Employment Occupations by Sex in Alaska
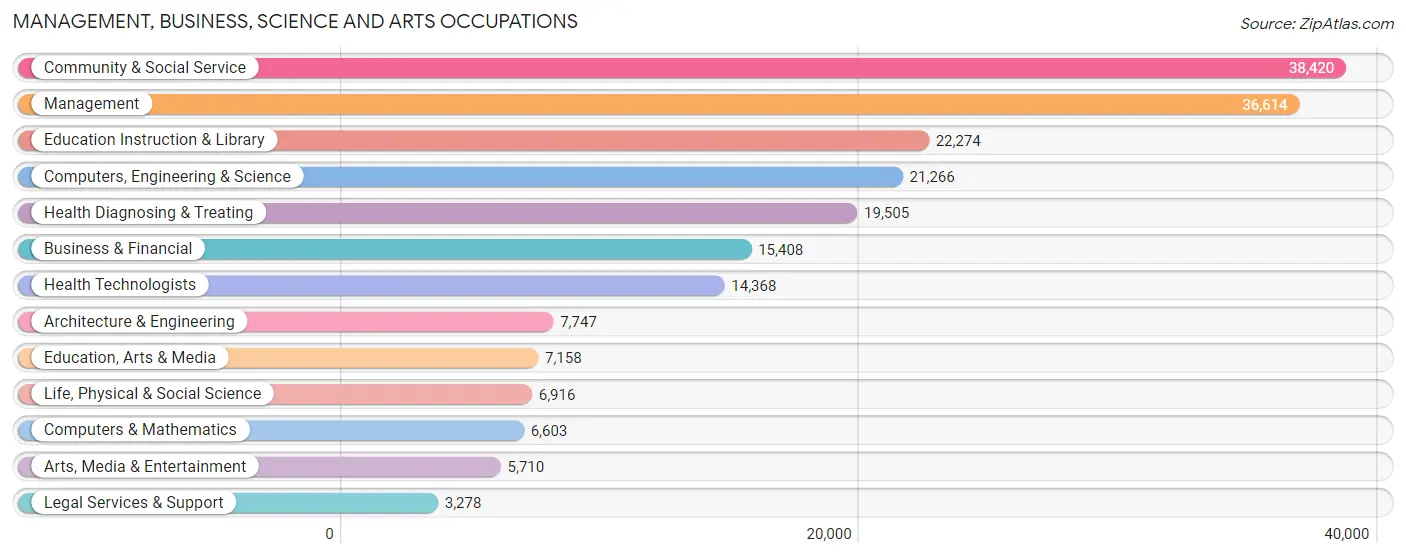
Management, Business, Science and Arts Occupations
The most common Management, Business, Science and Arts occupations in Alaska are Community & Social Service (38,420 | 11.3%), Management (36,614 | 10.8%), Education Instruction & Library (22,274 | 6.6%), Computers, Engineering & Science (21,266 | 6.3%), and Health Diagnosing & Treating (19,505 | 5.8%).
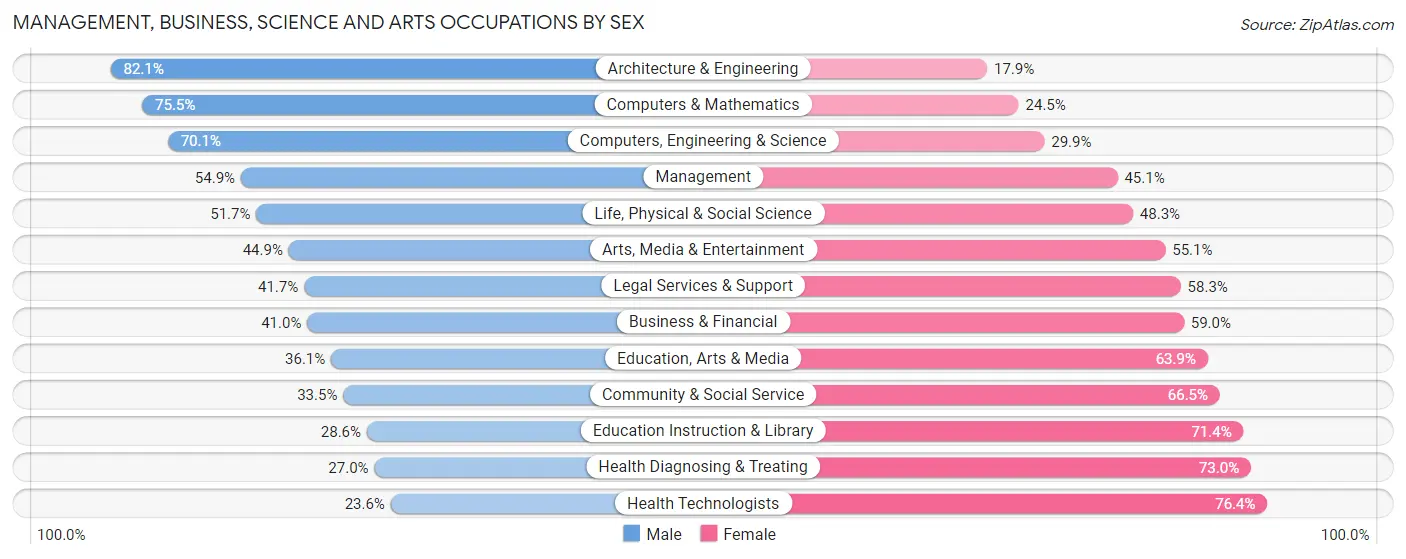
Management, Business, Science and Arts Occupations by Sex
Within the Management, Business, Science and Arts occupations in Alaska, the most male-oriented occupations are Architecture & Engineering (82.1%), Computers & Mathematics (75.5%), and Computers, Engineering & Science (70.1%), while the most female-oriented occupations are Health Technologists (76.4%), Health Diagnosing & Treating (73.0%), and Education Instruction & Library (71.4%).
| Occupation | Male | Female |
| Management | 20,095 (54.9%) | 16,519 (45.1%) |
| Business & Financial | 6,323 (41.0%) | 9,085 (59.0%) |
| Computers, Engineering & Science | 14,917 (70.1%) | 6,349 (29.9%) |
| Computers & Mathematics | 4,985 (75.5%) | 1,618 (24.5%) |
| Architecture & Engineering | 6,359 (82.1%) | 1,388 (17.9%) |
| Life, Physical & Social Science | 3,573 (51.7%) | 3,343 (48.3%) |
| Community & Social Service | 12,883 (33.5%) | 25,537 (66.5%) |
| Education, Arts & Media | 2,581 (36.1%) | 4,577 (63.9%) |
| Legal Services & Support | 1,367 (41.7%) | 1,911 (58.3%) |
| Education Instruction & Library | 6,371 (28.6%) | 15,903 (71.4%) |
| Arts, Media & Entertainment | 2,564 (44.9%) | 3,146 (55.1%) |
| Health Diagnosing & Treating | 5,273 (27.0%) | 14,232 (73.0%) |
| Health Technologists | 3,395 (23.6%) | 10,973 (76.4%) |
| Total (Category) | 59,491 (45.3%) | 71,722 (54.7%) |
| Total (Overall) | 182,359 (53.8%) | 156,803 (46.2%) |
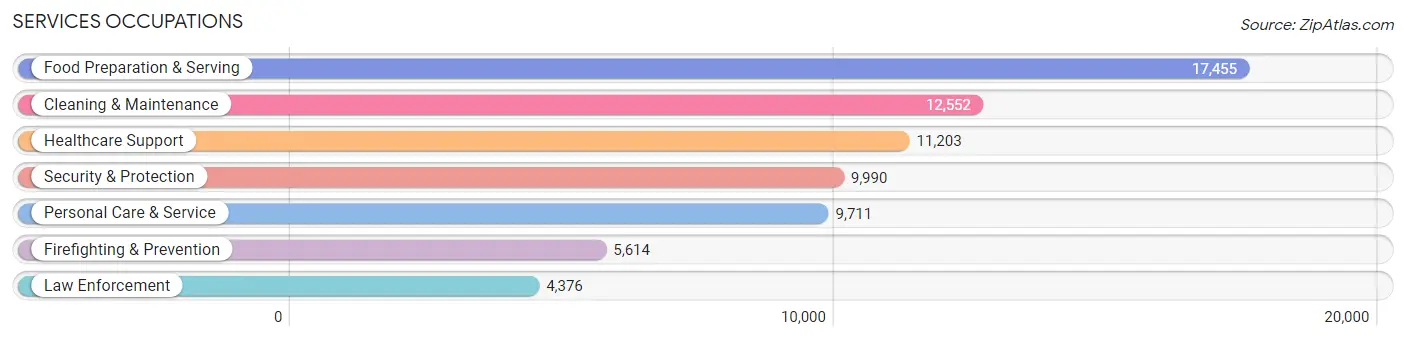
Services Occupations
The most common Services occupations in Alaska are Food Preparation & Serving (17,455 | 5.1%), Cleaning & Maintenance (12,552 | 3.7%), Healthcare Support (11,203 | 3.3%), Security & Protection (9,990 | 2.9%), and Personal Care & Service (9,711 | 2.9%).
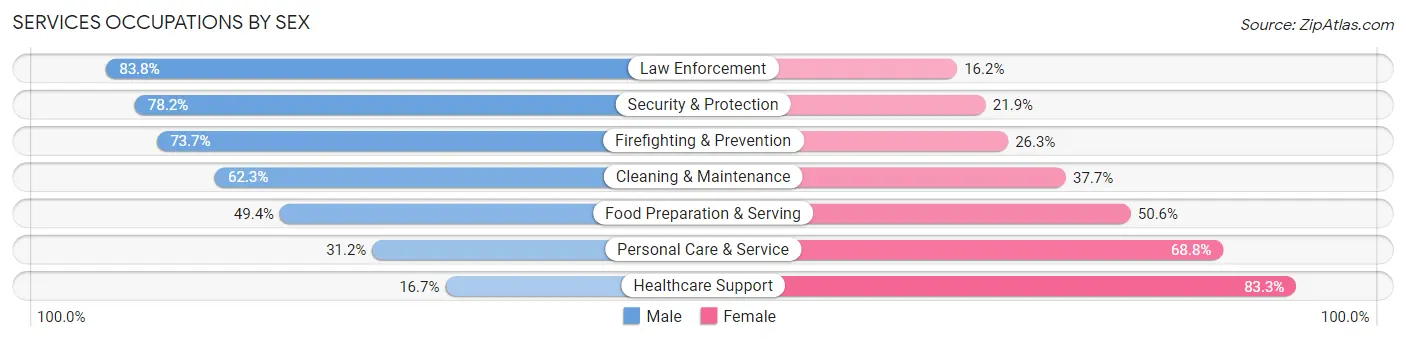
Services Occupations by Sex
Within the Services occupations in Alaska, the most male-oriented occupations are Law Enforcement (83.8%), Security & Protection (78.1%), and Firefighting & Prevention (73.7%), while the most female-oriented occupations are Healthcare Support (83.3%), Personal Care & Service (68.8%), and Food Preparation & Serving (50.6%).
| Occupation | Male | Female |
| Healthcare Support | 1,872 (16.7%) | 9,331 (83.3%) |
| Security & Protection | 7,807 (78.1%) | 2,183 (21.8%) |
| Firefighting & Prevention | 4,139 (73.7%) | 1,475 (26.3%) |
| Law Enforcement | 3,668 (83.8%) | 708 (16.2%) |
| Food Preparation & Serving | 8,630 (49.4%) | 8,825 (50.6%) |
| Cleaning & Maintenance | 7,818 (62.3%) | 4,734 (37.7%) |
| Personal Care & Service | 3,027 (31.2%) | 6,684 (68.8%) |
| Total (Category) | 29,154 (47.9%) | 31,757 (52.1%) |
| Total (Overall) | 182,359 (53.8%) | 156,803 (46.2%) |
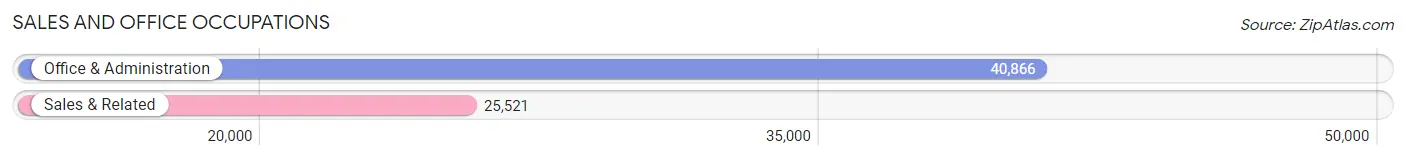
Sales and Office Occupations
The most common Sales and Office occupations in Alaska are Office & Administration (40,866 | 12.0%), and Sales & Related (25,521 | 7.5%).
Sales and Office Occupations by Sex
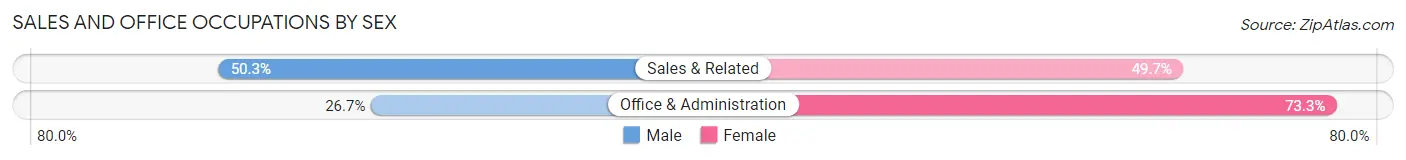
| Occupation | Male | Female |
| Sales & Related | 12,835 (50.3%) | 12,686 (49.7%) |
| Office & Administration | 10,900 (26.7%) | 29,966 (73.3%) |
| Total (Category) | 23,735 (35.7%) | 42,652 (64.2%) |
| Total (Overall) | 182,359 (53.8%) | 156,803 (46.2%) |
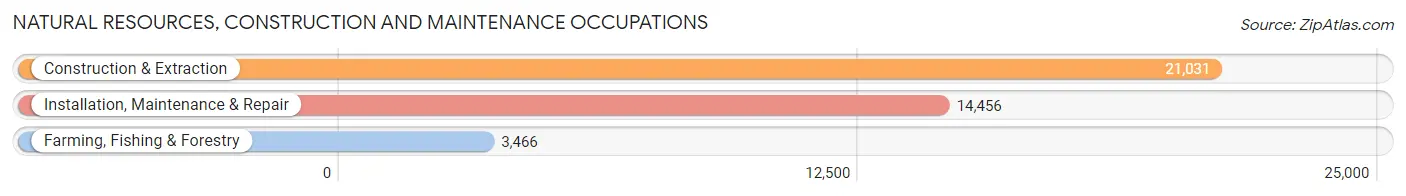
Natural Resources, Construction and Maintenance Occupations
The most common Natural Resources, Construction and Maintenance occupations in Alaska are Construction & Extraction (21,031 | 6.2%), Installation, Maintenance & Repair (14,456 | 4.3%), and Farming, Fishing & Forestry (3,466 | 1.0%).
Natural Resources, Construction and Maintenance Occupations by Sex
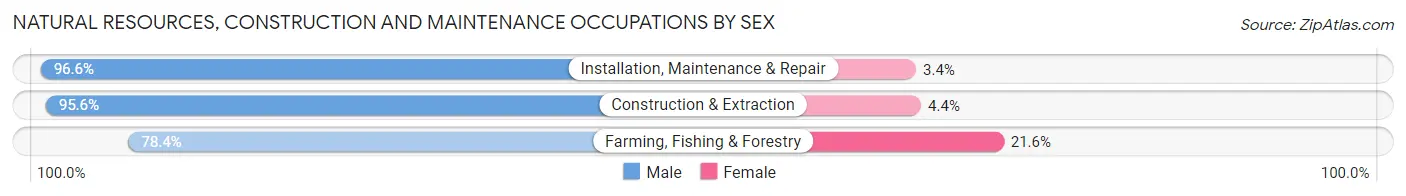
| Occupation | Male | Female |
| Farming, Fishing & Forestry | 2,717 (78.4%) | 749 (21.6%) |
| Construction & Extraction | 20,101 (95.6%) | 930 (4.4%) |
| Installation, Maintenance & Repair | 13,970 (96.6%) | 486 (3.4%) |
| Total (Category) | 36,788 (94.4%) | 2,165 (5.6%) |
| Total (Overall) | 182,359 (53.8%) | 156,803 (46.2%) |
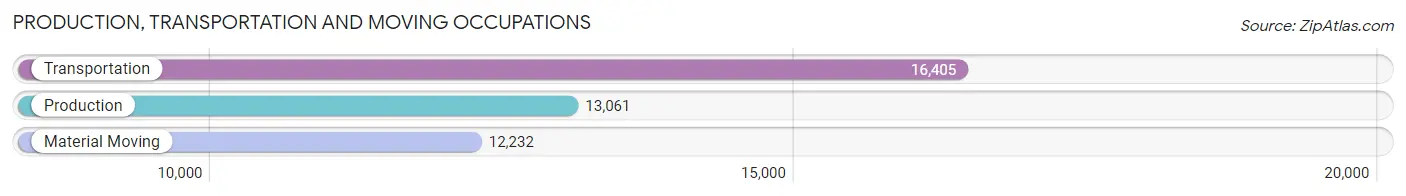
Production, Transportation and Moving Occupations
The most common Production, Transportation and Moving occupations in Alaska are Transportation (16,405 | 4.8%), Production (13,061 | 3.8%), and Material Moving (12,232 | 3.6%).
Production, Transportation and Moving Occupations by Sex
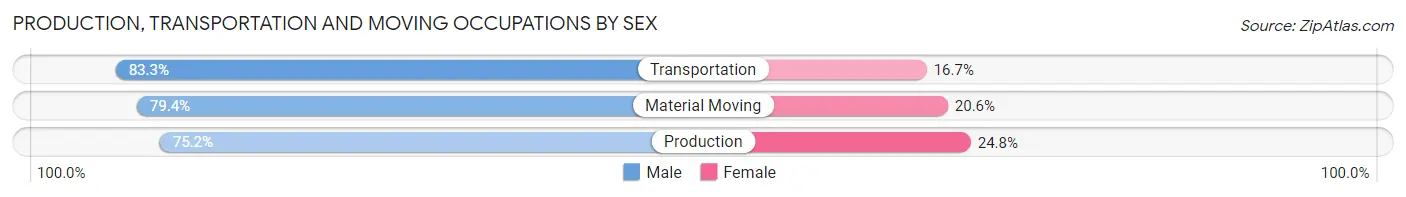
| Occupation | Male | Female |
| Production | 9,819 (75.2%) | 3,242 (24.8%) |
| Transportation | 13,661 (83.3%) | 2,744 (16.7%) |
| Material Moving | 9,711 (79.4%) | 2,521 (20.6%) |
| Total (Category) | 33,191 (79.6%) | 8,507 (20.4%) |
| Total (Overall) | 182,359 (53.8%) | 156,803 (46.2%) |
Employment Industries by Sex in Alaska
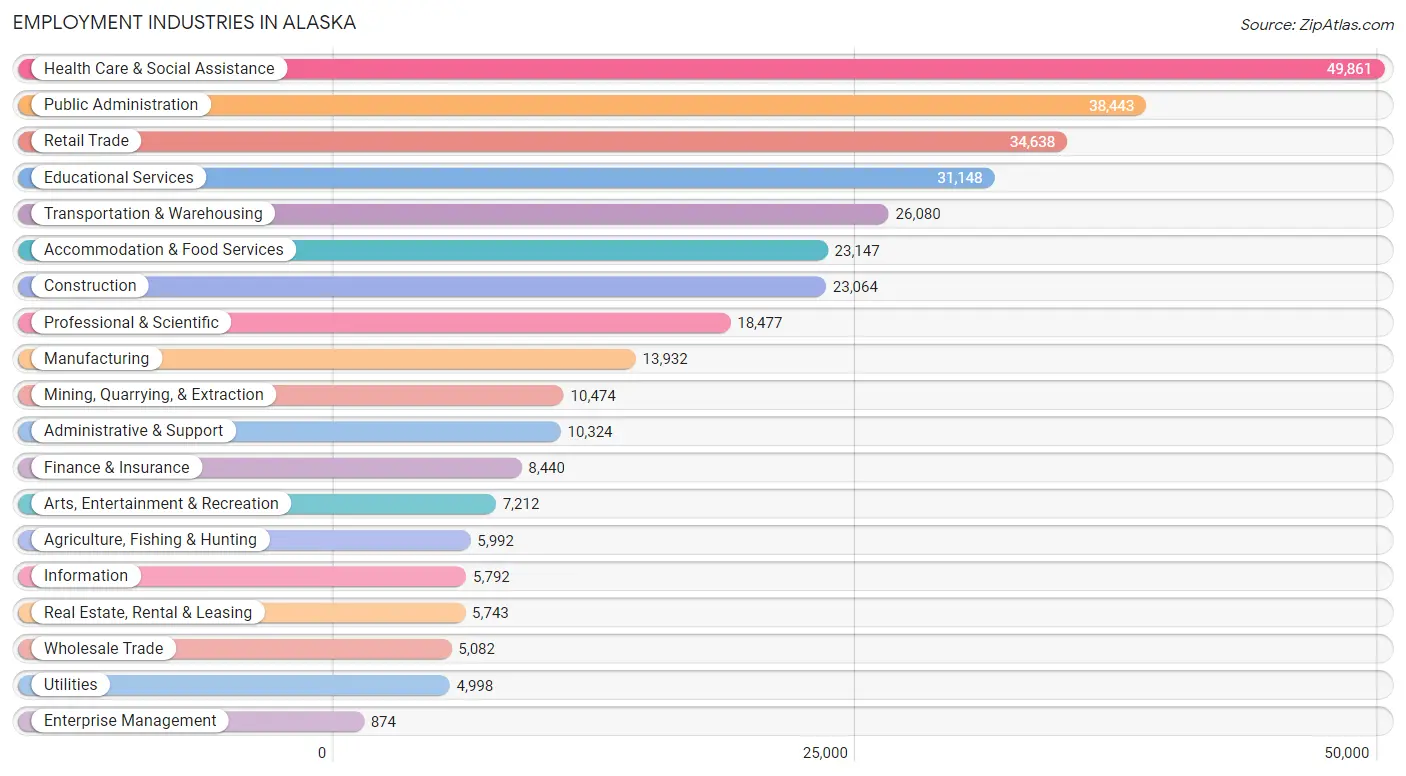
Employment Industries in Alaska
The major employment industries in Alaska include Health Care & Social Assistance (49,861 | 14.7%), Public Administration (38,443 | 11.3%), Retail Trade (34,638 | 10.2%), Educational Services (31,148 | 9.2%), and Transportation & Warehousing (26,080 | 7.7%).
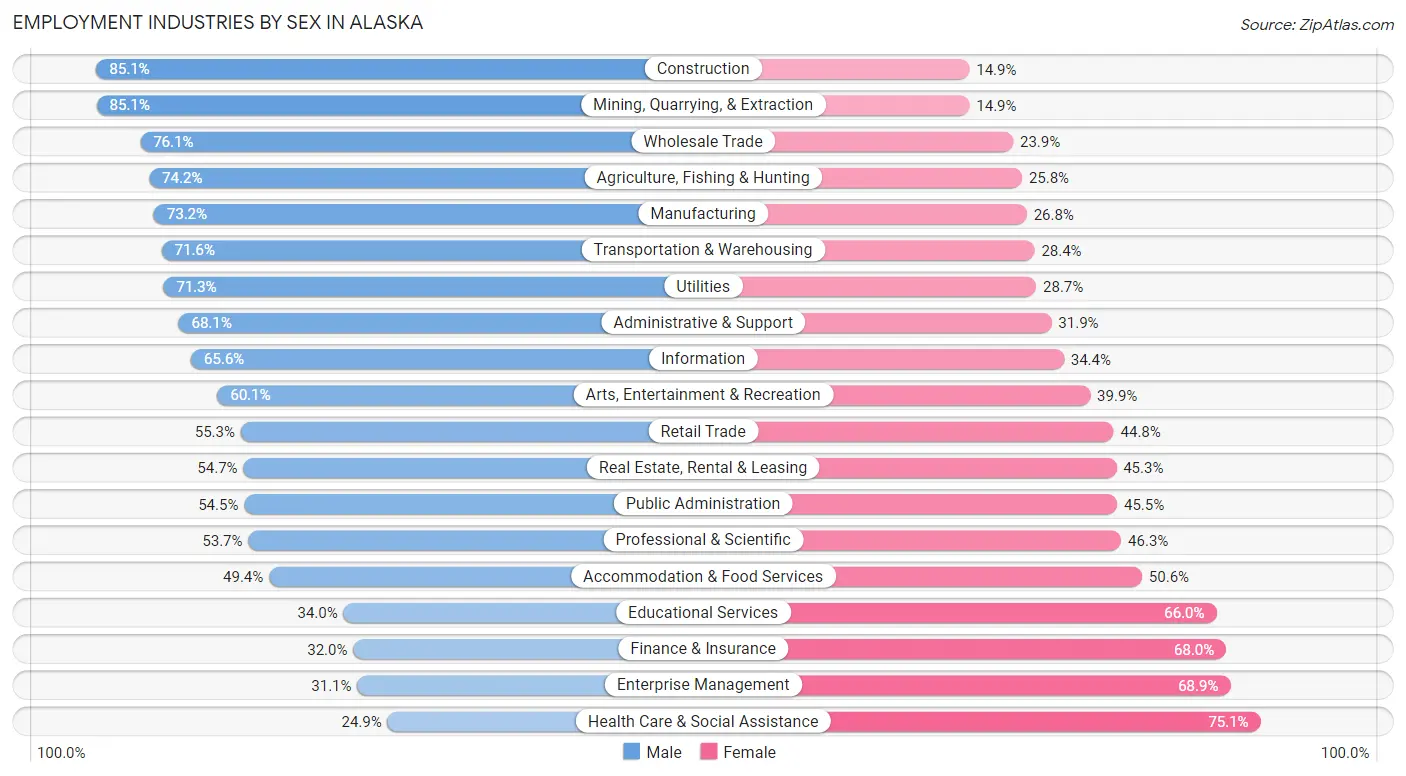
Employment Industries by Sex in Alaska
The Alaska industries that see more men than women are Construction (85.1%), Mining, Quarrying, & Extraction (85.1%), and Wholesale Trade (76.1%), whereas the industries that tend to have a higher number of women are Health Care & Social Assistance (75.1%), Enterprise Management (68.9%), and Finance & Insurance (68.0%).
| Industry | Male | Female |
| Agriculture, Fishing & Hunting | 4,447 (74.2%) | 1,545 (25.8%) |
| Mining, Quarrying, & Extraction | 8,914 (85.1%) | 1,560 (14.9%) |
| Construction | 19,635 (85.1%) | 3,429 (14.9%) |
| Manufacturing | 10,204 (73.2%) | 3,728 (26.8%) |
| Wholesale Trade | 3,866 (76.1%) | 1,216 (23.9%) |
| Retail Trade | 19,137 (55.2%) | 15,501 (44.8%) |
| Transportation & Warehousing | 18,683 (71.6%) | 7,397 (28.4%) |
| Utilities | 3,563 (71.3%) | 1,435 (28.7%) |
| Information | 3,798 (65.6%) | 1,994 (34.4%) |
| Finance & Insurance | 2,698 (32.0%) | 5,742 (68.0%) |
| Real Estate, Rental & Leasing | 3,142 (54.7%) | 2,601 (45.3%) |
| Professional & Scientific | 9,921 (53.7%) | 8,556 (46.3%) |
| Enterprise Management | 272 (31.1%) | 602 (68.9%) |
| Administrative & Support | 7,034 (68.1%) | 3,290 (31.9%) |
| Educational Services | 10,588 (34.0%) | 20,560 (66.0%) |
| Health Care & Social Assistance | 12,400 (24.9%) | 37,461 (75.1%) |
| Arts, Entertainment & Recreation | 4,335 (60.1%) | 2,877 (39.9%) |
| Accommodation & Food Services | 11,433 (49.4%) | 11,714 (50.6%) |
| Public Administration | 20,966 (54.5%) | 17,477 (45.5%) |
| Total | 182,359 (53.8%) | 156,803 (46.2%) |
Education in Alaska
School Enrollment in Alaska
The most common levels of schooling among the 175,438 students in Alaska are elementary school (40,741 | 23.2%), high school (38,621 | 22.0%), and middle school (38,206 | 21.8%).
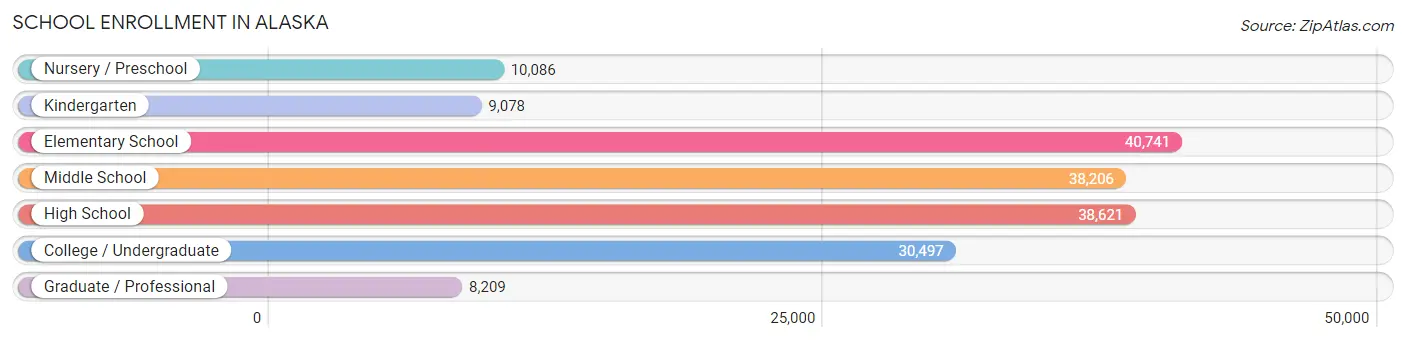
| School Level | # Students | % Students |
| Nursery / Preschool | 10,086 | 5.8% |
| Kindergarten | 9,078 | 5.2% |
| Elementary School | 40,741 | 23.2% |
| Middle School | 38,206 | 21.8% |
| High School | 38,621 | 22.0% |
| College / Undergraduate | 30,497 | 17.4% |
| Graduate / Professional | 8,209 | 4.7% |
| Total | 175,438 | 100.0% |
School Enrollment by Age by Funding Source in Alaska
Out of a total of 175,438 students who are enrolled in schools in Alaska, 27,368 (15.6%) attend a private institution, while the remaining 148,070 (84.4%) are enrolled in public schools. The age group of 3 to 4 year olds has the highest likelihood of being enrolled in private schools, with 2,904 (38.5% in the age bracket) enrolled. Conversely, the age group of 15 to 17 year olds has the lowest likelihood of being enrolled in a private school, with 24,731 (88.4% in the age bracket) attending a public institution.
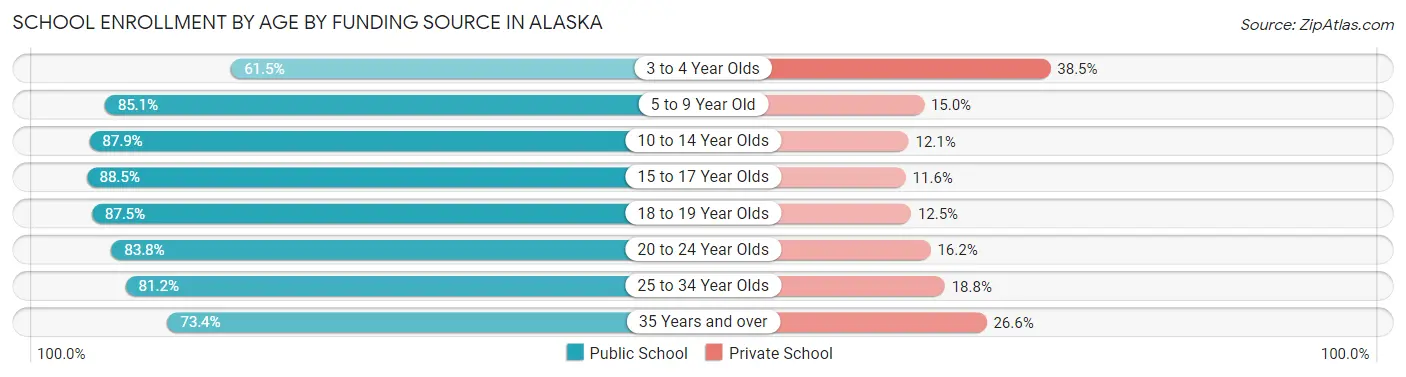
| Age Bracket | Public School | Private School |
| 3 to 4 Year Olds | 4,639 (61.5%) | 2,904 (38.5%) |
| 5 to 9 Year Old | 40,671 (85.1%) | 7,149 (14.9%) |
| 10 to 14 Year Olds | 42,011 (87.9%) | 5,772 (12.1%) |
| 15 to 17 Year Olds | 24,731 (88.4%) | 3,229 (11.6%) |
| 18 to 19 Year Olds | 8,416 (87.5%) | 1,206 (12.5%) |
| 20 to 24 Year Olds | 9,479 (83.8%) | 1,829 (16.2%) |
| 25 to 34 Year Olds | 9,891 (81.2%) | 2,295 (18.8%) |
| 35 Years and over | 8,232 (73.4%) | 2,984 (26.6%) |
| Total | 148,070 (84.4%) | 27,368 (15.6%) |
Educational Attainment by Field of Study in Alaska
Business (22,680 | 14.0%), education (21,076 | 13.0%), bio, nature & agricultural (17,090 | 10.5%), science & technology (16,956 | 10.4%), and social sciences (13,183 | 8.1%) are the most common fields of study among 162,381 individuals in Alaska who have obtained a bachelor's degree or higher.
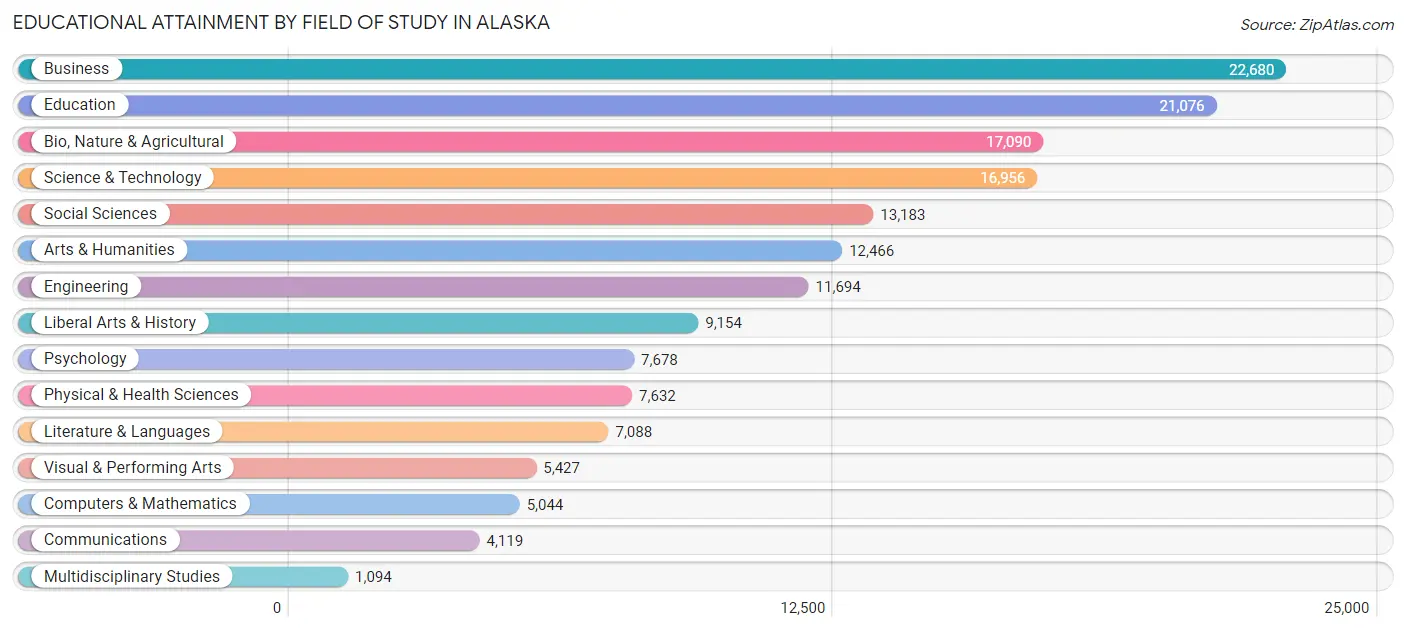
| Field of Study | # Graduates | % Graduates |
| Computers & Mathematics | 5,044 | 3.1% |
| Bio, Nature & Agricultural | 17,090 | 10.5% |
| Physical & Health Sciences | 7,632 | 4.7% |
| Psychology | 7,678 | 4.7% |
| Social Sciences | 13,183 | 8.1% |
| Engineering | 11,694 | 7.2% |
| Multidisciplinary Studies | 1,094 | 0.7% |
| Science & Technology | 16,956 | 10.4% |
| Business | 22,680 | 14.0% |
| Education | 21,076 | 13.0% |
| Literature & Languages | 7,088 | 4.4% |
| Liberal Arts & History | 9,154 | 5.6% |
| Visual & Performing Arts | 5,427 | 3.3% |
| Communications | 4,119 | 2.5% |
| Arts & Humanities | 12,466 | 7.7% |
| Total | 162,381 | 100.0% |
Transportation & Commute in Alaska
Vehicle Availability by Sex in Alaska
The most prevalent vehicle ownership categories in Alaska are males with 2 vehicles (72,792, accounting for 40.3%) and females with 2 vehicles (58,202, making up 48.1%).
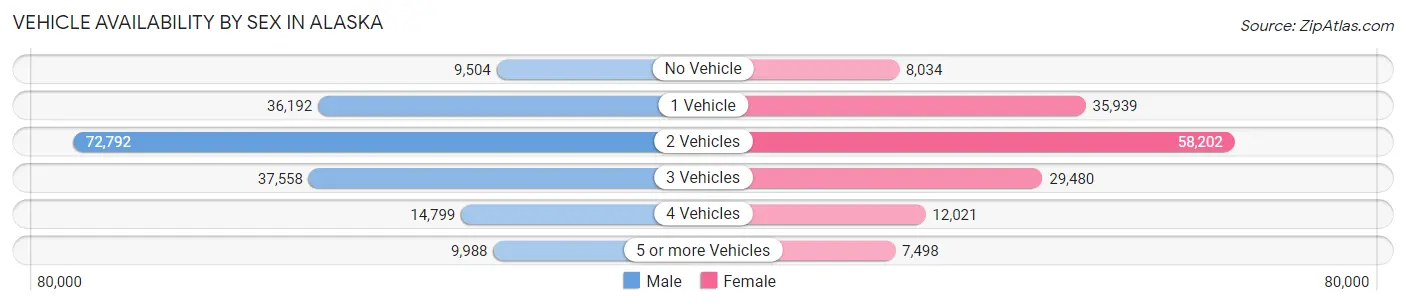
| Vehicles Available | Male | Female |
| No Vehicle | 9,504 (5.3%) | 8,034 (5.3%) |
| 1 Vehicle | 36,192 (20.0%) | 35,939 (23.8%) |
| 2 Vehicles | 72,792 (40.3%) | 58,202 (38.5%) |
| 3 Vehicles | 37,558 (20.8%) | 29,480 (19.5%) |
| 4 Vehicles | 14,799 (8.2%) | 12,021 (8.0%) |
| 5 or more Vehicles | 9,988 (5.5%) | 7,498 (5.0%) |
| Total | 180,833 (100.0%) | 151,174 (100.0%) |
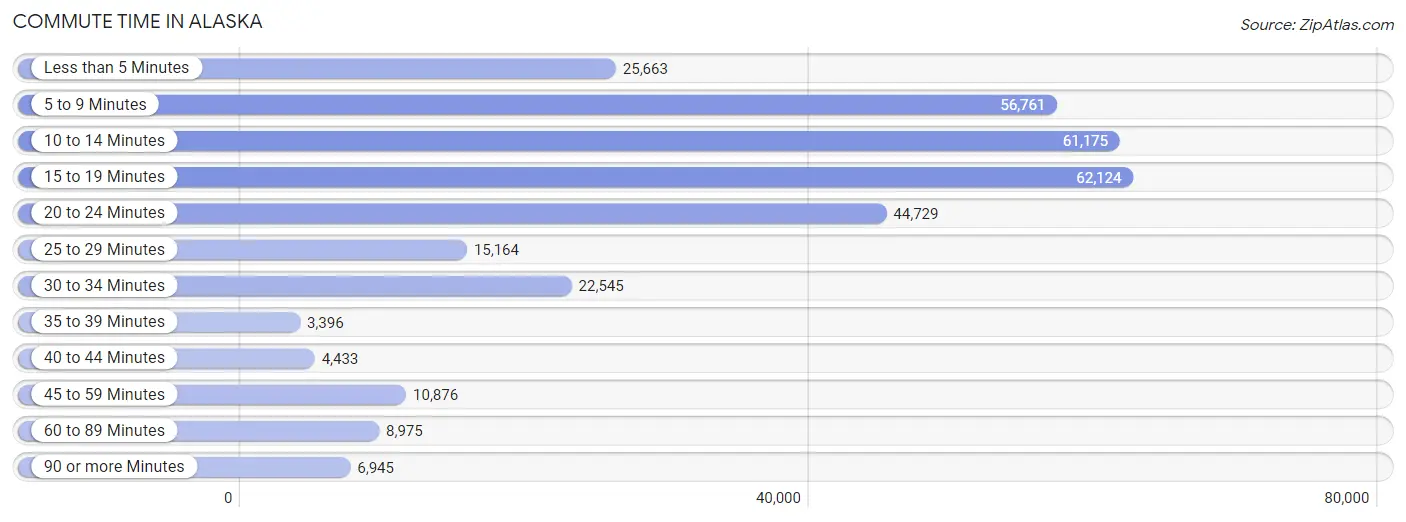
Commute Time in Alaska
The most frequently occuring commute durations in Alaska are 15 to 19 minutes (62,124 commuters, 19.3%), 10 to 14 minutes (61,175 commuters, 19.0%), and 5 to 9 minutes (56,761 commuters, 17.6%).
| Commute Time | # Commuters | % Commuters |
| Less than 5 Minutes | 25,663 | 8.0% |
| 5 to 9 Minutes | 56,761 | 17.6% |
| 10 to 14 Minutes | 61,175 | 19.0% |
| 15 to 19 Minutes | 62,124 | 19.3% |
| 20 to 24 Minutes | 44,729 | 13.9% |
| 25 to 29 Minutes | 15,164 | 4.7% |
| 30 to 34 Minutes | 22,545 | 7.0% |
| 35 to 39 Minutes | 3,396 | 1.1% |
| 40 to 44 Minutes | 4,433 | 1.4% |
| 45 to 59 Minutes | 10,876 | 3.4% |
| 60 to 89 Minutes | 8,975 | 2.8% |
| 90 or more Minutes | 6,945 | 2.1% |
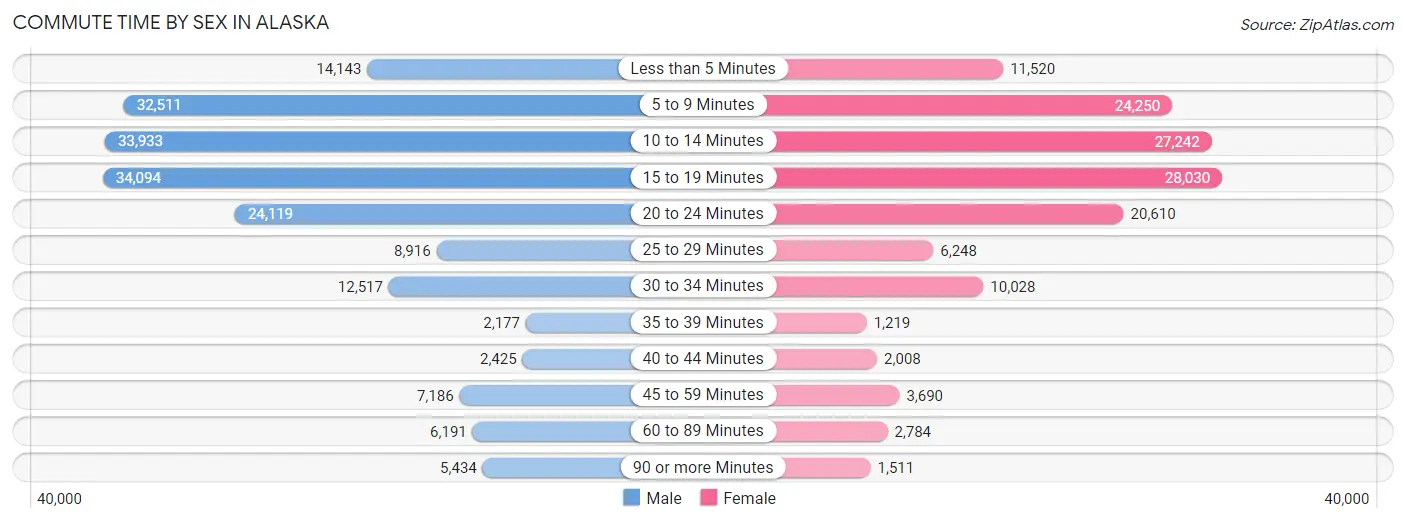
Commute Time by Sex in Alaska
The most common commute times in Alaska are 15 to 19 minutes (34,094 commuters, 18.6%) for males and 15 to 19 minutes (28,030 commuters, 20.2%) for females.
| Commute Time | Male | Female |
| Less than 5 Minutes | 14,143 (7.7%) | 11,520 (8.3%) |
| 5 to 9 Minutes | 32,511 (17.7%) | 24,250 (17.4%) |
| 10 to 14 Minutes | 33,933 (18.5%) | 27,242 (19.6%) |
| 15 to 19 Minutes | 34,094 (18.6%) | 28,030 (20.2%) |
| 20 to 24 Minutes | 24,119 (13.1%) | 20,610 (14.8%) |
| 25 to 29 Minutes | 8,916 (4.9%) | 6,248 (4.5%) |
| 30 to 34 Minutes | 12,517 (6.8%) | 10,028 (7.2%) |
| 35 to 39 Minutes | 2,177 (1.2%) | 1,219 (0.9%) |
| 40 to 44 Minutes | 2,425 (1.3%) | 2,008 (1.4%) |
| 45 to 59 Minutes | 7,186 (3.9%) | 3,690 (2.6%) |
| 60 to 89 Minutes | 6,191 (3.4%) | 2,784 (2.0%) |
| 90 or more Minutes | 5,434 (3.0%) | 1,511 (1.1%) |
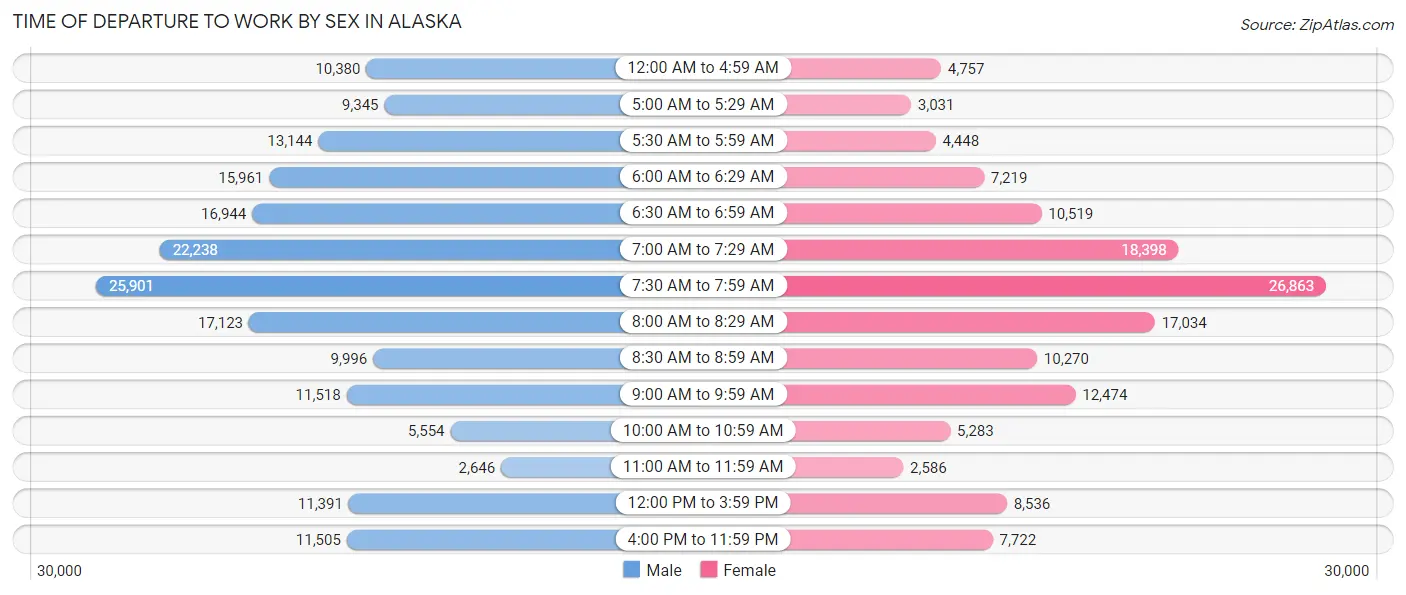
Time of Departure to Work by Sex in Alaska
The most frequent times of departure to work in Alaska are 7:30 AM to 7:59 AM (25,901, 14.1%) for males and 7:30 AM to 7:59 AM (26,863, 19.3%) for females.
| Time of Departure | Male | Female |
| 12:00 AM to 4:59 AM | 10,380 (5.7%) | 4,757 (3.4%) |
| 5:00 AM to 5:29 AM | 9,345 (5.1%) | 3,031 (2.2%) |
| 5:30 AM to 5:59 AM | 13,144 (7.2%) | 4,448 (3.2%) |
| 6:00 AM to 6:29 AM | 15,961 (8.7%) | 7,219 (5.2%) |
| 6:30 AM to 6:59 AM | 16,944 (9.2%) | 10,519 (7.6%) |
| 7:00 AM to 7:29 AM | 22,238 (12.1%) | 18,398 (13.2%) |
| 7:30 AM to 7:59 AM | 25,901 (14.1%) | 26,863 (19.3%) |
| 8:00 AM to 8:29 AM | 17,123 (9.3%) | 17,034 (12.2%) |
| 8:30 AM to 8:59 AM | 9,996 (5.4%) | 10,270 (7.4%) |
| 9:00 AM to 9:59 AM | 11,518 (6.3%) | 12,474 (9.0%) |
| 10:00 AM to 10:59 AM | 5,554 (3.0%) | 5,283 (3.8%) |
| 11:00 AM to 11:59 AM | 2,646 (1.4%) | 2,586 (1.9%) |
| 12:00 PM to 3:59 PM | 11,391 (6.2%) | 8,536 (6.1%) |
| 4:00 PM to 11:59 PM | 11,505 (6.3%) | 7,722 (5.6%) |
| Total | 183,646 (100.0%) | 139,140 (100.0%) |
Housing Occupancy in Alaska
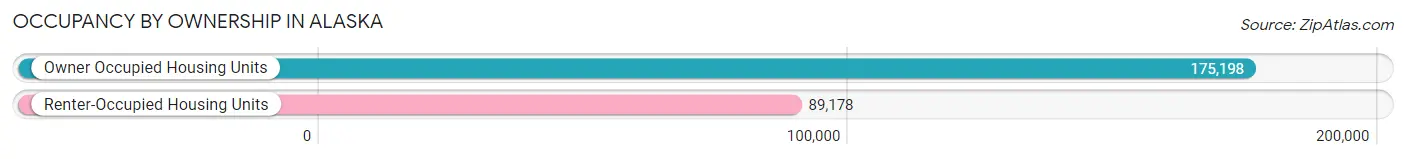
Occupancy by Ownership in Alaska
Of the total 264,376 dwellings in Alaska, owner-occupied units account for 175,198 (66.3%), while renter-occupied units make up 89,178 (33.7%).
| Occupancy | # Housing Units | % Housing Units |
| Owner Occupied Housing Units | 175,198 | 66.3% |
| Renter-Occupied Housing Units | 89,178 | 33.7% |
| Total Occupied Housing Units | 264,376 | 100.0% |
Occupancy by Household Size in Alaska
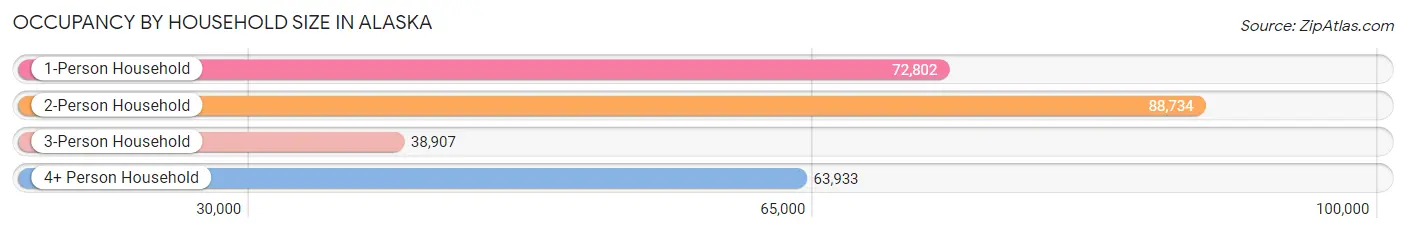
| Household Size | # Housing Units | % Housing Units |
| 1-Person Household | 72,802 | 27.5% |
| 2-Person Household | 88,734 | 33.6% |
| 3-Person Household | 38,907 | 14.7% |
| 4+ Person Household | 63,933 | 24.2% |
| Total Housing Units | 264,376 | 100.0% |
Occupancy by Ownership by Household Size in Alaska
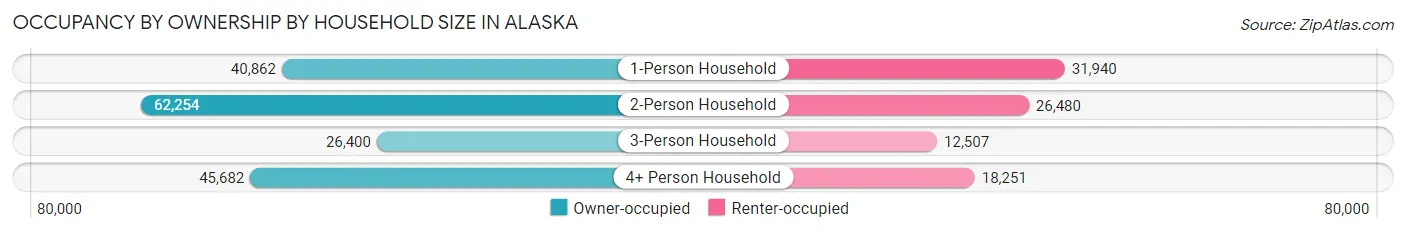
| Household Size | Owner-occupied | Renter-occupied |
| 1-Person Household | 40,862 (56.1%) | 31,940 (43.9%) |
| 2-Person Household | 62,254 (70.2%) | 26,480 (29.8%) |
| 3-Person Household | 26,400 (67.8%) | 12,507 (32.2%) |
| 4+ Person Household | 45,682 (71.5%) | 18,251 (28.5%) |
| Total Housing Units | 175,198 (66.3%) | 89,178 (33.7%) |
Occupancy by Educational Attainment in Alaska
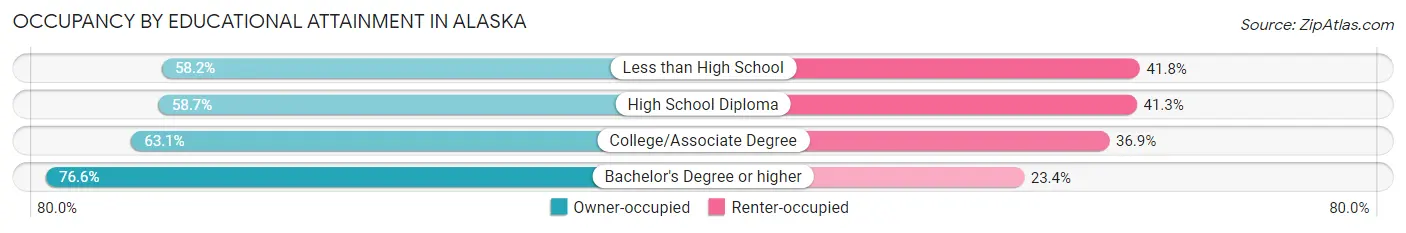
| Household Size | Owner-occupied | Renter-occupied |
| Less than High School | 8,098 (58.2%) | 5,813 (41.8%) |
| High School Diploma | 37,705 (58.7%) | 26,524 (41.3%) |
| College/Associate Degree | 61,681 (63.1%) | 36,131 (36.9%) |
| Bachelor's Degree or higher | 67,714 (76.6%) | 20,710 (23.4%) |
Occupancy by Age of Householder in Alaska
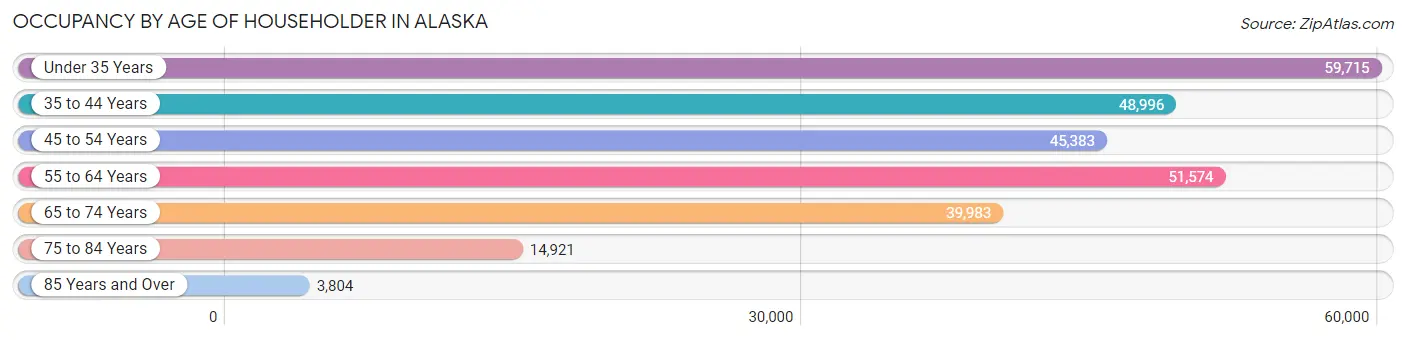
| Age Bracket | # Households | % Households |
| Under 35 Years | 59,715 | 22.6% |
| 35 to 44 Years | 48,996 | 18.5% |
| 45 to 54 Years | 45,383 | 17.2% |
| 55 to 64 Years | 51,574 | 19.5% |
| 65 to 74 Years | 39,983 | 15.1% |
| 75 to 84 Years | 14,921 | 5.6% |
| 85 Years and Over | 3,804 | 1.4% |
| Total | 264,376 | 100.0% |
Housing Finances in Alaska
Median Income by Occupancy in Alaska
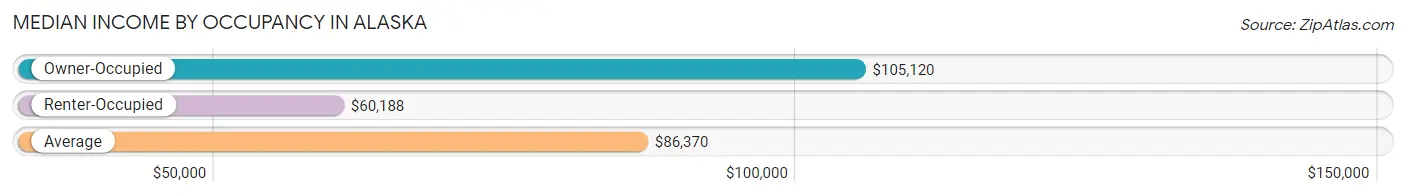
| Occupancy Type | # Households | Median Income |
| Owner-Occupied | 175,198 (66.3%) | $105,120 |
| Renter-Occupied | 89,178 (33.7%) | $60,188 |
| Average | 264,376 (100.0%) | $86,370 |
Occupancy by Householder Income Bracket in Alaska
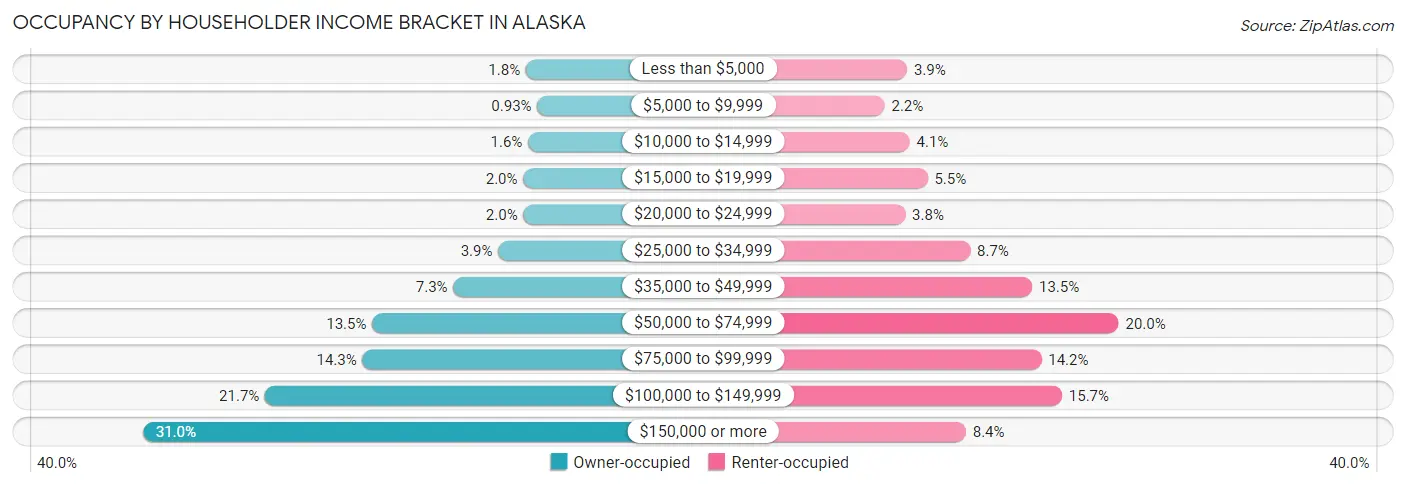
| Income Bracket | Owner-occupied | Renter-occupied |
| Less than $5,000 | 3,146 (1.8%) | 3,492 (3.9%) |
| $5,000 to $9,999 | 1,624 (0.9%) | 1,970 (2.2%) |
| $10,000 to $14,999 | 2,858 (1.6%) | 3,674 (4.1%) |
| $15,000 to $19,999 | 3,510 (2.0%) | 4,886 (5.5%) |
| $20,000 to $24,999 | 3,478 (2.0%) | 3,371 (3.8%) |
| $25,000 to $34,999 | 6,852 (3.9%) | 7,786 (8.7%) |
| $35,000 to $49,999 | 12,836 (7.3%) | 11,998 (13.5%) |
| $50,000 to $74,999 | 23,674 (13.5%) | 17,870 (20.0%) |
| $75,000 to $99,999 | 24,968 (14.2%) | 12,622 (14.1%) |
| $100,000 to $149,999 | 37,966 (21.7%) | 14,022 (15.7%) |
| $150,000 or more | 54,286 (31.0%) | 7,487 (8.4%) |
| Total | 175,198 (100.0%) | 89,178 (100.0%) |
Monthly Housing Cost Tiers in Alaska
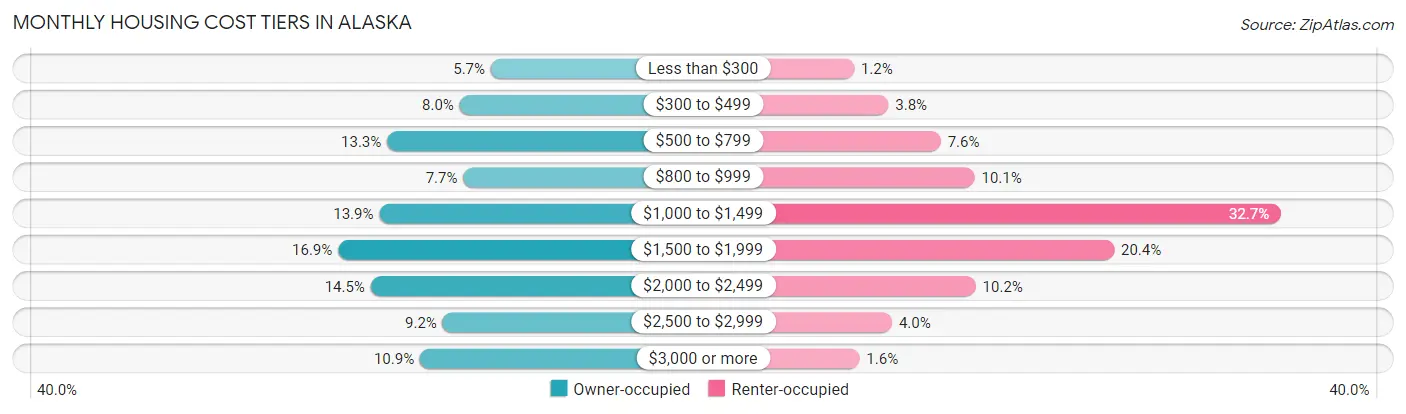
| Monthly Cost | Owner-occupied | Renter-occupied |
| Less than $300 | 9,915 (5.7%) | 1,088 (1.2%) |
| $300 to $499 | 13,945 (8.0%) | 3,342 (3.7%) |
| $500 to $799 | 23,305 (13.3%) | 6,790 (7.6%) |
| $800 to $999 | 13,480 (7.7%) | 9,003 (10.1%) |
| $1,000 to $1,499 | 24,323 (13.9%) | 29,138 (32.7%) |
| $1,500 to $1,999 | 29,618 (16.9%) | 18,169 (20.4%) |
| $2,000 to $2,499 | 25,415 (14.5%) | 9,081 (10.2%) |
| $2,500 to $2,999 | 16,129 (9.2%) | 3,584 (4.0%) |
| $3,000 or more | 19,068 (10.9%) | 1,443 (1.6%) |
| Total | 175,198 (100.0%) | 89,178 (100.0%) |
Physical Housing Characteristics in Alaska
Housing Structures in Alaska
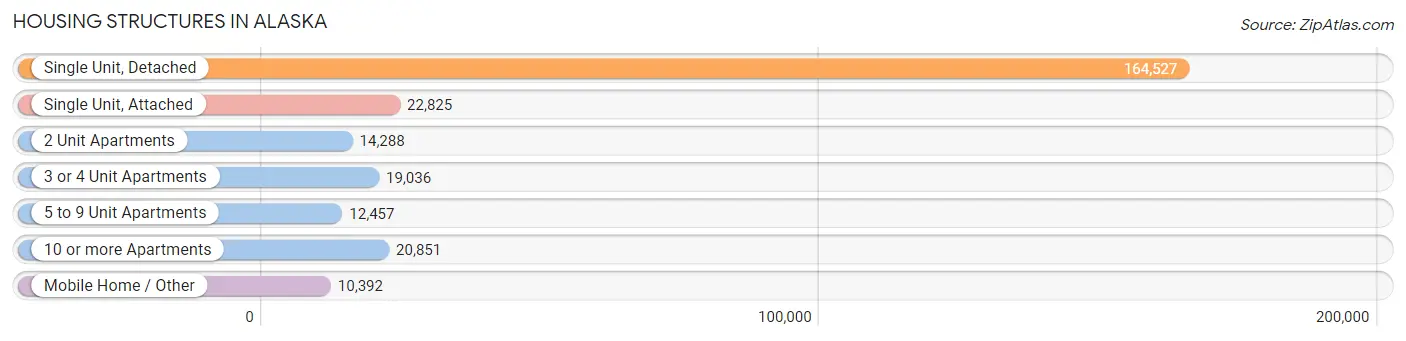
| Structure Type | # Housing Units | % Housing Units |
| Single Unit, Detached | 164,527 | 62.2% |
| Single Unit, Attached | 22,825 | 8.6% |
| 2 Unit Apartments | 14,288 | 5.4% |
| 3 or 4 Unit Apartments | 19,036 | 7.2% |
| 5 to 9 Unit Apartments | 12,457 | 4.7% |
| 10 or more Apartments | 20,851 | 7.9% |
| Mobile Home / Other | 10,392 | 3.9% |
| Total | 264,376 | 100.0% |
Housing Structures by Occupancy in Alaska
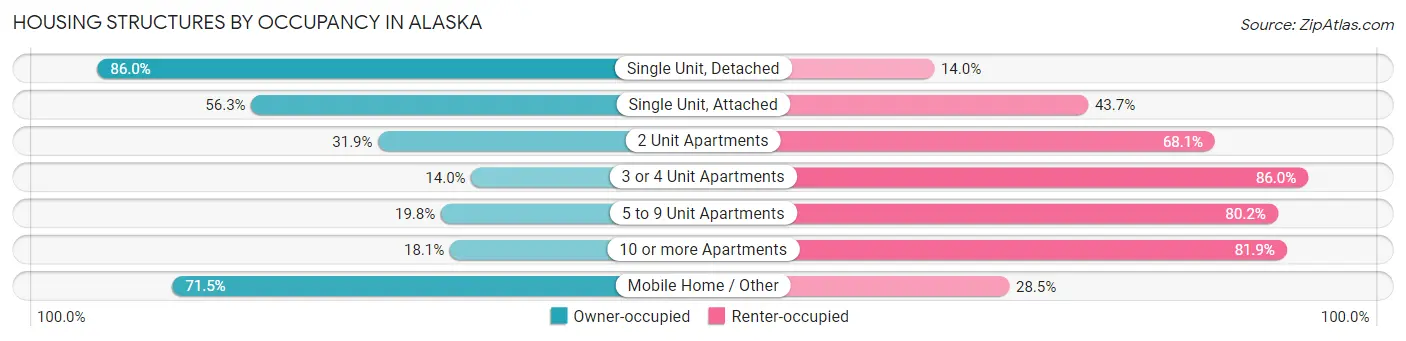
| Structure Type | Owner-occupied | Renter-occupied |
| Single Unit, Detached | 141,454 (86.0%) | 23,073 (14.0%) |
| Single Unit, Attached | 12,857 (56.3%) | 9,968 (43.7%) |
| 2 Unit Apartments | 4,556 (31.9%) | 9,732 (68.1%) |
| 3 or 4 Unit Apartments | 2,660 (14.0%) | 16,376 (86.0%) |
| 5 to 9 Unit Apartments | 2,469 (19.8%) | 9,988 (80.2%) |
| 10 or more Apartments | 3,769 (18.1%) | 17,082 (81.9%) |
| Mobile Home / Other | 7,433 (71.5%) | 2,959 (28.5%) |
| Total | 175,198 (66.3%) | 89,178 (33.7%) |
Housing Structures by Number of Rooms in Alaska
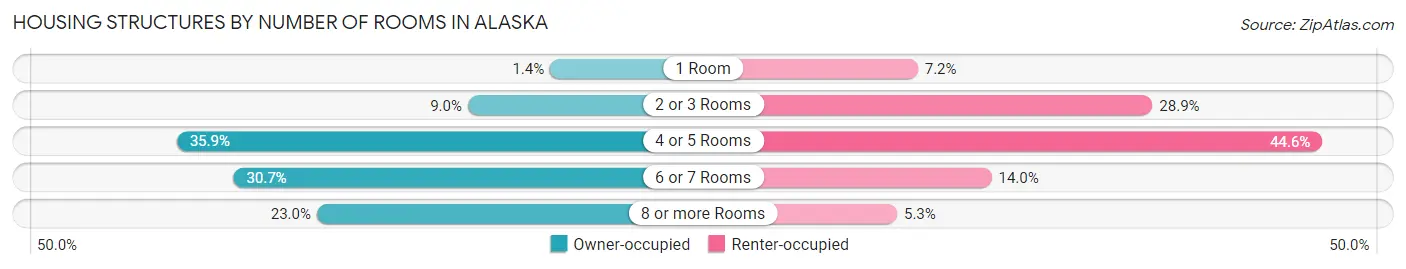
| Number of Rooms | Owner-occupied | Renter-occupied |
| 1 Room | 2,453 (1.4%) | 6,419 (7.2%) |
| 2 or 3 Rooms | 15,785 (9.0%) | 25,773 (28.9%) |
| 4 or 5 Rooms | 62,945 (35.9%) | 39,773 (44.6%) |
| 6 or 7 Rooms | 53,747 (30.7%) | 12,500 (14.0%) |
| 8 or more Rooms | 40,268 (23.0%) | 4,713 (5.3%) |
| Total | 175,198 (100.0%) | 89,178 (100.0%) |
Housing Structure by Heating Type in Alaska
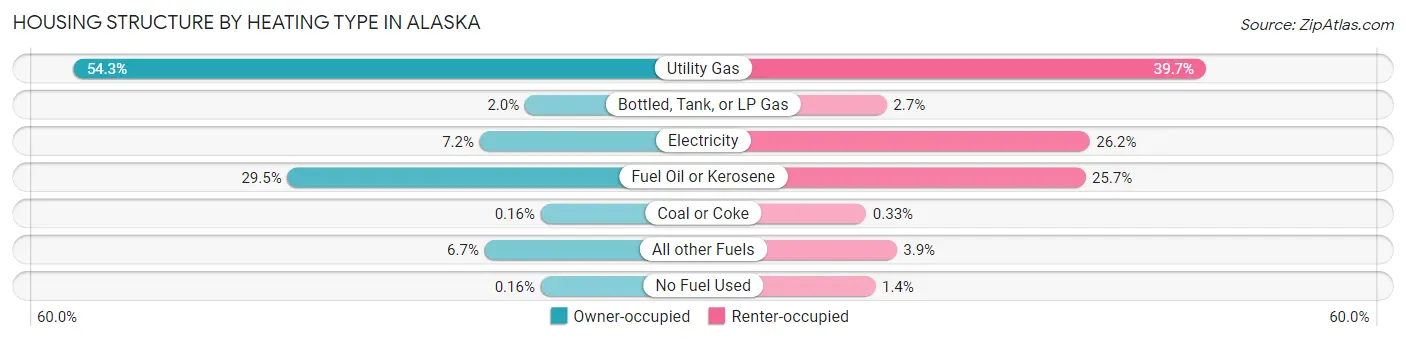
| Heating Type | Owner-occupied | Renter-occupied |
| Utility Gas | 95,132 (54.3%) | 35,437 (39.7%) |
| Bottled, Tank, or LP Gas | 3,477 (2.0%) | 2,419 (2.7%) |
| Electricity | 12,655 (7.2%) | 23,394 (26.2%) |
| Fuel Oil or Kerosene | 51,724 (29.5%) | 22,951 (25.7%) |
| Coal or Coke | 276 (0.2%) | 291 (0.3%) |
| All other Fuels | 11,652 (6.7%) | 3,446 (3.9%) |
| No Fuel Used | 282 (0.2%) | 1,240 (1.4%) |
| Total | 175,198 (100.0%) | 89,178 (100.0%) |
Household Vehicle Usage in Alaska
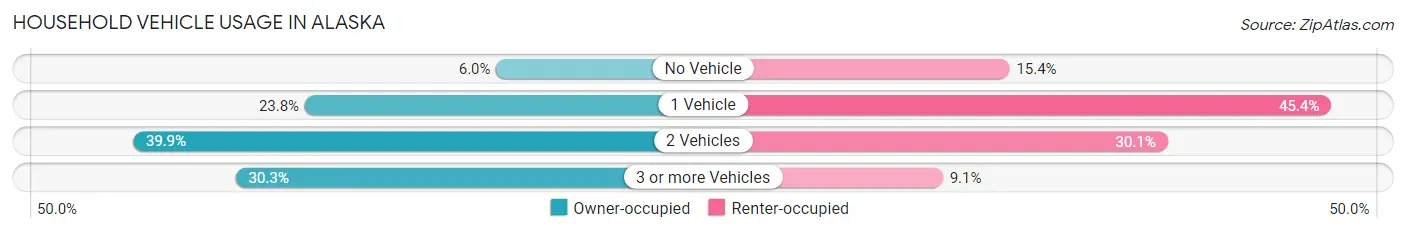
| Vehicles per Household | Owner-occupied | Renter-occupied |
| No Vehicle | 10,450 (6.0%) | 13,697 (15.4%) |
| 1 Vehicle | 41,753 (23.8%) | 40,481 (45.4%) |
| 2 Vehicles | 69,896 (39.9%) | 26,856 (30.1%) |
| 3 or more Vehicles | 53,099 (30.3%) | 8,144 (9.1%) |
| Total | 175,198 (100.0%) | 89,178 (100.0%) |
Real Estate & Mortgages in Alaska
Real Estate and Mortgage Overview in Alaska
| Characteristic | Without Mortgage | With Mortgage |
| Housing Units | 68,390 | 106,808 |
| Median Property Value | $267,600 | $341,700 |
| Median Household Income | $78,358 | $39,309 |
| Monthly Housing Costs | $652 | $18,957 |
| Real Estate Taxes | $2,860 | $9,738 |
Property Value by Mortgage Status in Alaska
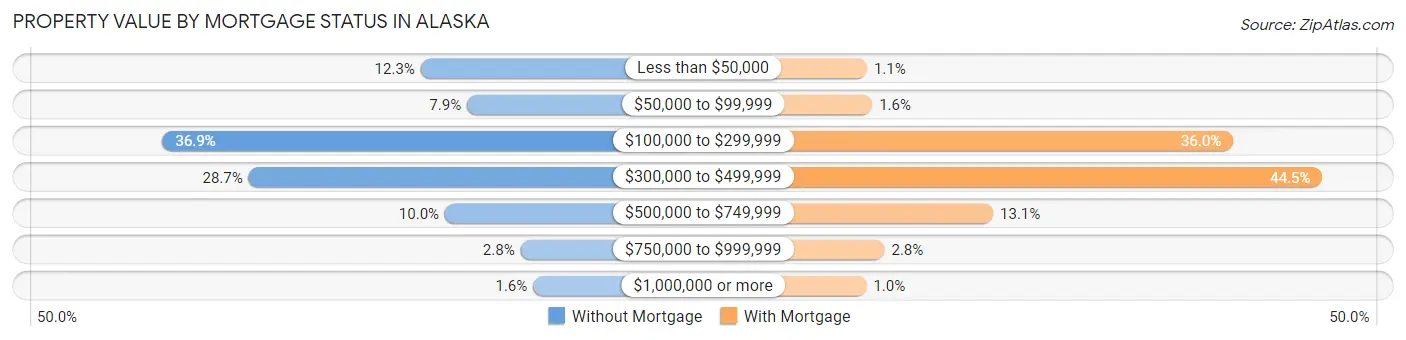
| Property Value | Without Mortgage | With Mortgage |
| Less than $50,000 | 8,401 (12.3%) | 1,167 (1.1%) |
| $50,000 to $99,999 | 5,380 (7.9%) | 1,697 (1.6%) |
| $100,000 to $299,999 | 25,216 (36.9%) | 38,413 (36.0%) |
| $300,000 to $499,999 | 19,605 (28.7%) | 47,481 (44.5%) |
| $500,000 to $749,999 | 6,821 (10.0%) | 13,991 (13.1%) |
| $750,000 to $999,999 | 1,895 (2.8%) | 2,944 (2.8%) |
| $1,000,000 or more | 1,072 (1.6%) | 1,115 (1.0%) |
| Total | 68,390 (100.0%) | 106,808 (100.0%) |
Household Income by Mortgage Status in Alaska
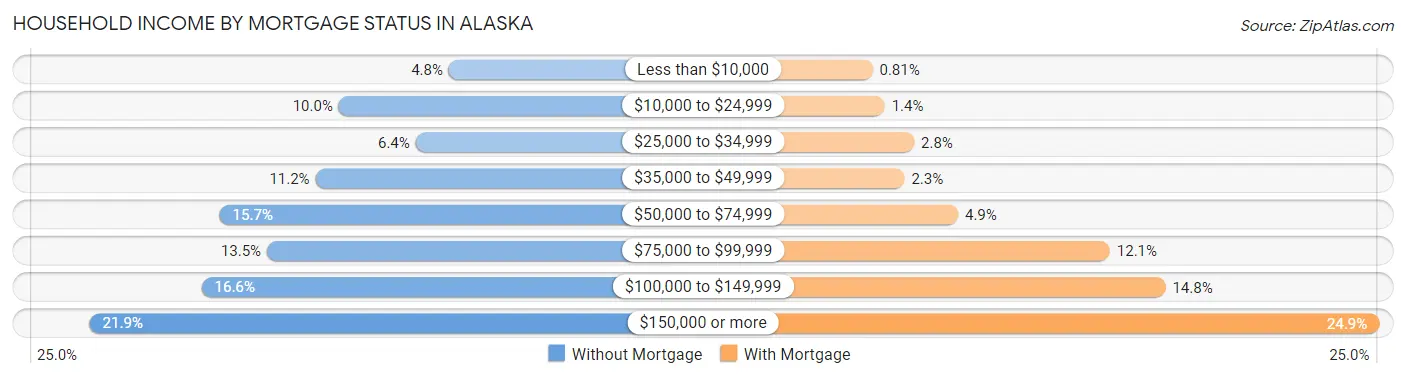
| Household Income | Without Mortgage | With Mortgage |
| Less than $10,000 | 3,282 (4.8%) | 868 (0.8%) |
| $10,000 to $24,999 | 6,869 (10.0%) | 1,488 (1.4%) |
| $25,000 to $34,999 | 4,360 (6.4%) | 2,977 (2.8%) |
| $35,000 to $49,999 | 7,624 (11.2%) | 2,492 (2.3%) |
| $50,000 to $74,999 | 10,741 (15.7%) | 5,212 (4.9%) |
| $75,000 to $99,999 | 9,202 (13.5%) | 12,933 (12.1%) |
| $100,000 to $149,999 | 11,335 (16.6%) | 15,766 (14.8%) |
| $150,000 or more | 14,977 (21.9%) | 26,631 (24.9%) |
| Total | 68,390 (100.0%) | 106,808 (100.0%) |
Property Value to Household Income Ratio in Alaska
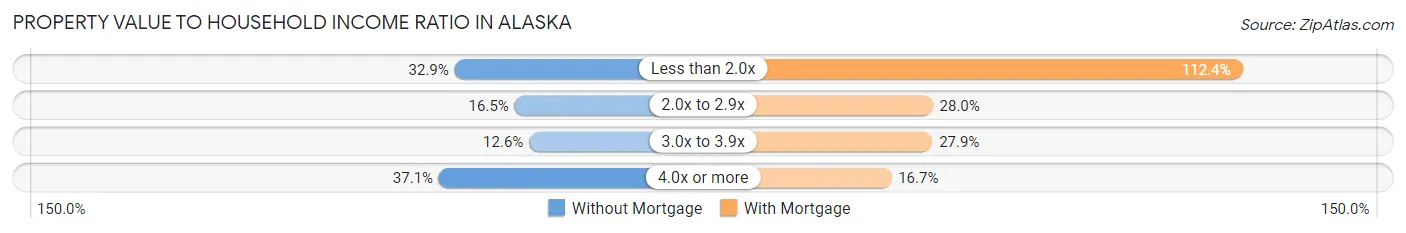
| Value-to-Income Ratio | Without Mortgage | With Mortgage |
| Less than 2.0x | 22,470 (32.9%) | 120,033 (112.4%) |
| 2.0x to 2.9x | 11,281 (16.5%) | 29,873 (28.0%) |
| 3.0x to 3.9x | 8,581 (12.6%) | 29,759 (27.9%) |
| 4.0x or more | 25,396 (37.1%) | 17,841 (16.7%) |
| Total | 68,390 (100.0%) | 106,808 (100.0%) |
Real Estate Taxes by Mortgage Status in Alaska
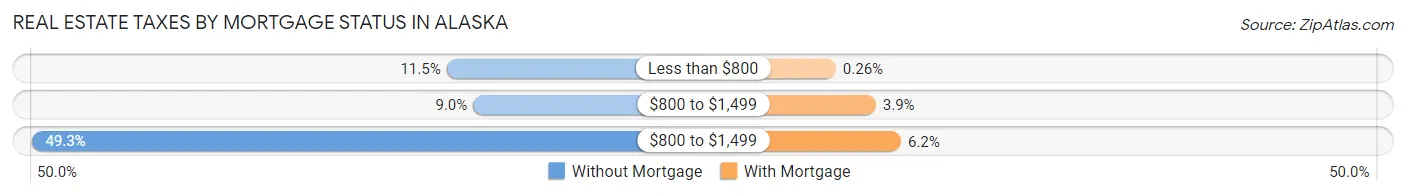
| Property Taxes | Without Mortgage | With Mortgage |
| Less than $800 | 7,841 (11.5%) | 283 (0.3%) |
| $800 to $1,499 | 6,181 (9.0%) | 4,181 (3.9%) |
| $800 to $1,499 | 33,700 (49.3%) | 6,630 (6.2%) |
| Total | 68,390 (100.0%) | 106,808 (100.0%) |
Health & Disability in Alaska
Health Insurance Coverage by Age in Alaska
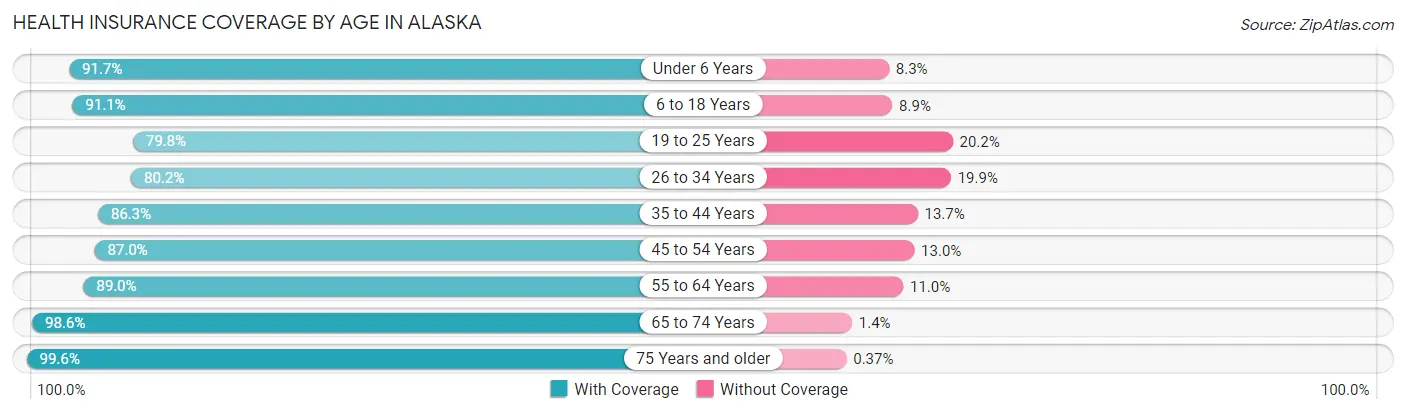
| Age Bracket | With Coverage | Without Coverage |
| Under 6 Years | 54,387 (91.7%) | 4,932 (8.3%) |
| 6 to 18 Years | 117,133 (91.1%) | 11,477 (8.9%) |
| 19 to 25 Years | 50,499 (79.8%) | 12,767 (20.2%) |
| 26 to 34 Years | 75,427 (80.1%) | 18,684 (19.9%) |
| 35 to 44 Years | 80,918 (86.3%) | 12,803 (13.7%) |
| 45 to 54 Years | 73,098 (87.0%) | 10,950 (13.0%) |
| 55 to 64 Years | 80,860 (89.0%) | 9,953 (11.0%) |
| 65 to 74 Years | 61,971 (98.6%) | 887 (1.4%) |
| 75 Years and older | 29,537 (99.6%) | 109 (0.4%) |
| Total | 623,830 (88.3%) | 82,562 (11.7%) |
Health Insurance Coverage by Citizenship Status in Alaska
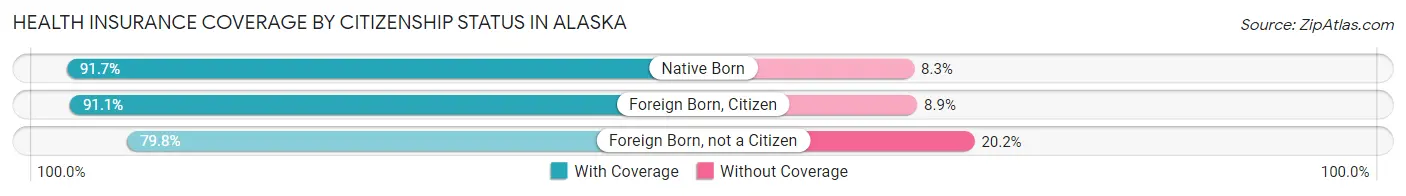
| Citizenship Status | With Coverage | Without Coverage |
| Native Born | 54,387 (91.7%) | 4,932 (8.3%) |
| Foreign Born, Citizen | 117,133 (91.1%) | 11,477 (8.9%) |
| Foreign Born, not a Citizen | 50,499 (79.8%) | 12,767 (20.2%) |
Health Insurance Coverage by Household Income in Alaska
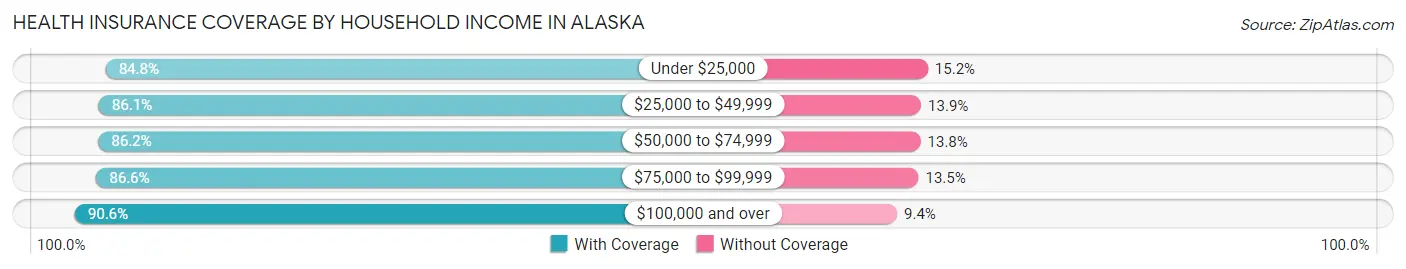
| Household Income | With Coverage | Without Coverage |
| Under $25,000 | 46,382 (84.8%) | 8,316 (15.2%) |
| $25,000 to $49,999 | 71,209 (86.1%) | 11,529 (13.9%) |
| $50,000 to $74,999 | 84,170 (86.2%) | 13,510 (13.8%) |
| $75,000 to $99,999 | 85,929 (86.6%) | 13,352 (13.5%) |
| $100,000 and over | 321,531 (90.6%) | 33,419 (9.4%) |
Public vs Private Health Insurance Coverage by Age in Alaska
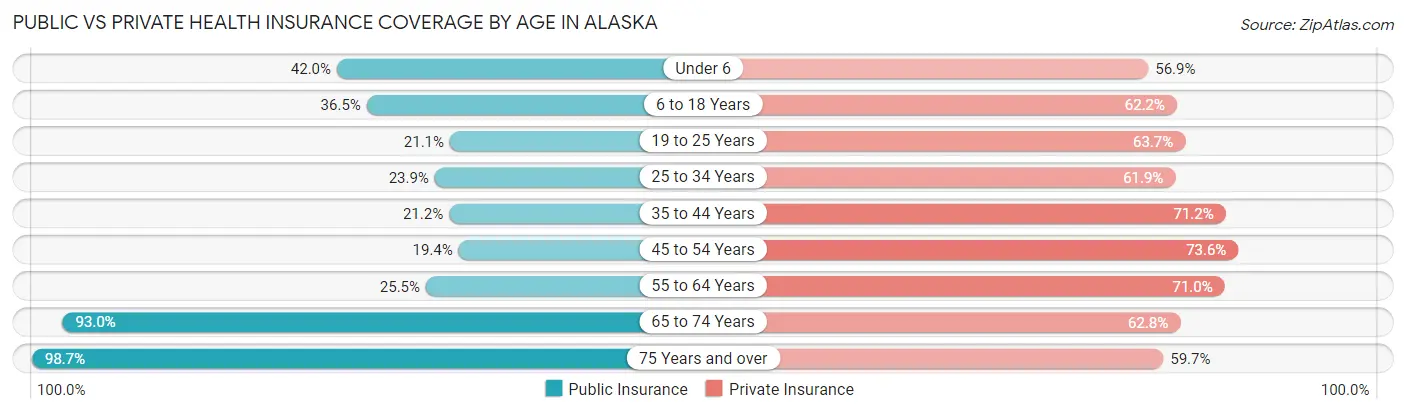
| Age Bracket | Public Insurance | Private Insurance |
| Under 6 | 24,936 (42.0%) | 33,746 (56.9%) |
| 6 to 18 Years | 46,951 (36.5%) | 79,983 (62.2%) |
| 19 to 25 Years | 13,325 (21.1%) | 40,298 (63.7%) |
| 25 to 34 Years | 22,477 (23.9%) | 58,239 (61.9%) |
| 35 to 44 Years | 19,897 (21.2%) | 66,745 (71.2%) |
| 45 to 54 Years | 16,339 (19.4%) | 61,837 (73.6%) |
| 55 to 64 Years | 23,174 (25.5%) | 64,516 (71.0%) |
| 65 to 74 Years | 58,440 (93.0%) | 39,465 (62.8%) |
| 75 Years and over | 29,248 (98.7%) | 17,690 (59.7%) |
| Total | 254,787 (36.1%) | 462,519 (65.5%) |
Disability Status by Sex by Age in Alaska
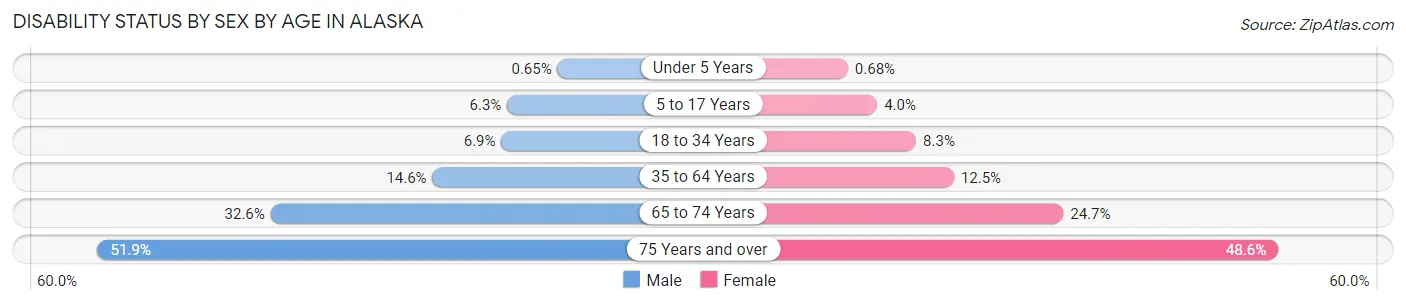
| Age Bracket | Male | Female |
| Under 5 Years | 163 (0.6%) | 162 (0.7%) |
| 5 to 17 Years | 4,183 (6.3%) | 2,494 (4.0%) |
| 18 to 34 Years | 5,906 (6.9%) | 6,686 (8.3%) |
| 35 to 64 Years | 20,300 (14.6%) | 16,160 (12.5%) |
| 65 to 74 Years | 10,627 (32.6%) | 7,466 (24.7%) |
| 75 Years and over | 7,013 (51.9%) | 7,834 (48.6%) |
Disability Class by Sex by Age in Alaska
Disability Class: Hearing Difficulty
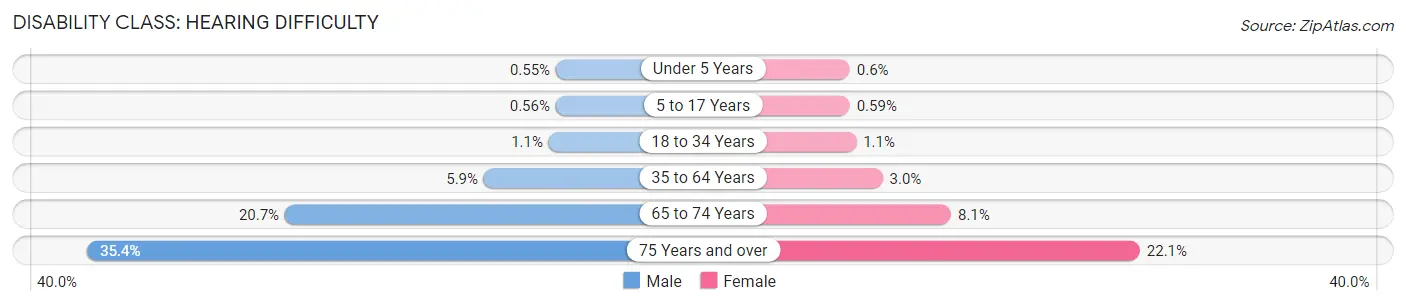
| Age Bracket | Male | Female |
| Under 5 Years | 139 (0.5%) | 142 (0.6%) |
| 5 to 17 Years | 371 (0.6%) | 374 (0.6%) |
| 18 to 34 Years | 927 (1.1%) | 868 (1.1%) |
| 35 to 64 Years | 8,208 (5.9%) | 3,925 (3.0%) |
| 65 to 74 Years | 6,739 (20.7%) | 2,454 (8.1%) |
| 75 Years and over | 4,780 (35.4%) | 3,569 (22.1%) |
Disability Class: Vision Difficulty

| Age Bracket | Male | Female |
| Under 5 Years | 56 (0.2%) | 96 (0.4%) |
| 5 to 17 Years | 437 (0.6%) | 634 (1.0%) |
| 18 to 34 Years | 1,200 (1.4%) | 1,487 (1.8%) |
| 35 to 64 Years | 3,499 (2.5%) | 3,639 (2.8%) |
| 65 to 74 Years | 2,036 (6.2%) | 1,517 (5.0%) |
| 75 Years and over | 1,773 (13.1%) | 1,820 (11.3%) |
Disability Class: Cognitive Difficulty
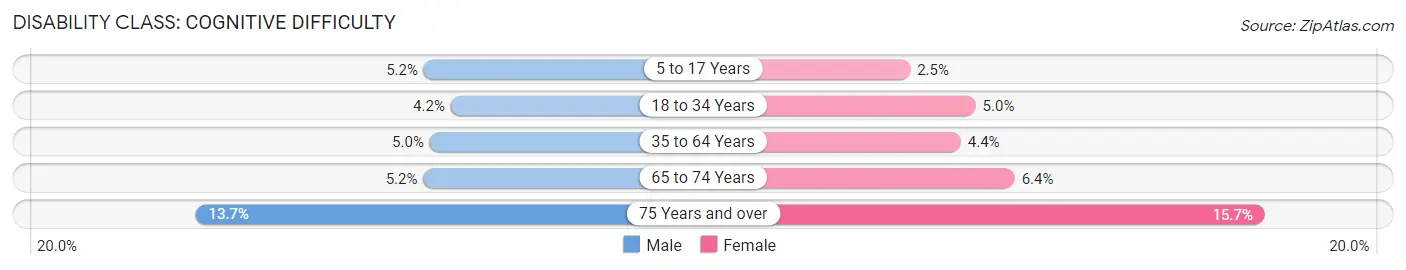
| Age Bracket | Male | Female |
| 5 to 17 Years | 3,463 (5.2%) | 1,606 (2.5%) |
| 18 to 34 Years | 3,579 (4.2%) | 4,012 (5.0%) |
| 35 to 64 Years | 6,902 (5.0%) | 5,716 (4.4%) |
| 65 to 74 Years | 1,694 (5.2%) | 1,944 (6.4%) |
| 75 Years and over | 1,845 (13.7%) | 2,532 (15.7%) |
Disability Class: Ambulatory Difficulty
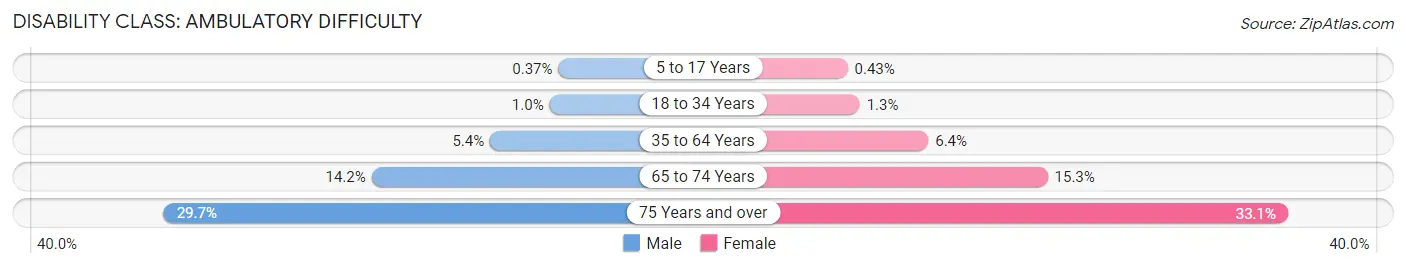
| Age Bracket | Male | Female |
| 5 to 17 Years | 250 (0.4%) | 274 (0.4%) |
| 18 to 34 Years | 881 (1.0%) | 1,078 (1.3%) |
| 35 to 64 Years | 7,568 (5.4%) | 8,304 (6.4%) |
| 65 to 74 Years | 4,643 (14.2%) | 4,625 (15.3%) |
| 75 Years and over | 4,011 (29.7%) | 5,340 (33.1%) |
Disability Class: Self-Care Difficulty
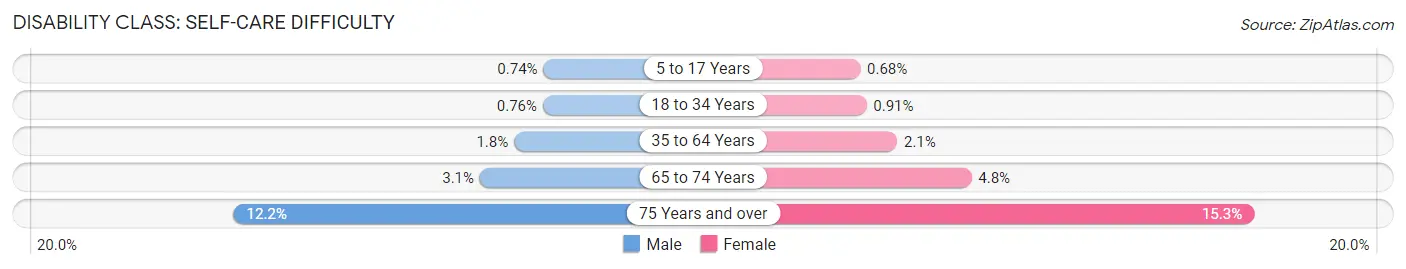
| Age Bracket | Male | Female |
| 5 to 17 Years | 496 (0.7%) | 430 (0.7%) |
| 18 to 34 Years | 647 (0.8%) | 736 (0.9%) |
| 35 to 64 Years | 2,553 (1.8%) | 2,649 (2.1%) |
| 65 to 74 Years | 1,012 (3.1%) | 1,454 (4.8%) |
| 75 Years and over | 1,655 (12.2%) | 2,468 (15.3%) |
Technology Access in Alaska
Computing Device Access in Alaska
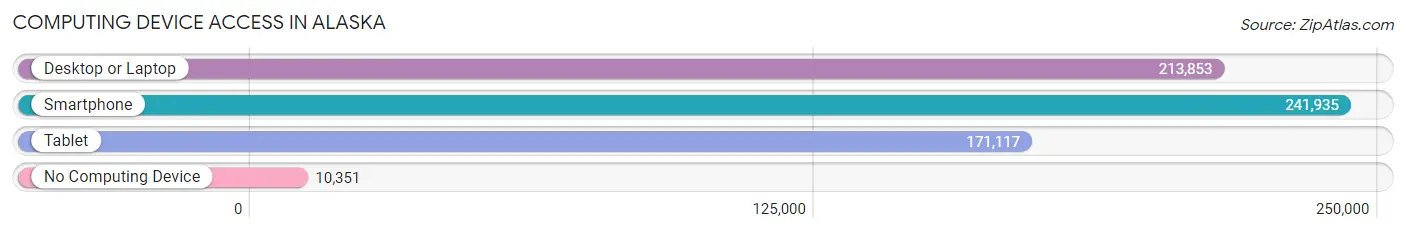
| Device Type | # Households | % Households |
| Desktop or Laptop | 213,853 | 80.9% |
| Smartphone | 241,935 | 91.5% |
| Tablet | 171,117 | 64.7% |
| No Computing Device | 10,351 | 3.9% |
| Total | 264,376 | 100.0% |
Internet Access in Alaska
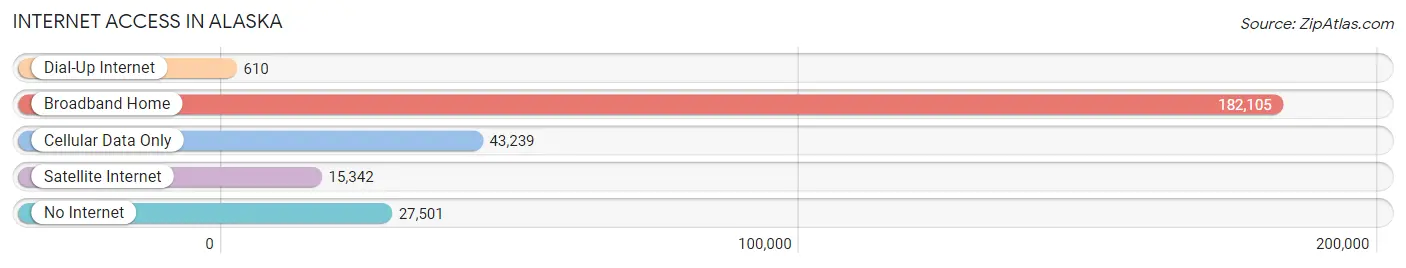
| Internet Type | # Households | % Households |
| Dial-Up Internet | 610 | 0.2% |
| Broadband Home | 182,105 | 68.9% |
| Cellular Data Only | 43,239 | 16.4% |
| Satellite Internet | 15,342 | 5.8% |
| No Internet | 27,501 | 10.4% |
| Total | 264,376 | 100.0% |
Alaska Summary
Alaska is the largest state in the United States, covering an area of 663,268 square miles. It is located in the northwest corner of North America, bordered by Canada to the east, the Arctic Ocean to the north, and the Pacific Ocean to the west. Alaska is known for its rugged terrain, vast wilderness, and abundant wildlife.
History
The history of Alaska dates back thousands of years, with evidence of human habitation in the region as early as 10,000 BC. The first Europeans to explore the area were Russian fur traders, who arrived in the late 18th century. In 1867, the United States purchased Alaska from Russia for $7.2 million, making it the largest land purchase in American history.
Alaska was officially made a U.S. territory in 1912, and in 1959 it became the 49th state. During the 1950s and 1960s, Alaska experienced a period of rapid growth and development, as oil and gas were discovered in the region. This led to an influx of people and money, and the state’s population and economy grew rapidly.
Geography
Alaska is the largest state in the United States, covering an area of 663,268 square miles. It is located in the northwest corner of North America, bordered by Canada to the east, the Arctic Ocean to the north, and the Pacific Ocean to the west.
Alaska is known for its rugged terrain, with mountains, glaciers, and tundra covering much of the state. The highest point in Alaska is Mount McKinley, which stands at 20,320 feet. The state also has numerous rivers, lakes, and glaciers, as well as numerous islands in the Pacific and Arctic Oceans.
Economy
The economy of Alaska is largely driven by the oil and gas industry, which accounts for about one-third of the state’s GDP. Other major industries include fishing, tourism, and timber.
Alaska is also home to a number of military bases, which provide jobs and economic activity to the state. The state also receives a large amount of federal funding, which helps to support its economy.
Demographics
As of 2020, the population of Alaska was 731,545, making it the 47th most populous state in the United States. The largest city in Alaska is Anchorage, with a population of 291,826.
The majority of Alaska’s population is white (66.2%), followed by Native American (15.2%), Asian (5.2%), and African American (3.2%). The state also has a large population of Hispanic and Latino residents (7.2%).
Alaska is also home to a number of indigenous peoples, including the Inupiat, Yupik, Aleut, and Tlingit. These groups have lived in the region for thousands of years, and continue to play an important role in the state’s culture and economy.
Common Questions
When was Alaska Incorporated?
Alaska was Incorporated into the Union on Jan 3, 1959.
What is the Total Area of Alaska?
Total Area of Alaska is 664,988 Square Miles.
What is the Total Land Area of Alaska?
Total Land Area of Alaska is 570,665 Square Miles.
What is the Total Water Area of Alaska?
Total Water Area of Alaska is 94,343 Square Miles.
What is the Average Elevation in Alaska?
Average Elevation in Alaska is 1,900 Feet.
What is the Highest Elevation in Alaska?
Highest Elevation in Alaska is 20,320 Feet.
What is the Lowest Elevation in Alaska?
Lowest Elevation in Alaska is 0 Feet.
What is the Population Density in Alaska?
Population Density in Alaska is 1.3 People per Square Mile.
What is Per Capita Income in Alaska?
Per Capita income in Alaska is $42,828.
What is the Median Family Income in Alaska?
Median Family Income in Alaska is $104,081.
What is the Median Household income in Alaska?
Median Household Income in Alaska is $86,370.
What is Income or Wage Gap in Alaska?
Income or Wage Gap in Alaska is 24.7%.
Women in Alaska earn 75.3 cents for every dollar earned by a man.
What is Family Income Deficit in Alaska?
Family Income Deficit in Alaska is $10,881.
Families that are below poverty line in Alaska earn $10,881 less on average than the poverty threshold level.
What is Inequality or Gini Index in Alaska?
Inequality or Gini Index in Alaska is 0.43.
What is the Total Population of Alaska?
Total Population of Alaska is 734,821.
What is the Total Male Population of Alaska?
Total Male Population of Alaska is 386,649.
What is the Total Female Population of Alaska?
Total Female Population of Alaska is 348,172.
What is the Ratio of Males per 100 Females in Alaska?
There are 111.05 Males per 100 Females in Alaska.
What is the Ratio of Females per 100 Males in Alaska?
There are 90.05 Females per 100 Males in Alaska.
What is the Median Population Age in Alaska?
Median Population Age in Alaska is 35.3 Years.
What is the Average Family Size in Alaska
Average Family Size in Alaska is 3.3 People.
What is the Average Household Size in Alaska
Average Household Size in Alaska is 2.7 People.
How Large is the Labor Force in Alaska?
There are 382,857 People in the Labor Forcein in Alaska.
What is the Percentage of People in the Labor Force in Alaska?
66.7% of People are in the Labor Force in Alaska.
What is the Unemployment Rate in Alaska?
Unemployment Rate in Alaska is 6.4%.