Cities with the Highest Poverty Level Among Seniors Over the Age of 65 in the United States
RELATED REPORTS & OPTIONS
Highest Poverty | Seniors 65+
United States
Compare Cities
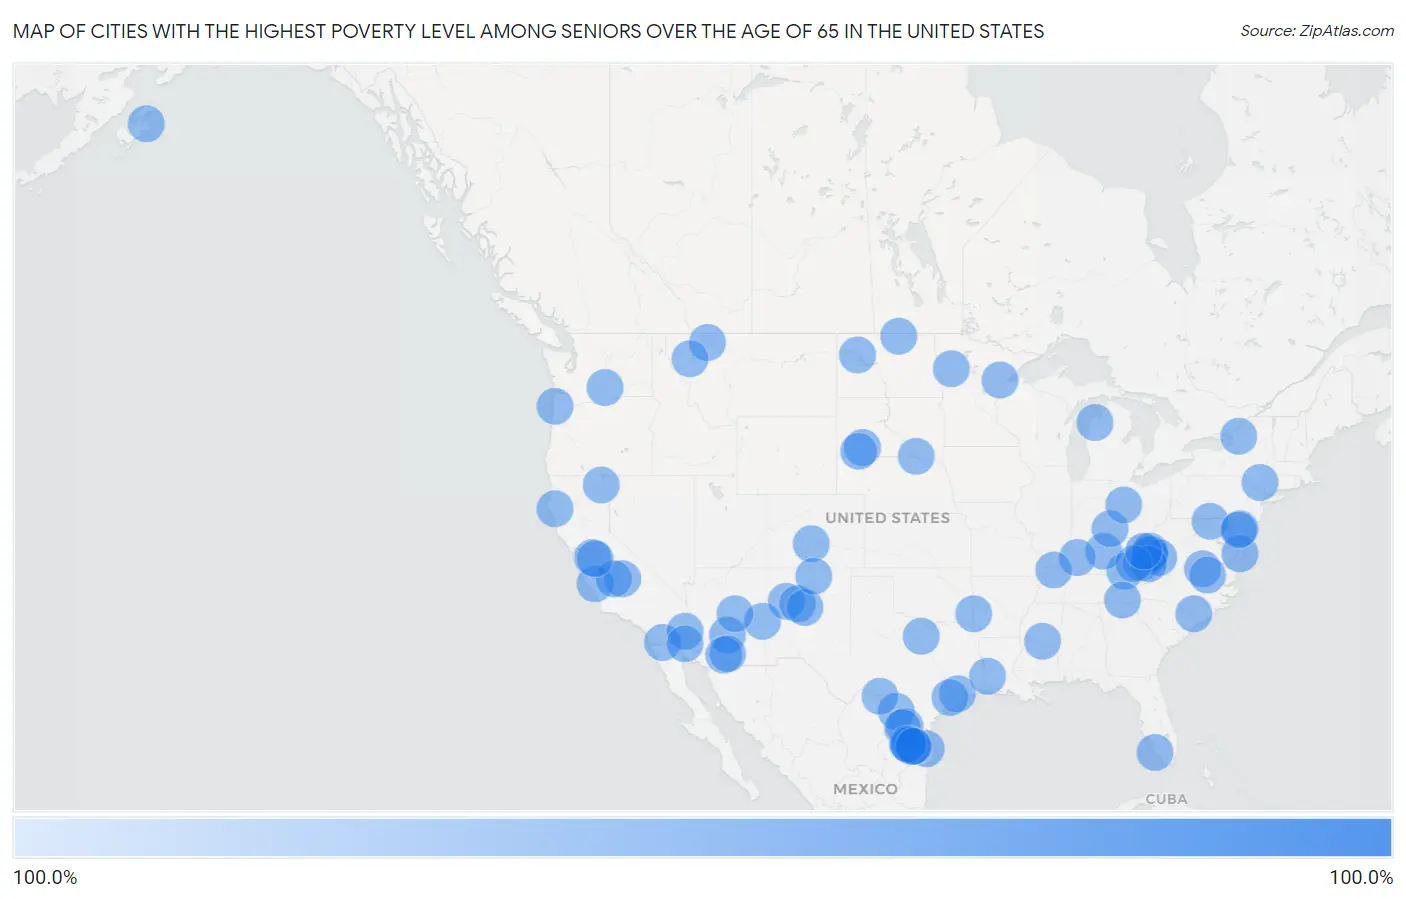
Map of Cities with the Highest Poverty Level Among Seniors Over the Age of 65 in the United States
0.0%
100.0%
Cities with the Highest Poverty Level Among Seniors Over the Age of 65 in the United States
| City | Senior Poverty | vs State | vs National | |
| 1. | Fairfield University | 100.0% | 7.9%(+92.1)#1 | 10.0%(+90.0)#1 |
| 2. | Siena College | 100.0% | 12.2%(+87.8)#1 | 10.0%(+90.0)#2 |
| 3. | Kodiak Station | 100.0% | 7.8%(+92.2)#1 | 10.0%(+90.0)#3 |
| 4. | Fifth Street | 100.0% | 11.4%(+88.6)#1 | 10.0%(+90.0)#4 |
| 5. | Kyle | 100.0% | 9.3%(+90.7)#1 | 10.0%(+90.0)#5 |
| 6. | Innovation | 100.0% | 8.0%(+92.0)#1 | 10.0%(+90.0)#6 |
| 7. | Carrizo Hill | 100.0% | 11.4%(+88.6)#2 | 10.0%(+90.0)#7 |
| 8. | Nazareth College | 100.0% | 12.2%(+87.8)#2 | 10.0%(+90.0)#8 |
| 9. | Los Héroes | 100.0% | 38.8%(+61.2)#1 | 10.0%(+90.0)#9 |
| 10. | Downsville | 100.0% | 8.5%(+91.5)#1 | 10.0%(+90.0)#10 |
| 11. | Flat Lick | 100.0% | 11.7%(+88.3)#1 | 10.0%(+90.0)#11 |
| 12. | Las Palmas Ii | 100.0% | 11.4%(+88.6)#3 | 10.0%(+90.0)#12 |
| 13. | Green Acres | 100.0% | 9.1%(+90.9)#1 | 10.0%(+90.0)#13 |
| 14. | Upper Santan Village | 100.0% | 9.3%(+90.7)#1 | 10.0%(+90.0)#14 |
| 15. | Valle Hill | 100.0% | 38.8%(+61.2)#2 | 10.0%(+90.0)#15 |
| 16. | Manderson White Horse Creek | 100.0% | 9.3%(+90.7)#2 | 10.0%(+90.0)#16 |
| 17. | Chaplin | 100.0% | 11.7%(+88.3)#2 | 10.0%(+90.0)#17 |
| 18. | Westley | 100.0% | 11.0%(+89.0)#1 | 10.0%(+90.0)#18 |
| 19. | Hardwood Acres | 100.0% | 9.0%(+91.0)#1 | 10.0%(+90.0)#19 |
| 20. | Campanillas | 100.0% | 38.8%(+61.2)#3 | 10.0%(+90.0)#20 |
| 21. | Watchtower | 100.0% | 12.2%(+87.8)#3 | 10.0%(+90.0)#21 |
| 22. | Buena | 100.0% | 8.1%(+91.9)#1 | 10.0%(+90.0)#22 |
| 23. | Virgie | 100.0% | 11.7%(+88.3)#3 | 10.0%(+90.0)#23 |
| 24. | Placitas Cdp Dona Ana County | 100.0% | 12.9%(+87.1)#1 | 10.0%(+90.0)#24 |
| 25. | Redwater | 100.0% | 13.4%(+86.6)#1 | 10.0%(+90.0)#25 |
| 26. | Garza Salinas Ii | 100.0% | 11.4%(+88.6)#4 | 10.0%(+90.0)#26 |
| 27. | Red Jacket | 100.0% | 10.6%(+89.4)#1 | 10.0%(+90.0)#27 |
| 28. | Chase Crossing | 100.0% | 8.0%(+92.0)#2 | 10.0%(+90.0)#28 |
| 29. | Mansión Del Sol | 100.0% | 38.8%(+61.2)#4 | 10.0%(+90.0)#29 |
| 30. | Felts Mills | 100.0% | 12.2%(+87.8)#4 | 10.0%(+90.0)#30 |
| 31. | Garwood | 100.0% | 11.4%(+88.6)#5 | 10.0%(+90.0)#31 |
| 32. | Cash | 100.0% | 10.3%(+89.7)#1 | 10.0%(+90.0)#32 |
| 33. | Nutrioso | 100.0% | 9.3%(+90.7)#2 | 10.0%(+90.0)#33 |
| 34. | Villa De Sabana | 100.0% | 38.8%(+61.2)#5 | 10.0%(+90.0)#34 |
| 35. | Villa Quintero | 100.0% | 38.8%(+61.2)#6 | 10.0%(+90.0)#35 |
| 36. | Coaldale | 100.0% | 7.6%(+92.4)#1 | 10.0%(+90.0)#36 |
| 37. | San Lucas | 100.0% | 11.0%(+89.0)#2 | 10.0%(+90.0)#37 |
| 38. | Lake View | 100.0% | 11.4%(+88.6)#6 | 10.0%(+90.0)#38 |
| 39. | Ranchitos Las Lomas | 100.0% | 11.4%(+88.6)#7 | 10.0%(+90.0)#39 |
| 40. | Boulevard | 100.0% | 11.0%(+89.0)#3 | 10.0%(+90.0)#40 |
| 41. | Singer | 100.0% | 13.6%(+86.4)#1 | 10.0%(+90.0)#41 |
| 42. | Lybrook | 100.0% | 12.9%(+87.1)#2 | 10.0%(+90.0)#42 |
| 43. | Harperville | 100.0% | 13.4%(+86.6)#2 | 10.0%(+90.0)#43 |
| 44. | Henlawson | 100.0% | 10.6%(+89.4)#2 | 10.0%(+90.0)#44 |
| 45. | Ranchitos East | 100.0% | 11.4%(+88.6)#8 | 10.0%(+90.0)#45 |
| 46. | Corinne | 100.0% | 10.6%(+89.4)#3 | 10.0%(+90.0)#46 |
| 47. | Evergreen | 100.0% | 9.8%(+90.2)#1 | 10.0%(+90.0)#47 |
| 48. | Riverland | 100.0% | 7.9%(+92.1)#1 | 10.0%(+90.0)#48 |
| 49. | Medill | 100.0% | 9.5%(+90.5)#1 | 10.0%(+90.0)#49 |
| 50. | Echo | 100.0% | 13.6%(+86.4)#2 | 10.0%(+90.0)#50 |
| 51. | Marble | 100.0% | 9.8%(+90.2)#2 | 10.0%(+90.0)#51 |
| 52. | Elizabethtown | 100.0% | 9.1%(+90.9)#1 | 10.0%(+90.0)#52 |
| 53. | Utica | 100.0% | 11.7%(+88.3)#4 | 10.0%(+90.0)#53 |
| 54. | Riverview Colony | 100.0% | 9.8%(+90.2)#1 | 10.0%(+90.0)#54 |
| 55. | Hartz Lake | 100.0% | 8.1%(+91.9)#1 | 10.0%(+90.0)#55 |
| 56. | Camargito | 100.0% | 11.4%(+88.6)#9 | 10.0%(+90.0)#56 |
| 57. | La Esperanza | 100.0% | 11.4%(+88.6)#10 | 10.0%(+90.0)#57 |
| 58. | Four Bears Village | 100.0% | 9.1%(+90.9)#2 | 10.0%(+90.0)#58 |
| 59. | Omar | 100.0% | 10.6%(+89.4)#4 | 10.0%(+90.0)#59 |
| 60. | Lindcove | 100.0% | 11.0%(+89.0)#4 | 10.0%(+90.0)#60 |
| 61. | North Acomita Village | 100.0% | 12.9%(+87.1)#3 | 10.0%(+90.0)#62 |
| 62. | Vansant | 100.0% | 8.0%(+92.0)#3 | 10.0%(+90.0)#63 |
| 63. | Starr School | 100.0% | 9.8%(+90.2)#2 | 10.0%(+90.0)#64 |
| 64. | Pajarito Mesa | 100.0% | 12.9%(+87.1)#4 | 10.0%(+90.0)#65 |
| 65. | Lunenburg | 100.0% | 8.0%(+92.0)#4 | 10.0%(+90.0)#66 |
| 66. | Perrin | 100.0% | 11.4%(+88.6)#11 | 10.0%(+90.0)#67 |
| 67. | Morris Chapel | 100.0% | 10.1%(+89.9)#1 | 10.0%(+90.0)#68 |
| 68. | Myers Flat | 100.0% | 11.0%(+89.0)#5 | 10.0%(+90.0)#69 |
| 69. | Sproul | 100.0% | 8.9%(+91.1)#1 | 10.0%(+90.0)#70 |
| 70. | Chaparrito | 100.0% | 11.4%(+88.6)#12 | 10.0%(+90.0)#71 |
| 71. | Vandervoort | 100.0% | 10.7%(+89.3)#1 | 10.0%(+90.0)#72 |
| 72. | Marty | 100.0% | 9.3%(+90.7)#3 | 10.0%(+90.0)#73 |
| 73. | Lobeco | 100.0% | 10.3%(+89.7)#2 | 10.0%(+90.0)#74 |
| 74. | North Escobares | 100.0% | 11.4%(+88.6)#13 | 10.0%(+90.0)#75 |
| 75. | Crestview | 100.0% | 12.9%(+87.1)#5 | 10.0%(+90.0)#76 |
| 76. | Faucett | 100.0% | 9.5%(+90.5)#2 | 10.0%(+90.0)#77 |
| 77. | Mahnomen | 100.0% | 7.9%(+92.1)#2 | 10.0%(+90.0)#78 |
| 78. | Gu Oidak | 100.0% | 9.3%(+90.7)#3 | 10.0%(+90.0)#79 |
| 79. | La Minita | 100.0% | 11.4%(+88.6)#14 | 10.0%(+90.0)#80 |
| 80. | Daphnedale Park | 100.0% | 11.0%(+89.0)#6 | 10.0%(+90.0)#81 |
| 81. | Tajique | 100.0% | 12.9%(+87.1)#6 | 10.0%(+90.0)#82 |
| 82. | Jeff | 100.0% | 11.7%(+88.3)#5 | 10.0%(+90.0)#83 |
| 83. | Cibola | 100.0% | 9.3%(+90.7)#4 | 10.0%(+90.0)#84 |
| 84. | Idaville | 100.0% | 8.8%(+91.2)#1 | 10.0%(+90.0)#85 |
| 85. | Elmo | 100.0% | 9.8%(+90.2)#3 | 10.0%(+90.0)#86 |
| 86. | Hartly | 100.0% | 6.5%(+93.5)#1 | 10.0%(+90.0)#87 |
| 87. | Hardwick | 100.0% | 11.0%(+89.0)#7 | 10.0%(+90.0)#88 |
| 88. | Haivana Nakya | 100.0% | 9.3%(+90.7)#5 | 10.0%(+90.0)#89 |
| 89. | La Victoria | 100.0% | 11.4%(+88.6)#15 | 10.0%(+90.0)#90 |
| 90. | Goodland | 100.0% | 11.0%(+89.0)#1 | 10.0%(+90.0)#91 |
| 91. | Lowes | 100.0% | 11.7%(+88.3)#6 | 10.0%(+90.0)#92 |
| 92. | Henderson | 100.0% | 8.5%(+91.5)#2 | 10.0%(+90.0)#93 |
| 93. | Crum | 100.0% | 10.6%(+89.4)#5 | 10.0%(+90.0)#94 |
| 94. | Lewistown | 100.0% | 9.1%(+90.9)#2 | 10.0%(+90.0)#95 |
| 95. | Monterey Park Tract | 100.0% | 11.0%(+89.0)#8 | 10.0%(+90.0)#96 |
| 96. | Hungerford | 100.0% | 11.4%(+88.6)#16 | 10.0%(+90.0)#97 |
| 97. | Mead Ranch | 100.0% | 9.3%(+90.7)#6 | 10.0%(+90.0)#98 |
| 98. | Drysdale | 100.0% | 9.3%(+90.7)#7 | 10.0%(+90.0)#99 |
| 99. | Arroyo Hondo | 100.0% | 12.9%(+87.1)#7 | 10.0%(+90.0)#100 |
| 100. | Atkinson Mills | 100.0% | 8.9%(+91.1)#2 | 10.0%(+90.0)#101 |
Common Questions
What are the Top 10 Cities with the Highest Poverty Level Among Seniors Over the Age of 65 in the United States?
Top 10 Cities with the Highest Poverty Level Among Seniors Over the Age of 65 in the United States are:
#1
100.0%
#2
100.0%
#3
100.0%
#4
100.0%
#5
100.0%
#6
100.0%
#7
100.0%
#8
100.0%
#9
100.0%
#10
100.0%
What city has the Highest Poverty Level Among Seniors Over the Age of 65 in the United States?
Kodiak Station has the Highest Poverty Level Among Seniors Over the Age of 65 in the United States with 100.0%.
What is the Poverty Level Among Seniors Over the Age of 65 in the United States?
Poverty Level Among Seniors Over the Age of 65 in the United States is 10.0%.