Cities with the Highest Percentage of Immigrants from Middle Africa in the United States
RELATED REPORTS & OPTIONS
Middle Africa
United States
Compare Cities
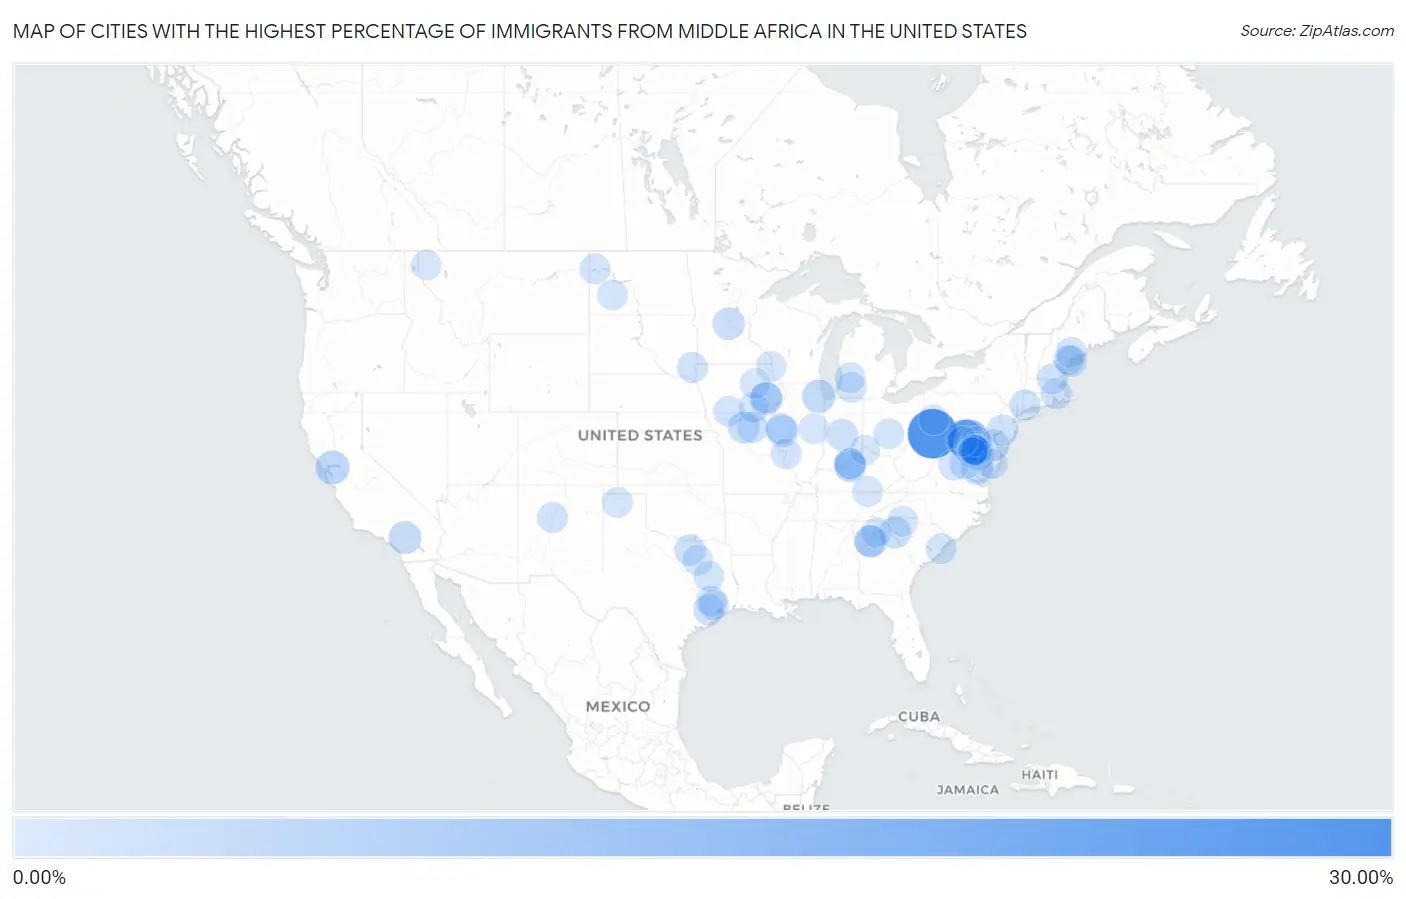
Map of Cities with the Highest Percentage of Immigrants from Middle Africa in the United States
0.00%
30.00%
Cities with the Highest Percentage of Immigrants from Middle Africa in the United States
| City | Middle Africa | vs State | vs National | |
| 1. | Ronco | 25.64% | 0.040%(+25.6)#-1 | 0.059%(+25.6)#0 |
| 2. | Woodsboro | 14.52% | 0.44%(+14.1)#-1 | 0.059%(+14.5)#1 |
| 3. | Beaver Creek | 11.61% | 0.44%(+11.2)#0 | 0.059%(+11.6)#2 |
| 4. | Cedar Heights | 11.47% | 0.44%(+11.0)#1 | 0.059%(+11.4)#3 |
| 5. | White Oak | 8.99% | 0.44%(+8.55)#2 | 0.059%(+8.93)#4 |
| 6. | Konterra | 8.92% | 0.44%(+8.48)#3 | 0.059%(+8.87)#5 |
| 7. | New Carrollton | 7.84% | 0.44%(+7.40)#4 | 0.059%(+7.78)#6 |
| 8. | Pacheco | 5.73% | 0.019%(+5.71)#-1 | 0.059%(+5.67)#7 |
| 9. | Adelphi | 5.64% | 0.44%(+5.20)#5 | 0.059%(+5.58)#8 |
| 10. | Hillside | 4.71% | 0.061%(+4.65)#-1 | 0.059%(+4.65)#9 |
| 11. | Washington Grove | 4.64% | 0.44%(+4.20)#6 | 0.059%(+4.58)#10 |
| 12. | South Laurel | 4.46% | 0.44%(+4.02)#7 | 0.059%(+4.41)#11 |
| 13. | Oak Glen | 4.34% | 0.019%(+4.32)#0 | 0.059%(+4.28)#12 |
| 14. | Coralville | 4.19% | 0.18%(+4.01)#-1 | 0.059%(+4.13)#13 |
| 15. | Greenbelt | 4.13% | 0.44%(+3.69)#8 | 0.059%(+4.07)#14 |
| 16. | Burnt Mills | 3.80% | 0.44%(+3.36)#9 | 0.059%(+3.74)#15 |
| 17. | Warsaw | 3.69% | 0.072%(+3.62)#-1 | 0.059%(+3.63)#16 |
| 18. | Stone Mountain | 3.59% | 0.083%(+3.50)#-1 | 0.059%(+3.53)#17 |
| 19. | Waite Park | 3.52% | 0.080%(+3.44)#1 | 0.059%(+3.46)#18 |
| 20. | Fairland | 3.51% | 0.44%(+3.07)#10 | 0.059%(+3.45)#273 |
| 21. | Lanham | 3.46% | 0.44%(+3.02)#11 | 0.059%(+3.40)#274 |
| 22. | Brown Station | 3.21% | 0.44%(+2.77)#12 | 0.059%(+3.15)#275 |
| 23. | Seabrook | 3.17% | 0.44%(+2.73)#13 | 0.059%(+3.11)#276 |
| 24. | Antreville | 3.15% | 0.013%(+3.13)#-1 | 0.059%(+3.09)#277 |
| 25. | Poplar Hills | 3.08% | 0.15%(+2.94)#-1 | 0.059%(+3.02)#278 |
| 26. | Mitchellville | 3.02% | 0.44%(+2.58)#14 | 0.059%(+2.96)#279 |
| 27. | Hillview | 2.98% | 0.15%(+2.84)#0 | 0.059%(+2.92)#280 |
| 28. | Bladensburg | 2.94% | 0.44%(+2.50)#15 | 0.059%(+2.88)#281 |
| 29. | Milan | 2.92% | 0.046%(+2.87)#-1 | 0.059%(+2.86)#282 |
| 30. | Beardstown | 2.89% | 0.061%(+2.83)#0 | 0.059%(+2.83)#283 |
| 31. | Speedway | 2.88% | 0.048%(+2.83)#-1 | 0.059%(+2.82)#284 |
| 32. | Brock Hall | 2.87% | 0.44%(+2.43)#16 | 0.059%(+2.81)#285 |
| 33. | Fairmount Heights | 2.75% | 0.44%(+2.31)#17 | 0.059%(+2.69)#286 |
| 34. | Cataula | 2.57% | 0.083%(+2.49)#0 | 0.059%(+2.51)#287 |
| 35. | Lake Arbor | 2.55% | 0.44%(+2.11)#18 | 0.059%(+2.49)#288 |
| 36. | Aubrey | 2.55% | 0.11%(+2.44)#-1 | 0.059%(+2.49)#289 |
| 37. | North Plainfield Borough | 2.52% | 0.048%(+2.47)#-1 | 0.059%(+2.46)#290 |
| 38. | Queensland | 2.51% | 0.44%(+2.07)#19 | 0.059%(+2.45)#291 |
| 39. | Naugatuck Borough | 2.49% | 0.084%(+2.40)#-1 | 0.059%(+2.43)#292 |
| 40. | Clarkston | 2.47% | 0.083%(+2.39)#2 | 0.059%(+2.42)#293 |
| 41. | Cheswold | 2.44% | 0.096%(+2.34)#-1 | 0.059%(+2.38)#294 |
| 42. | Portland | 2.39% | 0.22%(+2.17)#3 | 0.059%(+2.33)#295 |
| 43. | Owings | 2.31% | 0.44%(+1.88)#20 | 0.059%(+2.26)#296 |
| 44. | Cornwells Heights | 2.24% | 0.040%(+2.20)#0 | 0.059%(+2.18)#297 |
| 45. | Rushville | 2.22% | 0.061%(+2.16)#1 | 0.059%(+2.16)#298 |
| 46. | Hillandale | 2.18% | 0.44%(+1.74)#21 | 0.059%(+2.12)#299 |
| 47. | Kirksville | 2.15% | 0.046%(+2.10)#0 | 0.059%(+2.09)#300 |
| 48. | North Liberty | 2.13% | 0.18%(+1.96)#0 | 0.059%(+2.07)#301 |
| 49. | Worthing | 2.05% | 0.12%(+1.93)#-1 | 0.059%(+1.99)#302 |
| 50. | Monrovia | 2.05% | 0.44%(+1.61)#22 | 0.059%(+1.99)#303 |
| 51. | Four Corners | 2.04% | 0.11%(+1.94)#0 | 0.059%(+1.98)#304 |
| 52. | Norton Center | 2.02% | 0.073%(+1.94)#-1 | 0.059%(+1.96)#305 |
| 53. | Maryland City | 2.00% | 0.44%(+1.56)#23 | 0.059%(+1.94)#306 |
| 54. | Hudson | 1.98% | 0.068%(+1.92)#-1 | 0.059%(+1.93)#307 |
| 55. | Spotsylvania Courthouse | 1.98% | 0.072%(+1.91)#0 | 0.059%(+1.92)#308 |
| 56. | District Heights | 1.98% | 0.44%(+1.54)#24 | 0.059%(+1.92)#309 |
| 57. | Mount Rainier | 1.97% | 0.44%(+1.53)#25 | 0.059%(+1.91)#310 |
| 58. | North Valley | 1.96% | 0.035%(+1.93)#-1 | 0.059%(+1.90)#311 |
| 59. | Woodloch | 1.96% | 0.11%(+1.85)#1 | 0.059%(+1.90)#312 |
| 60. | Morgan Hill | 1.96% | 0.040%(+1.92)#1 | 0.059%(+1.90)#313 |
| 61. | Bethel | 1.93% | 0.084%(+1.85)#0 | 0.059%(+1.87)#314 |
| 62. | Afton | 1.90% | 0.18%(+1.73)#1 | 0.059%(+1.84)#315 |
| 63. | Springdale | 1.88% | 0.44%(+1.44)#26 | 0.059%(+1.82)#316 |
| 64. | Talty | 1.87% | 0.11%(+1.76)#2 | 0.059%(+1.81)#317 |
| 65. | Layhill | 1.86% | 0.44%(+1.42)#27 | 0.059%(+1.80)#318 |
| 66. | West Buechel | 1.86% | 0.15%(+1.71)#1 | 0.059%(+1.80)#319 |
| 67. | Pine Knot | 1.82% | 0.15%(+1.67)#2 | 0.059%(+1.76)#320 |
| 68. | Palestine | 1.82% | 0.11%(+1.71)#3 | 0.059%(+1.76)#321 |
| 69. | Fairwood | 1.79% | 0.44%(+1.35)#28 | 0.059%(+1.73)#322 |
| 70. | Piney Mountain | 1.78% | 0.072%(+1.71)#1 | 0.059%(+1.72)#323 |
| 71. | Arcadia | 1.76% | 0.013%(+1.74)#0 | 0.059%(+1.70)#324 |
| 72. | Lewiston | 1.74% | 0.22%(+1.52)#4 | 0.059%(+1.68)#325 |
| 73. | Chillum | 1.73% | 0.44%(+1.29)#29 | 0.059%(+1.67)#326 |
| 74. | Landover | 1.67% | 0.44%(+1.23)#30 | 0.059%(+1.61)#327 |
| 75. | Cactus | 1.67% | 0.11%(+1.56)#4 | 0.059%(+1.61)#328 |
| 76. | Williston | 1.67% | 0.13%(+1.54)#8 | 0.059%(+1.61)#404 |
| 77. | Georgetown | 1.65% | 0.013%(+1.64)#1 | 0.059%(+1.60)#405 |
| 78. | Glenn Dale | 1.65% | 0.44%(+1.21)#31 | 0.059%(+1.59)#406 |
| 79. | Obetz | 1.63% | 0.060%(+1.57)#-1 | 0.059%(+1.57)#407 |
| 80. | Taylor | 1.61% | 0.13%(+1.48)#9 | 0.059%(+1.55)#408 |
| 81. | Calverton | 1.61% | 0.44%(+1.17)#32 | 0.059%(+1.55)#409 |
| 82. | Cutlerville | 1.56% | 0.038%(+1.52)#-1 | 0.059%(+1.50)#410 |
| 83. | Westwood | 1.55% | 0.038%(+1.51)#0 | 0.059%(+1.49)#411 |
| 84. | Princess Anne | 1.54% | 0.44%(+1.10)#33 | 0.059%(+1.48)#412 |
| 85. | Kettering | 1.54% | 0.44%(+1.10)#34 | 0.059%(+1.48)#413 |
| 86. | Riverview | 1.51% | 0.046%(+1.46)#1 | 0.059%(+1.45)#414 |
| 87. | Fremont | 1.48% | 0.18%(+1.31)#2 | 0.059%(+1.42)#415 |
| 88. | Waterloo | 1.45% | 0.18%(+1.28)#15 | 0.059%(+1.39)#416 |
| 89. | Owings Mills | 1.45% | 0.44%(+1.01)#35 | 0.059%(+1.39)#417 |
| 90. | Pioneer Junction | 1.44% | 0.0013%(+1.44)#-1 | 0.059%(+1.38)#418 |
| 91. | Humble | 1.44% | 0.11%(+1.34)#5 | 0.059%(+1.38)#419 |
| 92. | Takoma Park | 1.44% | 0.44%(+0.997)#36 | 0.059%(+1.38)#420 |
| 93. | Shepherdstown | 1.43% | 0.0066%(+1.42)#-1 | 0.059%(+1.37)#421 |
| 94. | Lansing | 1.42% | 0.18%(+1.25)#16 | 0.059%(+1.37)#422 |
| 95. | Arnold | 1.40% | 0.040%(+1.36)#2 | 0.059%(+1.34)#423 |
| 96. | Westbrook | 1.40% | 0.22%(+1.18)#8 | 0.059%(+1.34)#424 |
| 97. | Florence | 1.38% | 0.15%(+1.23)#3 | 0.059%(+1.32)#425 |
| 98. | Gainesville | 1.37% | 0.083%(+1.29)#3 | 0.059%(+1.31)#426 |
| 99. | Champaign | 1.36% | 0.061%(+1.29)#2 | 0.059%(+1.30)#427 |
| 100. | Huntington | 1.34% | 0.072%(+1.27)#2 | 0.059%(+1.28)#428 |
Common Questions
What are the Top 10 Cities with the Highest Percentage of Immigrants from Middle Africa in the United States?
Top 10 Cities with the Highest Percentage of Immigrants from Middle Africa in the United States are:
What city has the Highest Percentage of Immigrants from Middle Africa in the United States?
Ronco has the Highest Percentage of Immigrants from Middle Africa in the United States with 25.64%.
What is the Percentage of Immigrants from Middle Africa in the United States?
Percentage of Immigrants from Middle Africa in the United States is 0.059%.