Cities with the Highest Percentage of Immigrants from Lithuania in the United States
RELATED REPORTS & OPTIONS
Lithuania
United States
Compare Cities
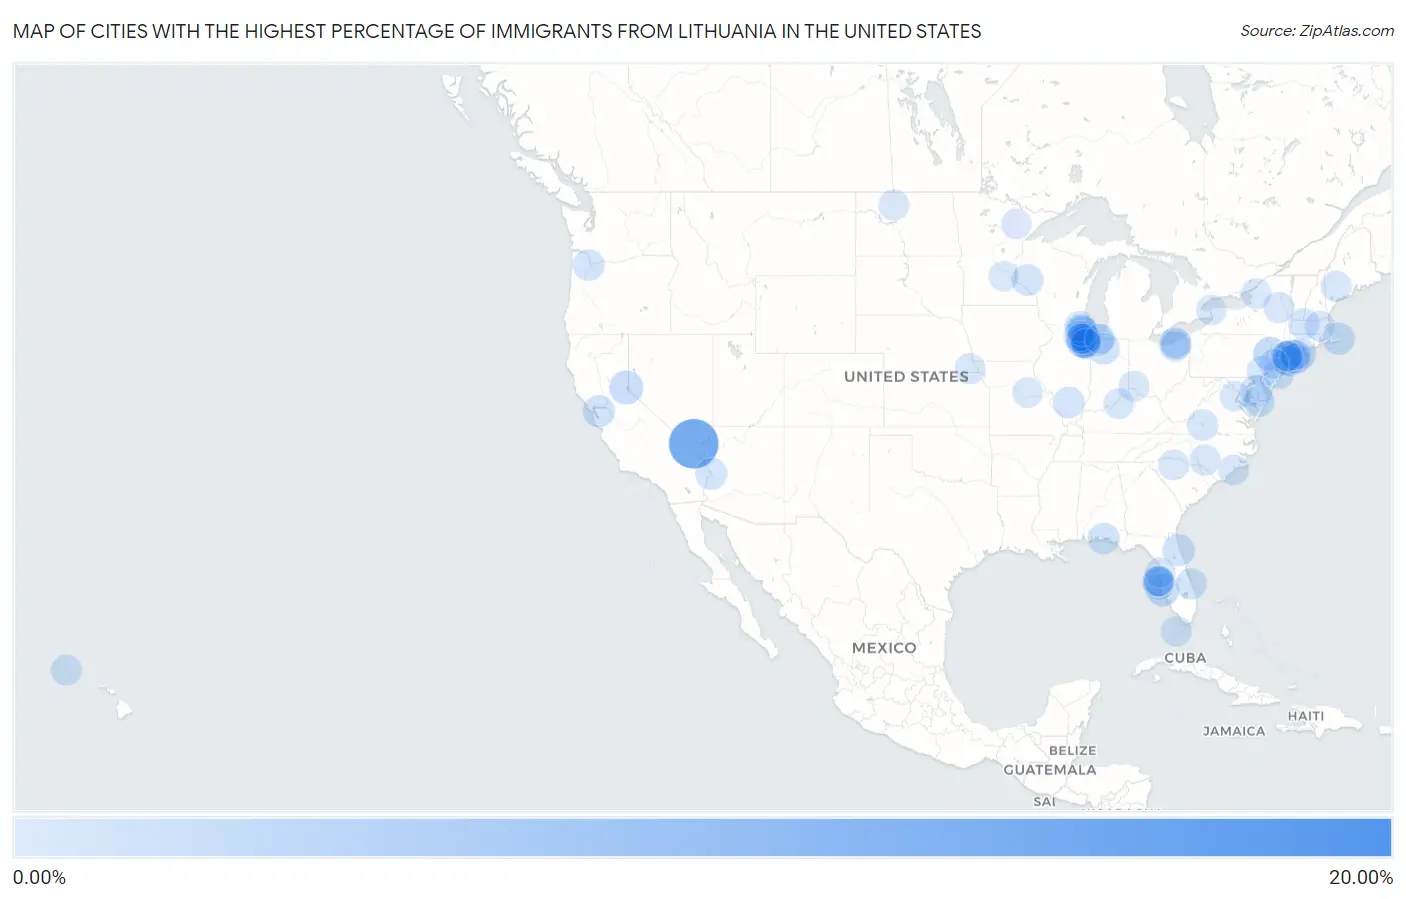
Map of Cities with the Highest Percentage of Immigrants from Lithuania in the United States
0.00%
20.00%
Cities with the Highest Percentage of Immigrants from Lithuania in the United States
| City | Lithuania | vs State | vs National | |
| 1. | Candlewood Isle | 18.42% | 0.030%(+18.4)#1 | 0.010%(+18.4)#1 |
| 2. | Blue Diamond | 13.36% | 0.011%(+13.3)#1 | 0.010%(+13.4)#2 |
| 3. | Lemont | 3.76% | 0.080%(+3.68)#1 | 0.010%(+3.75)#3 |
| 4. | Regency At Monroe | 3.46% | 0.018%(+3.44)#1 | 0.010%(+3.45)#4 |
| 5. | Sunnyside Tahoe City | 2.60% | 0.0093%(+2.59)#1 | 0.010%(+2.59)#5 |
| 6. | Johnsonburg | 2.34% | 0.018%(+2.32)#2 | 0.010%(+2.33)#6 |
| 7. | Bee Ridge | 2.15% | 0.015%(+2.13)#1 | 0.010%(+2.13)#7 |
| 8. | Willow Springs | 2.12% | 0.080%(+2.03)#2 | 0.010%(+2.11)#8 |
| 9. | Palos Hills | 1.85% | 0.080%(+1.77)#3 | 0.010%(+1.84)#9 |
| 10. | Sussex Borough | 1.82% | 0.018%(+1.81)#3 | 0.010%(+1.81)#10 |
| 11. | Hickory Hills | 1.82% | 0.080%(+1.74)#4 | 0.010%(+1.81)#11 |
| 12. | Indian Head Park | 1.69% | 0.080%(+1.61)#5 | 0.010%(+1.68)#12 |
| 13. | Brewster | 1.67% | 0.017%(+1.65)#1 | 0.010%(+1.66)#13 |
| 14. | Milltown Borough | 1.67% | 0.018%(+1.65)#4 | 0.010%(+1.66)#14 |
| 15. | Saddle Rock | 1.66% | 0.013%(+1.64)#1 | 0.010%(+1.65)#15 |
| 16. | St Augustine Shores | 1.60% | 0.015%(+1.58)#2 | 0.010%(+1.59)#16 |
| 17. | St Pete Beach | 1.58% | 0.015%(+1.57)#3 | 0.010%(+1.57)#17 |
| 18. | Westmont | 1.56% | 0.080%(+1.48)#6 | 0.010%(+1.55)#18 |
| 19. | Greensboro | 1.51% | 0.0050%(+1.51)#1 | 0.010%(+1.50)#19 |
| 20. | Castle Hill | 1.49% | 0.0093%(+1.48)#2 | 0.010%(+1.47)#20 |
| 21. | Darien | 1.47% | 0.080%(+1.39)#7 | 0.010%(+1.46)#21 |
| 22. | Bernville Borough | 1.43% | 0.0070%(+1.43)#1 | 0.010%(+1.42)#22 |
| 23. | Beverly Shores | 1.38% | 0.0070%(+1.38)#1 | 0.010%(+1.37)#23 |
| 24. | Parker Strip | 1.35% | 0.0063%(+1.35)#1 | 0.010%(+1.34)#24 |
| 25. | Woodlawn | 1.26% | 0.080%(+1.18)#8 | 0.010%(+1.25)#25 |
| 26. | Ocean City | 1.21% | 0.015%(+1.20)#4 | 0.010%(+1.20)#26 |
| 27. | Homer Glen | 1.18% | 0.080%(+1.10)#9 | 0.010%(+1.17)#27 |
| 28. | Hebron | 1.15% | 0.0050%(+1.15)#2 | 0.010%(+1.14)#28 |
| 29. | Downsville | 1.14% | 0.0054%(+1.14)#1 | 0.010%(+1.13)#29 |
| 30. | St. Davids | 1.13% | 0.0070%(+1.12)#2 | 0.010%(+1.12)#30 |
| 31. | Cedar Mill | 1.12% | 0.0087%(+1.11)#1 | 0.010%(+1.11)#31 |
| 32. | Bass Lake | 1.08% | 0.0070%(+1.07)#2 | 0.010%(+1.07)#32 |
| 33. | Gifford | 1.07% | 0.015%(+1.05)#5 | 0.010%(+1.06)#33 |
| 34. | Oakbrook Terrace | 1.04% | 0.080%(+0.959)#10 | 0.010%(+1.03)#34 |
| 35. | Ship Bottom Borough | 1.01% | 0.018%(+0.987)#5 | 0.010%(+0.995)#35 |
| 36. | Palos Heights | 0.94% | 0.080%(+0.864)#11 | 0.010%(+0.934)#36 |
| 37. | Walworth | 0.92% | 0.013%(+0.912)#2 | 0.010%(+0.915)#37 |
| 38. | Berwyn | 0.92% | 0.0070%(+0.912)#3 | 0.010%(+0.909)#38 |
| 39. | Brookhaven | 0.88% | 0.013%(+0.867)#3 | 0.010%(+0.870)#39 |
| 40. | Lockport | 0.88% | 0.080%(+0.796)#12 | 0.010%(+0.867)#40 |
| 41. | Pine Brook | 0.86% | 0.018%(+0.844)#6 | 0.010%(+0.852)#41 |
| 42. | Millers Falls | 0.85% | 0.017%(+0.831)#2 | 0.010%(+0.838)#42 |
| 43. | Princeville | 0.85% | 0.0057%(+0.841)#1 | 0.010%(+0.837)#43 |
| 44. | Hewlett Harbor | 0.84% | 0.013%(+0.831)#4 | 0.010%(+0.834)#44 |
| 45. | Lisle | 0.84% | 0.080%(+0.758)#13 | 0.010%(+0.828)#45 |
| 46. | North Redington Beach | 0.82% | 0.015%(+0.800)#6 | 0.010%(+0.805)#46 |
| 47. | North Shore | 0.81% | 0.0086%(+0.800)#1 | 0.010%(+0.798)#47 |
| 48. | Justice | 0.77% | 0.080%(+0.686)#14 | 0.010%(+0.756)#48 |
| 49. | Matinecock | 0.74% | 0.013%(+0.732)#5 | 0.010%(+0.734)#49 |
| 50. | Livermore Falls | 0.74% | 0.0034%(+0.733)#1 | 0.010%(+0.726)#50 |
| 51. | Orland Park | 0.72% | 0.080%(+0.641)#15 | 0.010%(+0.711)#51 |
| 52. | Cudjoe Key | 0.71% | 0.015%(+0.700)#7 | 0.010%(+0.705)#52 |
| 53. | Wells | 0.70% | 0.013%(+0.688)#6 | 0.010%(+0.690)#53 |
| 54. | Lake Barrington | 0.69% | 0.080%(+0.608)#16 | 0.010%(+0.678)#54 |
| 55. | West Lealman | 0.67% | 0.015%(+0.657)#8 | 0.010%(+0.662)#55 |
| 56. | Centerport | 0.66% | 0.013%(+0.649)#7 | 0.010%(+0.652)#56 |
| 57. | Stepney | 0.65% | 0.030%(+0.623)#2 | 0.010%(+0.643)#57 |
| 58. | North Topsail Beach | 0.65% | 0.0034%(+0.642)#1 | 0.010%(+0.635)#58 |
| 59. | Holiday Heights | 0.63% | 0.018%(+0.616)#7 | 0.010%(+0.624)#59 |
| 60. | Aberdeen | 0.63% | 0.0034%(+0.631)#2 | 0.010%(+0.624)#60 |
| 61. | Minot Afb | 0.63% | 0.0076%(+0.620)#1 | 0.010%(+0.617)#61 |
| 62. | Riverhead | 0.63% | 0.013%(+0.613)#8 | 0.010%(+0.615)#62 |
| 63. | North Barrington | 0.61% | 0.080%(+0.529)#17 | 0.010%(+0.599)#63 |
| 64. | Downers Grove | 0.61% | 0.080%(+0.528)#18 | 0.010%(+0.598)#64 |
| 65. | Brookfield | 0.60% | 0.080%(+0.524)#19 | 0.010%(+0.594)#65 |
| 66. | Humboldt | 0.57% | 0.0058%(+0.565)#1 | 0.010%(+0.561)#66 |
| 67. | Jonesville | 0.54% | 0.0018%(+0.539)#1 | 0.010%(+0.530)#67 |
| 68. | Lido Beach | 0.54% | 0.013%(+0.523)#9 | 0.010%(+0.525)#68 |
| 69. | Chicago Ridge | 0.53% | 0.080%(+0.445)#20 | 0.010%(+0.515)#69 |
| 70. | Villa Park | 0.52% | 0.080%(+0.438)#21 | 0.010%(+0.508)#70 |
| 71. | Palos Park | 0.52% | 0.080%(+0.437)#22 | 0.010%(+0.507)#71 |
| 72. | Bratenahl | 0.49% | 0.0061%(+0.486)#1 | 0.010%(+0.482)#72 |
| 73. | Bradley Beach Borough | 0.49% | 0.018%(+0.474)#8 | 0.010%(+0.482)#73 |
| 74. | Evendale | 0.49% | 0.0061%(+0.482)#2 | 0.010%(+0.478)#74 |
| 75. | Pistakee Highlands | 0.49% | 0.080%(+0.406)#23 | 0.010%(+0.476)#75 |
| 76. | Woodland Hills | 0.48% | 0.0010%(+0.482)#1 | 0.010%(+0.473)#76 |
| 77. | Hinsdale | 0.48% | 0.080%(+0.397)#24 | 0.010%(+0.467)#77 |
| 78. | Mayfield Heights | 0.47% | 0.0061%(+0.466)#3 | 0.010%(+0.462)#78 |
| 79. | Walton Hills | 0.47% | 0.0061%(+0.461)#4 | 0.010%(+0.457)#79 |
| 80. | West Concord | 0.47% | 0.017%(+0.448)#3 | 0.010%(+0.455)#80 |
| 81. | St Charles | 0.46% | 0.080%(+0.377)#25 | 0.010%(+0.447)#81 |
| 82. | Port Washington North | 0.44% | 0.013%(+0.429)#10 | 0.010%(+0.432)#82 |
| 83. | Minnetonka Beach | 0.43% | 0.0053%(+0.427)#1 | 0.010%(+0.422)#83 |
| 84. | County Center | 0.42% | 0.0086%(+0.414)#2 | 0.010%(+0.412)#84 |
| 85. | Fulton | 0.42% | 0.0020%(+0.417)#1 | 0.010%(+0.409)#85 |
| 86. | West Sayville | 0.42% | 0.013%(+0.405)#11 | 0.010%(+0.407)#86 |
| 87. | Lake Zurich | 0.42% | 0.080%(+0.335)#26 | 0.010%(+0.405)#87 |
| 88. | Stony Brook | 0.41% | 0.013%(+0.395)#12 | 0.010%(+0.398)#88 |
| 89. | Cresskill Borough | 0.41% | 0.018%(+0.388)#9 | 0.010%(+0.396)#89 |
| 90. | Evans Mills | 0.40% | 0.013%(+0.385)#13 | 0.010%(+0.387)#90 |
| 91. | Sea Cliff | 0.40% | 0.013%(+0.382)#14 | 0.010%(+0.385)#91 |
| 92. | Buhl | 0.39% | 0.0053%(+0.384)#2 | 0.010%(+0.379)#92 |
| 93. | Naperville | 0.38% | 0.080%(+0.304)#27 | 0.010%(+0.374)#93 |
| 94. | Frankfort Square | 0.38% | 0.080%(+0.304)#28 | 0.010%(+0.374)#94 |
| 95. | Meadow Oaks | 0.38% | 0.015%(+0.363)#9 | 0.010%(+0.368)#95 |
| 96. | Staples | 0.37% | 0.030%(+0.345)#3 | 0.010%(+0.365)#96 |
| 97. | Kenneth City | 0.36% | 0.015%(+0.342)#10 | 0.010%(+0.347)#97 |
| 98. | Youngstown | 0.36% | 0.013%(+0.343)#15 | 0.010%(+0.346)#98 |
| 99. | Michiana | 0.35% | 0.0085%(+0.342)#1 | 0.010%(+0.341)#99 |
| 100. | Blackwells Mills | 0.35% | 0.018%(+0.330)#10 | 0.010%(+0.338)#100 |
Common Questions
What are the Top 10 Cities with the Highest Percentage of Immigrants from Lithuania in the United States?
Top 10 Cities with the Highest Percentage of Immigrants from Lithuania in the United States are:
#1
13.36%
#2
3.76%
#3
2.60%
#4
2.34%
#5
2.15%
#6
2.12%
#7
1.85%
#8
1.82%
#9
1.69%
#10
1.67%
What city has the Highest Percentage of Immigrants from Lithuania in the United States?
Blue Diamond has the Highest Percentage of Immigrants from Lithuania in the United States with 13.36%.
What is the Percentage of Immigrants from Lithuania in the United States?
Percentage of Immigrants from Lithuania in the United States is 0.010%.