Cities with the Highest Percentage of Population Employed in Farming, Fishing & Forestry in the United States
RELATED REPORTS & OPTIONS
Farming, Fishing & Forestry
United States
Compare Cities
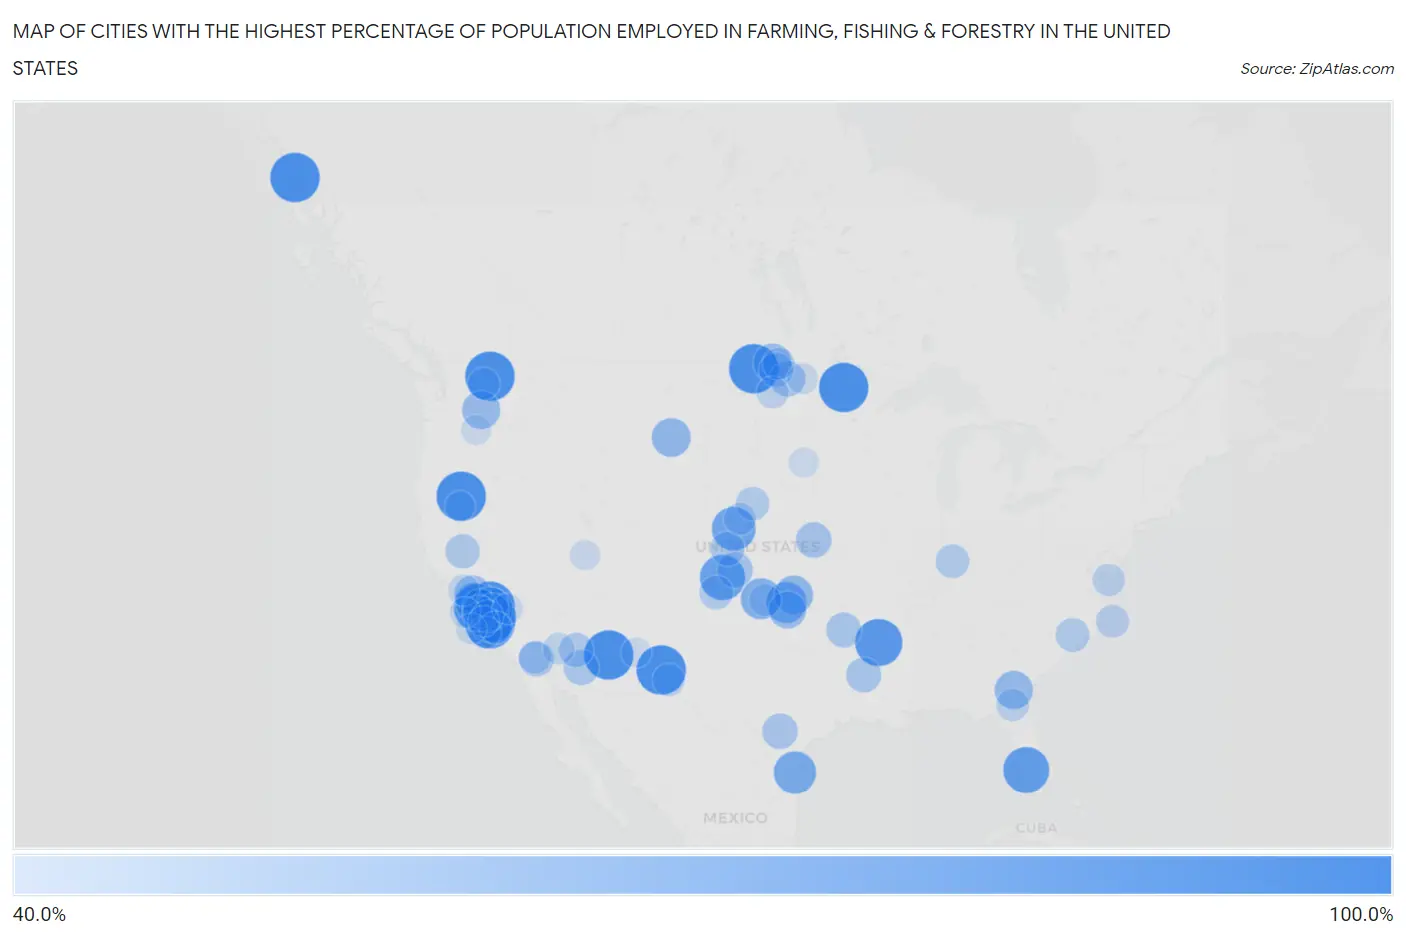
Map of Cities with the Highest Percentage of Population Employed in Farming, Fishing & Forestry in the United States
0.0%
100.0%
Cities with the Highest Percentage of Population Employed in Farming, Fishing & Forestry in the United States
| City | % Employed | vs State | vs National | |
| 1. | Cherokee Strip | 100.0% | 1.4%(+98.6)#1 | 0.61%(+99.4)#1 |
| 2. | Rock House | 100.0% | 0.51%(+99.5)#1 | 0.61%(+99.4)#2 |
| 3. | Yettem | 100.0% | 1.4%(+98.6)#2 | 0.61%(+99.4)#3 |
| 4. | Garfield | 100.0% | 0.91%(+99.1)#1 | 0.61%(+99.4)#4 |
| 5. | Beverly | 100.0% | 0.31%(+99.7)#1 | 0.61%(+99.4)#5 |
| 6. | Brentwood Colony | 100.0% | 1.7%(+98.3)#1 | 0.61%(+99.4)#6 |
| 7. | Funkley | 100.0% | 0.63%(+99.4)#1 | 0.61%(+99.4)#7 |
| 8. | Sunset Colony | 100.0% | 1.7%(+98.3)#2 | 0.61%(+99.4)#8 |
| 9. | Rodriguez Camp | 100.0% | 1.4%(+98.6)#3 | 0.61%(+99.4)#9 |
| 10. | Pondera Colony | 100.0% | 1.7%(+98.3)#1 | 0.61%(+99.4)#10 |
| 11. | Rockport Colony | 100.0% | 1.7%(+98.3)#2 | 0.61%(+99.4)#11 |
| 12. | Springwater Colony | 100.0% | 1.7%(+98.3)#3 | 0.61%(+99.4)#12 |
| 13. | Kramer | 100.0% | 1.6%(+98.4)#1 | 0.61%(+99.4)#13 |
| 14. | King Ranch Colony | 100.0% | 1.7%(+98.3)#4 | 0.61%(+99.4)#14 |
| 15. | Beatty | 100.0% | 1.4%(+98.6)#1 | 0.61%(+99.4)#15 |
| 16. | Disautel | 100.0% | 1.5%(+98.5)#1 | 0.61%(+99.4)#16 |
| 17. | Deerfield Colony | 100.0% | 1.7%(+98.3)#5 | 0.61%(+99.4)#17 |
| 18. | Kupreanof | 100.0% | 1.0%(+99.0)#1 | 0.61%(+99.4)#18 |
| 19. | Westside | 93.6% | 1.4%(+92.2)#4 | 0.61%(+93.0)#19 |
| 20. | Sherrill | 93.3% | 0.96%(+92.4)#1 | 0.61%(+92.7)#20 |
| 21. | Charleston Park | 89.7% | 0.47%(+89.2)#1 | 0.61%(+89.0)#21 |
| 22. | Hasty | 87.5% | 0.49%(+87.0)#1 | 0.61%(+86.9)#22 |
| 23. | Amherst | 83.1% | 0.49%(+82.6)#2 | 0.61%(+82.5)#23 |
| 24. | Gildford Colony | 82.4% | 1.7%(+80.7)#6 | 0.61%(+81.7)#24 |
| 25. | Linnell Camp | 79.4% | 1.4%(+78.0)#5 | 0.61%(+78.8)#25 |
| 26. | Los Angeles | 79.2% | 0.37%(+78.8)#1 | 0.61%(+78.6)#26 |
| 27. | Glen Allan | 79.1% | 0.63%(+78.4)#1 | 0.61%(+78.5)#27 |
| 28. | Woodville Farm Labor Camp | 78.3% | 1.4%(+76.9)#6 | 0.61%(+77.7)#28 |
| 29. | Las Tusas | 75.0% | 0.91%(+74.1)#2 | 0.61%(+74.4)#29 |
| 30. | Knowles | 75.0% | 0.66%(+74.3)#1 | 0.61%(+74.4)#30 |
| 31. | Lambert | 75.0% | 0.66%(+74.3)#2 | 0.61%(+74.4)#31 |
| 32. | Grant | 70.0% | 1.7%(+68.3)#7 | 0.61%(+69.4)#32 |
| 33. | Birney | 69.6% | 1.7%(+67.9)#8 | 0.61%(+69.0)#33 |
| 34. | Bluff City | 68.2% | 0.91%(+67.3)#1 | 0.61%(+67.6)#34 |
| 35. | Rockingham | 67.5% | 0.45%(+67.1)#1 | 0.61%(+66.9)#35 |
| 36. | Mattawa | 67.0% | 1.5%(+65.5)#2 | 0.61%(+66.4)#36 |
| 37. | Riverview Colony | 66.7% | 1.7%(+65.0)#9 | 0.61%(+66.1)#37 |
| 38. | Hansboro | 66.7% | 1.6%(+65.1)#2 | 0.61%(+66.1)#38 |
| 39. | Cantua Creek | 64.9% | 1.4%(+63.5)#7 | 0.61%(+64.3)#39 |
| 40. | Isabella | 64.5% | 0.66%(+63.9)#3 | 0.61%(+63.9)#40 |
| 41. | Mendota | 64.1% | 1.4%(+62.7)#8 | 0.61%(+63.5)#41 |
| 42. | El Nido | 62.7% | 1.4%(+61.3)#9 | 0.61%(+62.1)#42 |
| 43. | Rimrock Colony | 61.7% | 1.7%(+60.0)#10 | 0.61%(+61.1)#43 |
| 44. | East Orosi | 61.5% | 1.4%(+60.1)#10 | 0.61%(+60.9)#44 |
| 45. | Liberty | 60.0% | 1.3%(+58.7)#1 | 0.61%(+59.4)#45 |
| 46. | Brocket | 60.0% | 1.6%(+58.4)#3 | 0.61%(+59.4)#46 |
| 47. | Towner | 60.0% | 0.49%(+59.5)#3 | 0.61%(+59.4)#47 |
| 48. | Bigfoot | 59.6% | 0.37%(+59.2)#2 | 0.61%(+59.0)#48 |
| 49. | Desert Shores | 59.3% | 1.4%(+57.8)#11 | 0.61%(+58.7)#49 |
| 50. | Theba | 58.7% | 0.51%(+58.2)#2 | 0.61%(+58.1)#50 |
| 51. | Fords Creek Colony | 58.3% | 1.7%(+56.7)#11 | 0.61%(+57.7)#51 |
| 52. | Jovista | 58.3% | 1.4%(+56.9)#12 | 0.61%(+57.7)#52 |
| 53. | Kettleman City | 58.3% | 1.4%(+56.9)#13 | 0.61%(+57.7)#53 |
| 54. | Bryceland | 58.1% | 0.50%(+57.6)#1 | 0.61%(+57.5)#54 |
| 55. | Midland | 58.0% | 0.96%(+57.0)#2 | 0.61%(+57.4)#55 |
| 56. | Egeland | 56.8% | 1.6%(+55.2)#4 | 0.61%(+56.2)#56 |
| 57. | Aguila | 56.5% | 0.51%(+56.0)#3 | 0.61%(+55.9)#57 |
| 58. | Lanare | 56.4% | 1.4%(+55.0)#14 | 0.61%(+55.8)#58 |
| 59. | Clipper Mills | 56.4% | 1.4%(+55.0)#15 | 0.61%(+55.8)#59 |
| 60. | Kirk | 55.8% | 0.49%(+55.3)#4 | 0.61%(+55.2)#60 |
| 61. | Ingold | 55.0% | 0.51%(+54.5)#1 | 0.61%(+54.4)#61 |
| 62. | Fowler | 55.0% | 0.31%(+54.7)#2 | 0.61%(+54.4)#62 |
| 63. | Hashtown | 55.0% | 0.39%(+54.6)#1 | 0.61%(+54.4)#63 |
| 64. | Kim | 55.0% | 0.49%(+54.5)#5 | 0.61%(+54.4)#64 |
| 65. | Owensburg | 54.8% | 0.39%(+54.4)#2 | 0.61%(+54.2)#65 |
| 66. | Seneca | 54.5% | 1.3%(+53.2)#2 | 0.61%(+53.9)#66 |
| 67. | Pumpkin Center | 52.3% | 1.4%(+50.9)#16 | 0.61%(+51.7)#67 |
| 68. | Tonyville | 52.2% | 1.4%(+50.8)#17 | 0.61%(+51.6)#68 |
| 69. | Waves | 52.0% | 0.51%(+51.5)#2 | 0.61%(+51.4)#69 |
| 70. | Edmundson Acres | 51.7% | 1.4%(+50.3)#18 | 0.61%(+51.1)#70 |
| 71. | Huron | 51.4% | 1.4%(+50.0)#19 | 0.61%(+50.8)#71 |
| 72. | Fargo | 51.3% | 0.45%(+50.9)#2 | 0.61%(+50.7)#72 |
| 73. | Mesquite | 51.1% | 0.91%(+50.1)#3 | 0.61%(+50.4)#73 |
| 74. | Weedpatch | 50.6% | 1.4%(+49.2)#20 | 0.61%(+50.0)#74 |
| 75. | Saxis | 50.5% | 0.33%(+50.2)#1 | 0.61%(+49.9)#75 |
| 76. | Oasis | 50.0% | 1.4%(+48.6)#21 | 0.61%(+49.4)#76 |
| 77. | Spring Creek Colony | 50.0% | 1.7%(+48.3)#3 | 0.61%(+49.4)#77 |
| 78. | Martin | 50.0% | 1.3%(+48.7)#3 | 0.61%(+49.4)#78 |
| 79. | Rosston | 50.0% | 0.66%(+49.3)#4 | 0.61%(+49.4)#79 |
| 80. | Cathay | 50.0% | 1.6%(+48.4)#5 | 0.61%(+49.4)#80 |
| 81. | Sarles | 50.0% | 1.6%(+48.4)#6 | 0.61%(+49.4)#81 |
| 82. | Cuyama | 50.0% | 1.4%(+48.6)#22 | 0.61%(+49.4)#82 |
| 83. | Brockway | 50.0% | 1.7%(+48.3)#12 | 0.61%(+49.4)#83 |
| 84. | Alpaugh | 49.4% | 1.4%(+48.0)#23 | 0.61%(+48.8)#84 |
| 85. | Bridgeport | 49.3% | 1.5%(+47.8)#3 | 0.61%(+48.7)#85 |
| 86. | Poston | 49.2% | 0.51%(+48.7)#4 | 0.61%(+48.6)#86 |
| 87. | Placitas Cdp Dona Ana County | 48.8% | 0.91%(+47.9)#4 | 0.61%(+48.2)#87 |
| 88. | Crows Landing | 47.5% | 1.4%(+46.1)#24 | 0.61%(+46.9)#88 |
| 89. | La Coma Heights | 46.2% | 0.37%(+45.8)#3 | 0.61%(+45.6)#89 |
| 90. | Ardoch | 46.2% | 1.6%(+44.6)#7 | 0.61%(+45.5)#90 |
| 91. | Edna | 46.1% | 1.4%(+44.7)#25 | 0.61%(+45.5)#91 |
| 92. | San Lucas | 46.0% | 1.4%(+44.6)#26 | 0.61%(+45.4)#92 |
| 93. | Fluvanna | 45.8% | 0.37%(+45.5)#4 | 0.61%(+45.2)#93 |
| 94. | Cartago | 45.7% | 1.4%(+44.3)#27 | 0.61%(+45.1)#94 |
| 95. | Lost Hills | 45.7% | 1.4%(+44.3)#28 | 0.61%(+45.1)#95 |
| 96. | Oasis | 45.0% | 0.32%(+44.7)#1 | 0.61%(+44.4)#96 |
| 97. | Ramona | 44.8% | 1.7%(+43.1)#4 | 0.61%(+44.2)#97 |
| 98. | Roosevelt | 44.8% | 1.5%(+43.3)#4 | 0.61%(+44.2)#98 |
| 99. | Newell | 44.6% | 1.4%(+43.1)#29 | 0.61%(+44.0)#99 |
| 100. | Luna | 44.4% | 0.91%(+43.5)#5 | 0.61%(+43.8)#100 |
Common Questions
What are the Top 10 Cities with the Highest Percentage of Population Employed in Farming, Fishing & Forestry in the United States?
Top 10 Cities with the Highest Percentage of Population Employed in Farming, Fishing & Forestry in the United States are:
What city has the Highest Percentage of Population Employed in Farming, Fishing & Forestry in the United States?
Cherokee Strip has the Highest Percentage of Population Employed in Farming, Fishing & Forestry in the United States with 100.0%.
What is the Percentage of Population Employed in Farming, Fishing & Forestry in the United States?
Percentage of Population Employed in Farming, Fishing & Forestry in the United States is 0.61%.