Cities with the Most Immigrants from Mexico in the United States
RELATED REPORTS & OPTIONS
Mexico
United States
Compare Cities
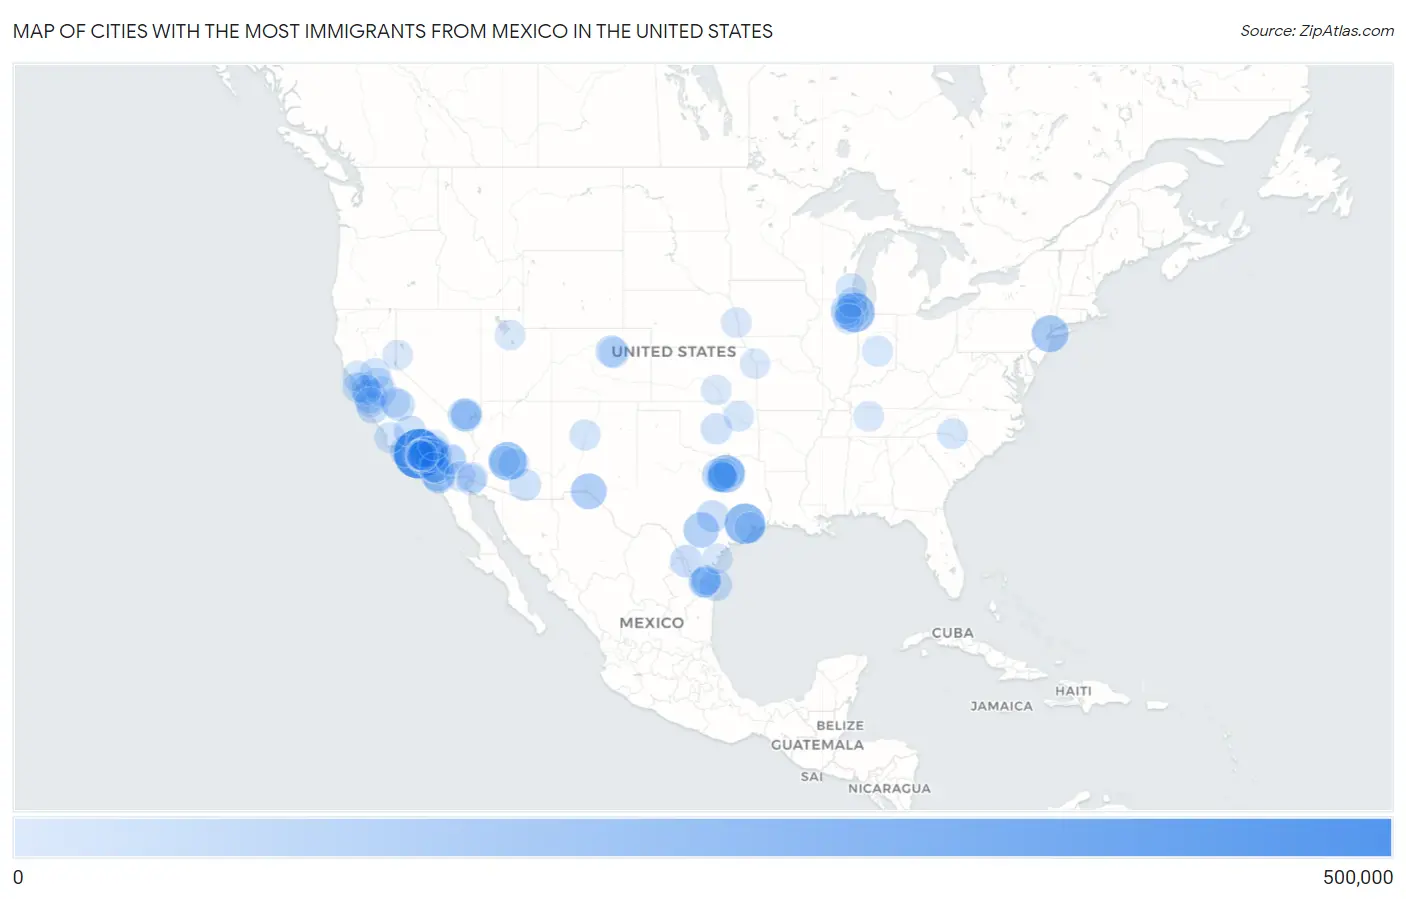
Map of Cities with the Most Immigrants from Mexico in the United States
0
500,000
Cities with the Most Immigrants from Mexico in the United States
| City | Mexico | vs State | vs National | |
| 1. | Los Angeles | 450,825 | 3,881,193(11.62%)#1 | 10,767,104(4.19%)#1 |
| 2. | Houston | 238,486 | 2,411,723(9.89%)#1 | 10,767,104(2.21%)#2 |
| 3. | Chicago | 218,858 | 626,958(34.91%)#1 | 10,767,104(2.03%)#3 |
| 4. | Phoenix | 189,099 | 500,086(37.81%)#1 | 10,767,104(1.76%)#4 |
| 5. | Dallas | 176,435 | 2,411,723(7.32%)#2 | 10,767,104(1.64%)#5 |
| 6. | New York | 158,758 | 214,559(73.99%)#1 | 10,767,104(1.47%)#6 |
| 7. | El Paso | 133,665 | 2,411,723(5.54%)#3 | 10,767,104(1.24%)#7 |
| 8. | San Antonio | 128,973 | 2,411,723(5.35%)#4 | 10,767,104(1.20%)#8 |
| 9. | San Diego | 110,404 | 3,881,193(2.84%)#2 | 10,767,104(1.03%)#9 |
| 10. | Santa Ana | 90,086 | 3,881,193(2.32%)#3 | 10,767,104(0.84%)#10 |
| 11. | San Jose | 84,963 | 3,881,193(2.19%)#4 | 10,767,104(0.79%)#11 |
| 12. | Fort Worth | 82,118 | 2,411,723(3.40%)#5 | 10,767,104(0.76%)#12 |
| 13. | Laredo | 59,934 | 2,411,723(2.49%)#6 | 10,767,104(0.56%)#13 |
| 14. | Anaheim | 57,566 | 3,881,193(1.48%)#5 | 10,767,104(0.53%)#14 |
| 15. | Las Vegas | 55,945 | 218,248(25.63%)#1 | 10,767,104(0.52%)#15 |
| 16. | Austin | 54,270 | 2,411,723(2.25%)#7 | 10,767,104(0.50%)#16 |
| 17. | Oxnard | 53,460 | 3,881,193(1.38%)#6 | 10,767,104(0.50%)#17 |
| 18. | Long Beach | 52,140 | 3,881,193(1.34%)#7 | 10,767,104(0.48%)#18 |
| 19. | Chula Vista | 50,141 | 3,881,193(1.29%)#8 | 10,767,104(0.47%)#19 |
| 20. | Salinas | 49,073 | 3,881,193(1.26%)#9 | 10,767,104(0.46%)#20 |
| 21. | Fresno | 48,849 | 3,881,193(1.26%)#10 | 10,767,104(0.45%)#21 |
| 22. | Brownsville | 47,668 | 2,411,723(1.98%)#8 | 10,767,104(0.44%)#22 |
| 23. | Tucson | 47,524 | 500,086(9.50%)#2 | 10,767,104(0.44%)#23 |
| 24. | Denver | 43,193 | 209,491(20.62%)#1 | 10,767,104(0.40%)#24 |
| 25. | Bakersfield | 42,912 | 3,881,193(1.11%)#11 | 10,767,104(0.40%)#25 |
| 26. | East Los Angeles | 38,631 | 3,881,193(1.00%)#12 | 10,767,104(0.36%)#26 |
| 27. | Riverside | 38,263 | 3,881,193(0.99%)#13 | 10,767,104(0.36%)#27 |
| 28. | Fontana | 36,162 | 3,881,193(0.93%)#14 | 10,767,104(0.34%)#28 |
| 29. | Stockton | 35,890 | 3,881,193(0.92%)#15 | 10,767,104(0.33%)#29 |
| 30. | Oklahoma City | 35,884 | 103,425(34.70%)#1 | 10,767,104(0.33%)#30 |
| 31. | Moreno Valley | 34,177 | 3,881,193(0.88%)#16 | 10,767,104(0.32%)#31 |
| 32. | San Bernardino | 33,766 | 3,881,193(0.87%)#17 | 10,767,104(0.31%)#32 |
| 33. | Sunrise Manor | 32,940 | 218,248(15.09%)#2 | 10,767,104(0.31%)#33 |
| 34. | Garland | 32,864 | 2,411,723(1.36%)#9 | 10,767,104(0.31%)#34 |
| 35. | North Las Vegas | 32,484 | 218,248(14.88%)#3 | 10,767,104(0.30%)#35 |
| 36. | Mesa | 31,969 | 500,086(6.39%)#3 | 10,767,104(0.30%)#36 |
| 37. | Mcallen | 31,812 | 2,411,723(1.32%)#10 | 10,767,104(0.30%)#37 |
| 38. | Ontario | 31,089 | 3,881,193(0.80%)#18 | 10,767,104(0.29%)#38 |
| 39. | Aurora | 30,770 | 209,491(14.69%)#2 | 10,767,104(0.29%)#39 |
| 40. | Pomona | 30,525 | 3,881,193(0.79%)#19 | 10,767,104(0.28%)#40 |
| 41. | South Gate | 30,228 | 3,881,193(0.78%)#20 | 10,767,104(0.28%)#41 |
| 42. | Sacramento | 30,114 | 3,881,193(0.78%)#21 | 10,767,104(0.28%)#42 |
| 43. | Pasadena | 29,849 | 2,411,723(1.24%)#11 | 10,767,104(0.28%)#43 |
| 44. | Santa Maria | 29,811 | 3,881,193(0.77%)#22 | 10,767,104(0.28%)#44 |
| 45. | Oakland | 29,632 | 3,881,193(0.76%)#23 | 10,767,104(0.28%)#45 |
| 46. | Cicero | 29,311 | 626,958(4.68%)#2 | 10,767,104(0.27%)#46 |
| 47. | Arlington | 29,153 | 2,411,723(1.21%)#12 | 10,767,104(0.27%)#47 |
| 48. | Albuquerque | 28,645 | 129,316(22.15%)#1 | 10,767,104(0.27%)#48 |
| 49. | Escondido | 28,104 | 3,881,193(0.72%)#24 | 10,767,104(0.26%)#49 |
| 50. | Milwaukee | 27,956 | 87,182(32.07%)#1 | 10,767,104(0.26%)#50 |
| 51. | Irving | 27,471 | 2,411,723(1.14%)#13 | 10,767,104(0.26%)#51 |
| 52. | Aurora | 25,652 | 626,958(4.09%)#3 | 10,767,104(0.24%)#52 |
| 53. | El Monte | 24,743 | 3,881,193(0.64%)#25 | 10,767,104(0.23%)#53 |
| 54. | Grand Prairie | 24,720 | 2,411,723(1.02%)#14 | 10,767,104(0.23%)#54 |
| 55. | Indianapolis | 24,547 | 101,996(24.07%)#1 | 10,767,104(0.23%)#55 |
| 56. | Pharr | 23,281 | 2,411,723(0.97%)#15 | 10,767,104(0.22%)#56 |
| 57. | Jurupa Valley | 22,607 | 3,881,193(0.58%)#26 | 10,767,104(0.21%)#57 |
| 58. | Compton | 22,027 | 3,881,193(0.57%)#27 | 10,767,104(0.20%)#58 |
| 59. | Charlotte | 21,823 | 214,776(10.16%)#1 | 10,767,104(0.20%)#59 |
| 60. | Glendale | 21,581 | 500,086(4.32%)#4 | 10,767,104(0.20%)#60 |
| 61. | Mission | 21,447 | 2,411,723(0.89%)#16 | 10,767,104(0.20%)#61 |
| 62. | Santa Rosa | 21,083 | 3,881,193(0.54%)#28 | 10,767,104(0.20%)#62 |
| 63. | Tulsa | 20,881 | 103,425(20.19%)#2 | 10,767,104(0.19%)#63 |
| 64. | San Francisco | 20,457 | 3,881,193(0.53%)#29 | 10,767,104(0.19%)#64 |
| 65. | Palmdale | 20,081 | 3,881,193(0.52%)#30 | 10,767,104(0.19%)#65 |
| 66. | Modesto | 19,991 | 3,881,193(0.52%)#31 | 10,767,104(0.19%)#66 |
| 67. | Elgin | 19,824 | 626,958(3.16%)#4 | 10,767,104(0.18%)#67 |
| 68. | Garden Grove | 19,384 | 3,881,193(0.50%)#32 | 10,767,104(0.18%)#68 |
| 69. | Lynwood | 19,184 | 3,881,193(0.49%)#33 | 10,767,104(0.18%)#69 |
| 70. | Rialto | 19,103 | 3,881,193(0.49%)#34 | 10,767,104(0.18%)#70 |
| 71. | Downey | 19,072 | 3,881,193(0.49%)#35 | 10,767,104(0.18%)#71 |
| 72. | Huntington Park | 18,960 | 3,881,193(0.49%)#36 | 10,767,104(0.18%)#72 |
| 73. | Florence Graham | 18,804 | 3,881,193(0.48%)#37 | 10,767,104(0.17%)#73 |
| 74. | Nashville | 18,653 | 86,435(21.58%)#1 | 10,767,104(0.17%)#74 |
| 75. | Perris | 18,367 | 3,881,193(0.47%)#38 | 10,767,104(0.17%)#75 |
| 76. | Hayward | 18,033 | 3,881,193(0.46%)#39 | 10,767,104(0.17%)#76 |
| 77. | Oceanside | 17,578 | 3,881,193(0.45%)#40 | 10,767,104(0.16%)#77 |
| 78. | Corona | 17,510 | 3,881,193(0.45%)#41 | 10,767,104(0.16%)#78 |
| 79. | Norwalk | 17,174 | 3,881,193(0.44%)#42 | 10,767,104(0.16%)#79 |
| 80. | Indio | 16,777 | 3,881,193(0.43%)#43 | 10,767,104(0.16%)#80 |
| 81. | Edinburg | 16,738 | 2,411,723(0.69%)#17 | 10,767,104(0.16%)#81 |
| 82. | Coachella | 16,597 | 3,881,193(0.43%)#44 | 10,767,104(0.15%)#82 |
| 83. | Omaha | 16,543 | 46,610(35.49%)#1 | 10,767,104(0.15%)#83 |
| 84. | Wichita | 16,527 | 81,282(20.33%)#1 | 10,767,104(0.15%)#84 |
| 85. | Baldwin Park | 16,434 | 3,881,193(0.42%)#45 | 10,767,104(0.15%)#85 |
| 86. | Watsonville | 16,394 | 3,881,193(0.42%)#46 | 10,767,104(0.15%)#86 |
| 87. | Inglewood | 16,319 | 3,881,193(0.42%)#47 | 10,767,104(0.15%)#87 |
| 88. | Corpus Christi | 16,302 | 2,411,723(0.68%)#18 | 10,767,104(0.15%)#88 |
| 89. | West Valley City | 16,244 | 99,740(16.29%)#1 | 10,767,104(0.15%)#89 |
| 90. | Madera | 16,243 | 3,881,193(0.42%)#48 | 10,767,104(0.15%)#90 |
| 91. | Vista | 16,198 | 3,881,193(0.42%)#49 | 10,767,104(0.15%)#91 |
| 92. | Waukegan | 16,061 | 626,958(2.56%)#5 | 10,767,104(0.15%)#92 |
| 93. | Calexico | 15,944 | 3,881,193(0.41%)#50 | 10,767,104(0.15%)#93 |
| 94. | Victorville | 15,713 | 3,881,193(0.40%)#51 | 10,767,104(0.15%)#94 |
| 95. | Joliet | 15,709 | 626,958(2.51%)#6 | 10,767,104(0.15%)#95 |
| 96. | San Luis | 15,621 | 500,086(3.12%)#5 | 10,767,104(0.15%)#96 |
| 97. | Yuma | 15,240 | 500,086(3.05%)#6 | 10,767,104(0.14%)#97 |
| 98. | Kansas City | 15,212 | 81,282(18.72%)#2 | 10,767,104(0.14%)#98 |
| 99. | Paramount | 14,778 | 3,881,193(0.38%)#52 | 10,767,104(0.14%)#99 |
| 100. | Reno | 14,420 | 218,248(6.61%)#4 | 10,767,104(0.13%)#100 |
Common Questions
What are the Top 10 Cities with the Most Immigrants from Mexico in the United States?
Top 10 Cities with the Most Immigrants from Mexico in the United States are:
What city has the Most Immigrants from Mexico in the United States?
Los Angeles has the Most Immigrants from Mexico in the United States with 450,825.
What is the Total Immigrants from Mexico in the United States?
Total Immigrants from Mexico in the United States is 10,767,104.