Cities with the Highest Percentage of Arab Population in the United States
RELATED REPORTS & OPTIONS
Arab
United States
Compare Cities
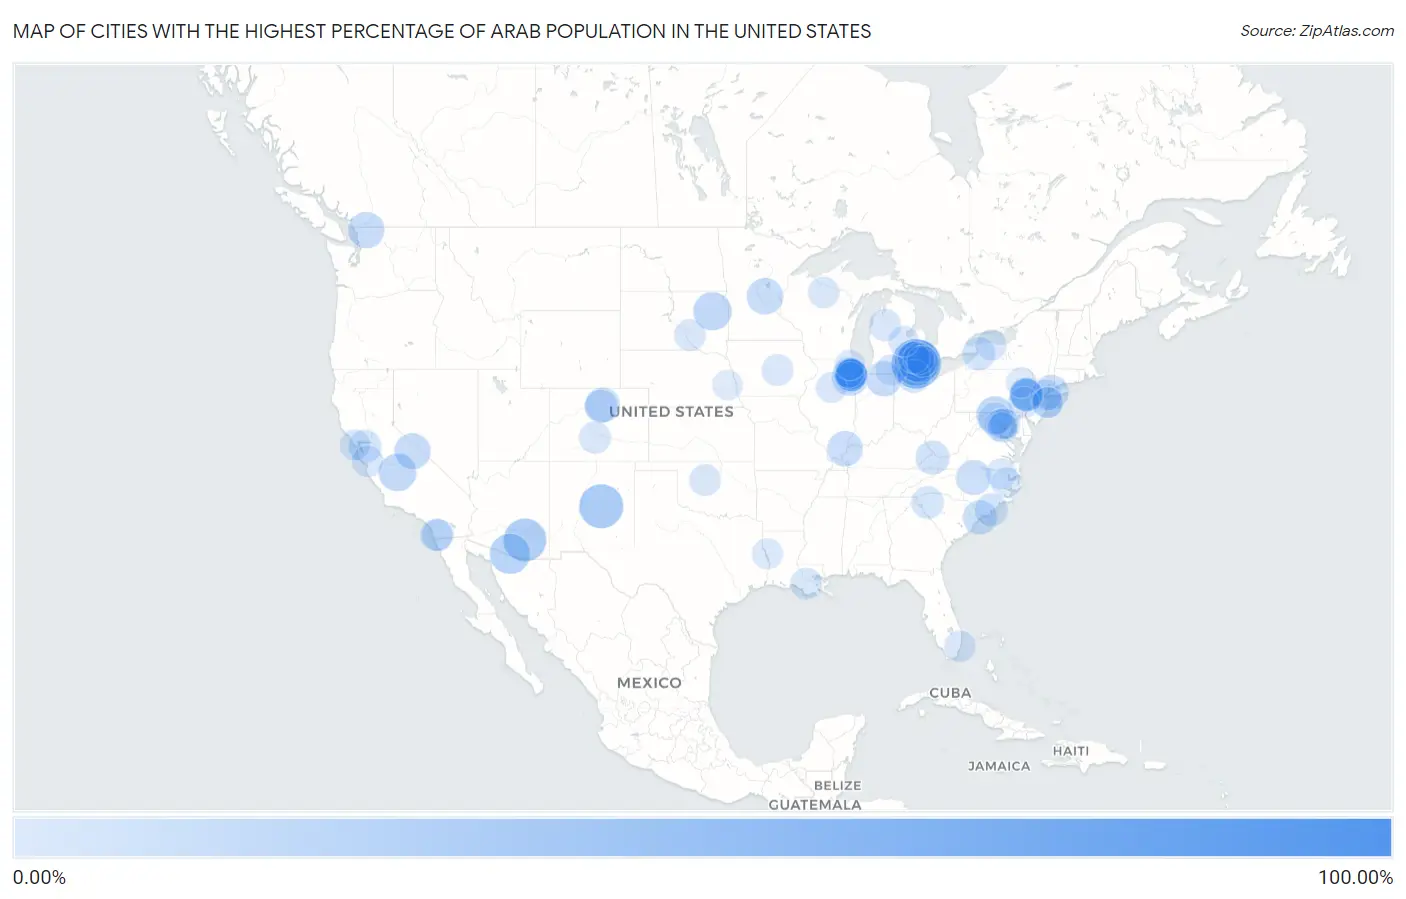
Map of Cities with the Highest Percentage of Arab Population in the United States
0.00%
100.00%
Cities with the Highest Percentage of Arab Population in the United States
| City | Arab | vs State | vs National | |
| 1. | Ovett | 82.24% | 0.24%(+82.0)#1 | 0.65%(+81.6)#1 |
| 2. | Dearborn | 44.01% | 2.10%(+41.9)#1 | 0.65%(+43.4)#2 |
| 3. | Hawleyville | 38.00% | 0.69%(+37.3)#1 | 0.65%(+37.3)#3 |
| 4. | Dearborn Heights | 33.47% | 2.10%(+31.4)#2 | 0.65%(+32.8)#4 |
| 5. | Duran | 33.33% | 0.31%(+33.0)#1 | 0.65%(+32.7)#5 |
| 6. | Summerhaven | 30.77% | 0.52%(+30.2)#1 | 0.65%(+30.1)#6 |
| 7. | Hamtramck | 30.52% | 2.10%(+28.4)#3 | 0.65%(+29.9)#7 |
| 8. | Orient | 27.95% | 0.46%(+27.5)#1 | 0.65%(+27.3)#8 |
| 9. | San Miguel | 25.80% | 0.52%(+25.3)#2 | 0.65%(+25.1)#9 |
| 10. | Garden City | 21.88% | 0.22%(+21.7)#1 | 0.65%(+21.2)#10 |
| 11. | Hardwick | 20.62% | 0.83%(+19.8)#1 | 0.65%(+20.0)#11 |
| 12. | Breathedsville | 20.38% | 0.60%(+19.8)#1 | 0.65%(+19.7)#12 |
| 13. | Yermo | 19.16% | 0.83%(+18.3)#2 | 0.65%(+18.5)#13 |
| 14. | Orland Hills | 19.00% | 0.76%(+18.2)#1 | 0.65%(+18.3)#14 |
| 15. | Ronneby | 18.52% | 0.46%(+18.1)#1 | 0.65%(+17.9)#15 |
| 16. | Deal Borough | 18.45% | 1.23%(+17.2)#1 | 0.65%(+17.8)#16 |
| 17. | Glacier | 18.26% | 0.52%(+17.7)#1 | 0.65%(+17.6)#17 |
| 18. | Sunny Slopes | 18.18% | 0.83%(+17.4)#3 | 0.65%(+17.5)#18 |
| 19. | Melvindale | 17.22% | 2.10%(+15.1)#4 | 0.65%(+16.6)#19 |
| 20. | Junction | 16.95% | 0.76%(+16.2)#2 | 0.65%(+16.3)#20 |
| 21. | Topeka | 16.52% | 0.33%(+16.2)#1 | 0.65%(+15.9)#21 |
| 22. | Efland | 16.00% | 0.44%(+15.6)#1 | 0.65%(+15.3)#22 |
| 23. | Norris | 15.91% | 0.15%(+15.8)#1 | 0.65%(+15.3)#23 |
| 24. | Saddle Rock Estates | 15.89% | 0.94%(+14.9)#1 | 0.65%(+15.2)#24 |
| 25. | Altona | 15.63% | 0.45%(+15.2)#1 | 0.65%(+15.0)#25 |
| 26. | East Columbia | 15.38% | 0.57%(+14.8)#1 | 0.65%(+14.7)#26 |
| 27. | Atlantic Beach | 14.46% | 0.31%(+14.2)#1 | 0.65%(+13.8)#27 |
| 28. | Vansant | 13.97% | 0.94%(+13.0)#1 | 0.65%(+13.3)#28 |
| 29. | Chicago Ridge | 13.64% | 0.76%(+12.9)#3 | 0.65%(+13.0)#29 |
| 30. | Wilmore Borough | 13.59% | 0.60%(+13.0)#1 | 0.65%(+12.9)#30 |
| 31. | West Warren | 13.56% | 1.06%(+12.5)#1 | 0.65%(+12.9)#31 |
| 32. | Hightsville | 12.27% | 0.44%(+11.8)#2 | 0.65%(+11.6)#32 |
| 33. | El Sobrante Cdp Riverside County | 12.20% | 0.83%(+11.4)#4 | 0.65%(+11.5)#33 |
| 34. | Curtice | 11.93% | 0.74%(+11.2)#1 | 0.65%(+11.3)#34 |
| 35. | Lackawanna | 11.90% | 0.94%(+11.0)#2 | 0.65%(+11.2)#35 |
| 36. | Fullerton | 11.89% | 0.60%(+11.3)#2 | 0.65%(+11.2)#36 |
| 37. | Sunshine | 11.79% | 0.45%(+11.3)#2 | 0.65%(+11.1)#37 |
| 38. | Worth | 11.61% | 0.76%(+10.9)#4 | 0.65%(+11.0)#38 |
| 39. | Garretts Mill | 11.46% | 0.60%(+10.9)#2 | 0.65%(+10.8)#39 |
| 40. | Diablo | 11.40% | 0.83%(+10.6)#5 | 0.65%(+10.7)#40 |
| 41. | Goose Creek | 11.36% | 0.94%(+10.4)#2 | 0.65%(+10.7)#41 |
| 42. | West Pelzer | 11.34% | 0.31%(+11.0)#2 | 0.65%(+10.7)#42 |
| 43. | El Cajon | 11.28% | 0.83%(+10.5)#6 | 0.65%(+10.6)#43 |
| 44. | Hokendauqua | 11.08% | 0.60%(+10.5)#3 | 0.65%(+10.4)#44 |
| 45. | Mcbride | 10.84% | 0.30%(+10.5)#1 | 0.65%(+10.2)#45 |
| 46. | Hickory Hills | 10.70% | 0.76%(+9.95)#5 | 0.65%(+10.0)#46 |
| 47. | Stiles | 10.67% | 0.60%(+10.1)#4 | 0.65%(+10.0)#47 |
| 48. | Egypt | 10.44% | 0.60%(+9.84)#5 | 0.65%(+9.79)#48 |
| 49. | Bridgeport Borough | 10.44% | 0.60%(+9.84)#6 | 0.65%(+9.79)#49 |
| 50. | Bridgeview | 10.37% | 0.76%(+9.61)#6 | 0.65%(+9.71)#50 |
| 51. | Haring | 10.15% | 2.10%(+8.05)#5 | 0.65%(+9.50)#51 |
| 52. | Bloomingdale Borough | 10.12% | 1.23%(+8.89)#2 | 0.65%(+9.47)#52 |
| 53. | Union Beach Borough | 10.02% | 1.23%(+8.78)#3 | 0.65%(+9.36)#53 |
| 54. | Orchard Lake Village | 9.91% | 2.10%(+7.81)#6 | 0.65%(+9.25)#54 |
| 55. | Labadieville | 9.90% | 0.47%(+9.43)#1 | 0.65%(+9.24)#55 |
| 56. | Loyal | 9.82% | 0.30%(+9.52)#2 | 0.65%(+9.17)#56 |
| 57. | Coaldale | 9.76% | 0.45%(+9.31)#3 | 0.65%(+9.11)#57 |
| 58. | Palos Hills | 9.67% | 0.76%(+8.91)#7 | 0.65%(+9.01)#58 |
| 59. | Rancho San Diego | 9.63% | 0.83%(+8.81)#7 | 0.65%(+8.98)#59 |
| 60. | Lowes Island | 9.60% | 0.94%(+8.65)#3 | 0.65%(+8.94)#60 |
| 61. | Pukwana | 9.56% | 0.22%(+9.33)#2 | 0.65%(+8.90)#61 |
| 62. | Andover Borough | 9.50% | 1.23%(+8.27)#4 | 0.65%(+8.85)#62 |
| 63. | Haverhill | 9.47% | 0.32%(+9.15)#1 | 0.65%(+8.81)#63 |
| 64. | Day Valley | 9.13% | 0.83%(+8.31)#8 | 0.65%(+8.48)#64 |
| 65. | Minocqua | 9.11% | 0.29%(+8.83)#1 | 0.65%(+8.46)#65 |
| 66. | Loch Arbour | 9.09% | 1.23%(+7.86)#5 | 0.65%(+8.44)#66 |
| 67. | Coldwater | 8.99% | 2.10%(+6.89)#7 | 0.65%(+8.34)#67 |
| 68. | Allenhurst Borough | 8.98% | 1.23%(+7.75)#6 | 0.65%(+8.33)#68 |
| 69. | Golden Beach | 8.94% | 0.63%(+8.31)#1 | 0.65%(+8.29)#69 |
| 70. | Underhill Center | 8.93% | 0.32%(+8.61)#1 | 0.65%(+8.27)#70 |
| 71. | Sterling Heights | 8.92% | 2.10%(+6.82)#8 | 0.65%(+8.27)#71 |
| 72. | Mehan | 8.82% | 0.30%(+8.52)#3 | 0.65%(+8.17)#72 |
| 73. | Bayonne | 8.82% | 1.23%(+7.58)#7 | 0.65%(+8.16)#73 |
| 74. | Moneta | 8.73% | 0.94%(+7.79)#4 | 0.65%(+8.08)#74 |
| 75. | Halfway House | 8.71% | 0.60%(+8.11)#7 | 0.65%(+8.06)#75 |
| 76. | Milltown Borough | 8.64% | 1.23%(+7.40)#8 | 0.65%(+7.98)#76 |
| 77. | Village Of Grosse Pointe Shores | 8.43% | 2.10%(+6.33)#9 | 0.65%(+7.78)#77 |
| 78. | Justice | 8.41% | 0.76%(+7.65)#8 | 0.65%(+7.75)#78 |
| 79. | Derwood | 8.32% | 0.60%(+7.72)#3 | 0.65%(+7.67)#79 |
| 80. | Trent | 8.31% | 0.46%(+7.85)#2 | 0.65%(+7.65)#80 |
| 81. | Noble | 8.22% | 0.47%(+7.75)#2 | 0.65%(+7.56)#81 |
| 82. | Preakness | 8.21% | 1.23%(+6.98)#9 | 0.65%(+7.55)#82 |
| 83. | Stinson Beach | 8.09% | 0.83%(+7.26)#9 | 0.65%(+7.43)#83 |
| 84. | Clarkson | 7.96% | 0.94%(+7.02)#3 | 0.65%(+7.31)#84 |
| 85. | Shields | 7.85% | 2.10%(+5.75)#10 | 0.65%(+7.19)#85 |
| 86. | Woodland | 7.78% | 0.44%(+7.34)#3 | 0.65%(+7.12)#86 |
| 87. | Varna | 7.76% | 0.76%(+7.01)#9 | 0.65%(+7.11)#87 |
| 88. | Orland Park | 7.76% | 0.76%(+7.01)#10 | 0.65%(+7.11)#88 |
| 89. | Teterboro Borough | 7.69% | 1.23%(+6.46)#10 | 0.65%(+7.04)#89 |
| 90. | Oak Brook | 7.66% | 0.76%(+6.91)#11 | 0.65%(+7.01)#90 |
| 91. | Oakhurst | 7.62% | 1.23%(+6.38)#11 | 0.65%(+6.96)#91 |
| 92. | Jamesville | 7.55% | 0.44%(+7.12)#4 | 0.65%(+6.90)#92 |
| 93. | Spencerville | 7.52% | 0.60%(+6.92)#4 | 0.65%(+6.86)#93 |
| 94. | Hilldale | 7.51% | 0.60%(+6.91)#8 | 0.65%(+6.86)#94 |
| 95. | Greens Farms | 7.51% | 0.69%(+6.81)#2 | 0.65%(+6.85)#95 |
| 96. | Ithaca | 7.30% | 0.43%(+6.87)#1 | 0.65%(+6.65)#96 |
| 97. | Totowa Borough | 7.23% | 1.23%(+6.00)#12 | 0.65%(+6.58)#97 |
| 98. | Silverado | 7.18% | 0.83%(+6.35)#10 | 0.65%(+6.52)#98 |
| 99. | Mettawa | 7.15% | 0.76%(+6.40)#12 | 0.65%(+6.50)#99 |
| 100. | Seven Corners | 7.13% | 0.94%(+6.19)#5 | 0.65%(+6.48)#100 |
Common Questions
What are the Top 10 Cities with the Highest Percentage of Arab Population in the United States?
Top 10 Cities with the Highest Percentage of Arab Population in the United States are:
#1
44.01%
#2
33.47%
#3
33.33%
#4
30.77%
#5
30.52%
#6
25.80%
#7
21.88%
#8
20.62%
#9
20.38%
#10
19.00%
What city has the Highest Percentage of Arab Population in the United States?
Dearborn has the Highest Percentage of Arab Population in the United States with 44.01%.
What is the Percentage of Arab Population in the United States?
Percentage of Arab Population in the United States is 0.65%.