Cities with the Highest Percentage of Immigrants from Lebanon in the United States
RELATED REPORTS & OPTIONS
Lebanon
United States
Compare Cities
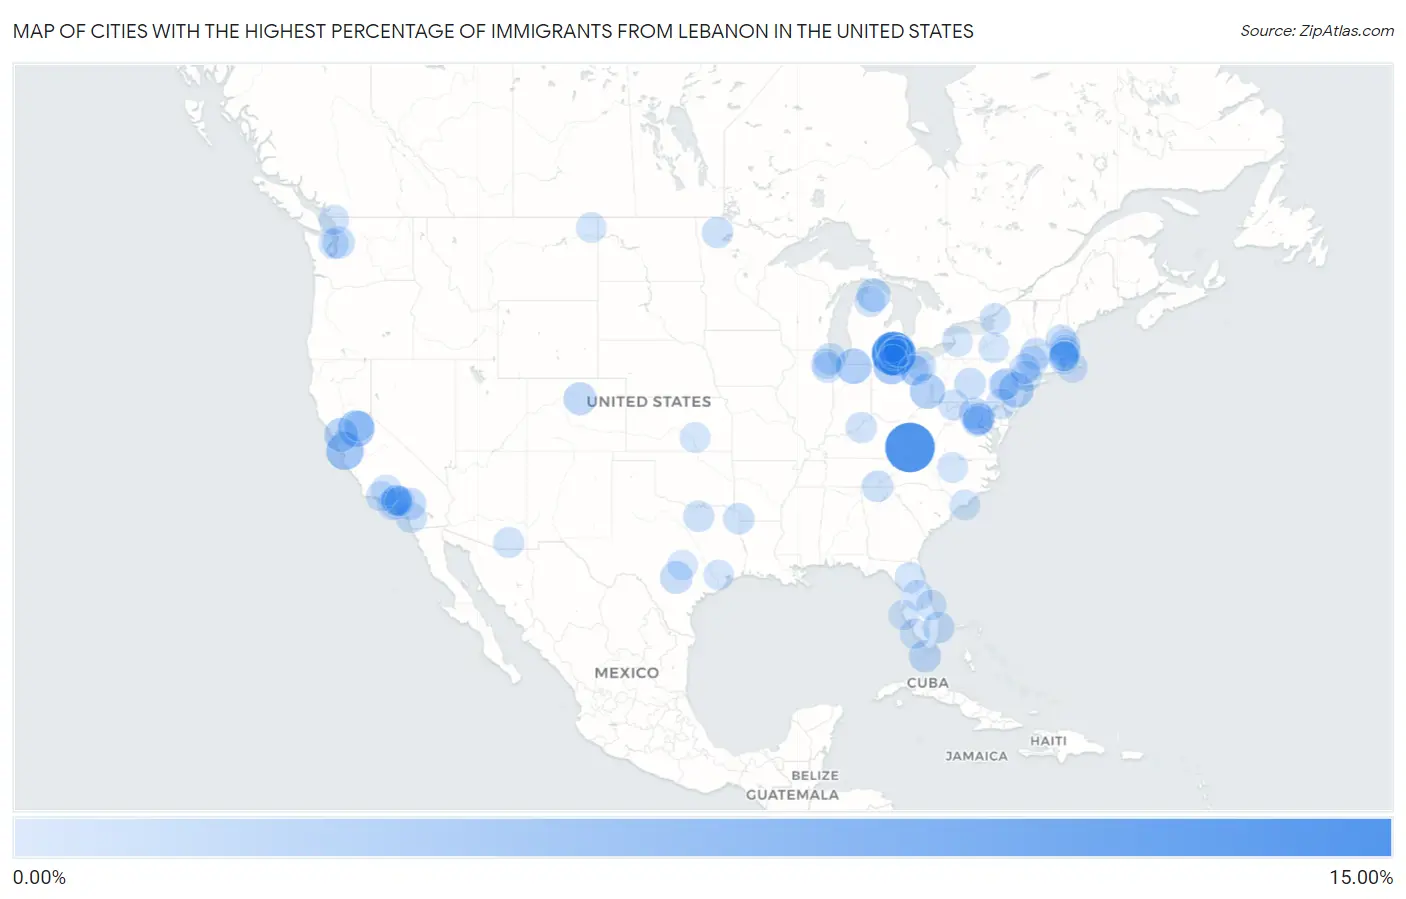
Map of Cities with the Highest Percentage of Immigrants from Lebanon in the United States
0.00%
15.00%
Cities with the Highest Percentage of Immigrants from Lebanon in the United States
| City | Lebanon | vs State | vs National | |
| 1. | Vansant | 13.97% | 0.063%(+13.9)#-1 | 0.040%(+13.9)#0 |
| 2. | Dearborn Heights | 10.31% | 0.25%(+10.1)#24 | 0.040%(+10.3)#1,287 |
| 3. | Dearborn | 9.61% | 0.25%(+9.36)#25 | 0.040%(+9.57)#1,288 |
| 4. | Day Valley | 5.54% | 0.081%(+5.45)#-1 | 0.040%(+5.49)#1,289 |
| 5. | Camanche Village | 5.04% | 0.081%(+4.96)#0 | 0.040%(+5.00)#1,290 |
| 6. | Curtice | 4.46% | 0.033%(+4.43)#-1 | 0.040%(+4.42)#1,291 |
| 7. | Osceola | 4.17% | 0.011%(+4.16)#4 | 0.040%(+4.13)#1,292 |
| 8. | Bloomingdale | 4.04% | 0.033%(+4.01)#0 | 0.040%(+4.00)#1,293 |
| 9. | East Rocky Hill | 3.89% | 0.047%(+3.85)#-1 | 0.040%(+3.85)#1,294 |
| 10. | Shell Ridge | 3.27% | 0.081%(+3.19)#1 | 0.040%(+3.23)#1,295 |
| 11. | Wolverine | 2.93% | 0.25%(+2.67)#26 | 0.040%(+2.89)#1,296 |
| 12. | Eldorado Springs | 2.46% | 0.013%(+2.45)#-1 | 0.040%(+2.42)#1,297 |
| 13. | Shavano Park | 2.20% | 0.032%(+2.17)#-1 | 0.040%(+2.16)#1,298 |
| 14. | Key Colony Beach | 2.00% | 0.039%(+1.96)#-1 | 0.040%(+1.96)#1,299 |
| 15. | Alderwood Manor | 1.94% | 0.026%(+1.91)#-1 | 0.040%(+1.90)#1,300 |
| 16. | Loma Linda | 1.93% | 0.081%(+1.85)#2 | 0.040%(+1.89)#1,301 |
| 17. | Mantua | 1.89% | 0.063%(+1.82)#1 | 0.040%(+1.85)#1,302 |
| 18. | Lansdowne | 1.85% | 0.063%(+1.79)#2 | 0.040%(+1.81)#1,303 |
| 19. | Towanda Borough | 1.78% | 0.020%(+1.76)#-1 | 0.040%(+1.74)#1,304 |
| 20. | Lee | 1.73% | 0.10%(+1.62)#-1 | 0.040%(+1.69)#1,305 |
| 21. | Pine Grove Mills | 1.59% | 0.020%(+1.57)#0 | 0.040%(+1.55)#1,306 |
| 22. | Golf | 1.57% | 0.039%(+1.53)#0 | 0.040%(+1.53)#1,307 |
| 23. | Baywood Park | 1.54% | 0.081%(+1.46)#3 | 0.040%(+1.50)#1,308 |
| 24. | Stamford | 1.50% | 0.0040%(+1.50)#-1 | 0.040%(+1.46)#1,309 |
| 25. | Copperhill | 1.50% | 0.015%(+1.48)#-1 | 0.040%(+1.46)#1,310 |
| 26. | Lincolnwood | 1.43% | 0.024%(+1.41)#5 | 0.040%(+1.39)#1,311 |
| 27. | Bayview Cdp Contra Costa County | 1.42% | 0.081%(+1.34)#4 | 0.040%(+1.38)#1,312 |
| 28. | Grygla | 1.39% | 0.014%(+1.38)#-1 | 0.040%(+1.35)#1,313 |
| 29. | Deer Lake Borough | 1.38% | 0.020%(+1.36)#1 | 0.040%(+1.34)#1,314 |
| 30. | Bell | 1.38% | 0.081%(+1.30)#5 | 0.040%(+1.34)#1,315 |
| 31. | Queen City | 1.38% | 0.032%(+1.35)#0 | 0.040%(+1.34)#1,316 |
| 32. | Fieldsboro Borough | 1.37% | 0.047%(+1.32)#0 | 0.040%(+1.33)#1,317 |
| 33. | Eastlawn Gardens | 1.33% | 0.020%(+1.31)#2 | 0.040%(+1.29)#1,318 |
| 34. | Woodland Park Borough | 1.32% | 0.047%(+1.28)#1 | 0.040%(+1.28)#1,319 |
| 35. | El Sobrante Cdp Riverside County | 1.32% | 0.081%(+1.24)#39 | 0.040%(+1.28)#1,320 |
| 36. | Aubrey | 1.31% | 0.032%(+1.28)#1 | 0.040%(+1.27)#1,321 |
| 37. | Hidden Meadows | 1.30% | 0.081%(+1.22)#40 | 0.040%(+1.26)#1,322 |
| 38. | Long Branch | 1.28% | 0.063%(+1.22)#16 | 0.040%(+1.24)#1,323 |
| 39. | Worthington Hills | 1.27% | 0.0060%(+1.27)#-1 | 0.040%(+1.23)#1,324 |
| 40. | Hamburg Borough | 1.27% | 0.020%(+1.25)#3 | 0.040%(+1.23)#1,325 |
| 41. | Village Of Grosse Pointe Shores | 1.26% | 0.25%(+1.01)#27 | 0.040%(+1.22)#1,326 |
| 42. | Glendale | 1.26% | 0.081%(+1.18)#137 | 0.040%(+1.22)#1,327 |
| 43. | Lakes Of The North | 1.26% | 0.25%(+1.01)#28 | 0.040%(+1.22)#1,328 |
| 44. | Foxborough | 1.25% | 0.10%(+1.15)#0 | 0.040%(+1.21)#1,329 |
| 45. | Whetstone | 1.25% | 0.026%(+1.22)#-1 | 0.040%(+1.21)#1,330 |
| 46. | Sharon | 1.24% | 0.035%(+1.21)#-1 | 0.040%(+1.20)#1,331 |
| 47. | Methuen Town | 1.23% | 0.10%(+1.13)#1 | 0.040%(+1.19)#1,332 |
| 48. | Lonaconing | 1.21% | 0.024%(+1.19)#-1 | 0.040%(+1.17)#1,333 |
| 49. | Upper Nyack | 1.17% | 0.040%(+1.13)#158 | 0.040%(+1.13)#1,334 |
| 50. | Chaumont | 1.17% | 0.040%(+1.13)#159 | 0.040%(+1.13)#1,335 |
| 51. | Harper Woods | 1.16% | 0.25%(+0.902)#29 | 0.040%(+1.12)#1,336 |
| 52. | Clearbrook | 1.15% | 0.047%(+1.11)#11 | 0.040%(+1.11)#1,337 |
| 53. | North Caldwell Borough | 1.12% | 0.047%(+1.07)#81 | 0.040%(+1.08)#1,338 |
| 54. | Lake Ridge | 1.11% | 0.063%(+1.04)#40 | 0.040%(+1.07)#1,407 |
| 55. | South Hooksett | 1.08% | 0.047%(+1.04)#-1 | 0.040%(+1.04)#1,408 |
| 56. | Balmville | 1.08% | 0.040%(+1.04)#160 | 0.040%(+1.04)#1,409 |
| 57. | Chestnut Hill | 1.08% | 0.020%(+1.06)#4 | 0.040%(+1.04)#1,410 |
| 58. | Burlington | 1.08% | 0.10%(+0.976)#29 | 0.040%(+1.04)#1,411 |
| 59. | Milltown Borough | 1.07% | 0.047%(+1.02)#82 | 0.040%(+1.03)#1,412 |
| 60. | Brookside | 1.07% | 0.026%(+1.04)#-1 | 0.040%(+1.03)#1,413 |
| 61. | Marina Del Rey | 1.04% | 0.081%(+0.961)#138 | 0.040%(+1.00)#1,414 |
| 62. | Altadena | 1.03% | 0.081%(+0.945)#180 | 0.040%(+0.985)#1,415 |
| 63. | Hawthorne | 1.01% | 0.039%(+0.971)#1 | 0.040%(+0.970)#1,416 |
| 64. | Williamsville | 0.98% | 0.040%(+0.939)#161 | 0.040%(+0.939)#1,417 |
| 65. | Seven Hills | 0.98% | 0.033%(+0.943)#1 | 0.040%(+0.936)#1,418 |
| 66. | Medicine Lake | 0.97% | 0.0056%(+0.965)#-1 | 0.040%(+0.931)#1,419 |
| 67. | Farmington Hills | 0.97% | 0.25%(+0.713)#30 | 0.040%(+0.928)#1,420 |
| 68. | Spring Lake Heights Borough | 0.97% | 0.047%(+0.920)#83 | 0.040%(+0.926)#1,421 |
| 69. | Varnamtown | 0.96% | 0.023%(+0.941)#-1 | 0.040%(+0.924)#1,422 |
| 70. | Taylor | 0.96% | 0.25%(+0.706)#31 | 0.040%(+0.921)#1,423 |
| 71. | Hillsborough | 0.95% | 0.023%(+0.931)#0 | 0.040%(+0.914)#1,424 |
| 72. | Windermere | 0.95% | 0.039%(+0.914)#2 | 0.040%(+0.913)#1,425 |
| 73. | Orland Hills | 0.95% | 0.024%(+0.926)#6 | 0.040%(+0.910)#1,426 |
| 74. | Grosse Pointe Farms | 0.95% | 0.25%(+0.693)#32 | 0.040%(+0.908)#1,427 |
| 75. | West Falmouth | 0.95% | 0.10%(+0.847)#30 | 0.040%(+0.908)#1,428 |
| 76. | Bel Aire | 0.95% | 0.027%(+0.920)#-1 | 0.040%(+0.907)#1,429 |
| 77. | Cortland West | 0.94% | 0.040%(+0.902)#162 | 0.040%(+0.902)#1,430 |
| 78. | Amador City | 0.93% | 0.081%(+0.850)#181 | 0.040%(+0.890)#1,431 |
| 79. | Lely | 0.93% | 0.039%(+0.891)#3 | 0.040%(+0.890)#1,432 |
| 80. | Frazier Park | 0.92% | 0.081%(+0.839)#182 | 0.040%(+0.879)#1,433 |
| 81. | Ridge Wood Heights | 0.91% | 0.039%(+0.876)#4 | 0.040%(+0.874)#1,434 |
| 82. | Orchard Lake Village | 0.90% | 0.25%(+0.642)#33 | 0.040%(+0.856)#1,435 |
| 83. | Poulsbo | 0.89% | 0.026%(+0.862)#0 | 0.040%(+0.848)#1,436 |
| 84. | Kirtland Hills | 0.88% | 0.033%(+0.852)#2 | 0.040%(+0.845)#1,437 |
| 85. | Westmont | 0.88% | 0.024%(+0.853)#19 | 0.040%(+0.837)#1,438 |
| 86. | La Crescenta Montrose | 0.86% | 0.081%(+0.780)#183 | 0.040%(+0.821)#1,439 |
| 87. | Watertown Town | 0.85% | 0.10%(+0.752)#31 | 0.040%(+0.813)#1,440 |
| 88. | Norwood | 0.85% | 0.10%(+0.751)#32 | 0.040%(+0.812)#1,441 |
| 89. | Grant Valkaria | 0.84% | 0.039%(+0.802)#5 | 0.040%(+0.801)#1,442 |
| 90. | Piney Point Village | 0.83% | 0.032%(+0.803)#5 | 0.040%(+0.795)#1,443 |
| 91. | Ferndale | 0.83% | 0.026%(+0.806)#1 | 0.040%(+0.793)#1,444 |
| 92. | Fullerton | 0.83% | 0.020%(+0.811)#5 | 0.040%(+0.791)#1,445 |
| 93. | Melvindale | 0.83% | 0.25%(+0.576)#34 | 0.040%(+0.791)#1,446 |
| 94. | Ojai | 0.83% | 0.081%(+0.747)#184 | 0.040%(+0.788)#1,447 |
| 95. | Rocky River | 0.82% | 0.033%(+0.788)#18 | 0.040%(+0.781)#1,448 |
| 96. | Walpole | 0.82% | 0.10%(+0.715)#33 | 0.040%(+0.776)#1,449 |
| 97. | Stockton University | 0.78% | 0.047%(+0.730)#84 | 0.040%(+0.736)#1,450 |
| 98. | Woodland Beach | 0.77% | 0.25%(+0.515)#35 | 0.040%(+0.730)#1,451 |
| 99. | Duarte | 0.76% | 0.081%(+0.676)#185 | 0.040%(+0.716)#1,452 |
| 100. | Briarcliff | 0.75% | 0.032%(+0.716)#6 | 0.040%(+0.708)#1,453 |
Common Questions
What are the Top 10 Cities with the Highest Percentage of Immigrants from Lebanon in the United States?
Top 10 Cities with the Highest Percentage of Immigrants from Lebanon in the United States are:
#1
13.97%
#2
10.31%
#3
9.61%
#4
5.54%
#5
5.04%
#6
4.46%
#7
4.17%
#8
4.04%
#9
3.89%
#10
3.27%
What city has the Highest Percentage of Immigrants from Lebanon in the United States?
Vansant has the Highest Percentage of Immigrants from Lebanon in the United States with 13.97%.
What is the Percentage of Immigrants from Lebanon in the United States?
Percentage of Immigrants from Lebanon in the United States is 0.040%.