Cities with the Highest Percentage of Guyanese Population in the United States
RELATED REPORTS & OPTIONS
Guyanese
United States
Compare Cities
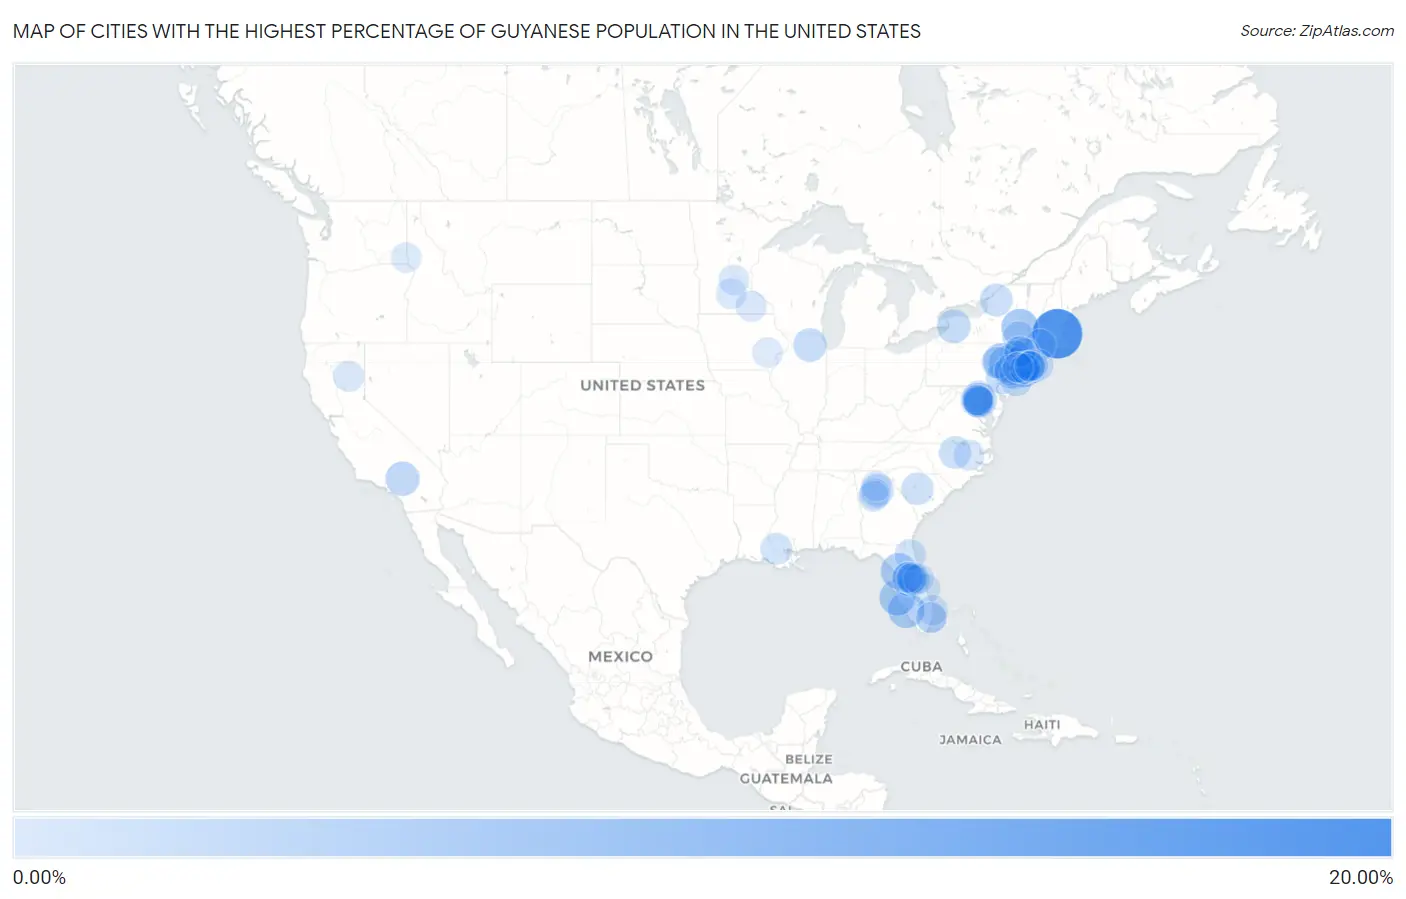
Map of Cities with the Highest Percentage of Guyanese Population in the United States
0.00%
20.00%
Cities with the Highest Percentage of Guyanese Population in the United States
| City | Guyanese | vs State | vs National | |
| 1. | Hanscom Afb | 16.37% | 0.030%(+16.3)#1 | 0.078%(+16.3)#1 |
| 2. | Schenectady | 6.54% | 0.76%(+5.79)#1 | 0.078%(+6.47)#2 |
| 3. | Bellerose Terrace | 6.51% | 0.76%(+5.75)#2 | 0.078%(+6.43)#3 |
| 4. | Lakeview | 6.33% | 0.76%(+5.57)#3 | 0.078%(+6.25)#4 |
| 5. | Hewlett Bay Park | 5.95% | 0.76%(+5.19)#4 | 0.078%(+5.87)#5 |
| 6. | Villas | 5.75% | 0.12%(+5.63)#1 | 0.078%(+5.68)#6 |
| 7. | North Sarasota | 5.75% | 0.12%(+5.63)#2 | 0.078%(+5.67)#7 |
| 8. | Penn Estates | 5.67% | 0.028%(+5.64)#1 | 0.078%(+5.59)#8 |
| 9. | Citrus Springs | 5.63% | 0.12%(+5.51)#3 | 0.078%(+5.56)#9 |
| 10. | Panther Valley | 5.37% | 0.27%(+5.10)#1 | 0.078%(+5.29)#10 |
| 11. | East Orange | 5.24% | 0.27%(+4.97)#2 | 0.078%(+5.16)#11 |
| 12. | Elmont | 5.02% | 0.76%(+4.27)#5 | 0.078%(+4.94)#12 |
| 13. | Clermont | 4.47% | 0.12%(+4.34)#4 | 0.078%(+4.39)#13 |
| 14. | South Valley Stream | 4.27% | 0.76%(+3.52)#6 | 0.078%(+4.20)#14 |
| 15. | Mountain View Acres | 4.17% | 0.0100%(+4.16)#1 | 0.078%(+4.09)#15 |
| 16. | Fairwood | 4.13% | 0.14%(+3.99)#1 | 0.078%(+4.05)#16 |
| 17. | Riverdale Park | 4.04% | 0.14%(+3.90)#2 | 0.078%(+3.96)#17 |
| 18. | Searingtown | 3.74% | 0.76%(+2.99)#7 | 0.078%(+3.67)#18 |
| 19. | Town Line | 3.69% | 0.76%(+2.93)#8 | 0.078%(+3.61)#19 |
| 20. | Cortland | 3.55% | 0.011%(+3.54)#1 | 0.078%(+3.47)#20 |
| 21. | Witches Woods | 3.53% | 0.12%(+3.40)#1 | 0.078%(+3.45)#21 |
| 22. | Horsham | 3.30% | 0.028%(+3.27)#2 | 0.078%(+3.22)#22 |
| 23. | North Valley Stream | 3.27% | 0.76%(+2.51)#9 | 0.078%(+3.19)#23 |
| 24. | Sparrow Bush | 3.22% | 0.76%(+2.47)#10 | 0.078%(+3.15)#24 |
| 25. | Ampere North | 3.14% | 0.27%(+2.87)#3 | 0.078%(+3.06)#25 |
| 26. | Scotts Corners | 3.06% | 0.76%(+2.31)#11 | 0.078%(+2.99)#26 |
| 27. | Antwerp | 2.96% | 0.76%(+2.20)#12 | 0.078%(+2.88)#27 |
| 28. | Loganville | 2.90% | 0.11%(+2.80)#1 | 0.078%(+2.83)#28 |
| 29. | Cairo | 2.81% | 0.76%(+2.05)#13 | 0.078%(+2.73)#29 |
| 30. | Glen Head | 2.79% | 0.76%(+2.03)#14 | 0.078%(+2.71)#30 |
| 31. | Fort Montgomery | 2.73% | 0.76%(+1.97)#15 | 0.078%(+2.65)#31 |
| 32. | Springdale | 2.73% | 0.010%(+2.72)#1 | 0.078%(+2.65)#32 |
| 33. | Valley Stream | 2.72% | 0.76%(+1.96)#16 | 0.078%(+2.64)#33 |
| 34. | Youngsville | 2.68% | 0.023%(+2.66)#1 | 0.078%(+2.61)#34 |
| 35. | Stewart Manor | 2.63% | 0.76%(+1.87)#17 | 0.078%(+2.55)#35 |
| 36. | Leisure Village | 2.63% | 0.27%(+2.36)#4 | 0.078%(+2.55)#36 |
| 37. | Remsenburg Speonk | 2.60% | 0.76%(+1.84)#18 | 0.078%(+2.52)#37 |
| 38. | Elmsford | 2.50% | 0.76%(+1.75)#19 | 0.078%(+2.43)#38 |
| 39. | Wyandanch | 2.50% | 0.76%(+1.74)#20 | 0.078%(+2.42)#39 |
| 40. | Griggstown | 2.45% | 0.27%(+2.18)#5 | 0.078%(+2.37)#40 |
| 41. | Islandia | 2.44% | 0.76%(+1.68)#21 | 0.078%(+2.36)#41 |
| 42. | Broad Brook | 2.40% | 0.12%(+2.27)#2 | 0.078%(+2.32)#42 |
| 43. | Fire Island | 2.35% | 0.76%(+1.59)#22 | 0.078%(+2.27)#43 |
| 44. | Merritt Park | 2.34% | 0.76%(+1.58)#23 | 0.078%(+2.26)#44 |
| 45. | Village St George | 2.30% | 0.0090%(+2.29)#1 | 0.078%(+2.22)#45 |
| 46. | Orlovista | 2.30% | 0.12%(+2.17)#5 | 0.078%(+2.22)#46 |
| 47. | Salisbury | 2.25% | 0.76%(+1.49)#24 | 0.078%(+2.17)#47 |
| 48. | Walton Park | 2.25% | 0.76%(+1.49)#25 | 0.078%(+2.17)#48 |
| 49. | Indian Mountain Lake | 2.24% | 0.028%(+2.22)#3 | 0.078%(+2.17)#49 |
| 50. | Freemansburg Borough | 2.24% | 0.028%(+2.21)#4 | 0.078%(+2.16)#50 |
| 51. | Ball Pond | 2.17% | 0.12%(+2.05)#3 | 0.078%(+2.09)#51 |
| 52. | Green Cove Springs | 2.15% | 0.12%(+2.03)#6 | 0.078%(+2.07)#52 |
| 53. | Finderne | 2.02% | 0.27%(+1.76)#6 | 0.078%(+1.95)#53 |
| 54. | Woodmere | 2.01% | 0.76%(+1.25)#26 | 0.078%(+1.93)#54 |
| 55. | Fairview Cdp Dutchess County | 1.95% | 0.76%(+1.20)#27 | 0.078%(+1.88)#55 |
| 56. | Neptune City Borough | 1.93% | 0.27%(+1.66)#7 | 0.078%(+1.85)#56 |
| 57. | Putnam Lake | 1.88% | 0.76%(+1.12)#28 | 0.078%(+1.80)#57 |
| 58. | Savage | 1.85% | 0.14%(+1.71)#3 | 0.078%(+1.77)#58 |
| 59. | Melwood | 1.83% | 0.14%(+1.70)#4 | 0.078%(+1.75)#59 |
| 60. | Brownville | 1.83% | 0.27%(+1.56)#8 | 0.078%(+1.75)#60 |
| 61. | Stonecrest | 1.78% | 0.11%(+1.67)#2 | 0.078%(+1.70)#61 |
| 62. | Sky Lake | 1.78% | 0.12%(+1.66)#7 | 0.078%(+1.70)#62 |
| 63. | Capitol Heights | 1.76% | 0.14%(+1.62)#5 | 0.078%(+1.68)#63 |
| 64. | Minneola | 1.74% | 0.12%(+1.62)#8 | 0.078%(+1.66)#64 |
| 65. | Roosevelt Gardens | 1.72% | 0.12%(+1.60)#9 | 0.078%(+1.64)#65 |
| 66. | Princeville | 1.72% | 0.023%(+1.69)#2 | 0.078%(+1.64)#66 |
| 67. | Lake Almanor Country Club | 1.70% | 0.0100%(+1.69)#2 | 0.078%(+1.62)#67 |
| 68. | South Bound Brook Borough | 1.69% | 0.27%(+1.43)#9 | 0.078%(+1.62)#68 |
| 69. | Pine Hills | 1.68% | 0.12%(+1.56)#10 | 0.078%(+1.61)#69 |
| 70. | El Centro Naval Air Facility | 1.67% | 0.0100%(+1.66)#3 | 0.078%(+1.59)#70 |
| 71. | Grant Valkaria | 1.66% | 0.12%(+1.54)#11 | 0.078%(+1.58)#71 |
| 72. | Wheatley Heights | 1.65% | 0.76%(+0.891)#29 | 0.078%(+1.57)#72 |
| 73. | Wappingers Falls | 1.65% | 0.76%(+0.888)#30 | 0.078%(+1.57)#73 |
| 74. | Ten Mile Creek | 1.64% | 0.14%(+1.51)#6 | 0.078%(+1.57)#74 |
| 75. | Hayfield | 1.62% | 0.047%(+1.58)#1 | 0.078%(+1.55)#75 |
| 76. | Coram | 1.60% | 0.76%(+0.846)#31 | 0.078%(+1.52)#76 |
| 77. | Gaylord | 1.59% | 0.047%(+1.54)#2 | 0.078%(+1.51)#77 |
| 78. | Marist College | 1.56% | 0.76%(+0.799)#32 | 0.078%(+1.48)#78 |
| 79. | Stockbridge | 1.54% | 0.11%(+1.43)#3 | 0.078%(+1.46)#79 |
| 80. | New Carrollton | 1.48% | 0.14%(+1.34)#7 | 0.078%(+1.40)#80 |
| 81. | New York | 1.45% | 0.76%(+0.688)#33 | 0.078%(+1.37)#81 |
| 82. | Groveland | 1.44% | 0.12%(+1.32)#12 | 0.078%(+1.37)#82 |
| 83. | East Riverdale | 1.44% | 0.14%(+1.31)#8 | 0.078%(+1.37)#83 |
| 84. | Christmas | 1.42% | 0.12%(+1.30)#13 | 0.078%(+1.35)#84 |
| 85. | Woodmore | 1.42% | 0.14%(+1.28)#9 | 0.078%(+1.34)#85 |
| 86. | Maple Lake | 1.42% | 0.047%(+1.37)#3 | 0.078%(+1.34)#86 |
| 87. | Atlantis | 1.41% | 0.12%(+1.29)#14 | 0.078%(+1.34)#87 |
| 88. | North Great River | 1.41% | 0.76%(+0.656)#34 | 0.078%(+1.33)#88 |
| 89. | Washington Park | 1.41% | 0.12%(+1.29)#15 | 0.078%(+1.33)#89 |
| 90. | Jersey City | 1.40% | 0.27%(+1.13)#10 | 0.078%(+1.32)#90 |
| 91. | Kalona | 1.37% | 0.0032%(+1.36)#1 | 0.078%(+1.29)#91 |
| 92. | East Lansdowne Borough | 1.33% | 0.028%(+1.30)#5 | 0.078%(+1.25)#92 |
| 93. | Moonachie Borough | 1.33% | 0.27%(+1.06)#11 | 0.078%(+1.25)#93 |
| 94. | Midland Park Borough | 1.32% | 0.27%(+1.06)#12 | 0.078%(+1.25)#94 |
| 95. | Baldwin | 1.32% | 0.76%(+0.560)#35 | 0.078%(+1.24)#95 |
| 96. | Buford | 1.31% | 0.11%(+1.20)#4 | 0.078%(+1.23)#96 |
| 97. | North Bay Shore | 1.29% | 0.76%(+0.531)#36 | 0.078%(+1.21)#97 |
| 98. | Ocoee | 1.28% | 0.12%(+1.16)#16 | 0.078%(+1.20)#98 |
| 99. | William Paterson University Of New Jersey | 1.27% | 0.27%(+0.999)#13 | 0.078%(+1.19)#99 |
| 100. | Asotin | 1.26% | 0.0096%(+1.25)#1 | 0.078%(+1.18)#100 |
Common Questions
What are the Top 10 Cities with the Highest Percentage of Guyanese Population in the United States?
Top 10 Cities with the Highest Percentage of Guyanese Population in the United States are:
#1
16.37%
#2
6.54%
#3
6.51%
#4
6.33%
#5
5.95%
#6
5.75%
#7
5.75%
#8
5.67%
#9
5.63%
#10
5.37%
What city has the Highest Percentage of Guyanese Population in the United States?
Hanscom AFB has the Highest Percentage of Guyanese Population in the United States with 16.37%.
What is the Percentage of Guyanese Population in the United States?
Percentage of Guyanese Population in the United States is 0.078%.