Cities with the Highest Male Poverty Level in the United States
RELATED REPORTS & OPTIONS
Highest Poverty | Male
United States
Compare Cities
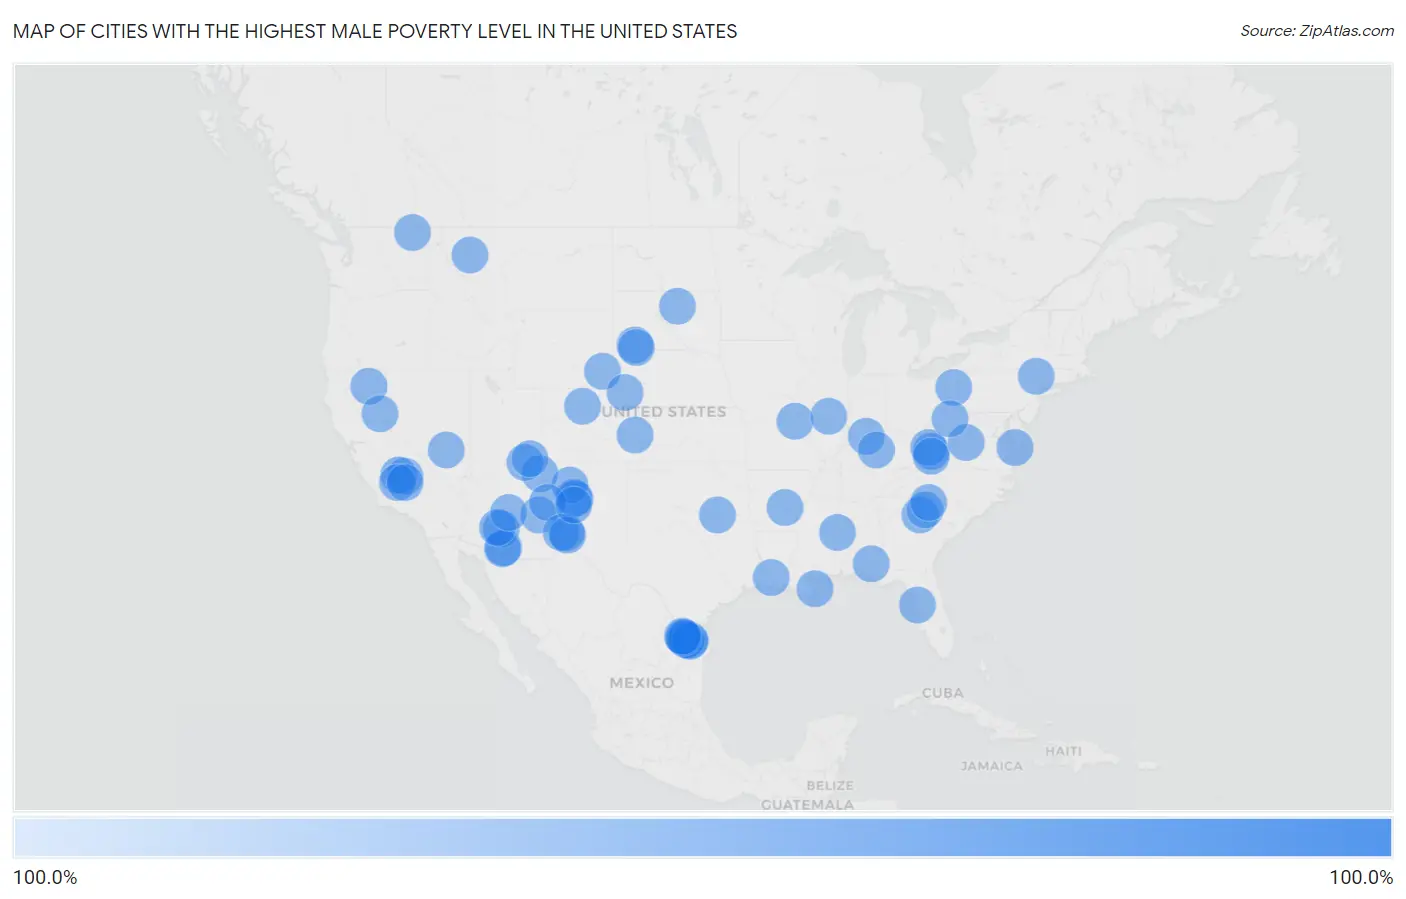
Map of Cities with the Highest Male Poverty Level in the United States
0.0%
100.0%
Cities with the Highest Male Poverty Level in the United States
| City | Male Poverty | vs State | vs National | |
| 1. | Clemson University | 100.0% | 13.0%(+87.0)#1 | 11.3%(+88.7)#1 |
| 2. | Fairfield University | 100.0% | 9.1%(+90.9)#1 | 11.3%(+88.7)#2 |
| 3. | Slippery Rock University | 100.0% | 10.6%(+89.4)#1 | 11.3%(+88.7)#3 |
| 4. | Siena College | 100.0% | 12.4%(+87.6)#1 | 11.3%(+88.7)#4 |
| 5. | Manderson White Horse Creek | 100.0% | 11.0%(+89.0)#1 | 11.3%(+88.7)#5 |
| 6. | Watchtower | 100.0% | 12.4%(+87.6)#2 | 11.3%(+88.7)#6 |
| 7. | Placitas Cdp Dona Ana County | 100.0% | 16.9%(+83.1)#1 | 11.3%(+88.7)#7 |
| 8. | Nutrioso | 100.0% | 12.1%(+87.9)#1 | 11.3%(+88.7)#8 |
| 9. | Wounded Knee | 100.0% | 11.0%(+89.0)#2 | 11.3%(+88.7)#9 |
| 10. | Homer C Jones | 100.0% | 16.9%(+83.1)#2 | 11.3%(+88.7)#10 |
| 11. | Pointe A La Hache | 100.0% | 16.8%(+83.2)#1 | 11.3%(+88.7)#11 |
| 12. | Hilltop Cdp Starr County | 100.0% | 12.6%(+87.4)#1 | 11.3%(+88.7)#12 |
| 13. | La Esperanza | 100.0% | 12.6%(+87.4)#2 | 11.3%(+88.7)#13 |
| 14. | Pajarito Mesa | 100.0% | 16.9%(+83.1)#3 | 11.3%(+88.7)#14 |
| 15. | Chical | 100.0% | 16.9%(+83.1)#4 | 11.3%(+88.7)#15 |
| 16. | Sherrill | 100.0% | 14.5%(+85.5)#1 | 11.3%(+88.7)#17 |
| 17. | North Escobares | 100.0% | 12.6%(+87.4)#3 | 11.3%(+88.7)#18 |
| 18. | Millville | 100.0% | 11.1%(+88.9)#1 | 11.3%(+88.7)#19 |
| 19. | Swift Bird | 100.0% | 11.0%(+89.0)#3 | 11.3%(+88.7)#20 |
| 20. | Alden | 100.0% | 10.6%(+89.4)#1 | 11.3%(+88.7)#21 |
| 21. | San Luis | 100.0% | 16.9%(+83.1)#5 | 11.3%(+88.7)#22 |
| 22. | Pence | 100.0% | 11.1%(+88.9)#2 | 11.3%(+88.7)#23 |
| 23. | Haivana Nakya | 100.0% | 12.1%(+87.9)#2 | 11.3%(+88.7)#24 |
| 24. | Lacassine | 100.0% | 16.8%(+83.2)#2 | 11.3%(+88.7)#25 |
| 25. | Sehili | 100.0% | 12.1%(+87.9)#3 | 11.3%(+88.7)#26 |
| 26. | Oak Hill-Piney | 100.0% | 13.9%(+86.1)#1 | 11.3%(+88.7)#27 |
| 27. | El Castillo | 100.0% | 12.6%(+87.4)#4 | 11.3%(+88.7)#28 |
| 28. | Darrow | 100.0% | 16.8%(+83.2)#3 | 11.3%(+88.7)#29 |
| 29. | Turtle Lake | 100.0% | 11.8%(+88.2)#1 | 11.3%(+88.7)#30 |
| 30. | Eunola | 100.0% | 13.9%(+86.1)#1 | 11.3%(+88.7)#31 |
| 31. | Linn Grove | 100.0% | 11.1%(+88.9)#3 | 11.3%(+88.7)#32 |
| 32. | Oasis | 100.0% | 16.9%(+83.1)#6 | 11.3%(+88.7)#33 |
| 33. | Gough | 100.0% | 12.2%(+87.8)#1 | 11.3%(+88.7)#35 |
| 34. | El Quiote | 100.0% | 12.6%(+87.4)#5 | 11.3%(+88.7)#36 |
| 35. | Fence Lake | 100.0% | 16.9%(+83.1)#7 | 11.3%(+88.7)#37 |
| 36. | Sweet Water Village | 100.0% | 12.1%(+87.9)#4 | 11.3%(+88.7)#38 |
| 37. | Bayport | 100.0% | 11.8%(+88.2)#1 | 11.3%(+88.7)#39 |
| 38. | Kingston | 100.0% | 16.9%(+83.1)#8 | 11.3%(+88.7)#40 |
| 39. | Argenta | 100.0% | 11.8%(+88.2)#2 | 11.3%(+88.7)#41 |
| 40. | Chiawuli Tak | 100.0% | 12.1%(+87.9)#5 | 11.3%(+88.7)#42 |
| 41. | Santa Cruz | 100.0% | 12.1%(+87.9)#6 | 11.3%(+88.7)#43 |
| 42. | Panola | 100.0% | 13.9%(+86.1)#2 | 11.3%(+88.7)#44 |
| 43. | Willington | 100.0% | 13.0%(+87.0)#2 | 11.3%(+88.7)#45 |
| 44. | Garfield | 100.0% | 16.9%(+83.1)#9 | 11.3%(+88.7)#46 |
| 45. | Penntown | 100.0% | 11.1%(+88.9)#4 | 11.3%(+88.7)#47 |
| 46. | Oljato Monument Valley | 100.0% | 12.1%(+87.9)#7 | 11.3%(+88.7)#48 |
| 47. | Camp Nelson | 100.0% | 11.1%(+88.9)#1 | 11.3%(+88.7)#49 |
| 48. | Lake View | 100.0% | 11.1%(+88.9)#5 | 11.3%(+88.7)#50 |
| 49. | Brentwood Colony | 100.0% | 11.0%(+89.0)#4 | 11.3%(+88.7)#51 |
| 50. | Brenton | 100.0% | 15.2%(+84.8)#1 | 11.3%(+88.7)#52 |
| 51. | El Rancho | 100.0% | 11.1%(+88.9)#2 | 11.3%(+88.7)#53 |
| 52. | Quesada | 100.0% | 12.6%(+87.4)#6 | 11.3%(+88.7)#54 |
| 53. | Amherstdale | 100.0% | 15.2%(+84.8)#2 | 11.3%(+88.7)#55 |
| 54. | Eagle Creek Colony | 100.0% | 11.8%(+88.2)#3 | 11.3%(+88.7)#56 |
| 55. | Everett | 100.0% | 12.2%(+87.8)#2 | 11.3%(+88.7)#57 |
| 56. | Slater | 100.0% | 9.4%(+90.6)#1 | 11.3%(+88.7)#58 |
| 57. | Mayfield Colony | 100.0% | 11.0%(+89.0)#5 | 11.3%(+88.7)#59 |
| 58. | Parshall | 100.0% | 8.8%(+91.2)#1 | 11.3%(+88.7)#60 |
| 59. | Rodriguez Camp | 100.0% | 11.1%(+88.9)#3 | 11.3%(+88.7)#61 |
| 60. | La Loma De Falcon | 100.0% | 12.6%(+87.4)#7 | 11.3%(+88.7)#62 |
| 61. | Ideal | 100.0% | 11.0%(+89.0)#6 | 11.3%(+88.7)#63 |
| 62. | Cucumber | 100.0% | 15.2%(+84.8)#3 | 11.3%(+88.7)#64 |
| 63. | Pleasant Valley Colony | 100.0% | 11.8%(+88.2)#4 | 11.3%(+88.7)#65 |
| 64. | Normandy | 100.0% | 12.6%(+87.4)#8 | 11.3%(+88.7)#66 |
| 65. | Middlebrook | 100.0% | 8.9%(+91.1)#1 | 11.3%(+88.7)#67 |
| 66. | Gypsy | 100.0% | 15.2%(+84.8)#4 | 11.3%(+88.7)#68 |
| 67. | Los Ebanos Cdp Hidalgo County | 100.0% | 12.6%(+87.4)#9 | 11.3%(+88.7)#69 |
| 68. | Nubieber | 100.0% | 11.1%(+88.9)#4 | 11.3%(+88.7)#70 |
| 69. | Pencil Bluff | 100.0% | 14.5%(+85.5)#2 | 11.3%(+88.7)#71 |
| 70. | Deep Creek | 100.0% | 8.9%(+91.1)#2 | 11.3%(+88.7)#72 |
| 71. | Fulton | 100.0% | 9.6%(+90.4)#1 | 11.3%(+88.7)#73 |
| 72. | Fredericksburg | 100.0% | 11.1%(+88.9)#6 | 11.3%(+88.7)#74 |
| 73. | Villa Sin Miedo | 100.0% | 40.1%(+59.9)#1 | 11.3%(+88.7)#75 |
| 74. | Ashley | 100.0% | 11.7%(+88.3)#1 | 11.3%(+88.7)#76 |
| 75. | Silverdale | 100.0% | 10.4%(+89.6)#1 | 11.3%(+88.7)#77 |
| 76. | New Hope | 100.0% | 14.5%(+85.5)#1 | 11.3%(+88.7)#78 |
| 77. | Boyds | 100.0% | 9.0%(+91.0)#1 | 11.3%(+88.7)#79 |
| 78. | Padroni | 100.0% | 8.8%(+91.2)#2 | 11.3%(+88.7)#80 |
| 79. | Coronaca | 100.0% | 13.0%(+87.0)#3 | 11.3%(+88.7)#81 |
| 80. | Midway Colony | 100.0% | 11.8%(+88.2)#5 | 11.3%(+88.7)#82 |
| 81. | Veguita | 100.0% | 16.9%(+83.1)#10 | 11.3%(+88.7)#83 |
| 82. | Burney | 100.0% | 11.1%(+88.9)#7 | 11.3%(+88.7)#84 |
| 83. | Acala | 100.0% | 12.6%(+87.4)#10 | 11.3%(+88.7)#85 |
| 84. | Westervelt | 100.0% | 10.6%(+89.4)#2 | 11.3%(+88.7)#86 |
| 85. | New Woodville | 100.0% | 13.9%(+86.1)#2 | 11.3%(+88.7)#87 |
| 86. | Sattley | 100.0% | 11.1%(+88.9)#5 | 11.3%(+88.7)#88 |
| 87. | Symonds | 100.0% | 17.2%(+82.8)#1 | 11.3%(+88.7)#89 |
| 88. | Brandon | 100.0% | 8.8%(+91.2)#3 | 11.3%(+88.7)#90 |
| 89. | Lawrenceport | 100.0% | 11.1%(+88.9)#8 | 11.3%(+88.7)#91 |
| 90. | Cross Anchor | 100.0% | 13.0%(+87.0)#4 | 11.3%(+88.7)#92 |
| 91. | Sage Creek Colony | 100.0% | 11.8%(+88.2)#6 | 11.3%(+88.7)#93 |
| 92. | Onaka | 100.0% | 11.0%(+89.0)#7 | 11.3%(+88.7)#94 |
| 93. | Mexican Hat | 100.0% | 7.7%(+92.3)#1 | 11.3%(+88.7)#95 |
| 94. | Dennis | 100.0% | 17.2%(+82.8)#2 | 11.3%(+88.7)#96 |
| 95. | Mcclenney Tract | 100.0% | 11.1%(+88.9)#6 | 11.3%(+88.7)#97 |
| 96. | Rachel | 100.0% | 11.5%(+88.5)#1 | 11.3%(+88.7)#98 |
| 97. | Clay | 100.0% | 12.6%(+87.4)#11 | 11.3%(+88.7)#99 |
| 98. | Rye | 100.0% | 12.1%(+87.9)#8 | 11.3%(+88.7)#100 |
| 99. | Beaver | 100.0% | 10.4%(+89.6)#2 | 11.3%(+88.7)#101 |
| 100. | Chapeno | 100.0% | 12.6%(+87.4)#12 | 11.3%(+88.7)#102 |
Common Questions
What are the Top 10 Cities with the Highest Male Poverty Level in the United States?
Top 10 Cities with the Highest Male Poverty Level in the United States are:
#1
100.0%
#2
100.0%
#3
100.0%
#4
100.0%
#5
100.0%
#6
100.0%
#7
100.0%
#8
100.0%
#9
100.0%
#10
100.0%
What city has the Highest Male Poverty Level in the United States?
Slippery Rock University has the Highest Male Poverty Level in the United States with 100.0%.
What is the Poverty Level Among Males in the United States?
Poverty Level Among Males in the United States is 11.3%.