Cities with the Highest Costs of Housing as Percentage of Income in the United States
RELATED REPORTS & OPTIONS
Highest Housing Costs / Income
United States
Compare Cities
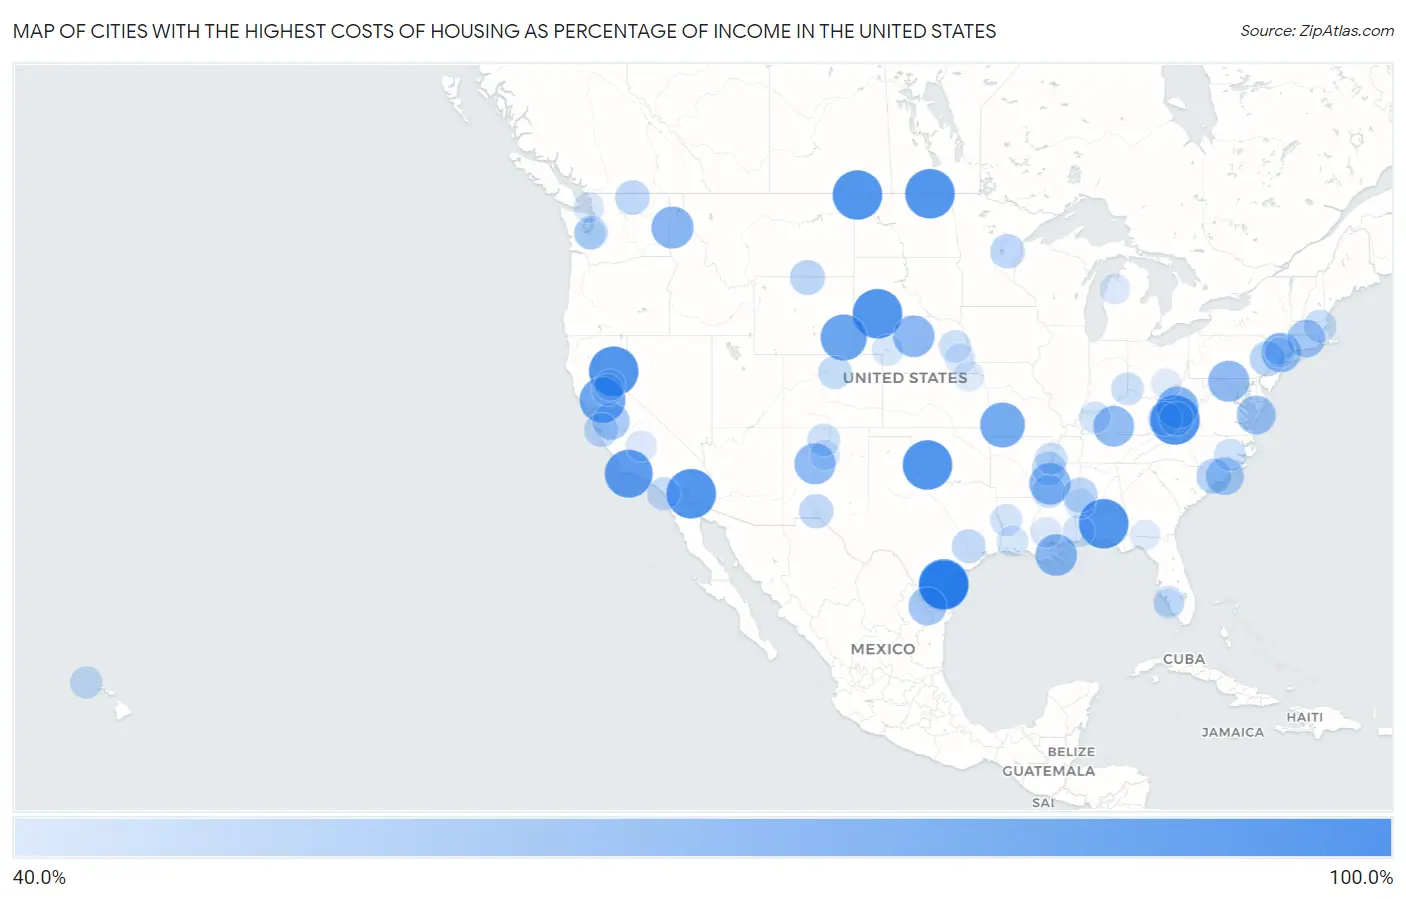
Map of Cities with the Highest Costs of Housing as Percentage of Income in the United States
0.0%
100.0%
Cities with the Highest Costs of Housing as Percentage of Income in the United States
| City | Housing Costs / Income | vs State | vs National | |
| 1. | Tierra Verde | 100.0% | 20.8%(+79.2)#1 | 20.4%(+79.6)#1 |
| 2. | Hannah | 100.0% | 15.2%(+84.8)#1 | 20.4%(+79.6)#2 |
| 3. | Niland | 100.0% | 25.4%(+74.6)#1 | 20.4%(+79.6)#3 |
| 4. | Groverton | 100.0% | 17.5%(+82.5)#1 | 20.4%(+79.6)#4 |
| 5. | La Paloma Lost Creek | 100.0% | 20.8%(+79.2)#2 | 20.4%(+79.6)#5 |
| 6. | Kimball | 100.0% | 15.3%(+84.7)#1 | 20.4%(+79.6)#6 |
| 7. | Nekoma | 100.0% | 19.6%(+80.4)#1 | 20.4%(+79.6)#7 |
| 8. | Fortuna | 100.0% | 15.2%(+84.8)#2 | 20.4%(+79.6)#8 |
| 9. | Tarsney Lakes | 100.0% | 18.1%(+81.9)#1 | 20.4%(+79.6)#9 |
| 10. | Crescent Mills | 100.0% | 25.4%(+74.6)#2 | 20.4%(+79.6)#10 |
| 11. | Cooperton | 100.0% | 18.1%(+81.9)#1 | 20.4%(+79.6)#11 |
| 12. | Wounded Knee | 100.0% | 16.4%(+83.6)#1 | 20.4%(+79.6)#12 |
| 13. | Moccasin | 100.0% | 18.2%(+81.8)#1 | 20.4%(+79.6)#13 |
| 14. | Sequatchie | 100.0% | 18.8%(+81.2)#1 | 20.4%(+79.6)#14 |
| 15. | Lake View | 100.0% | 17.5%(+82.5)#2 | 20.4%(+79.6)#15 |
| 16. | Gantt | 100.0% | 17.9%(+82.1)#1 | 20.4%(+79.6)#16 |
| 17. | Isla Vista | 95.3% | 25.4%(+69.9)#3 | 20.4%(+75.0)#17 |
| 18. | Slater | 90.6% | 17.0%(+73.6)#1 | 20.4%(+70.2)#18 |
| 19. | University Of California Davis | 89.2% | 25.4%(+63.8)#4 | 20.4%(+68.9)#19 |
| 20. | Halltown | 86.6% | 18.1%(+68.5)#2 | 20.4%(+66.2)#20 |
| 21. | Conkling Park | 79.1% | 18.7%(+60.4)#1 | 20.4%(+58.8)#21 |
| 22. | Kimberly | 78.5% | 15.3%(+63.2)#2 | 20.4%(+58.1)#22 |
| 23. | Pointe A La Hache | 77.8% | 19.5%(+58.3)#1 | 20.4%(+57.4)#23 |
| 24. | Brewster | 77.5% | 17.9%(+59.6)#1 | 20.4%(+57.1)#24 |
| 25. | Glendora | 77.4% | 18.5%(+58.8)#1 | 20.4%(+57.0)#25 |
| 26. | Breathedsville | 76.4% | 20.8%(+55.6)#1 | 20.4%(+56.0)#26 |
| 27. | Pajarito Mesa | 76.3% | 18.8%(+57.5)#1 | 20.4%(+56.0)#27 |
| 28. | Hiseville | 75.4% | 18.0%(+57.5)#1 | 20.4%(+55.1)#28 |
| 29. | Swift Bird | 72.1% | 16.4%(+55.7)#2 | 20.4%(+51.7)#29 |
| 30. | New Square | 72.1% | 23.0%(+49.1)#1 | 20.4%(+51.7)#30 |
| 31. | Southside Chesconessex | 70.1% | 20.2%(+50.0)#1 | 20.4%(+49.8)#31 |
| 32. | Los Alvarez | 68.1% | 20.8%(+47.3)#3 | 20.4%(+47.7)#32 |
| 33. | Double Horn | 67.3% | 20.8%(+46.5)#4 | 20.4%(+46.9)#33 |
| 34. | Storrs | 67.2% | 21.8%(+45.4)#1 | 20.4%(+46.8)#34 |
| 35. | Hightsville | 66.9% | 19.6%(+47.3)#1 | 20.4%(+46.5)#35 |
| 36. | Rochester Institute Of Technology | 65.7% | 23.0%(+42.8)#2 | 20.4%(+45.3)#36 |
| 37. | Camp Pendleton Mainside | 65.6% | 25.4%(+40.2)#5 | 20.4%(+45.3)#37 |
| 38. | Florida Gulf Coast University | 65.1% | 23.2%(+41.8)#1 | 20.4%(+44.7)#38 |
| 39. | Crows Landing | 64.4% | 25.4%(+39.0)#6 | 20.4%(+44.0)#39 |
| 40. | Gough | 64.4% | 20.4%(+44.0)#1 | 20.4%(+44.0)#40 |
| 41. | Kaneohe Base | 63.0% | 23.8%(+39.2)#1 | 20.4%(+42.6)#41 |
| 42. | Somerset | 61.6% | 22.3%(+39.3)#1 | 20.4%(+41.2)#42 |
| 43. | Port Colden | 59.9% | 22.5%(+37.5)#1 | 20.4%(+39.6)#43 |
| 44. | Chowan Beach | 59.9% | 19.6%(+40.3)#2 | 20.4%(+39.5)#44 |
| 45. | Pinebrook | 59.7% | 20.8%(+39.0)#5 | 20.4%(+39.4)#45 |
| 46. | Fallsburg | 59.7% | 23.0%(+36.7)#3 | 20.4%(+39.3)#46 |
| 47. | Parkman | 59.6% | 17.0%(+42.6)#2 | 20.4%(+39.2)#47 |
| 48. | Brunswick | 59.6% | 19.6%(+40.0)#3 | 20.4%(+39.2)#48 |
| 49. | Mcmullen | 59.1% | 17.9%(+41.2)#2 | 20.4%(+38.8)#49 |
| 50. | Loomis | 58.4% | 22.0%(+36.5)#1 | 20.4%(+38.1)#50 |
| 51. | Mcgrath | 58.3% | 18.4%(+39.9)#1 | 20.4%(+37.9)#51 |
| 52. | Jackson | 58.1% | 18.2%(+40.0)#2 | 20.4%(+37.8)#52 |
| 53. | Mesquite | 57.5% | 18.8%(+38.6)#2 | 20.4%(+37.1)#53 |
| 54. | La Grange | 57.2% | 25.4%(+31.8)#7 | 20.4%(+36.9)#54 |
| 55. | Phelps | 57.2% | 18.0%(+39.2)#2 | 20.4%(+36.8)#55 |
| 56. | Pajaro Dunes | 57.1% | 25.4%(+31.7)#8 | 20.4%(+36.7)#56 |
| 57. | Bud | 56.8% | 15.3%(+41.4)#3 | 20.4%(+36.4)#57 |
| 58. | White Oak | 56.6% | 18.5%(+38.1)#2 | 20.4%(+36.2)#58 |
| 59. | Prairie View | 56.5% | 20.8%(+35.7)#6 | 20.4%(+36.1)#59 |
| 60. | Mcchord Afb | 55.4% | 22.0%(+33.4)#2 | 20.4%(+35.0)#60 |
| 61. | Sunshine | 55.3% | 22.3%(+33.1)#2 | 20.4%(+35.0)#61 |
| 62. | Morgan City | 55.1% | 18.5%(+36.6)#3 | 20.4%(+34.7)#62 |
| 63. | Camp Pendleton South | 54.5% | 25.4%(+29.0)#9 | 20.4%(+34.1)#63 |
| 64. | Innovation | 54.3% | 20.2%(+34.1)#2 | 20.4%(+33.9)#64 |
| 65. | Hanscom Afb | 53.9% | 22.5%(+31.4)#1 | 20.4%(+33.6)#65 |
| 66. | Millersburg | 53.6% | 19.6%(+34.0)#2 | 20.4%(+33.2)#66 |
| 67. | El Rito | 53.2% | 18.8%(+34.3)#3 | 20.4%(+32.8)#67 |
| 68. | Elizabethtown | 52.9% | 17.9%(+35.0)#1 | 20.4%(+32.6)#68 |
| 69. | Schofield Barracks | 52.8% | 23.8%(+29.0)#2 | 20.4%(+32.5)#69 |
| 70. | Linwood | 52.6% | 17.9%(+34.7)#2 | 20.4%(+32.2)#70 |
| 71. | Sunset | 52.3% | 17.7%(+34.6)#1 | 20.4%(+31.9)#71 |
| 72. | Maury | 52.1% | 19.6%(+32.5)#4 | 20.4%(+31.8)#72 |
| 73. | Gulfcrest | 51.3% | 17.9%(+33.4)#3 | 20.4%(+30.9)#73 |
| 74. | Beale Afb | 51.0% | 25.4%(+25.6)#10 | 20.4%(+30.7)#74 |
| 75. | Robeline | 51.0% | 19.5%(+31.5)#2 | 20.4%(+30.6)#75 |
| 76. | Utica | 50.9% | 18.0%(+32.9)#3 | 20.4%(+30.5)#76 |
| 77. | Daviston | 50.9% | 18.8%(+32.1)#1 | 20.4%(+30.5)#77 |
| 78. | Fort Lewis | 50.4% | 22.0%(+28.4)#3 | 20.4%(+30.0)#78 |
| 79. | Kiryas Joel | 49.9% | 23.0%(+26.9)#4 | 20.4%(+29.5)#79 |
| 80. | Dobbins | 49.8% | 25.4%(+24.3)#11 | 20.4%(+29.4)#80 |
| 81. | Martin | 49.7% | 17.9%(+31.8)#3 | 20.4%(+29.3)#81 |
| 82. | Fenton | 49.5% | 19.5%(+30.0)#3 | 20.4%(+29.2)#82 |
| 83. | Palmona Park | 49.0% | 23.2%(+25.8)#2 | 20.4%(+28.6)#83 |
| 84. | Terra Bella | 49.0% | 25.4%(+23.5)#12 | 20.4%(+28.6)#84 |
| 85. | Eldred | 48.8% | 23.0%(+25.8)#5 | 20.4%(+28.4)#85 |
| 86. | Whidbey Island Station | 48.2% | 22.0%(+26.2)#4 | 20.4%(+27.8)#86 |
| 87. | Tangipahoa | 48.0% | 19.5%(+28.5)#4 | 20.4%(+27.6)#87 |
| 88. | Moneta | 48.0% | 20.2%(+27.8)#3 | 20.4%(+27.6)#88 |
| 89. | Walton | 48.0% | 17.9%(+30.1)#4 | 20.4%(+27.6)#89 |
| 90. | Livingston | 47.9% | 17.9%(+30.0)#4 | 20.4%(+27.5)#90 |
| 91. | Los Cerrillos | 47.5% | 18.8%(+28.7)#4 | 20.4%(+27.1)#91 |
| 92. | Valencia Borough | 47.5% | 18.6%(+28.8)#1 | 20.4%(+27.1)#92 |
| 93. | Hurlburt Field | 47.3% | 23.2%(+24.1)#3 | 20.4%(+26.9)#93 |
| 94. | Mesick | 47.3% | 18.2%(+29.0)#1 | 20.4%(+26.9)#94 |
| 95. | Harlem Heights | 47.2% | 23.2%(+23.9)#4 | 20.4%(+26.8)#95 |
| 96. | Monsey | 47.1% | 23.0%(+24.1)#6 | 20.4%(+26.7)#96 |
| 97. | Millfield | 47.0% | 17.9%(+29.1)#2 | 20.4%(+26.7)#97 |
| 98. | Quitman | 46.9% | 20.4%(+26.4)#2 | 20.4%(+26.5)#98 |
| 99. | Oneida | 46.9% | 17.8%(+29.0)#1 | 20.4%(+26.5)#99 |
| 100. | Moseleyville | 46.8% | 18.0%(+28.9)#4 | 20.4%(+26.5)#100 |
Common Questions
What are the Top 10 Cities with the Highest Costs of Housing as Percentage of Income in the United States?
Top 10 Cities with the Highest Costs of Housing as Percentage of Income in the United States are:
#1
100.0%
#2
100.0%
#3
100.0%
#4
100.0%
#5
100.0%
#6
100.0%
#7
100.0%
#8
100.0%
#9
100.0%
#10
100.0%
What city has the Highest Costs of Housing as Percentage of Income in the United States?
Tierra Verde has the Highest Costs of Housing as Percentage of Income in the United States with 100.0%.
What is the Average Housing Costs as Percentage of Income in the United States?
Average Housing Costs as Percentage of Income in the United States is 20.4%.