California Map & Demographics
California Map
California Overview
Sep 9, 1850
INCORPORATED
163,694
TOTAL AREA [ SQ MI ]
155,766
LAND AREA [ SQ MI ]
7,928
WATER AREA [ SQ MI ]
2,900
ELEVATION AVG [ FT ]
14,494
ELEVATION HIGH [ FT ]
Sea Level
ELEVATION LOW [ FT ]
252.7
POP DENSITY [ PPL / SQ MI ]
$45,591
PER CAPITA INCOME
$105,010
AVG FAMILY INCOME
$91,905
AVG HOUSEHOLD INCOME
25.7%
WAGE / INCOME GAP [ % ]
74.3¢/ $1
WAGE / INCOME GAP [ $ ]
$11,258
FAMILY INCOME DEFICIT
0.49
INEQUALITY / GINI INDEX
90011
LARGEST ZIP CODE
Los Angeles
LARGEST CITY
Los Angeles County
LARGEST COUNTY
39,356,104
TOTAL POPULATION
19,708,947
MALE POPULATION
19,647,157
FEMALE POPULATION
100.31
MALES / 100 FEMALES
99.69
FEMALES / 100 MALES
37.3
MEDIAN AGE
3.5
AVG FAMILY SIZE
2.9
AVG HOUSEHOLD SIZE
20,161,988
LABOR FORCE [ PEOPLE ]
63.8%
PERCENT IN LABOR FORCE
6.4%
UNEMPLOYMENT RATE
California Area Codes
Income in California
Income Overview in California
Per Capita Income in California is $45,591, while median incomes of families and households are $105,010 and $91,905 respectively.
| Characteristic | Number | Measure |
| Per Capita Income | 39,356,104 | $45,591 |
| Median Family Income | 9,093,707 | $105,010 |
| Mean Family Income | 9,093,707 | $145,957 |
| Median Household Income | 13,315,822 | $91,905 |
| Mean Household Income | 13,315,822 | $130,718 |
| Income Deficit | 9,093,707 | $11,258 |
| Wage / Income Gap (%) | 39,356,104 | 25.67% |
| Wage / Income Gap ($) | 39,356,104 | 74.33¢ per $1 |
| Gini / Inequality Index | 39,356,104 | 0.49 |
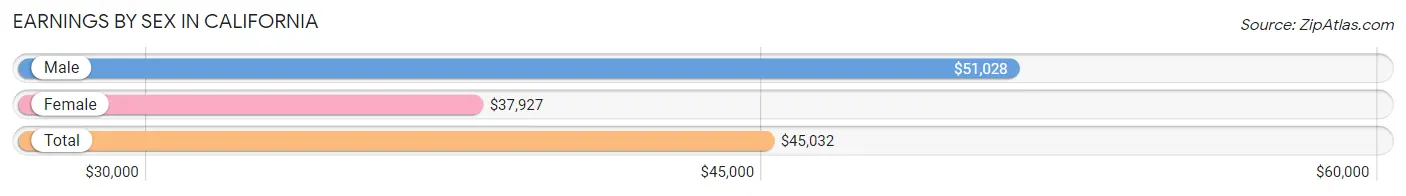
Earnings by Sex in California
Average Earnings in California are $45,032, $51,028 for men and $37,927 for women, a difference of 25.7%.
| Sex | Number | Average Earnings |
| Male | 11,187,654 (54.2%) | $51,028 |
| Female | 9,462,232 (45.8%) | $37,927 |
| Total | 20,649,886 (100.0%) | $45,032 |
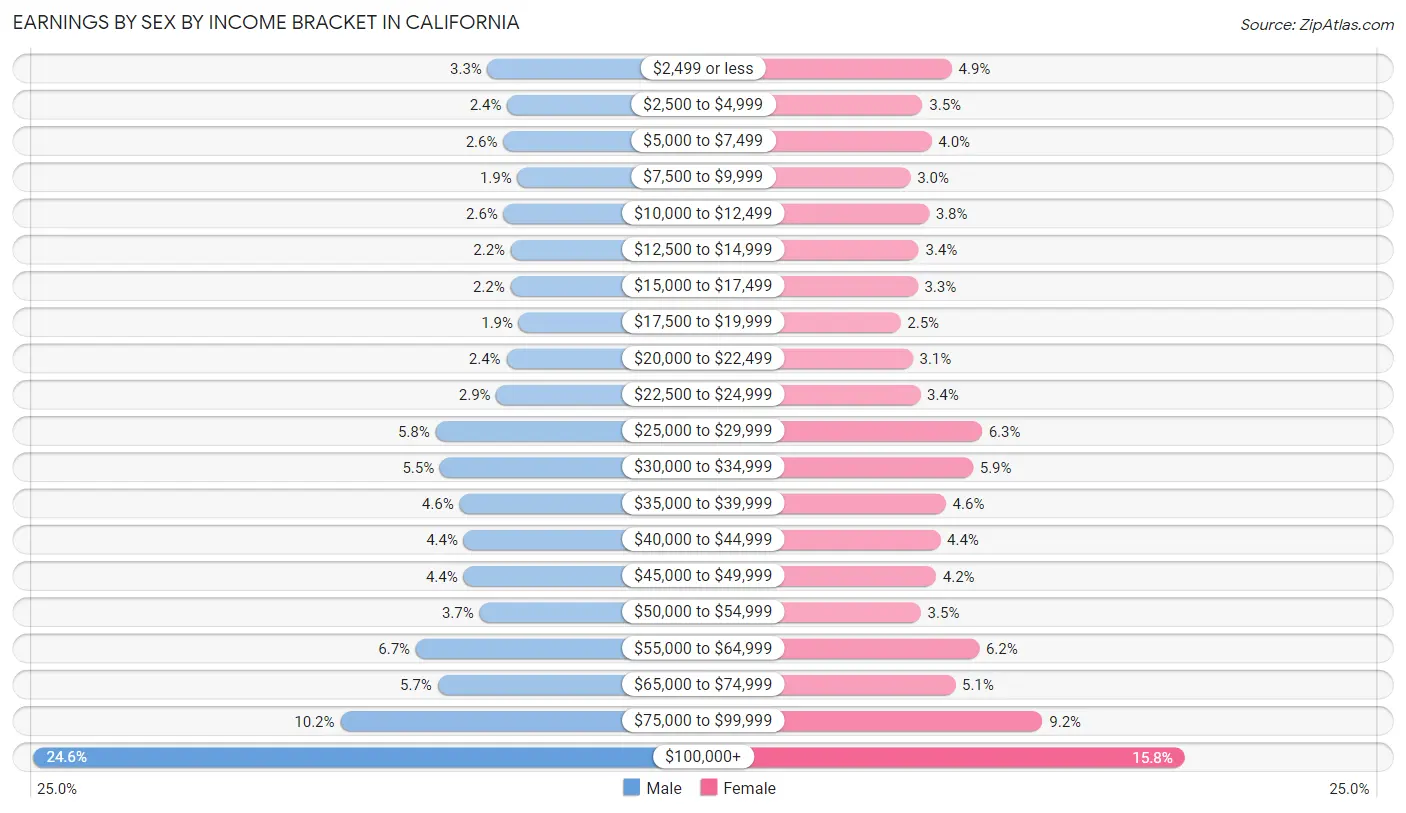
Earnings by Sex by Income Bracket in California
The most common earnings brackets in California are $100,000+ for men (2,749,763 | 24.6%) and $100,000+ for women (1,496,850 | 15.8%).
| Income | Male | Female |
| $2,499 or less | 370,568 (3.3%) | 464,733 (4.9%) |
| $2,500 to $4,999 | 266,963 (2.4%) | 335,151 (3.5%) |
| $5,000 to $7,499 | 288,614 (2.6%) | 374,896 (4.0%) |
| $7,500 to $9,999 | 214,127 (1.9%) | 281,452 (3.0%) |
| $10,000 to $12,499 | 286,880 (2.6%) | 363,116 (3.8%) |
| $12,500 to $14,999 | 248,885 (2.2%) | 317,628 (3.4%) |
| $15,000 to $17,499 | 250,277 (2.2%) | 312,807 (3.3%) |
| $17,500 to $19,999 | 207,307 (1.8%) | 237,535 (2.5%) |
| $20,000 to $22,499 | 271,581 (2.4%) | 291,891 (3.1%) |
| $22,500 to $24,999 | 324,124 (2.9%) | 324,756 (3.4%) |
| $25,000 to $29,999 | 643,826 (5.8%) | 598,031 (6.3%) |
| $30,000 to $34,999 | 620,125 (5.5%) | 557,801 (5.9%) |
| $35,000 to $39,999 | 517,506 (4.6%) | 438,059 (4.6%) |
| $40,000 to $44,999 | 495,950 (4.4%) | 413,079 (4.4%) |
| $45,000 to $49,999 | 496,458 (4.4%) | 394,998 (4.2%) |
| $50,000 to $54,999 | 413,139 (3.7%) | 326,959 (3.5%) |
| $55,000 to $64,999 | 746,683 (6.7%) | 585,636 (6.2%) |
| $65,000 to $74,999 | 632,235 (5.7%) | 479,882 (5.1%) |
| $75,000 to $99,999 | 1,142,643 (10.2%) | 866,972 (9.2%) |
| $100,000+ | 2,749,763 (24.6%) | 1,496,850 (15.8%) |
| Total | 11,187,654 (100.0%) | 9,462,232 (100.0%) |
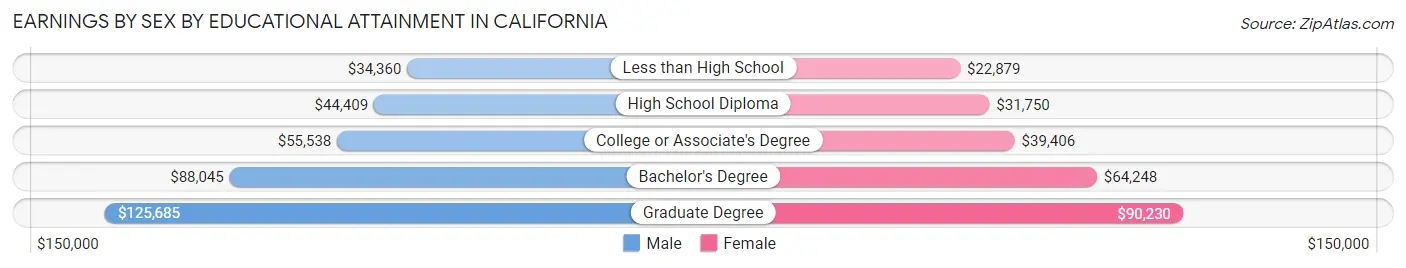
Earnings by Sex by Educational Attainment in California
Average earnings in California are $58,345 for men and $44,814 for women, a difference of 23.2%. Men with an educational attainment of graduate degree enjoy the highest average annual earnings of $125,685, while those with less than high school education earn the least with $34,360. Women with an educational attainment of graduate degree earn the most with the average annual earnings of $90,230, while those with less than high school education have the smallest earnings of $22,879.
| Educational Attainment | Male Income | Female Income |
| Less than High School | $34,360 | $22,879 |
| High School Diploma | $44,409 | $31,750 |
| College or Associate's Degree | $55,538 | $39,406 |
| Bachelor's Degree | $88,045 | $64,248 |
| Graduate Degree | $125,685 | $90,230 |
| Total | $58,345 | $44,814 |
Family Income in California
Family Income Brackets in California
According to the California family income data, there are 1,918,772 families falling into the $200,000+ income range, which is the most common income bracket and makes up 21.1% of all families. Conversely, the $10,000 to $14,999 income bracket is the least frequent group with only 145,499 families (1.6%) belonging to this category.
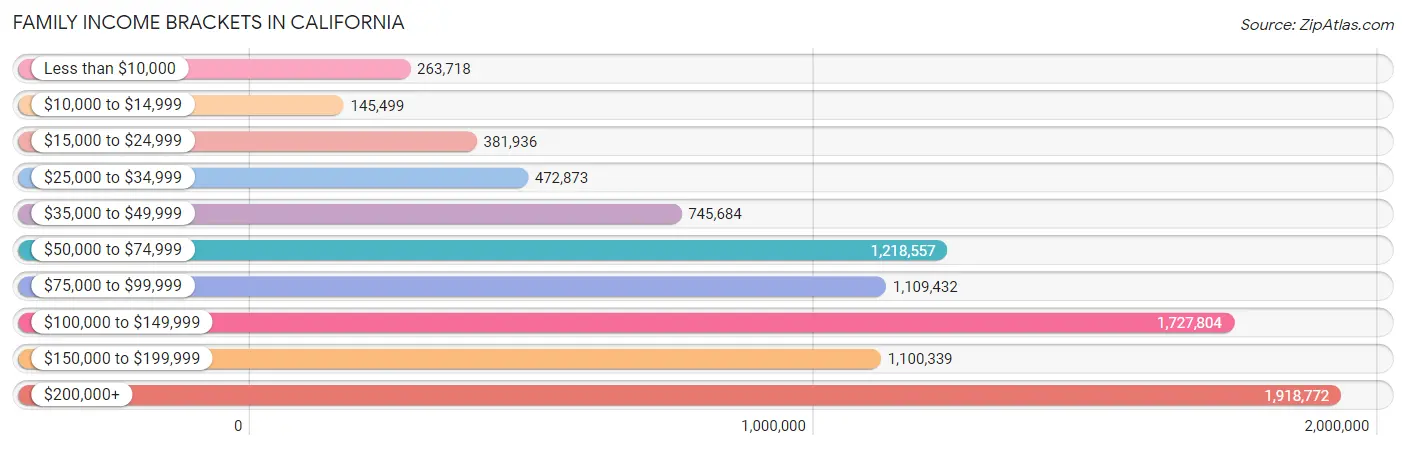
| Income Bracket | # Families | % Families |
| Less than $10,000 | 263,718 | 2.9% |
| $10,000 to $14,999 | 145,499 | 1.6% |
| $15,000 to $24,999 | 381,936 | 4.2% |
| $25,000 to $34,999 | 472,873 | 5.2% |
| $35,000 to $49,999 | 745,684 | 8.2% |
| $50,000 to $74,999 | 1,218,557 | 13.4% |
| $75,000 to $99,999 | 1,109,432 | 12.2% |
| $100,000 to $149,999 | 1,727,804 | 19.0% |
| $150,000 to $199,999 | 1,100,339 | 12.1% |
| $200,000+ | 1,918,772 | 21.1% |
Family Income by Famaliy Size in California
7+ person families (280,434 | 3.1%) account for the highest median family income in California with $123,752 per family, while 2-person families (3,554,734 | 39.1%) have the highest median income of $46,713 per family member.
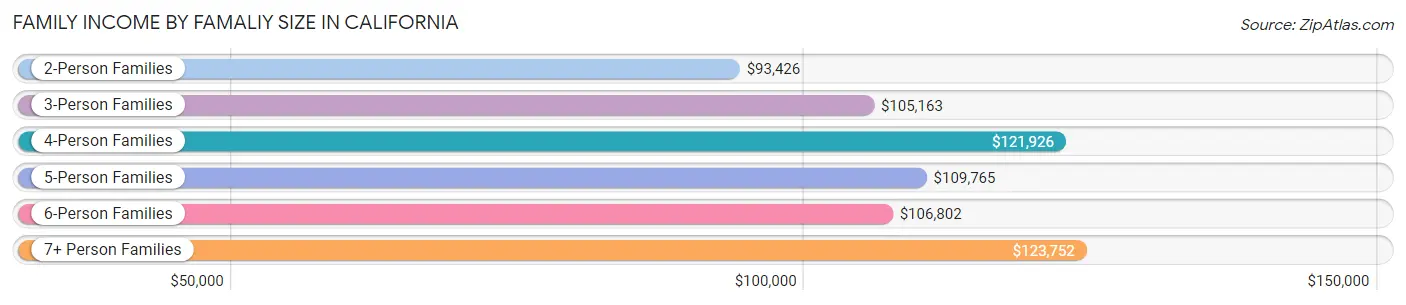
| Income Bracket | # Families | Median Income |
| 2-Person Families | 3,554,734 (39.1%) | $93,426 |
| 3-Person Families | 2,067,637 (22.7%) | $105,163 |
| 4-Person Families | 1,877,130 (20.6%) | $121,926 |
| 5-Person Families | 929,171 (10.2%) | $109,765 |
| 6-Person Families | 384,601 (4.2%) | $106,802 |
| 7+ Person Families | 280,434 (3.1%) | $123,752 |
| Total | 9,093,707 (100.0%) | $105,010 |
Family Income by Number of Earners in California
The median family income in California is $105,010, with families comprising 3+ earners (1,386,220) having the highest median family income of $149,099, while families with no earners (1,143,815) have the lowest median family income of $49,558, accounting for 15.2% and 12.6% of families, respectively.
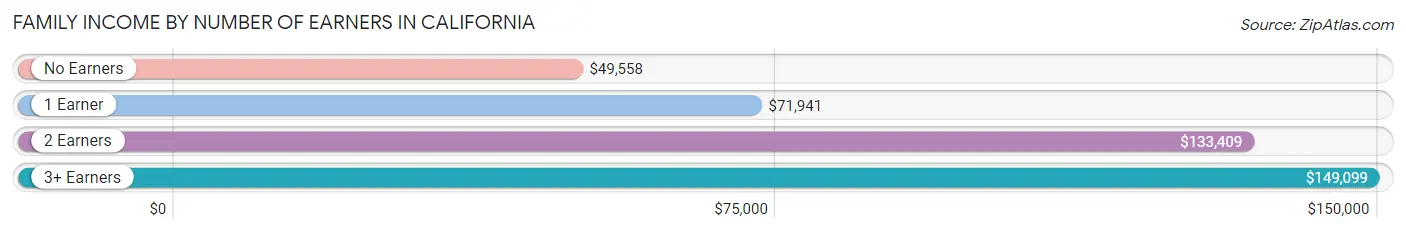
| Number of Earners | # Families | Median Income |
| No Earners | 1,143,815 (12.6%) | $49,558 |
| 1 Earner | 2,876,334 (31.6%) | $71,941 |
| 2 Earners | 3,687,338 (40.6%) | $133,409 |
| 3+ Earners | 1,386,220 (15.2%) | $149,099 |
| Total | 9,093,707 (100.0%) | $105,010 |
Household Income in California
Household Income Brackets in California
With 2,383,532 households falling in the category, the $200,000+ income range is the most frequent in California, accounting for 17.9% of all households. In contrast, only 426,106 households (3.2%) fall into the $10,000 to $14,999 income bracket, making it the least populous group.
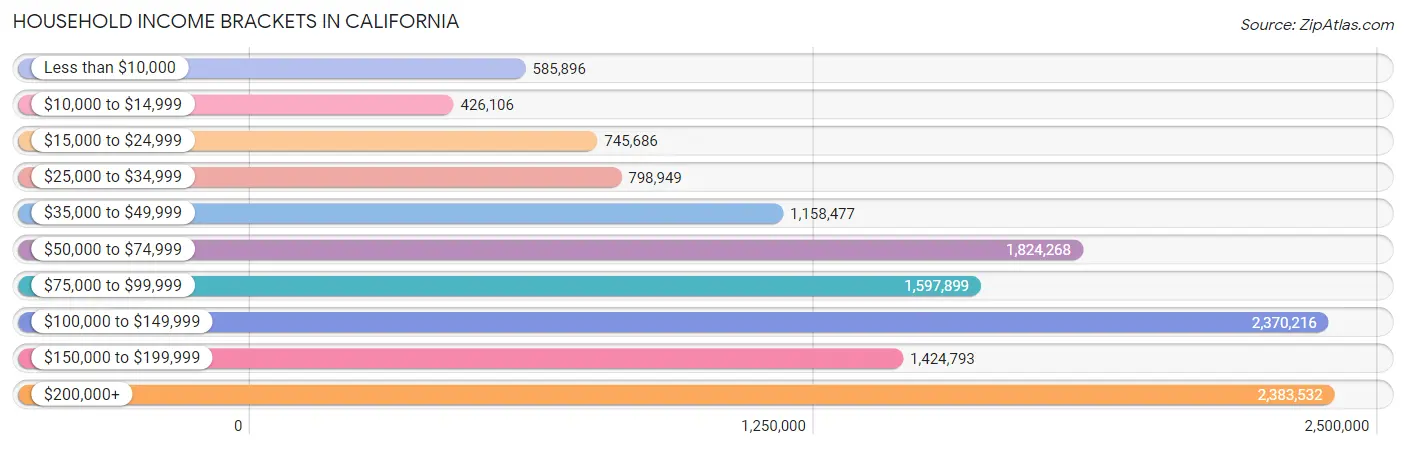
| Income Bracket | # Households | % Households |
| Less than $10,000 | 585,896 | 4.4% |
| $10,000 to $14,999 | 426,106 | 3.2% |
| $15,000 to $24,999 | 745,686 | 5.6% |
| $25,000 to $34,999 | 798,949 | 6.0% |
| $35,000 to $49,999 | 1,158,477 | 8.7% |
| $50,000 to $74,999 | 1,824,268 | 13.7% |
| $75,000 to $99,999 | 1,597,899 | 12.0% |
| $100,000 to $149,999 | 2,370,216 | 17.8% |
| $150,000 to $199,999 | 1,424,793 | 10.7% |
| $200,000+ | 2,383,532 | 17.9% |
Household Income by Householder Age in California
The median household income in California is $91,905, with the highest median household income of $108,046 found in the 45 to 64 years age bracket for the primary householder. A total of 5,058,940 households (38.0%) fall into this category. Meanwhile, the 15 to 24 years age bracket for the primary householder has the lowest median household income of $48,986, with 373,841 households (2.8%) in this group.
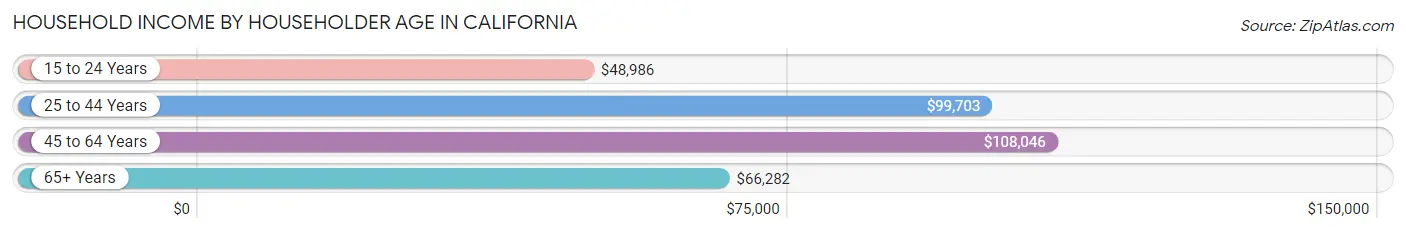
| Income Bracket | # Households | Median Income |
| 15 to 24 Years | 373,841 (2.8%) | $48,986 |
| 25 to 44 Years | 4,565,586 (34.3%) | $99,703 |
| 45 to 64 Years | 5,058,940 (38.0%) | $108,046 |
| 65+ Years | 3,317,455 (24.9%) | $66,282 |
| Total | 13,315,822 (100.0%) | $91,905 |
Poverty in California
Income Below Poverty by Sex and Age in California
With 11.1% poverty level for males and 13.2% for females among the residents of California, 15 year old males and 18 to 24 year old females are the most vulnerable to poverty, with 40,941 males (15.8%) and 325,806 females (19.2%) in their respective age groups living below the poverty level.
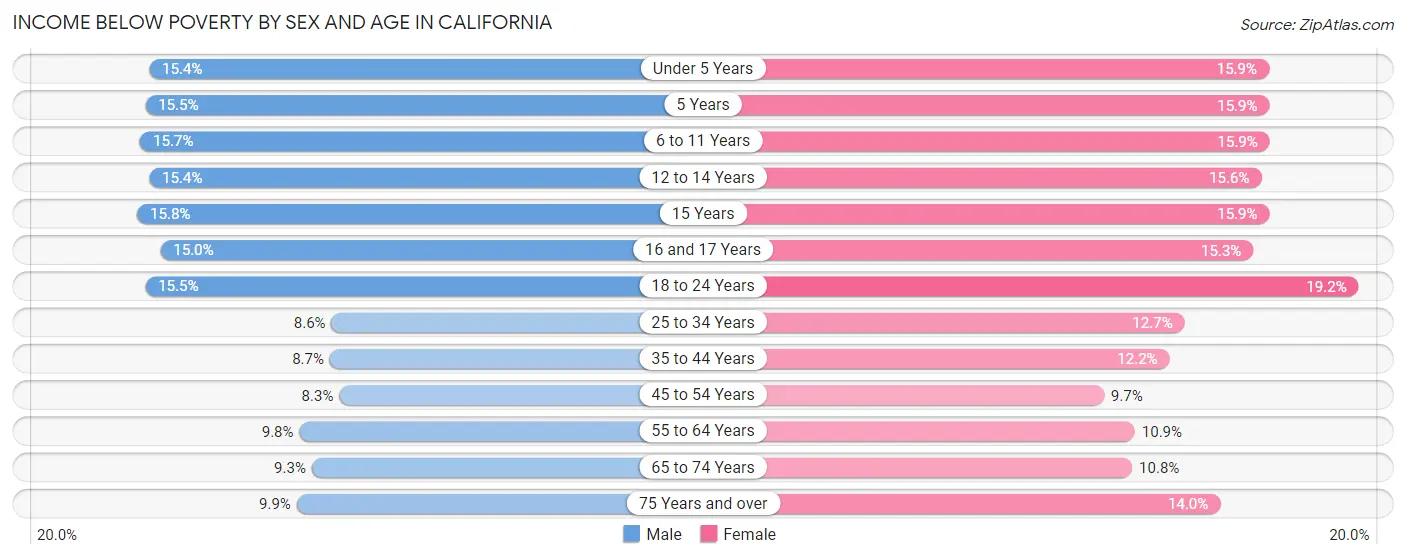
| Age Bracket | Male | Female |
| Under 5 Years | 174,379 (15.4%) | 171,488 (15.9%) |
| 5 Years | 36,024 (15.5%) | 35,059 (15.9%) |
| 6 to 11 Years | 232,389 (15.7%) | 223,509 (15.9%) |
| 12 to 14 Years | 122,445 (15.4%) | 118,084 (15.6%) |
| 15 Years | 40,941 (15.8%) | 40,463 (15.9%) |
| 16 and 17 Years | 78,006 (15.0%) | 75,002 (15.3%) |
| 18 to 24 Years | 276,398 (15.5%) | 325,806 (19.2%) |
| 25 to 34 Years | 256,000 (8.6%) | 360,164 (12.7%) |
| 35 to 44 Years | 233,456 (8.7%) | 316,324 (12.2%) |
| 45 to 54 Years | 206,728 (8.3%) | 238,797 (9.7%) |
| 55 to 64 Years | 228,644 (9.8%) | 260,693 (10.9%) |
| 65 to 74 Years | 148,712 (9.3%) | 193,984 (10.8%) |
| 75 Years and over | 97,915 (9.9%) | 193,862 (14.0%) |
| Total | 2,132,037 (11.1%) | 2,553,235 (13.2%) |
Income Above Poverty by Sex and Age in California
According to the poverty statistics in California, males aged 45 to 54 years and females aged 45 to 54 years are the age groups that are most secure financially, with 91.7% of males and 90.3% of females in these age groups living above the poverty line.
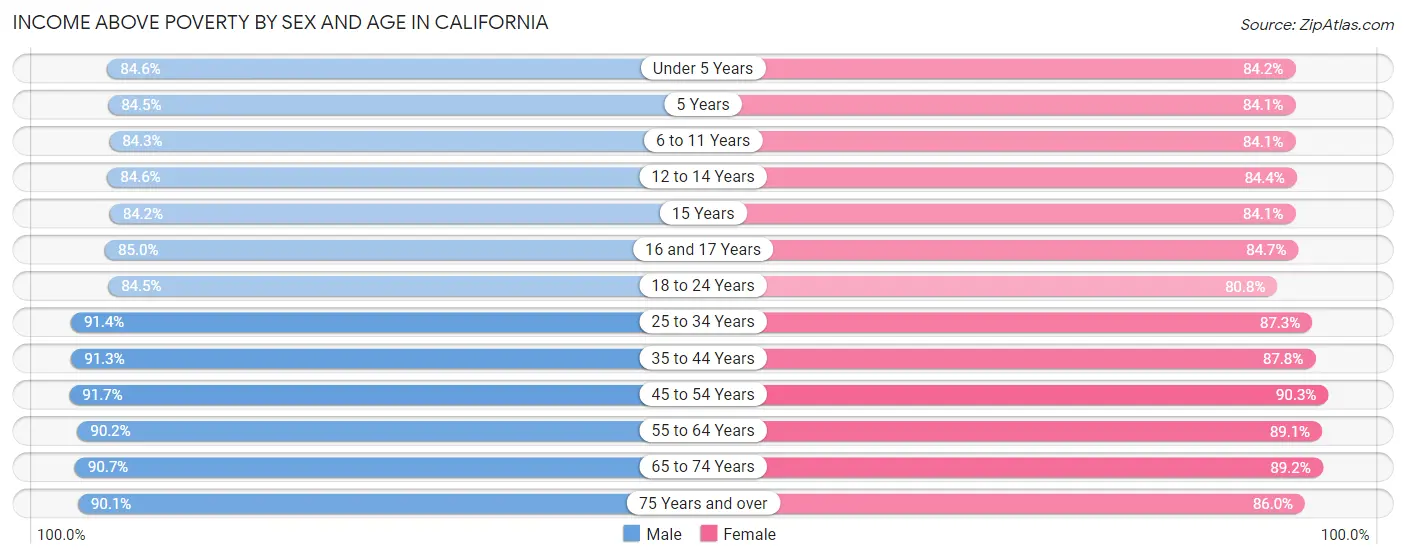
| Age Bracket | Male | Female |
| Under 5 Years | 959,434 (84.6%) | 910,278 (84.2%) |
| 5 Years | 196,130 (84.5%) | 185,802 (84.1%) |
| 6 to 11 Years | 1,246,889 (84.3%) | 1,183,818 (84.1%) |
| 12 to 14 Years | 673,882 (84.6%) | 640,390 (84.4%) |
| 15 Years | 217,827 (84.2%) | 214,493 (84.1%) |
| 16 and 17 Years | 443,443 (85.0%) | 416,187 (84.7%) |
| 18 to 24 Years | 1,505,079 (84.5%) | 1,372,558 (80.8%) |
| 25 to 34 Years | 2,716,341 (91.4%) | 2,471,102 (87.3%) |
| 35 to 44 Years | 2,460,668 (91.3%) | 2,284,141 (87.8%) |
| 45 to 54 Years | 2,279,157 (91.7%) | 2,214,769 (90.3%) |
| 55 to 64 Years | 2,104,212 (90.2%) | 2,134,710 (89.1%) |
| 65 to 74 Years | 1,444,156 (90.7%) | 1,605,067 (89.2%) |
| 75 Years and over | 891,310 (90.1%) | 1,186,470 (86.0%) |
| Total | 17,138,528 (88.9%) | 16,819,785 (86.8%) |
Income Below Poverty Among Married-Couple Families in California
The poverty statistics for married-couple families in California show that 5.1% or 335,287 of the total 6,545,790 families live below the poverty line. Families with 5 or more children have the highest poverty rate of 23.8%, comprising of 10,813 families. On the other hand, families with no children have the lowest poverty rate of 3.8%, which includes 134,035 families.
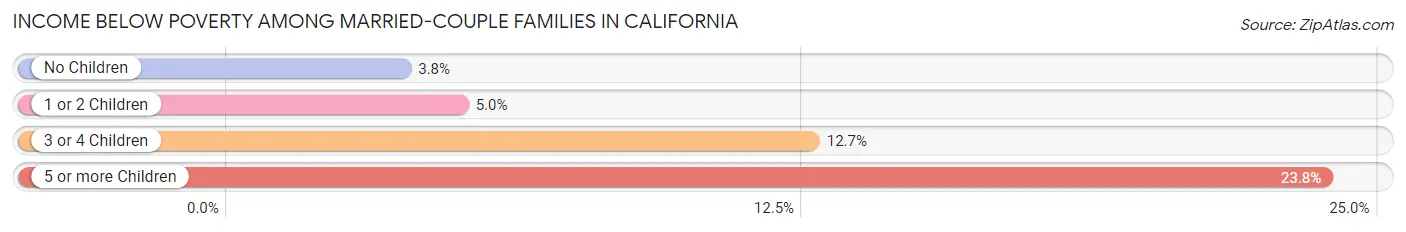
| Children | Above Poverty | Below Poverty |
| No Children | 3,417,486 (96.2%) | 134,035 (3.8%) |
| 1 or 2 Children | 2,273,809 (95.0%) | 120,160 (5.0%) |
| 3 or 4 Children | 484,647 (87.3%) | 70,279 (12.7%) |
| 5 or more Children | 34,561 (76.2%) | 10,813 (23.8%) |
| Total | 6,210,503 (94.9%) | 335,287 (5.1%) |
Income Below Poverty Among Single-Parent Households in California
According to the poverty data in California, 11.1% or 92,022 single-father households and 20.3% or 348,757 single-mother households are living below the poverty line. Among single-father households, those with 5 or more children have the highest poverty rate, with 2,100 households (35.0%) experiencing poverty. Likewise, among single-mother households, those with 5 or more children have the highest poverty rate, with 11,566 households (60.3%) falling below the poverty line.
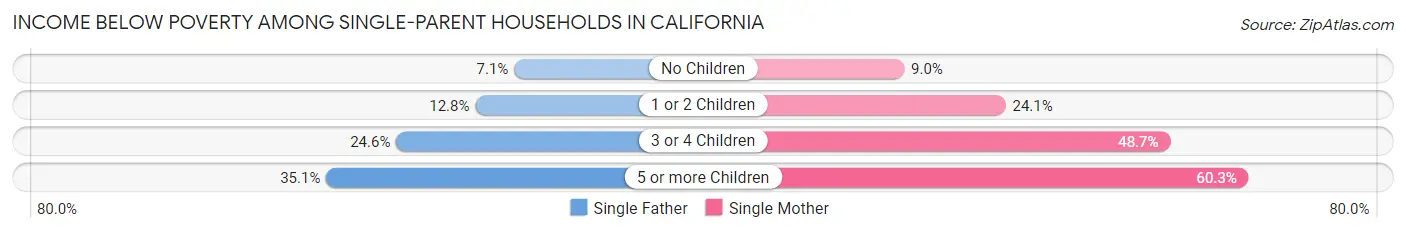
| Children | Single Father | Single Mother |
| No Children | 28,961 (7.0%) | 68,142 (9.0%) |
| 1 or 2 Children | 44,604 (12.8%) | 186,160 (24.1%) |
| 3 or 4 Children | 16,357 (24.6%) | 82,889 (48.7%) |
| 5 or more Children | 2,100 (35.0%) | 11,566 (60.3%) |
| Total | 92,022 (11.1%) | 348,757 (20.3%) |
Income Below Poverty Among Married-Couple vs Single-Parent Households in California
The poverty data for California shows that 335,287 of the married-couple family households (5.1%) and 440,779 of the single-parent households (17.3%) are living below the poverty level. Within the married-couple family households, those with 5 or more children have the highest poverty rate, with 10,813 households (23.8%) falling below the poverty line. Among the single-parent households, those with 5 or more children have the highest poverty rate, with 13,666 household (54.3%) living below poverty.
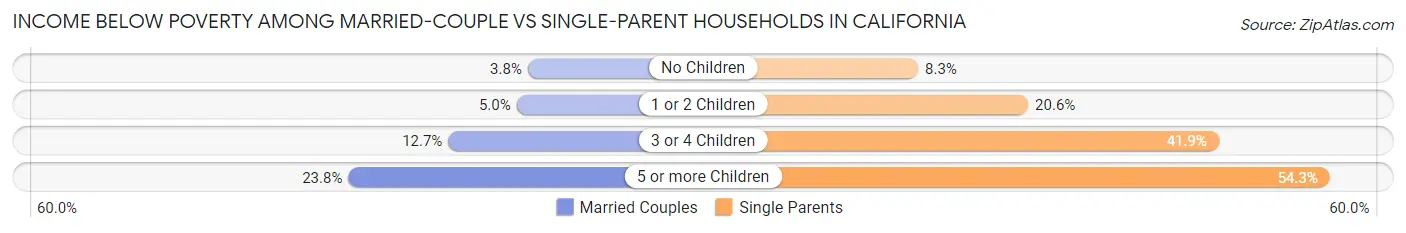
| Children | Married-Couple Families | Single-Parent Households |
| No Children | 134,035 (3.8%) | 97,103 (8.3%) |
| 1 or 2 Children | 120,160 (5.0%) | 230,764 (20.6%) |
| 3 or 4 Children | 70,279 (12.7%) | 99,246 (41.9%) |
| 5 or more Children | 10,813 (23.8%) | 13,666 (54.3%) |
| Total | 335,287 (5.1%) | 440,779 (17.3%) |
Largest Zip Codes by Population in California
The largest zip codes in California by population are 90011 (106,042), 90650 (101,983), 94565 (100,826), 92336 (100,571), and 91331 (99,804).
1.90011
106,042 (0.27%)
2.90650
101,983 (0.26%)
3.94565
100,826 (0.26%)
4.92336
100,571 (0.26%)
5.91331
99,804 (0.25%)
6.90044
98,990 (0.25%)
7.92335
96,704 (0.25%)
8.90805
96,515 (0.25%)
9.90250
96,200 (0.24%)
10.90201
95,134 (0.24%)
11.91342
92,580 (0.24%)
12.90280
92,262 (0.23%)
13.92683
90,630 (0.23%)
14.93307
89,651 (0.23%)
15.92503
88,617 (0.23%)
16.91911
87,799 (0.22%)
17.92345
87,476 (0.22%)
18.93722
86,387 (0.22%)
19.92376
85,727 (0.22%)
20.92804
84,700 (0.22%)
21.92154
83,758 (0.21%)
22.95076
83,716 (0.21%)
23.95823
82,983 (0.21%)
24.93033
82,517 (0.21%)
25.93727
82,176 (0.21%)
26.92592
81,636 (0.21%)
27.93550
81,501 (0.21%)
28.91710
81,466 (0.21%)
29.93535
80,905 (0.21%)
30.94112
80,880 (0.21%)
Largest Cities by Population in California
The largest cities in California by population are Los Angeles (3,881,041), San Diego (1,383,987), San Jose (1,001,176), San Francisco (851,036), and Fresno (541,528).
3,881,041 (9.86%)
1,383,987 (3.52%)
3.San Jose
1,001,176 (2.54%)
851,036 (2.16%)
5.Fresno
541,528 (1.38%)
523,600 (1.33%)
462,293 (1.17%)
8.Oakland
437,825 (1.11%)
404,321 (1.03%)
10.Anaheim
347,111 (0.88%)
11.Stockton
320,030 (0.81%)
12.Riverside
316,076 (0.80%)
13.Santa Ana
311,379 (0.79%)
14.Irvine
304,527 (0.77%)
15.Chula Vista
276,103 (0.70%)
16.Fremont
228,795 (0.58%)
225,850 (0.57%)
221,041 (0.56%)
19.Modesto
218,308 (0.55%)
209,578 (0.53%)
21.Fontana
209,279 (0.53%)
22.Oxnard
202,279 (0.51%)
197,481 (0.50%)
24.Glendale
194,512 (0.49%)
25.Santa Rosa
178,221 (0.45%)
26.Ontario
176,326 (0.45%)
27.Elk Grove
176,105 (0.45%)
174,696 (0.44%)
29.Oceanside
173,722 (0.44%)
30.Garden Grove
171,637 (0.44%)
Largest Counties by Population in California
The largest counties in California by population are Los Angeles County (9,936,690), San Diego County (3,289,701), Orange County (3,175,227), Riverside County (2,429,487), and San Bernardino County (2,180,563).
9,936,690 (25.25%)
3,289,701 (8.36%)
3,175,227 (8.07%)
2,429,487 (6.17%)
2,180,563 (5.54%)
1,916,831 (4.87%)
1,663,823 (4.23%)
1,579,211 (4.01%)
1,162,648 (2.95%)
1,008,280 (2.56%)
11.Kern County
906,883 (2.30%)
851,036 (2.16%)
842,009 (2.14%)
779,445 (1.98%)
754,250 (1.92%)
552,063 (1.40%)
488,436 (1.24%)
473,446 (1.20%)
450,995 (1.15%)
445,213 (1.13%)
437,609 (1.11%)
406,608 (1.03%)
282,290 (0.72%)
281,712 (0.72%)
268,571 (0.68%)
26.Marin County
260,485 (0.66%)
27.Yolo County
217,141 (0.55%)
28.Butte County
213,605 (0.54%)
191,713 (0.49%)
181,852 (0.46%)
Race in California
The most populous races in California are White / Caucasian (18,943,660 | 48.1%), Hispanic or Latino (15,617,930 | 39.7%), and Some other Race (6,388,999 | 16.2%).
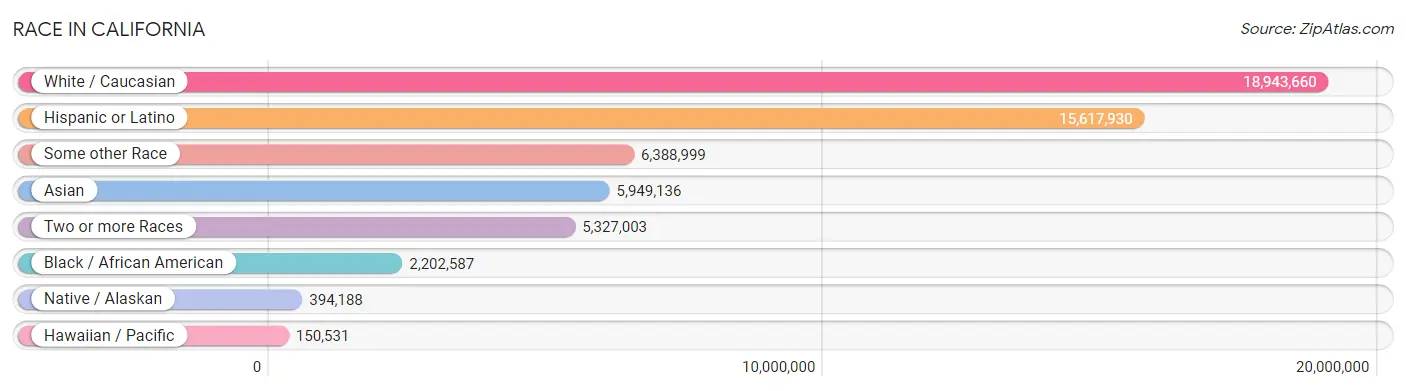
| Race | # Population | % Population |
| Asian | 5,949,136 | 15.1% |
| Black / African American | 2,202,587 | 5.6% |
| Hawaiian / Pacific | 150,531 | 0.4% |
| Hispanic or Latino | 15,617,930 | 39.7% |
| Native / Alaskan | 394,188 | 1.0% |
| White / Caucasian | 18,943,660 | 48.1% |
| Two or more Races | 5,327,003 | 13.5% |
| Some other Race | 6,388,999 | 16.2% |
| Total | 39,356,104 | 100.0% |
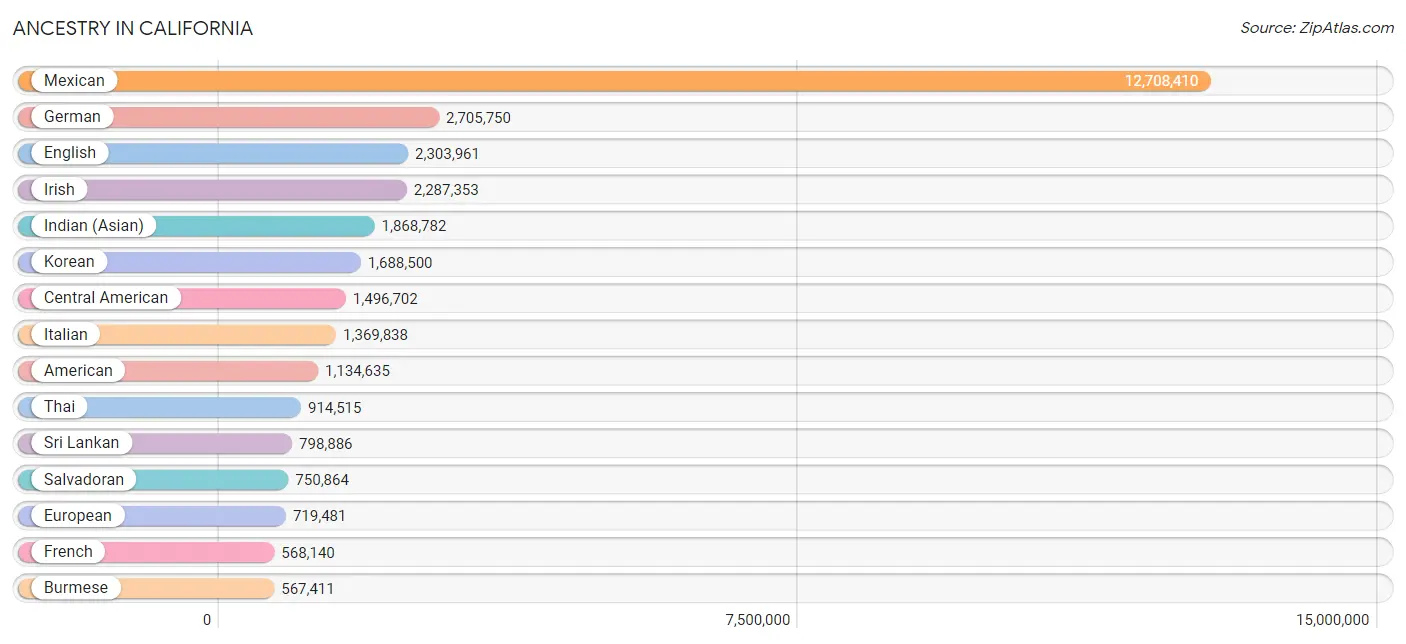
Ancestry in California
The most populous ancestries reported in California are Mexican (12,708,410 | 32.3%), German (2,705,750 | 6.9%), English (2,303,961 | 5.9%), Irish (2,287,353 | 5.8%), and Indian (Asian) (1,868,782 | 4.8%), together accounting for 55.6% of all California residents.
| Ancestry | # Population | % Population |
| Afghan | 61,122 | 0.2% |
| African | 144,343 | 0.4% |
| Alaska Native | 1,113 | 0.0% |
| Alaskan Athabascan | 603 | 0.0% |
| Albanian | 5,268 | 0.0% |
| Aleut | 1,036 | 0.0% |
| Alsatian | 758 | 0.0% |
| American | 1,134,635 | 2.9% |
| Apache | 35,359 | 0.1% |
| Arab | 324,963 | 0.8% |
| Arapaho | 474 | 0.0% |
| Argentinean | 54,877 | 0.1% |
| Armenian | 246,285 | 0.6% |
| Assyrian / Chaldean / Syriac | 26,497 | 0.1% |
| Australian | 18,623 | 0.1% |
| Austrian | 62,120 | 0.2% |
| Bahamian | 1,046 | 0.0% |
| Bangladeshi | 112,008 | 0.3% |
| Barbadian | 2,103 | 0.0% |
| Basque | 18,106 | 0.1% |
| Belgian | 23,091 | 0.1% |
| Belizean | 21,066 | 0.1% |
| Bermudan | 306 | 0.0% |
| Bhutanese | 480,217 | 1.2% |
| Blackfeet | 26,780 | 0.1% |
| Bolivian | 15,591 | 0.0% |
| Brazilian | 47,047 | 0.1% |
| British | 203,387 | 0.5% |
| British West Indian | 2,476 | 0.0% |
| Bulgarian | 12,943 | 0.0% |
| Burmese | 567,411 | 1.4% |
| Cajun | 2,670 | 0.0% |
| Cambodian | 8,150 | 0.0% |
| Canadian | 70,458 | 0.2% |
| Cape Verdean | 3,541 | 0.0% |
| Carpatho Rusyn | 351 | 0.0% |
| Celtic | 4,237 | 0.0% |
| Central American | 1,496,702 | 3.8% |
| Central American Indian | 78,655 | 0.2% |
| Cherokee | 111,347 | 0.3% |
| Cheyenne | 1,699 | 0.0% |
| Chickasaw | 6,560 | 0.0% |
| Chilean | 30,014 | 0.1% |
| Chinese | 2,568 | 0.0% |
| Chippewa | 9,421 | 0.0% |
| Choctaw | 31,810 | 0.1% |
| Colombian | 101,043 | 0.3% |
| Colville | 348 | 0.0% |
| Comanche | 3,835 | 0.0% |
| Costa Rican | 28,570 | 0.1% |
| Cree | 1,687 | 0.0% |
| Creek | 7,341 | 0.0% |
| Croatian | 46,828 | 0.1% |
| Crow | 821 | 0.0% |
| Cuban | 104,443 | 0.3% |
| Cypriot | 768 | 0.0% |
| Czech | 74,784 | 0.2% |
| Czechoslovakian | 20,198 | 0.1% |
| Danish | 144,313 | 0.4% |
| Delaware | 1,803 | 0.0% |
| Dominican | 22,799 | 0.1% |
| Dutch | 280,950 | 0.7% |
| Dutch West Indian | 1,056 | 0.0% |
| Eastern European | 118,706 | 0.3% |
| Ecuadorian | 45,661 | 0.1% |
| Egyptian | 58,380 | 0.2% |
| English | 2,303,961 | 5.9% |
| Estonian | 4,096 | 0.0% |
| Ethiopian | 38,804 | 0.1% |
| European | 719,481 | 1.8% |
| Fijian | 2,306 | 0.0% |
| Filipino | 120,868 | 0.3% |
| Finnish | 50,326 | 0.1% |
| French | 568,140 | 1.4% |
| French American Indian | 3,141 | 0.0% |
| French Canadian | 90,507 | 0.2% |
| German | 2,705,750 | 6.9% |
| German Russian | 1,322 | 0.0% |
| Ghanaian | 9,384 | 0.0% |
| Greek | 123,660 | 0.3% |
| Guamanian / Chamorro | 45,863 | 0.1% |
| Guatemalan | 468,407 | 1.2% |
| Guyanese | 3,934 | 0.0% |
| Haitian | 13,930 | 0.0% |
| Hmong | 175 | 0.0% |
| Honduran | 101,421 | 0.3% |
| Hopi | 2,166 | 0.0% |
| Houma | 193 | 0.0% |
| Hungarian | 101,709 | 0.3% |
| Icelander | 6,565 | 0.0% |
| Indian (Asian) | 1,868,782 | 4.8% |
| Indonesian | 23,418 | 0.1% |
| Inupiat | 2,263 | 0.0% |
| Iranian | 210,625 | 0.5% |
| Iraqi | 24,399 | 0.1% |
| Irish | 2,287,353 | 5.8% |
| Iroquois | 6,395 | 0.0% |
| Israeli | 29,206 | 0.1% |
| Italian | 1,369,838 | 3.5% |
| Jamaican | 38,751 | 0.1% |
| Japanese | 122,835 | 0.3% |
| Jordanian | 15,752 | 0.0% |
| Kenyan | 8,087 | 0.0% |
| Kiowa | 431 | 0.0% |
| Korean | 1,688,500 | 4.3% |
| Laotian | 54,262 | 0.1% |
| Latvian | 9,796 | 0.0% |
| Lebanese | 63,675 | 0.2% |
| Liberian | 2,670 | 0.0% |
| Lithuanian | 44,962 | 0.1% |
| Lumbee | 898 | 0.0% |
| Luxembourger | 1,999 | 0.0% |
| Macedonian | 2,911 | 0.0% |
| Malaysian | 65,868 | 0.2% |
| Maltese | 6,690 | 0.0% |
| Marshallese | 330 | 0.0% |
| Menominee | 220 | 0.0% |
| Mexican | 12,708,410 | 32.3% |
| Mexican American Indian | 190,892 | 0.5% |
| Mongolian | 6,698 | 0.0% |
| Moroccan | 10,310 | 0.0% |
| Native Hawaiian | 90,466 | 0.2% |
| Navajo | 25,082 | 0.1% |
| Nepalese | 10,704 | 0.0% |
| New Zealander | 3,987 | 0.0% |
| Nicaraguan | 113,871 | 0.3% |
| Nigerian | 53,027 | 0.1% |
| Northern European | 75,659 | 0.2% |
| Norwegian | 336,251 | 0.9% |
| Okinawan | 2,871 | 0.0% |
| Osage | 2,469 | 0.0% |
| Ottawa | 1,003 | 0.0% |
| Paiute | 5,336 | 0.0% |
| Pakistani | 75,475 | 0.2% |
| Palestinian | 25,932 | 0.1% |
| Panamanian | 21,700 | 0.1% |
| Paraguayan | 1,486 | 0.0% |
| Pennsylvania German | 4,643 | 0.0% |
| Peruvian | 114,315 | 0.3% |
| Pima | 2,390 | 0.0% |
| Polish | 442,759 | 1.1% |
| Portuguese | 316,347 | 0.8% |
| Potawatomi | 3,163 | 0.0% |
| Pueblo | 9,037 | 0.0% |
| Puerto Rican | 229,063 | 0.6% |
| Puget Sound Salish | 1,121 | 0.0% |
| Romanian | 59,329 | 0.2% |
| Russian | 340,753 | 0.9% |
| Salvadoran | 750,864 | 1.9% |
| Samoan | 63,184 | 0.2% |
| Scandinavian | 99,375 | 0.3% |
| Scotch-Irish | 189,861 | 0.5% |
| Scottish | 454,456 | 1.1% |
| Seminole | 3,908 | 0.0% |
| Senegalese | 1,241 | 0.0% |
| Serbian | 18,555 | 0.1% |
| Shoshone | 2,072 | 0.0% |
| Sierra Leonean | 1,786 | 0.0% |
| Sioux | 14,592 | 0.0% |
| Slavic | 12,110 | 0.0% |
| Slovak | 23,894 | 0.1% |
| Slovene | 10,598 | 0.0% |
| Somali | 4,921 | 0.0% |
| South African | 12,663 | 0.0% |
| South American | 397,799 | 1.0% |
| South American Indian | 8,401 | 0.0% |
| Soviet Union | 726 | 0.0% |
| Spaniard | 180,249 | 0.5% |
| Spanish | 143,099 | 0.4% |
| Spanish American | 5,404 | 0.0% |
| Spanish American Indian | 10,133 | 0.0% |
| Sri Lankan | 798,886 | 2.0% |
| Subsaharan African | 302,717 | 0.8% |
| Sudanese | 4,117 | 0.0% |
| Swedish | 329,849 | 0.8% |
| Swiss | 90,186 | 0.2% |
| Syrian | 32,219 | 0.1% |
| Taiwanese | 1,045 | 0.0% |
| Thai | 914,515 | 2.3% |
| Tlingit-Haida | 1,671 | 0.0% |
| Tohono O'Odham | 3,598 | 0.0% |
| Tongan | 23,798 | 0.1% |
| Trinidadian and Tobagonian | 6,615 | 0.0% |
| Tsimshian | 272 | 0.0% |
| Turkish | 31,106 | 0.1% |
| U.S. Virgin Islander | 650 | 0.0% |
| Ugandan | 2,482 | 0.0% |
| Ukrainian | 117,144 | 0.3% |
| Uruguayan | 6,100 | 0.0% |
| Ute | 1,145 | 0.0% |
| Venezuelan | 24,161 | 0.1% |
| Vietnamese | 16,014 | 0.0% |
| Welsh | 146,263 | 0.4% |
| West Indian | 9,156 | 0.0% |
| Yakama | 261 | 0.0% |
| Yaqui | 18,555 | 0.1% |
| Yugoslavian | 18,769 | 0.1% |
| Yuman | 3,206 | 0.0% |
| Yup'ik | 436 | 0.0% |
| Zimbabwean | 796 | 0.0% | View All 200 Rows |
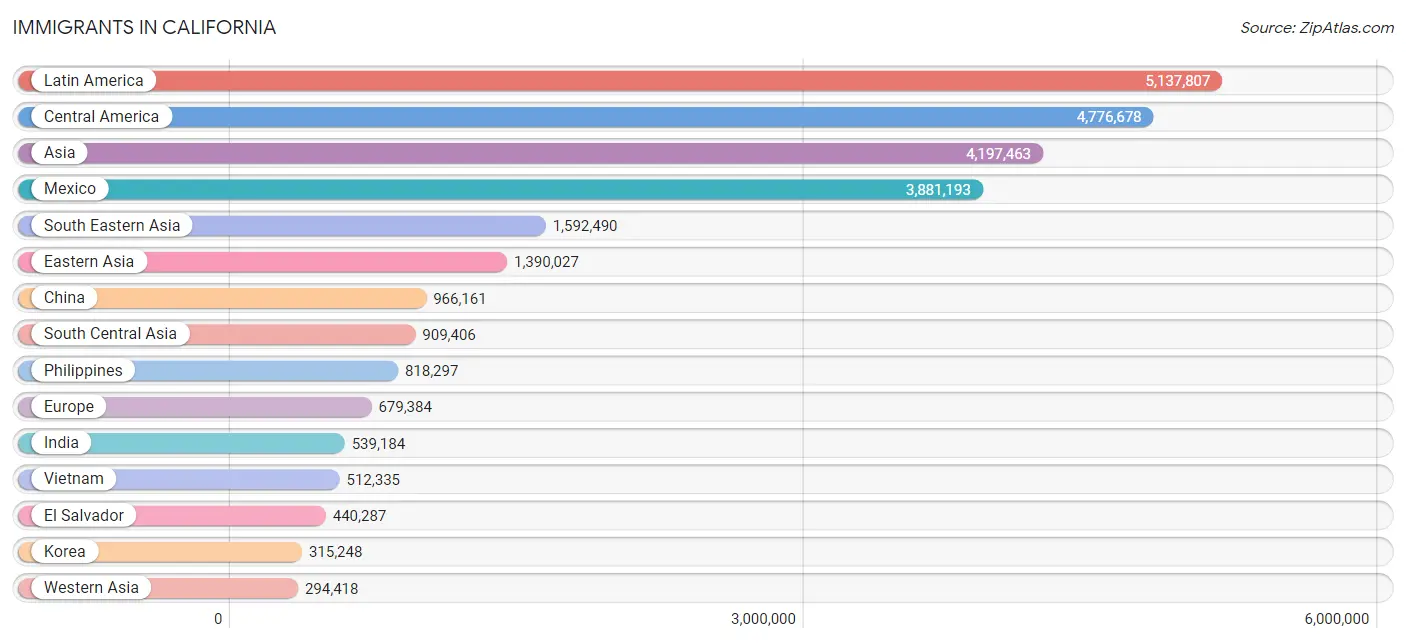
Immigrants in California
The most numerous immigrant groups reported in California came from Latin America (5,137,807 | 13.1%), Central America (4,776,678 | 12.1%), Asia (4,197,463 | 10.7%), Mexico (3,881,193 | 9.9%), and South Eastern Asia (1,592,490 | 4.1%), together accounting for 49.8% of all California residents.
| Immigration Origin | # Population | % Population |
| Afghanistan | 53,260 | 0.1% |
| Africa | 213,728 | 0.5% |
| Albania | 1,713 | 0.0% |
| Argentina | 33,960 | 0.1% |
| Armenia | 78,847 | 0.2% |
| Asia | 4,197,463 | 10.7% |
| Australia | 23,338 | 0.1% |
| Austria | 6,773 | 0.0% |
| Azores | 8,659 | 0.0% |
| Bahamas | 668 | 0.0% |
| Bangladesh | 18,366 | 0.1% |
| Barbados | 1,257 | 0.0% |
| Belarus | 11,157 | 0.0% |
| Belgium | 6,176 | 0.0% |
| Belize | 15,693 | 0.0% |
| Bolivia | 8,545 | 0.0% |
| Bosnia and Herzegovina | 4,867 | 0.0% |
| Brazil | 53,222 | 0.1% |
| Bulgaria | 9,442 | 0.0% |
| Cabo Verde | 343 | 0.0% |
| Cambodia | 51,974 | 0.1% |
| Cameroon | 3,174 | 0.0% |
| Canada | 127,477 | 0.3% |
| Caribbean | 71,289 | 0.2% |
| Central America | 4,776,678 | 12.1% |
| Chile | 15,357 | 0.0% |
| China | 966,161 | 2.5% |
| Colombia | 55,249 | 0.1% |
| Congo | 1,084 | 0.0% |
| Costa Rica | 12,623 | 0.0% |
| Croatia | 4,947 | 0.0% |
| Cuba | 30,441 | 0.1% |
| Czechoslovakia | 9,241 | 0.0% |
| Denmark | 6,555 | 0.0% |
| Dominica | 641 | 0.0% |
| Dominican Republic | 7,168 | 0.0% |
| Eastern Africa | 61,212 | 0.2% |
| Eastern Asia | 1,390,027 | 3.5% |
| Eastern Europe | 268,790 | 0.7% |
| Ecuador | 21,276 | 0.1% |
| Egypt | 42,718 | 0.1% |
| El Salvador | 440,287 | 1.1% |
| England | 57,953 | 0.2% |
| Eritrea | 7,279 | 0.0% |
| Ethiopia | 24,635 | 0.1% |
| Europe | 679,384 | 1.7% |
| Fiji | 33,937 | 0.1% |
| France | 40,224 | 0.1% |
| Germany | 73,304 | 0.2% |
| Ghana | 8,814 | 0.0% |
| Greece | 10,538 | 0.0% |
| Grenada | 496 | 0.0% |
| Guatemala | 290,436 | 0.7% |
| Guyana | 4,158 | 0.0% |
| Haiti | 5,330 | 0.0% |
| Honduras | 66,590 | 0.2% |
| Hong Kong | 105,215 | 0.3% |
| Hungary | 10,936 | 0.0% |
| India | 539,184 | 1.4% |
| Indonesia | 39,097 | 0.1% |
| Iran | 206,004 | 0.5% |
| Iraq | 40,941 | 0.1% |
| Ireland | 16,042 | 0.0% |
| Israel | 33,029 | 0.1% |
| Italy | 31,439 | 0.1% |
| Jamaica | 15,939 | 0.0% |
| Japan | 103,575 | 0.3% |
| Jordan | 16,384 | 0.0% |
| Kazakhstan | 6,648 | 0.0% |
| Kenya | 12,503 | 0.0% |
| Korea | 315,248 | 0.8% |
| Kuwait | 6,353 | 0.0% |
| Laos | 48,911 | 0.1% |
| Latin America | 5,137,807 | 13.1% |
| Latvia | 2,923 | 0.0% |
| Lebanon | 31,757 | 0.1% |
| Liberia | 3,203 | 0.0% |
| Lithuania | 3,665 | 0.0% |
| Malaysia | 17,929 | 0.1% |
| Mexico | 3,881,193 | 9.9% |
| Micronesia | 1,444 | 0.0% |
| Middle Africa | 7,302 | 0.0% |
| Moldova | 10,171 | 0.0% |
| Morocco | 6,612 | 0.0% |
| Nepal | 16,541 | 0.0% |
| Netherlands | 17,937 | 0.1% |
| Nicaragua | 58,161 | 0.2% |
| Nigeria | 35,557 | 0.1% |
| North Macedonia | 686 | 0.0% |
| Northern Africa | 61,708 | 0.2% |
| Northern Europe | 169,816 | 0.4% |
| Norway | 3,677 | 0.0% |
| Oceania | 86,519 | 0.2% |
| Pakistan | 49,399 | 0.1% |
| Panama | 9,209 | 0.0% |
| Peru | 74,025 | 0.2% |
| Philippines | 818,297 | 2.1% |
| Poland | 20,997 | 0.1% |
| Portugal | 25,462 | 0.1% |
| Romania | 23,058 | 0.1% |
| Russia | 71,932 | 0.2% |
| Saudi Arabia | 7,408 | 0.0% |
| Scotland | 8,444 | 0.0% |
| Senegal | 1,615 | 0.0% |
| Serbia | 4,595 | 0.0% |
| Sierra Leone | 2,618 | 0.0% |
| Singapore | 10,213 | 0.0% |
| Somalia | 2,824 | 0.0% |
| South Africa | 20,614 | 0.1% |
| South America | 289,840 | 0.7% |
| South Central Asia | 909,406 | 2.3% |
| South Eastern Asia | 1,592,490 | 4.1% |
| Southern Europe | 85,197 | 0.2% |
| Spain | 16,586 | 0.0% |
| Sri Lanka | 11,287 | 0.0% |
| St. Vincent and the Grenadines | 294 | 0.0% |
| Sudan | 4,300 | 0.0% |
| Sweden | 12,221 | 0.0% |
| Switzerland | 9,159 | 0.0% |
| Syria | 30,949 | 0.1% |
| Taiwan | 176,274 | 0.4% |
| Thailand | 65,335 | 0.2% |
| Trinidad and Tobago | 5,643 | 0.0% |
| Turkey | 20,474 | 0.1% |
| Uganda | 4,329 | 0.0% |
| Ukraine | 60,761 | 0.2% |
| Uruguay | 3,811 | 0.0% |
| Uzbekistan | 5,897 | 0.0% |
| Venezuela | 16,998 | 0.0% |
| Vietnam | 512,335 | 1.3% |
| West Indies | 1,019 | 0.0% |
| Western Africa | 55,751 | 0.1% |
| Western Asia | 294,418 | 0.7% |
| Western Europe | 153,868 | 0.4% |
| Yemen | 10,349 | 0.0% |
| Zaire | 1,613 | 0.0% |
| Zimbabwe | 2,561 | 0.0% | View All 137 Rows |
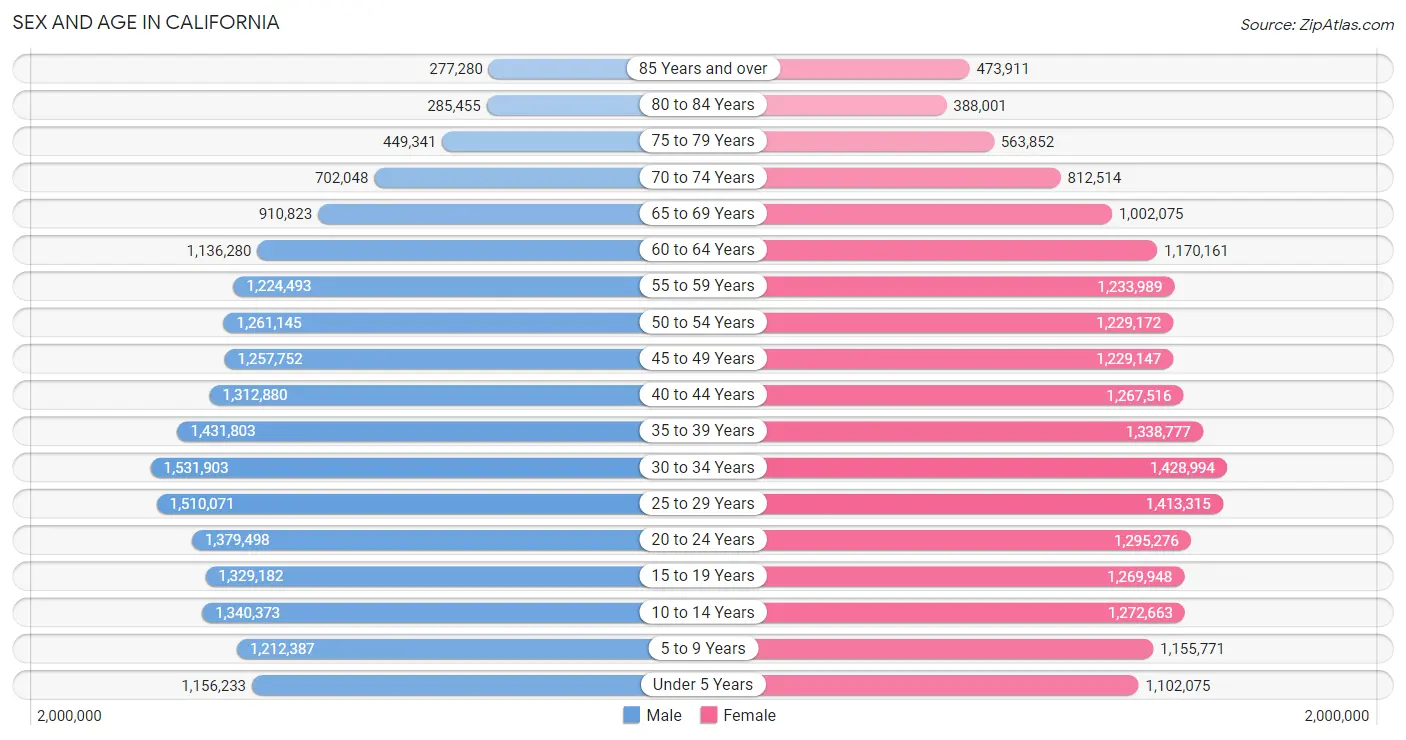
Sex and Age in California
Sex and Age in California
The most populous age groups in California are 30 to 34 Years (1,531,903 | 7.8%) for men and 30 to 34 Years (1,428,994 | 7.3%) for women.
| Age Bracket | Male | Female |
| Under 5 Years | 1,156,233 (5.9%) | 1,102,075 (5.6%) |
| 5 to 9 Years | 1,212,387 (6.1%) | 1,155,771 (5.9%) |
| 10 to 14 Years | 1,340,373 (6.8%) | 1,272,663 (6.5%) |
| 15 to 19 Years | 1,329,182 (6.7%) | 1,269,948 (6.5%) |
| 20 to 24 Years | 1,379,498 (7.0%) | 1,295,276 (6.6%) |
| 25 to 29 Years | 1,510,071 (7.7%) | 1,413,315 (7.2%) |
| 30 to 34 Years | 1,531,903 (7.8%) | 1,428,994 (7.3%) |
| 35 to 39 Years | 1,431,803 (7.3%) | 1,338,777 (6.8%) |
| 40 to 44 Years | 1,312,880 (6.7%) | 1,267,516 (6.5%) |
| 45 to 49 Years | 1,257,752 (6.4%) | 1,229,147 (6.3%) |
| 50 to 54 Years | 1,261,145 (6.4%) | 1,229,172 (6.3%) |
| 55 to 59 Years | 1,224,493 (6.2%) | 1,233,989 (6.3%) |
| 60 to 64 Years | 1,136,280 (5.8%) | 1,170,161 (6.0%) |
| 65 to 69 Years | 910,823 (4.6%) | 1,002,075 (5.1%) |
| 70 to 74 Years | 702,048 (3.6%) | 812,514 (4.1%) |
| 75 to 79 Years | 449,341 (2.3%) | 563,852 (2.9%) |
| 80 to 84 Years | 285,455 (1.5%) | 388,001 (2.0%) |
| 85 Years and over | 277,280 (1.4%) | 473,911 (2.4%) |
| Total | 19,708,947 (100.0%) | 19,647,157 (100.0%) |
Families and Households in California
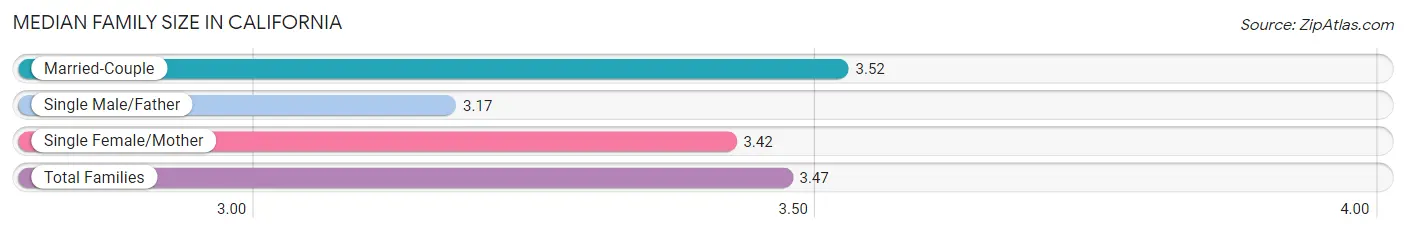
Median Family Size in California
The median family size in California is 3.47 persons per family, with married-couple families (6,545,790 | 72.0%) accounting for the largest median family size of 3.52 persons per family. On the other hand, single male/father families (830,462 | 9.1%) represent the smallest median family size with 3.17 persons per family.
| Family Type | # Families | Family Size |
| Married-Couple | 6,545,790 (72.0%) | 3.52 |
| Single Male/Father | 830,462 (9.1%) | 3.17 |
| Single Female/Mother | 1,717,455 (18.9%) | 3.42 |
| Total Families | 9,093,707 (100.0%) | 3.47 |
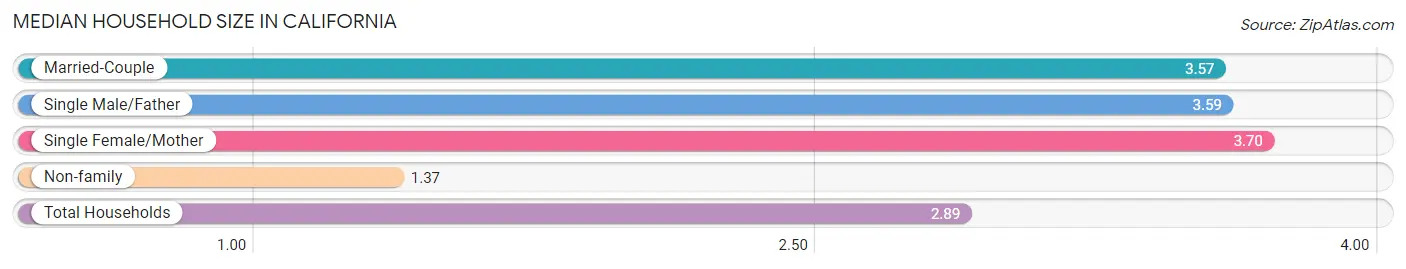
Median Household Size in California
The median household size in California is 2.89 persons per household, with single female/mother households (1,717,455 | 12.9%) accounting for the largest median household size of 3.7 persons per household. non-family households (4,222,115 | 31.7%) represent the smallest median household size with 1.37 persons per household.
| Household Type | # Households | Household Size |
| Married-Couple | 6,545,790 (49.2%) | 3.57 |
| Single Male/Father | 830,462 (6.2%) | 3.59 |
| Single Female/Mother | 1,717,455 (12.9%) | 3.70 |
| Non-family | 4,222,115 (31.7%) | 1.37 |
| Total Households | 13,315,822 (100.0%) | 2.89 |
Household Size by Marriage Status in California
Out of a total of 13,315,822 households in California, 9,093,707 (68.3%) are family households, while 4,222,115 (31.7%) are nonfamily households. The most numerous type of family households are 2-person households, comprising 3,239,966, and the most common type of nonfamily households are 1-person households, comprising 3,176,768.
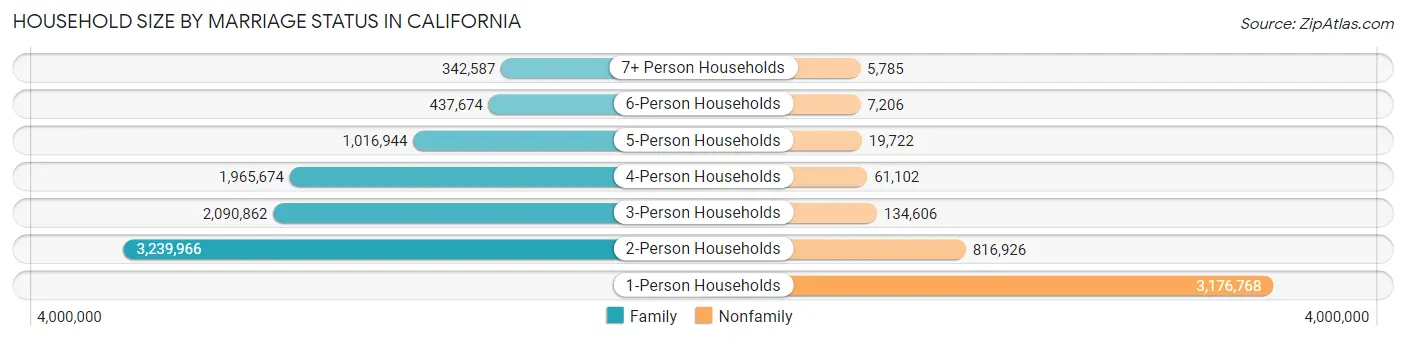
| Household Size | Family Households | Nonfamily Households |
| 1-Person Households | - | 3,176,768 (23.9%) |
| 2-Person Households | 3,239,966 (24.3%) | 816,926 (6.1%) |
| 3-Person Households | 2,090,862 (15.7%) | 134,606 (1.0%) |
| 4-Person Households | 1,965,674 (14.8%) | 61,102 (0.5%) |
| 5-Person Households | 1,016,944 (7.6%) | 19,722 (0.2%) |
| 6-Person Households | 437,674 (3.3%) | 7,206 (0.1%) |
| 7+ Person Households | 342,587 (2.6%) | 5,785 (0.0%) |
| Total | 9,093,707 (68.3%) | 4,222,115 (31.7%) |
Female Fertility in California
Fertility by Age in California
Average fertility rate in California is 48.0 births per 1,000 women. Women in the age bracket of 20 to 34 years have the highest fertility rate with 72.0 births per 1,000 women. Women in the age bracket of 20 to 34 years acount for 64.6% of all women with births.
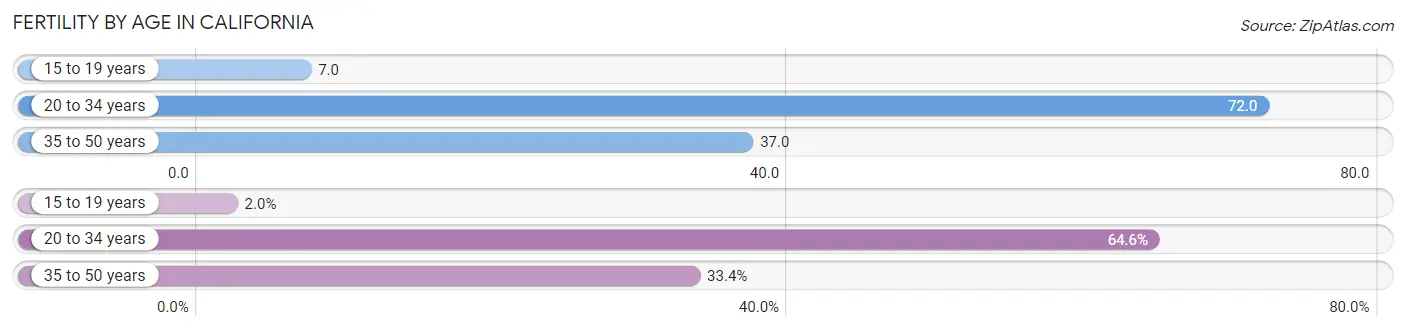
| Age Bracket | Women with Births | Births / 1,000 Women |
| 15 to 19 years | 9,272 (2.0%) | 7.0 |
| 20 to 34 years | 297,325 (64.6%) | 72.0 |
| 35 to 50 years | 153,763 (33.4%) | 37.0 |
| Total | 460,360 (100.0%) | 48.0 |
Fertility by Age by Marriage Status in California
69.4% of women with births (460,360) in California are married. The highest percentage of unmarried women with births falls into 15 to 19 years age bracket with 83.2% of them unmarried at the time of birth, while the lowest percentage of unmarried women with births belong to 35 to 50 years age bracket with 19.8% of them unmarried.
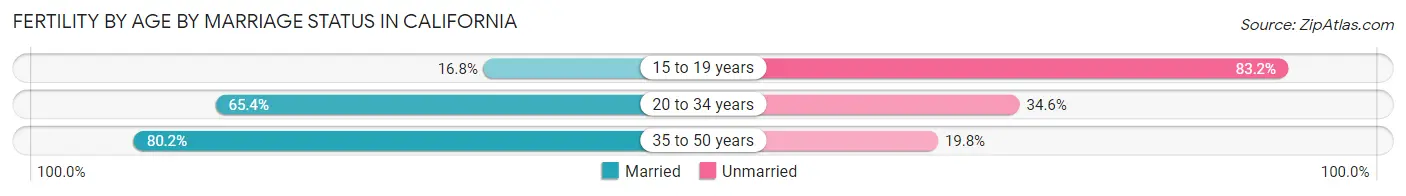
| Age Bracket | Married | Unmarried |
| 15 to 19 years | 1,558 (16.8%) | 7,714 (83.2%) |
| 20 to 34 years | 194,451 (65.4%) | 102,874 (34.6%) |
| 35 to 50 years | 123,318 (80.2%) | 30,445 (19.8%) |
| Total | 319,490 (69.4%) | 140,870 (30.6%) |
Fertility by Education in California
Average fertility rate in California is 48.0 births per 1,000 women. Women with the education attainment of graduate degree have the highest fertility rate of 60.0 births per 1,000 women, while women with the education attainment of less than high school have the lowest fertility at 30.0 births per 1,000 women. Women with the education attainment of college or associate's degree represent 29.9% of all women with births.
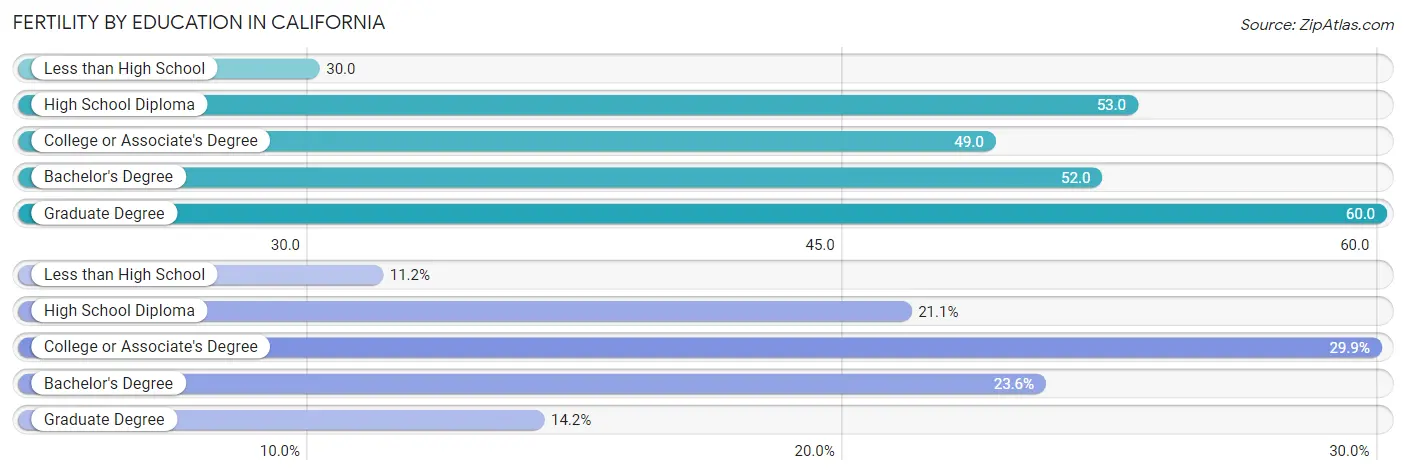
| Educational Attainment | Women with Births | Births / 1,000 Women |
| Less than High School | 51,500 (11.2%) | 30.0 |
| High School Diploma | 97,112 (21.1%) | 53.0 |
| College or Associate's Degree | 137,625 (29.9%) | 49.0 |
| Bachelor's Degree | 108,707 (23.6%) | 52.0 |
| Graduate Degree | 65,416 (14.2%) | 60.0 |
| Total | 460,360 (100.0%) | 48.0 |
Fertility by Education by Marriage Status in California
30.6% of women with births in California are unmarried. Women with the educational attainment of graduate degree are most likely to be married with 92.0% of them married at childbirth, while women with the educational attainment of less than high school are least likely to be married with 45.4% of them unmarried at childbirth.
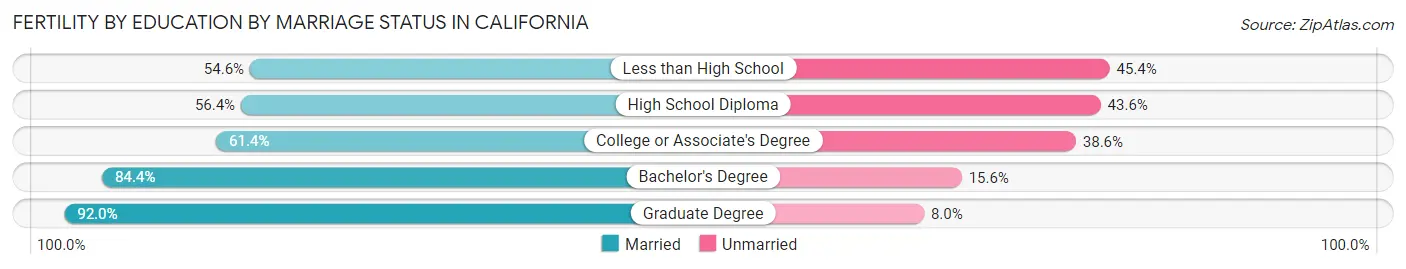
| Educational Attainment | Married | Unmarried |
| Less than High School | 28,119 (54.6%) | 23,381 (45.4%) |
| High School Diploma | 54,771 (56.4%) | 42,341 (43.6%) |
| College or Associate's Degree | 84,502 (61.4%) | 53,123 (38.6%) |
| Bachelor's Degree | 91,749 (84.4%) | 16,958 (15.6%) |
| Graduate Degree | 60,183 (92.0%) | 5,233 (8.0%) |
| Total | 319,490 (69.4%) | 140,870 (30.6%) |
Employment Characteristics in California
Employment by Class of Employer in California
Among the 18,353,469 employed individuals in California, private company employees (12,200,444 | 66.5%), local government employees (1,481,509 | 8.1%), and self-employed (not incorporated) (1,361,235 | 7.4%) make up the most common classes of employment.
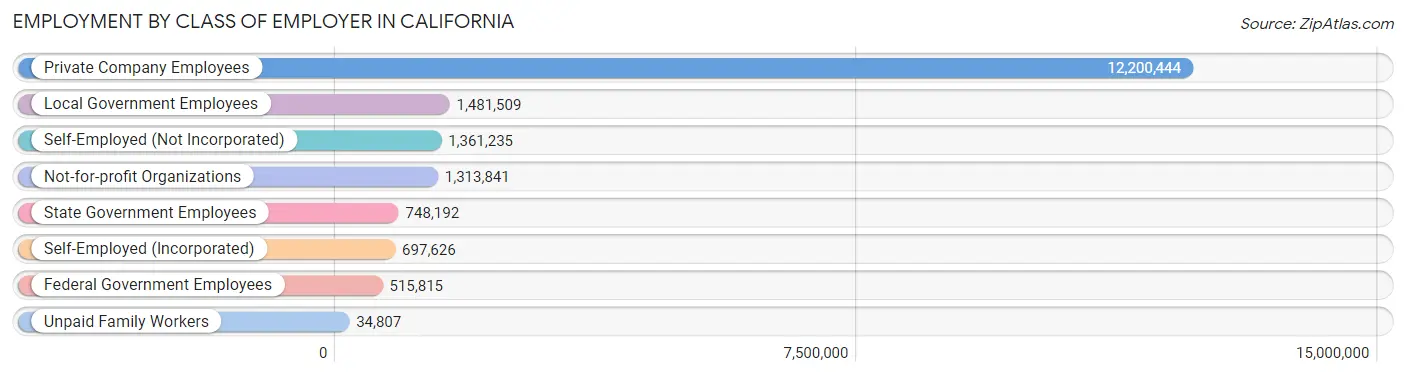
| Employer Class | # Employees | % Employees |
| Private Company Employees | 12,200,444 | 66.5% |
| Self-Employed (Incorporated) | 697,626 | 3.8% |
| Self-Employed (Not Incorporated) | 1,361,235 | 7.4% |
| Not-for-profit Organizations | 1,313,841 | 7.2% |
| Local Government Employees | 1,481,509 | 8.1% |
| State Government Employees | 748,192 | 4.1% |
| Federal Government Employees | 515,815 | 2.8% |
| Unpaid Family Workers | 34,807 | 0.2% |
| Total | 18,353,469 | 100.0% |
Employment Status by Age in California
According to the labor force statistics for California, out of the total population over 16 years of age (31,601,862), 63.8% or 20,161,988 individuals are in the labor force, with 6.4% or 1,290,367 of them unemployed. The age group with the highest labor force participation rate is 30 to 34 years, with 83.2% or 2,463,466 individuals in the labor force. Within the labor force, the 16 to 19 years age range has the highest percentage of unemployed individuals, with 17.9% or 116,036 of them being unemployed.
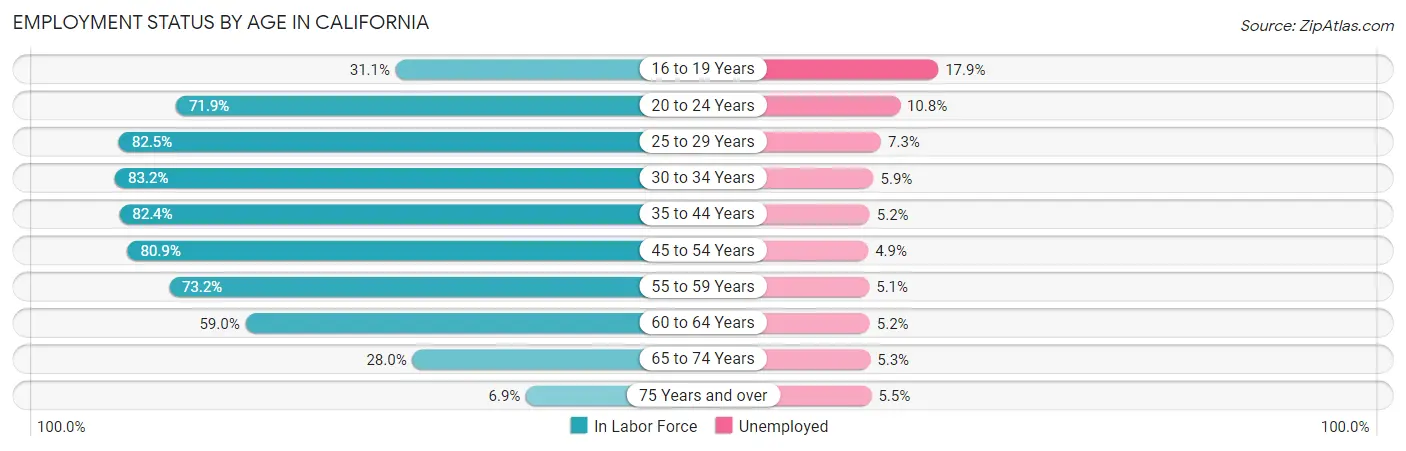
| Age Bracket | In Labor Force | Unemployed |
| 16 to 19 Years | 648,245 (31.1%) | 116,036 (17.9%) |
| 20 to 24 Years | 1,923,163 (71.9%) | 207,702 (10.8%) |
| 25 to 29 Years | 2,411,793 (82.5%) | 176,061 (7.3%) |
| 30 to 34 Years | 2,463,466 (83.2%) | 145,344 (5.9%) |
| 35 to 44 Years | 4,409,204 (82.4%) | 229,279 (5.2%) |
| 45 to 54 Years | 4,026,568 (80.9%) | 197,302 (4.9%) |
| 55 to 59 Years | 1,799,609 (73.2%) | 91,780 (5.1%) |
| 60 to 64 Years | 1,360,800 (59.0%) | 70,762 (5.2%) |
| 65 to 74 Years | 959,689 (28.0%) | 50,864 (5.3%) |
| 75 Years and over | 168,211 (6.9%) | 9,252 (5.5%) |
| Total | 20,161,988 (63.8%) | 1,290,367 (6.4%) |
Employment Status by Educational Attainment in California
According to labor force statistics for California, 78.5% of individuals (16,467,257) out of the total population between 25 and 64 years of age (20,977,398) are in the labor force, with 5.5% or 905,699 of them being unemployed. The group with the highest labor force participation rate are those with the educational attainment of bachelor's degree or higher, with 86.6% or 6,663,296 individuals in the labor force. Within the labor force, individuals with less than high school education have the highest percentage of unemployment, with 7.5% or 152,653 of them being unemployed.
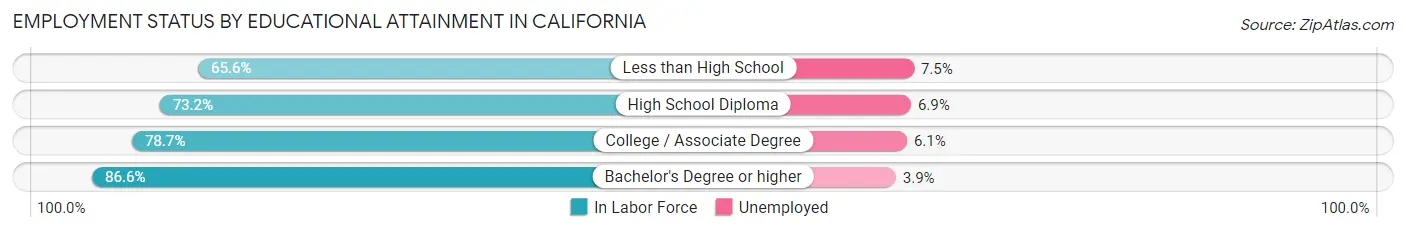
| Educational Attainment | In Labor Force | Unemployed |
| Less than High School | 2,035,378 (65.6%) | 232,703 (7.5%) |
| High School Diploma | 3,148,587 (73.2%) | 296,793 (6.9%) |
| College / Associate Degree | 4,626,775 (78.7%) | 358,619 (6.1%) |
| Bachelor's Degree or higher | 6,663,296 (86.6%) | 300,079 (3.9%) |
| Total | 16,467,257 (78.5%) | 1,153,757 (5.5%) |
Employment Occupations by Sex in California
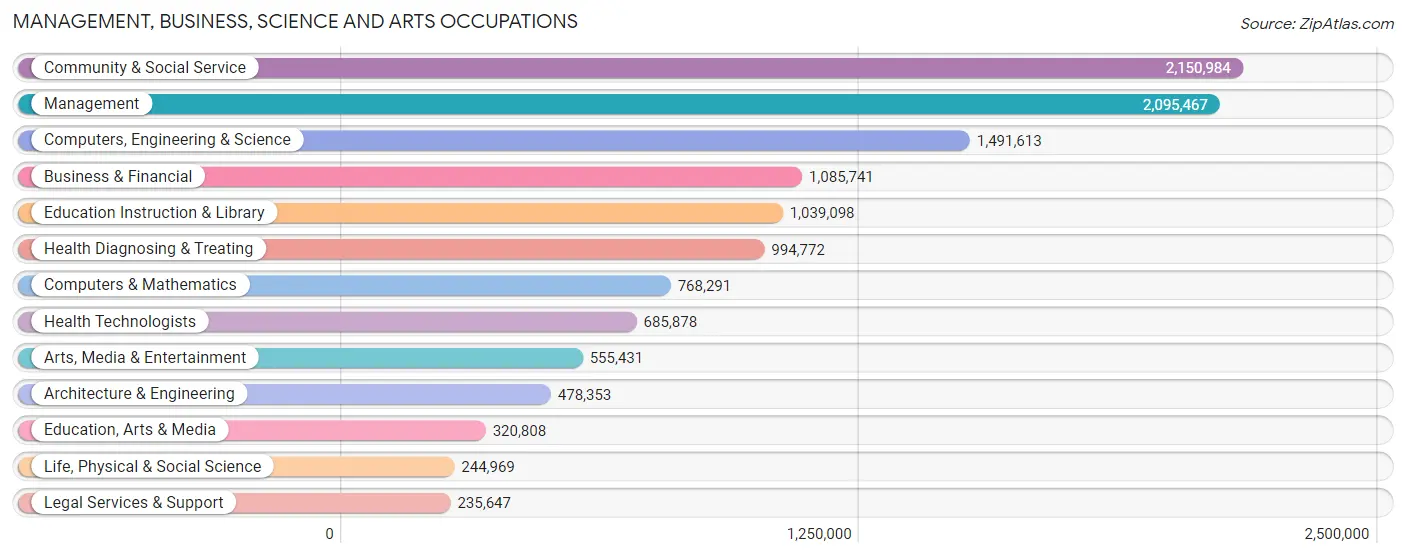
Management, Business, Science and Arts Occupations
The most common Management, Business, Science and Arts occupations in California are Community & Social Service (2,150,984 | 11.5%), Management (2,095,467 | 11.2%), Computers, Engineering & Science (1,491,613 | 8.0%), Business & Financial (1,085,741 | 5.8%), and Education Instruction & Library (1,039,098 | 5.6%).
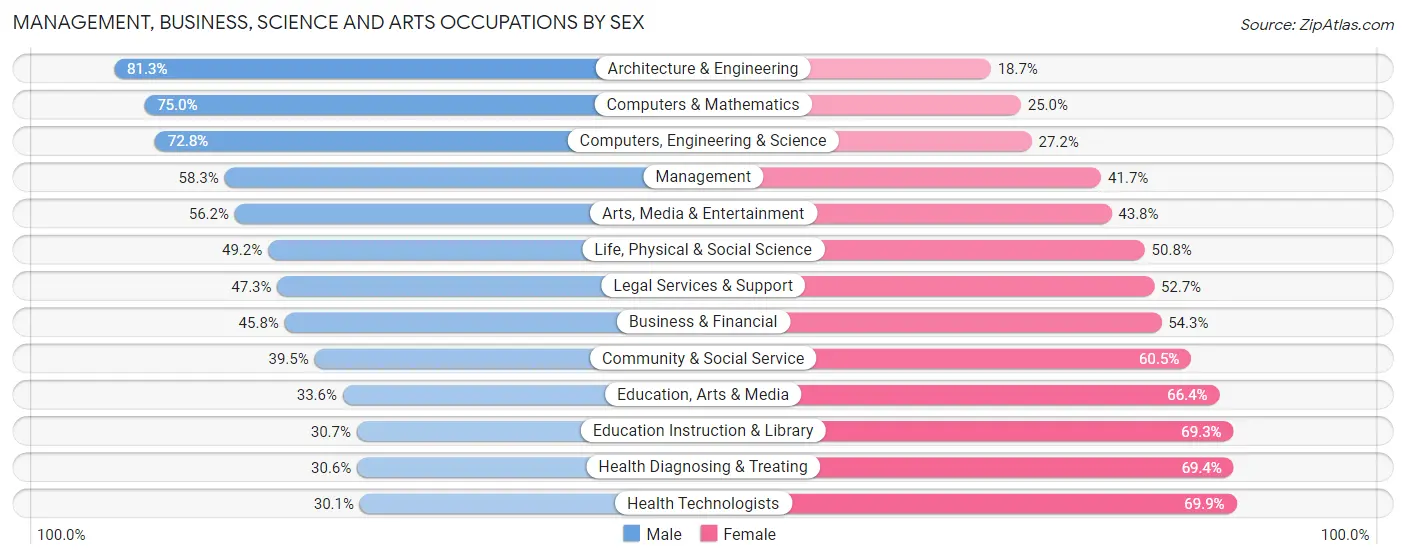
Management, Business, Science and Arts Occupations by Sex
Within the Management, Business, Science and Arts occupations in California, the most male-oriented occupations are Architecture & Engineering (81.3%), Computers & Mathematics (75.0%), and Computers, Engineering & Science (72.8%), while the most female-oriented occupations are Health Technologists (69.9%), Health Diagnosing & Treating (69.4%), and Education Instruction & Library (69.3%).
| Occupation | Male | Female |
| Management | 1,221,245 (58.3%) | 874,222 (41.7%) |
| Business & Financial | 496,753 (45.8%) | 588,988 (54.2%) |
| Computers, Engineering & Science | 1,086,076 (72.8%) | 405,537 (27.2%) |
| Computers & Mathematics | 576,551 (75.0%) | 191,740 (25.0%) |
| Architecture & Engineering | 388,980 (81.3%) | 89,373 (18.7%) |
| Life, Physical & Social Science | 120,545 (49.2%) | 124,424 (50.8%) |
| Community & Social Service | 850,165 (39.5%) | 1,300,819 (60.5%) |
| Education, Arts & Media | 107,868 (33.6%) | 212,940 (66.4%) |
| Legal Services & Support | 111,402 (47.3%) | 124,245 (52.7%) |
| Education Instruction & Library | 318,975 (30.7%) | 720,123 (69.3%) |
| Arts, Media & Entertainment | 311,920 (56.2%) | 243,511 (43.8%) |
| Health Diagnosing & Treating | 304,819 (30.6%) | 689,953 (69.4%) |
| Health Technologists | 206,334 (30.1%) | 479,544 (69.9%) |
| Total (Category) | 3,959,058 (50.6%) | 3,859,519 (49.4%) |
| Total (Overall) | 10,164,048 (54.3%) | 8,565,750 (45.7%) |
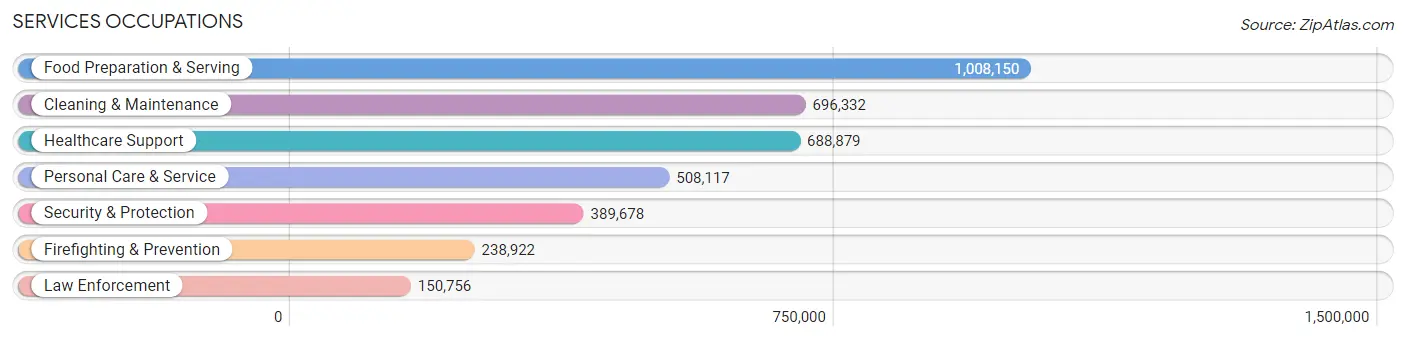
Services Occupations
The most common Services occupations in California are Food Preparation & Serving (1,008,150 | 5.4%), Cleaning & Maintenance (696,332 | 3.7%), Healthcare Support (688,879 | 3.7%), Personal Care & Service (508,117 | 2.7%), and Security & Protection (389,678 | 2.1%).
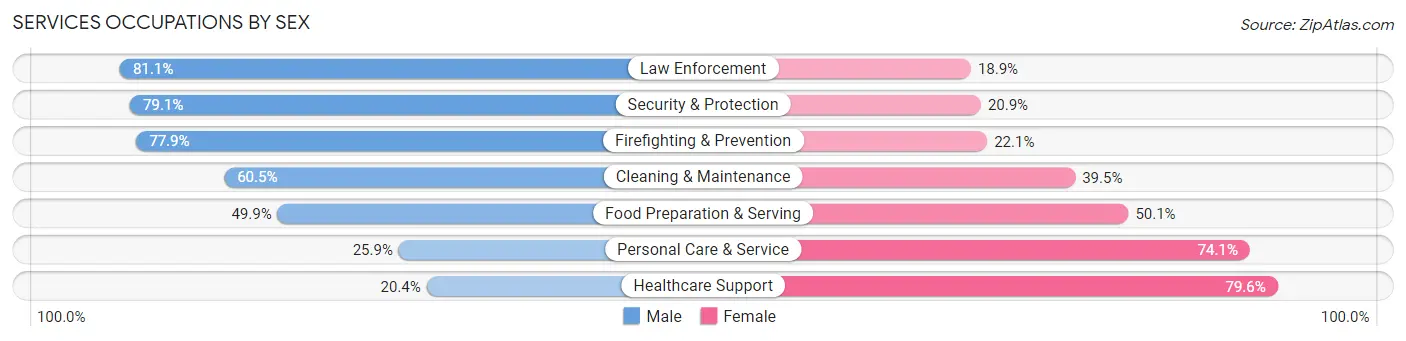
Services Occupations by Sex
Within the Services occupations in California, the most male-oriented occupations are Law Enforcement (81.1%), Security & Protection (79.1%), and Firefighting & Prevention (77.9%), while the most female-oriented occupations are Healthcare Support (79.6%), Personal Care & Service (74.1%), and Food Preparation & Serving (50.1%).
| Occupation | Male | Female |
| Healthcare Support | 140,557 (20.4%) | 548,322 (79.6%) |
| Security & Protection | 308,359 (79.1%) | 81,319 (20.9%) |
| Firefighting & Prevention | 186,075 (77.9%) | 52,847 (22.1%) |
| Law Enforcement | 122,284 (81.1%) | 28,472 (18.9%) |
| Food Preparation & Serving | 503,283 (49.9%) | 504,867 (50.1%) |
| Cleaning & Maintenance | 420,985 (60.5%) | 275,347 (39.5%) |
| Personal Care & Service | 131,669 (25.9%) | 376,448 (74.1%) |
| Total (Category) | 1,504,853 (45.7%) | 1,786,303 (54.3%) |
| Total (Overall) | 10,164,048 (54.3%) | 8,565,750 (45.7%) |
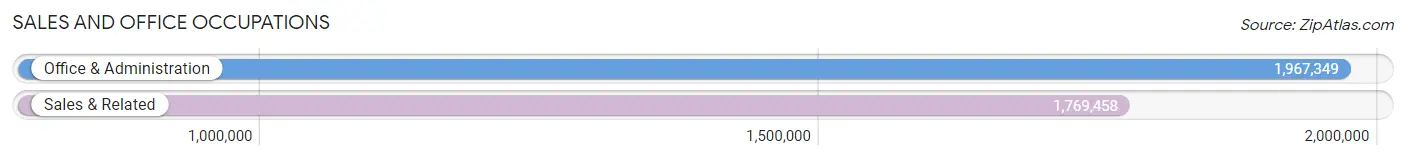
Sales and Office Occupations
The most common Sales and Office occupations in California are Office & Administration (1,967,349 | 10.5%), and Sales & Related (1,769,458 | 9.5%).
Sales and Office Occupations by Sex
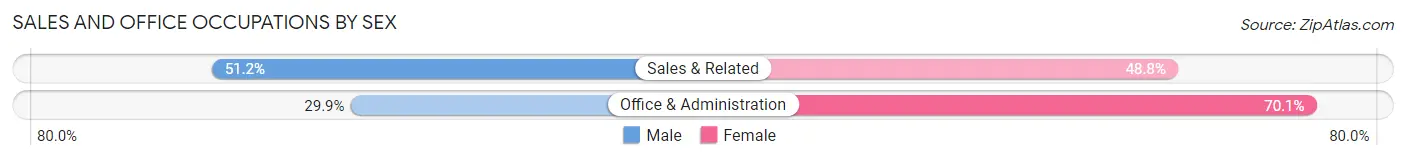
| Occupation | Male | Female |
| Sales & Related | 906,054 (51.2%) | 863,404 (48.8%) |
| Office & Administration | 587,937 (29.9%) | 1,379,412 (70.1%) |
| Total (Category) | 1,493,991 (40.0%) | 2,242,816 (60.0%) |
| Total (Overall) | 10,164,048 (54.3%) | 8,565,750 (45.7%) |
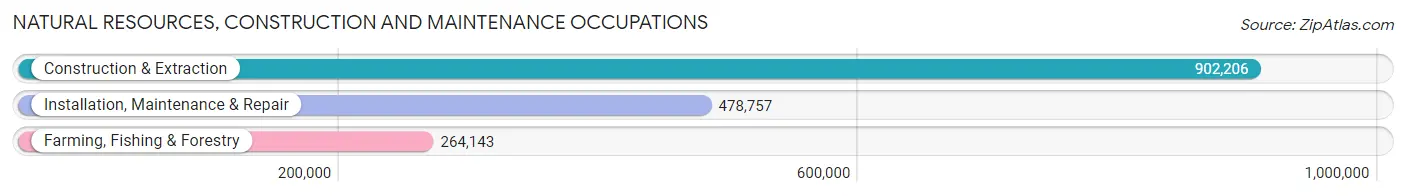
Natural Resources, Construction and Maintenance Occupations
The most common Natural Resources, Construction and Maintenance occupations in California are Construction & Extraction (902,206 | 4.8%), Installation, Maintenance & Repair (478,757 | 2.6%), and Farming, Fishing & Forestry (264,143 | 1.4%).
Natural Resources, Construction and Maintenance Occupations by Sex
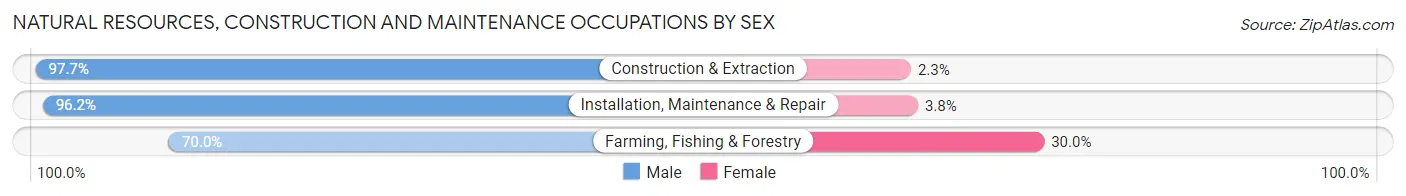
| Occupation | Male | Female |
| Farming, Fishing & Forestry | 184,818 (70.0%) | 79,325 (30.0%) |
| Construction & Extraction | 881,420 (97.7%) | 20,786 (2.3%) |
| Installation, Maintenance & Repair | 460,706 (96.2%) | 18,051 (3.8%) |
| Total (Category) | 1,526,944 (92.8%) | 118,162 (7.2%) |
| Total (Overall) | 10,164,048 (54.3%) | 8,565,750 (45.7%) |
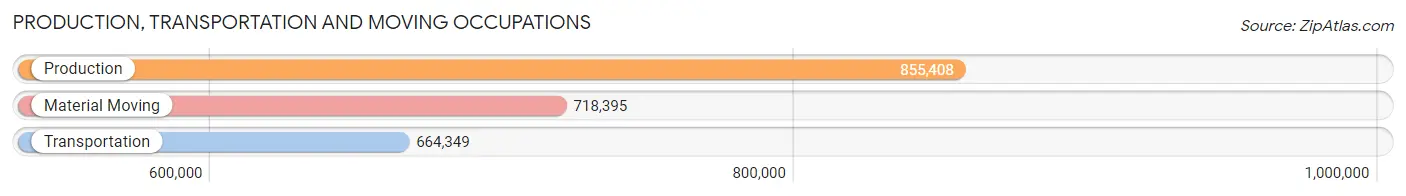
Production, Transportation and Moving Occupations
The most common Production, Transportation and Moving occupations in California are Production (855,408 | 4.6%), Material Moving (718,395 | 3.8%), and Transportation (664,349 | 3.5%).
Production, Transportation and Moving Occupations by Sex
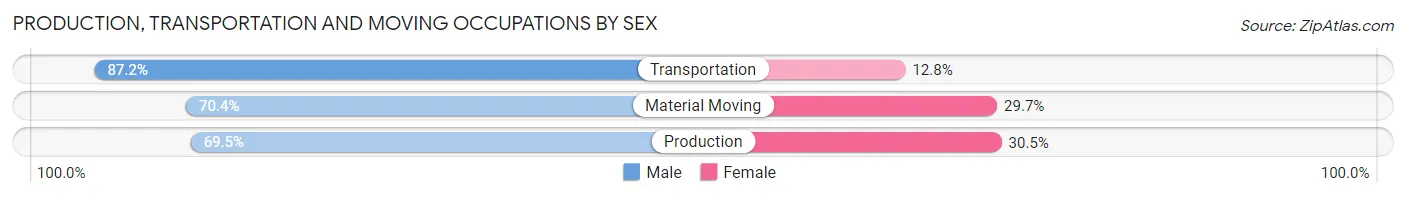
| Occupation | Male | Female |
| Production | 594,704 (69.5%) | 260,704 (30.5%) |
| Transportation | 579,128 (87.2%) | 85,221 (12.8%) |
| Material Moving | 505,370 (70.4%) | 213,025 (29.6%) |
| Total (Category) | 1,679,202 (75.0%) | 558,950 (25.0%) |
| Total (Overall) | 10,164,048 (54.3%) | 8,565,750 (45.7%) |
Employment Industries by Sex in California
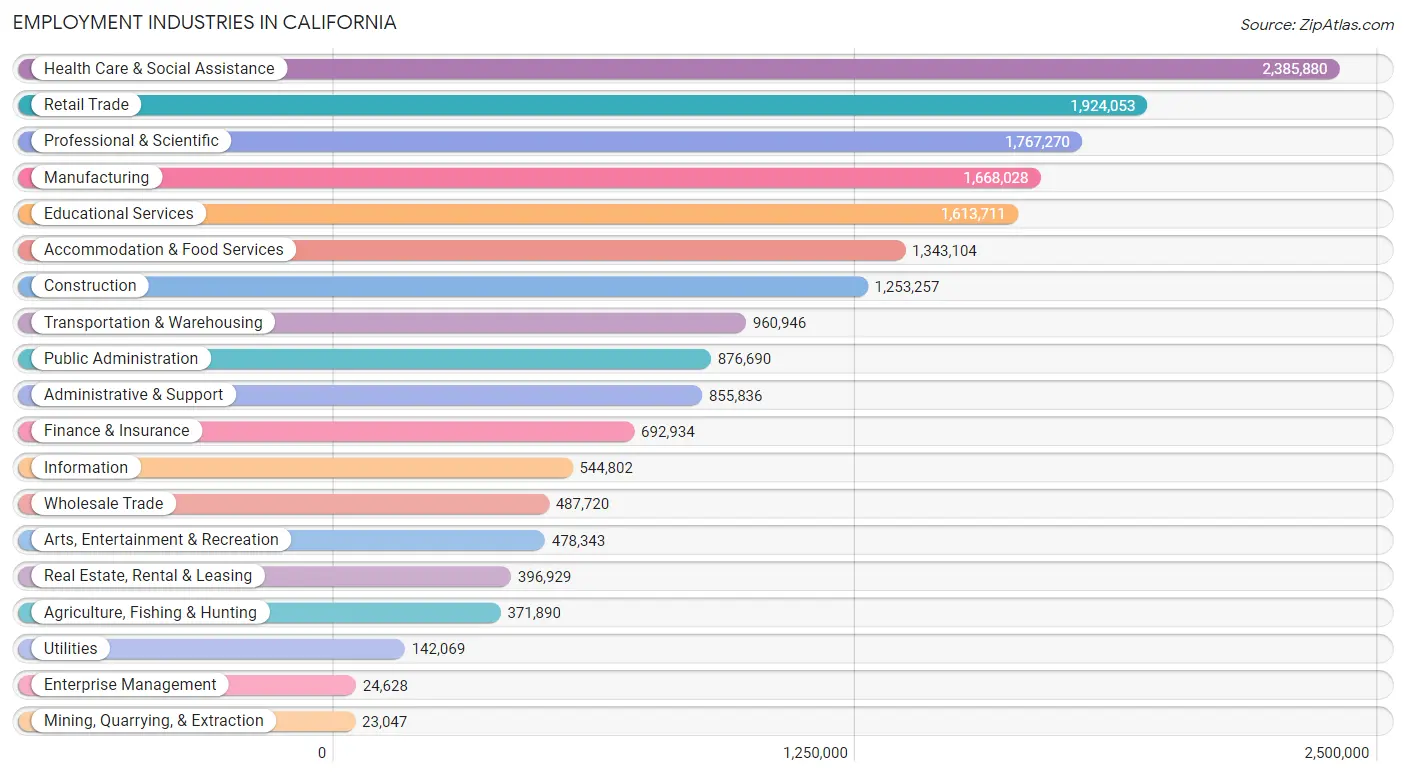
Employment Industries in California
The major employment industries in California include Health Care & Social Assistance (2,385,880 | 12.7%), Retail Trade (1,924,053 | 10.3%), Professional & Scientific (1,767,270 | 9.4%), Manufacturing (1,668,028 | 8.9%), and Educational Services (1,613,711 | 8.6%).
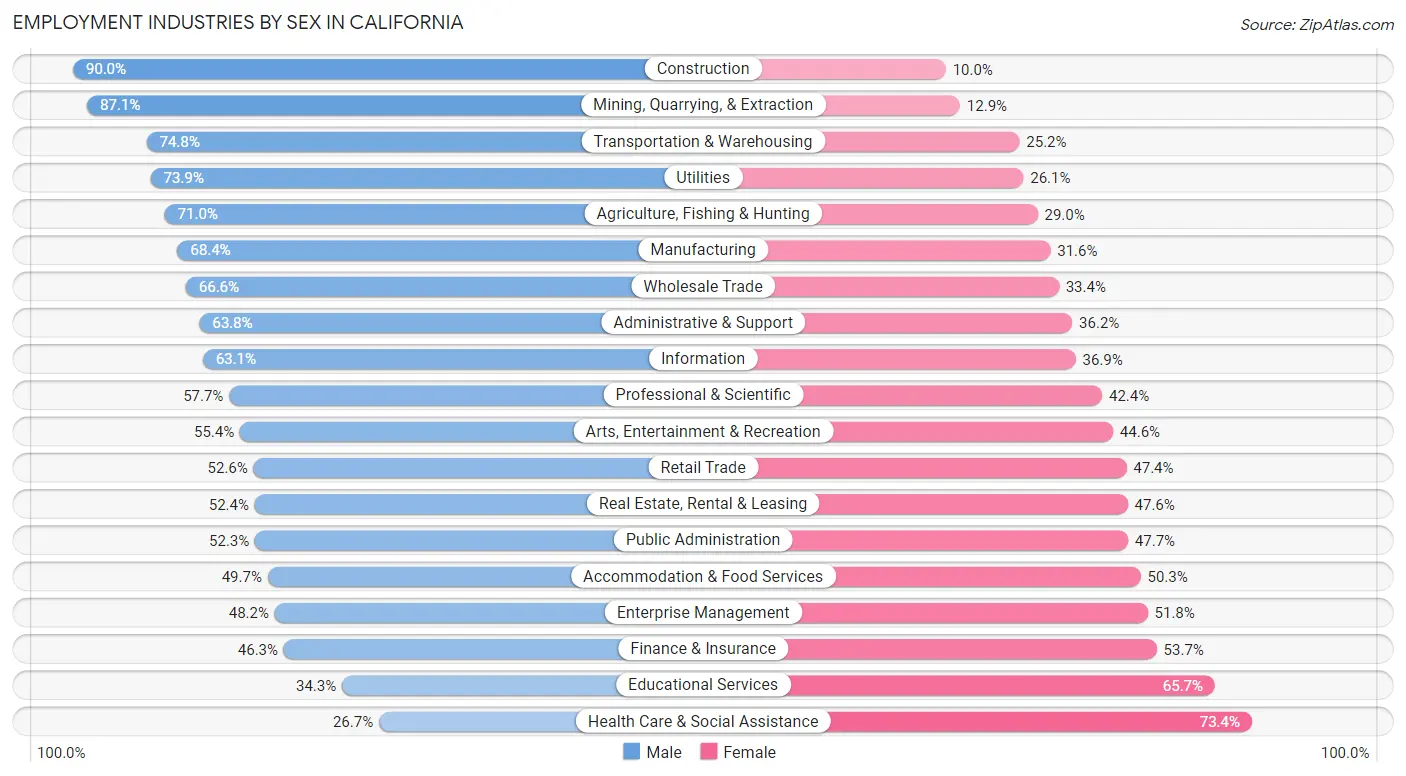
Employment Industries by Sex in California
The California industries that see more men than women are Construction (90.0%), Mining, Quarrying, & Extraction (87.1%), and Transportation & Warehousing (74.8%), whereas the industries that tend to have a higher number of women are Health Care & Social Assistance (73.4%), Educational Services (65.7%), and Finance & Insurance (53.7%).
| Industry | Male | Female |
| Agriculture, Fishing & Hunting | 264,040 (71.0%) | 107,850 (29.0%) |
| Mining, Quarrying, & Extraction | 20,067 (87.1%) | 2,980 (12.9%) |
| Construction | 1,128,035 (90.0%) | 125,222 (10.0%) |
| Manufacturing | 1,140,264 (68.4%) | 527,764 (31.6%) |
| Wholesale Trade | 324,889 (66.6%) | 162,831 (33.4%) |
| Retail Trade | 1,012,211 (52.6%) | 911,842 (47.4%) |
| Transportation & Warehousing | 718,401 (74.8%) | 242,545 (25.2%) |
| Utilities | 105,048 (73.9%) | 37,021 (26.1%) |
| Information | 343,901 (63.1%) | 200,901 (36.9%) |
| Finance & Insurance | 321,106 (46.3%) | 371,828 (53.7%) |
| Real Estate, Rental & Leasing | 207,826 (52.4%) | 189,103 (47.6%) |
| Professional & Scientific | 1,018,916 (57.7%) | 748,354 (42.3%) |
| Enterprise Management | 11,874 (48.2%) | 12,754 (51.8%) |
| Administrative & Support | 546,246 (63.8%) | 309,590 (36.2%) |
| Educational Services | 553,482 (34.3%) | 1,060,229 (65.7%) |
| Health Care & Social Assistance | 635,849 (26.7%) | 1,750,031 (73.4%) |
| Arts, Entertainment & Recreation | 264,985 (55.4%) | 213,358 (44.6%) |
| Accommodation & Food Services | 667,208 (49.7%) | 675,896 (50.3%) |
| Public Administration | 458,424 (52.3%) | 418,266 (47.7%) |
| Total | 10,164,048 (54.3%) | 8,565,750 (45.7%) |
Education in California
School Enrollment in California
The most common levels of schooling among the 10,132,531 students in California are college / undergraduate (2,542,432 | 25.1%), high school (2,144,625 | 21.2%), and middle school (1,995,214 | 19.7%).
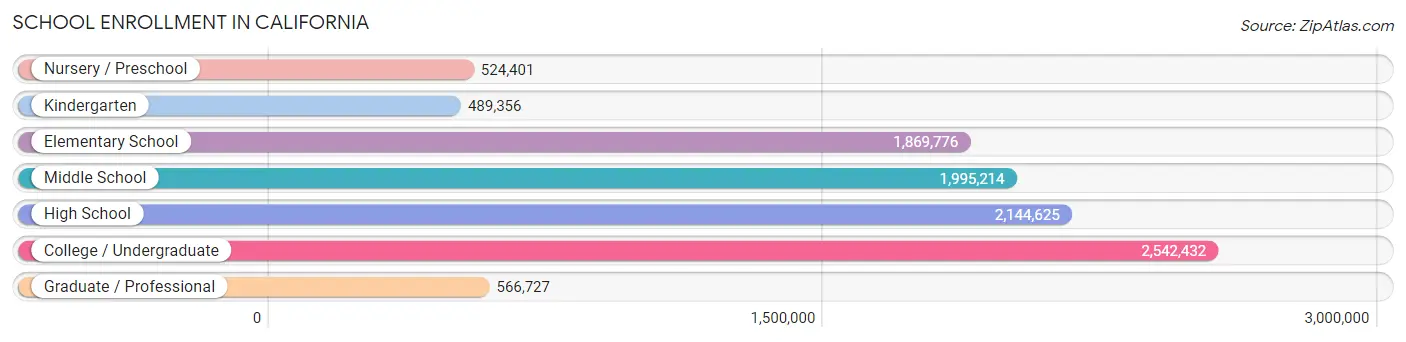
| School Level | # Students | % Students |
| Nursery / Preschool | 524,401 | 5.2% |
| Kindergarten | 489,356 | 4.8% |
| Elementary School | 1,869,776 | 18.4% |
| Middle School | 1,995,214 | 19.7% |
| High School | 2,144,625 | 21.2% |
| College / Undergraduate | 2,542,432 | 25.1% |
| Graduate / Professional | 566,727 | 5.6% |
| Total | 10,132,531 | 100.0% |
School Enrollment by Age by Funding Source in California
Out of a total of 10,132,531 students who are enrolled in schools in California, 1,479,350 (14.6%) attend a private institution, while the remaining 8,653,181 (85.4%) are enrolled in public schools. The age group of 3 to 4 year olds has the highest likelihood of being enrolled in private schools, with 194,524 (45.4% in the age bracket) enrolled. Conversely, the age group of 15 to 17 year olds has the lowest likelihood of being enrolled in a private school, with 1,366,926 (91.5% in the age bracket) attending a public institution.
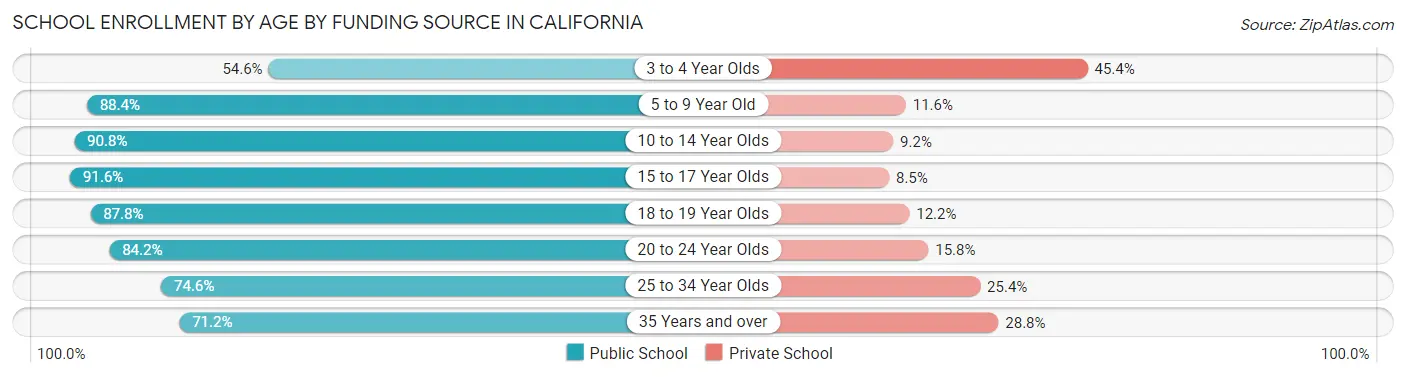
| Age Bracket | Public School | Private School |
| 3 to 4 Year Olds | 233,798 (54.6%) | 194,524 (45.4%) |
| 5 to 9 Year Old | 1,981,844 (88.4%) | 259,237 (11.6%) |
| 10 to 14 Year Olds | 2,321,462 (90.8%) | 235,795 (9.2%) |
| 15 to 17 Year Olds | 1,366,926 (91.5%) | 126,226 (8.5%) |
| 18 to 19 Year Olds | 711,354 (87.8%) | 99,014 (12.2%) |
| 20 to 24 Year Olds | 1,022,599 (84.2%) | 191,389 (15.8%) |
| 25 to 34 Year Olds | 592,849 (74.6%) | 202,072 (25.4%) |
| 35 Years and over | 422,467 (71.2%) | 170,975 (28.8%) |
| Total | 8,653,181 (85.4%) | 1,479,350 (14.6%) |
Educational Attainment by Field of Study in California
Business (1,788,110 | 17.3%), social sciences (1,071,065 | 10.4%), engineering (1,025,132 | 9.9%), science & technology (853,382 | 8.3%), and bio, nature & agricultural (699,621 | 6.8%) are the most common fields of study among 10,331,064 individuals in California who have obtained a bachelor's degree or higher.
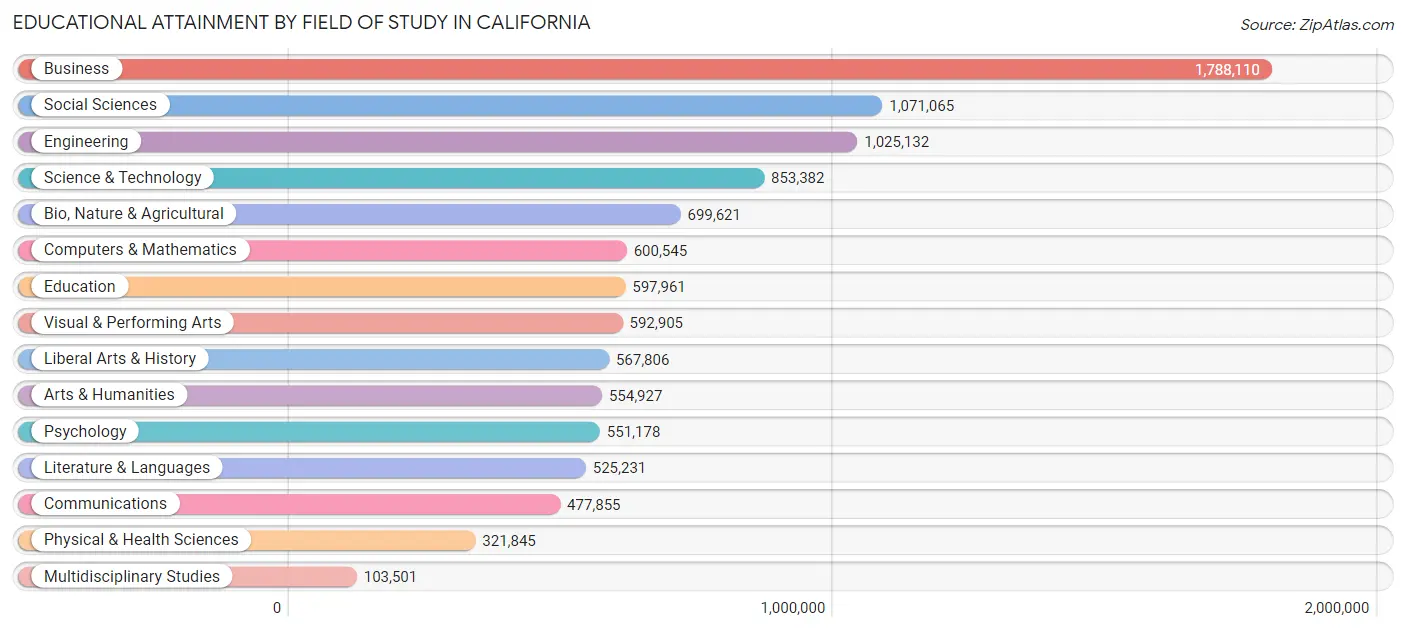
| Field of Study | # Graduates | % Graduates |
| Computers & Mathematics | 600,545 | 5.8% |
| Bio, Nature & Agricultural | 699,621 | 6.8% |
| Physical & Health Sciences | 321,845 | 3.1% |
| Psychology | 551,178 | 5.3% |
| Social Sciences | 1,071,065 | 10.4% |
| Engineering | 1,025,132 | 9.9% |
| Multidisciplinary Studies | 103,501 | 1.0% |
| Science & Technology | 853,382 | 8.3% |
| Business | 1,788,110 | 17.3% |
| Education | 597,961 | 5.8% |
| Literature & Languages | 525,231 | 5.1% |
| Liberal Arts & History | 567,806 | 5.5% |
| Visual & Performing Arts | 592,905 | 5.7% |
| Communications | 477,855 | 4.6% |
| Arts & Humanities | 554,927 | 5.4% |
| Total | 10,331,064 | 100.0% |
Transportation & Commute in California
Vehicle Availability by Sex in California
The most prevalent vehicle ownership categories in California are males with 2 vehicles (3,775,910, accounting for 38.0%) and females with 2 vehicles (3,039,096, making up 45.9%).
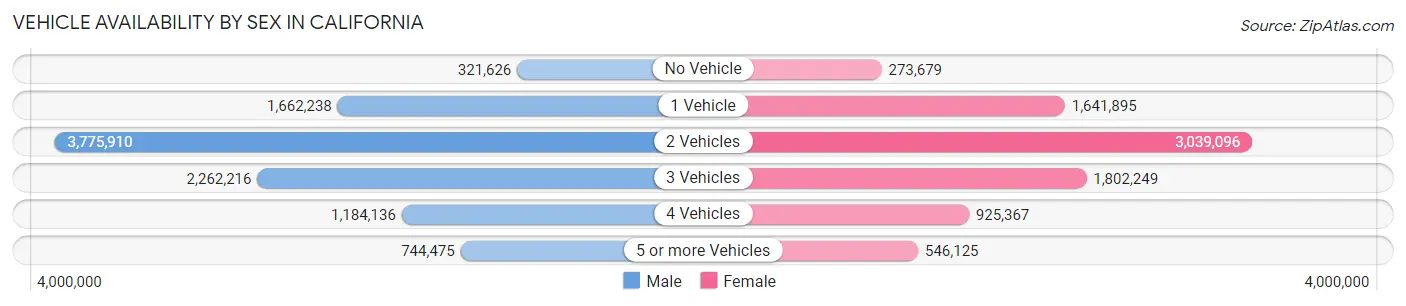
| Vehicles Available | Male | Female |
| No Vehicle | 321,626 (3.2%) | 273,679 (3.3%) |
| 1 Vehicle | 1,662,238 (16.7%) | 1,641,895 (20.0%) |
| 2 Vehicles | 3,775,910 (38.0%) | 3,039,096 (36.9%) |
| 3 Vehicles | 2,262,216 (22.7%) | 1,802,249 (21.9%) |
| 4 Vehicles | 1,184,136 (11.9%) | 925,367 (11.3%) |
| 5 or more Vehicles | 744,475 (7.5%) | 546,125 (6.6%) |
| Total | 9,950,601 (100.0%) | 8,228,411 (100.0%) |
Commute Time in California
The most frequently occuring commute durations in California are 30 to 34 minutes (2,381,423 commuters, 15.0%), 15 to 19 minutes (2,381,256 commuters, 15.0%), and 20 to 24 minutes (2,271,253 commuters, 14.3%).
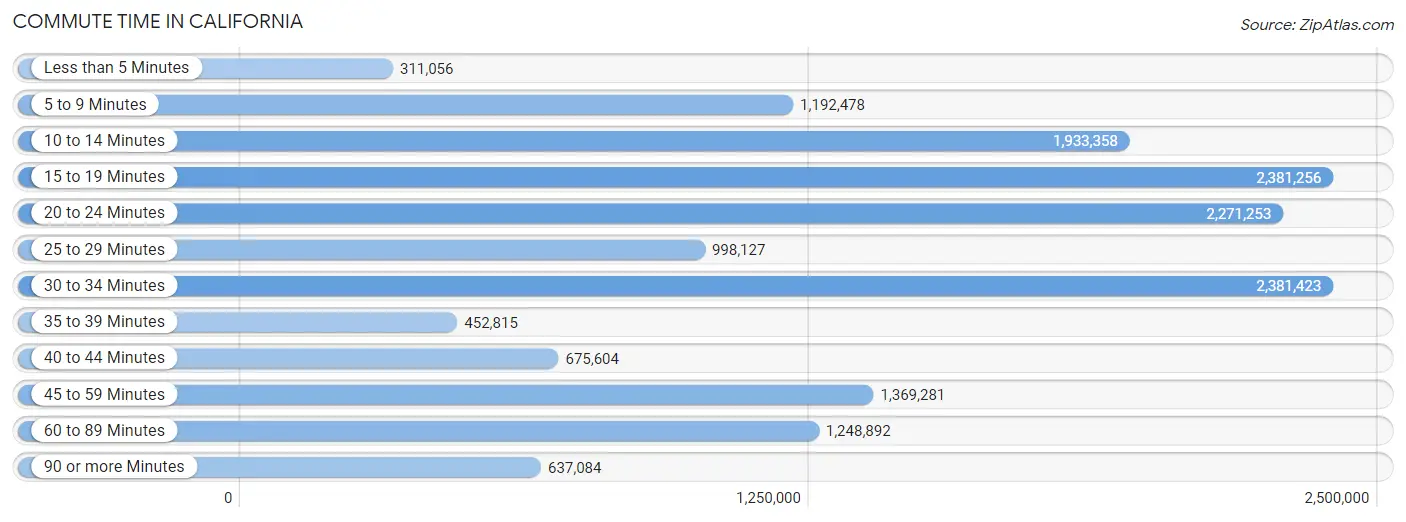
| Commute Time | # Commuters | % Commuters |
| Less than 5 Minutes | 311,056 | 2.0% |
| 5 to 9 Minutes | 1,192,478 | 7.5% |
| 10 to 14 Minutes | 1,933,358 | 12.2% |
| 15 to 19 Minutes | 2,381,256 | 15.0% |
| 20 to 24 Minutes | 2,271,253 | 14.3% |
| 25 to 29 Minutes | 998,127 | 6.3% |
| 30 to 34 Minutes | 2,381,423 | 15.0% |
| 35 to 39 Minutes | 452,815 | 2.9% |
| 40 to 44 Minutes | 675,604 | 4.3% |
| 45 to 59 Minutes | 1,369,281 | 8.6% |
| 60 to 89 Minutes | 1,248,892 | 7.9% |
| 90 or more Minutes | 637,084 | 4.0% |
Commute Time by Sex in California
The most common commute times in California are 30 to 34 minutes (1,364,930 commuters, 15.5%) for males and 15 to 19 minutes (1,132,877 commuters, 16.1%) for females.
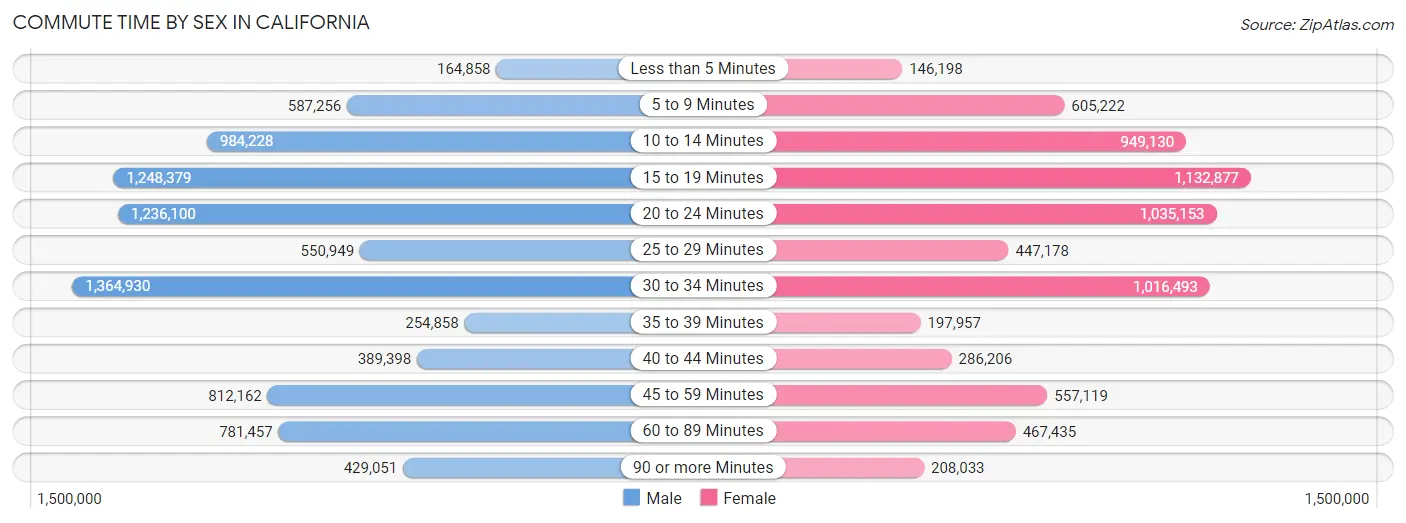
| Commute Time | Male | Female |
| Less than 5 Minutes | 164,858 (1.9%) | 146,198 (2.1%) |
| 5 to 9 Minutes | 587,256 (6.7%) | 605,222 (8.6%) |
| 10 to 14 Minutes | 984,228 (11.2%) | 949,130 (13.5%) |
| 15 to 19 Minutes | 1,248,379 (14.2%) | 1,132,877 (16.1%) |
| 20 to 24 Minutes | 1,236,100 (14.0%) | 1,035,153 (14.7%) |
| 25 to 29 Minutes | 550,949 (6.3%) | 447,178 (6.3%) |
| 30 to 34 Minutes | 1,364,930 (15.5%) | 1,016,493 (14.4%) |
| 35 to 39 Minutes | 254,858 (2.9%) | 197,957 (2.8%) |
| 40 to 44 Minutes | 389,398 (4.4%) | 286,206 (4.1%) |
| 45 to 59 Minutes | 812,162 (9.2%) | 557,119 (7.9%) |
| 60 to 89 Minutes | 781,457 (8.9%) | 467,435 (6.6%) |
| 90 or more Minutes | 429,051 (4.9%) | 208,033 (2.9%) |
Time of Departure to Work by Sex in California
The most frequent times of departure to work in California are 7:00 AM to 7:29 AM (1,106,001, 12.6%) for males and 7:00 AM to 7:29 AM (1,000,958, 14.2%) for females.
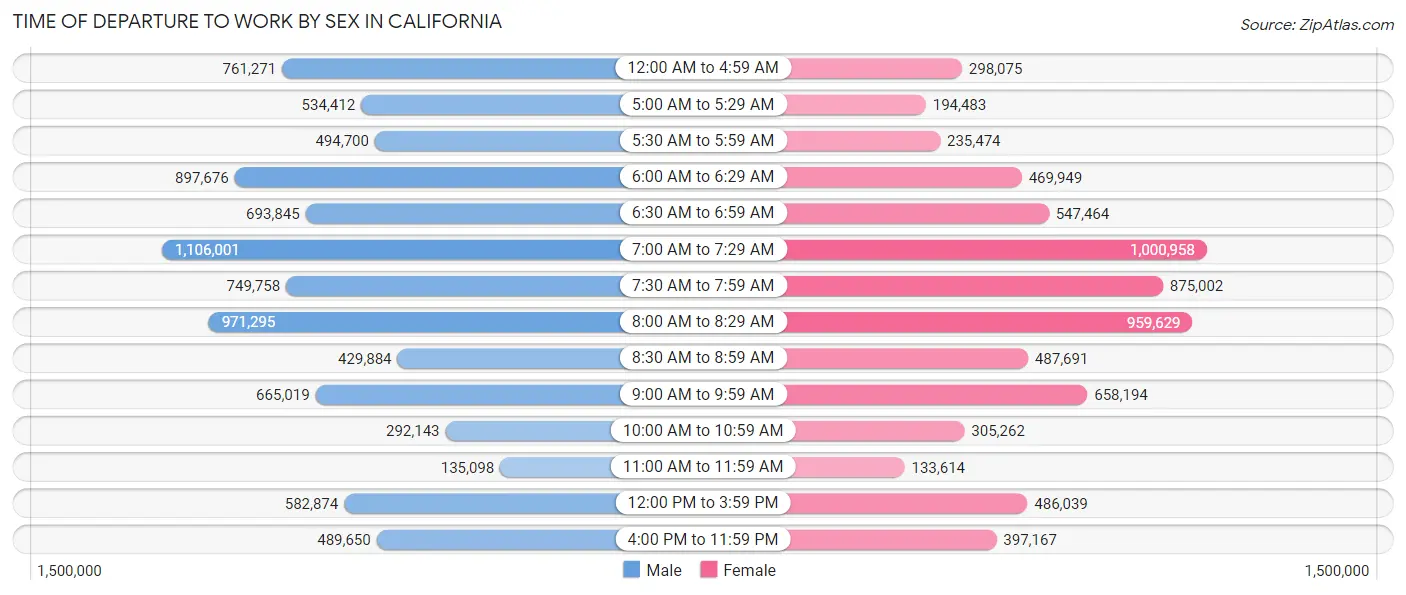
| Time of Departure | Male | Female |
| 12:00 AM to 4:59 AM | 761,271 (8.6%) | 298,075 (4.2%) |
| 5:00 AM to 5:29 AM | 534,412 (6.1%) | 194,483 (2.8%) |
| 5:30 AM to 5:59 AM | 494,700 (5.6%) | 235,474 (3.3%) |
| 6:00 AM to 6:29 AM | 897,676 (10.2%) | 469,949 (6.7%) |
| 6:30 AM to 6:59 AM | 693,845 (7.9%) | 547,464 (7.8%) |
| 7:00 AM to 7:29 AM | 1,106,001 (12.6%) | 1,000,958 (14.2%) |
| 7:30 AM to 7:59 AM | 749,758 (8.5%) | 875,002 (12.4%) |
| 8:00 AM to 8:29 AM | 971,295 (11.0%) | 959,629 (13.6%) |
| 8:30 AM to 8:59 AM | 429,884 (4.9%) | 487,691 (6.9%) |
| 9:00 AM to 9:59 AM | 665,019 (7.5%) | 658,194 (9.3%) |
| 10:00 AM to 10:59 AM | 292,143 (3.3%) | 305,262 (4.3%) |
| 11:00 AM to 11:59 AM | 135,098 (1.5%) | 133,614 (1.9%) |
| 12:00 PM to 3:59 PM | 582,874 (6.6%) | 486,039 (6.9%) |
| 4:00 PM to 11:59 PM | 489,650 (5.6%) | 397,167 (5.6%) |
| Total | 8,803,626 (100.0%) | 7,049,001 (100.0%) |
Housing Occupancy in California
Occupancy by Ownership in California
Of the total 13,315,822 dwellings in California, owner-occupied units account for 7,407,361 (55.6%), while renter-occupied units make up 5,908,461 (44.4%).
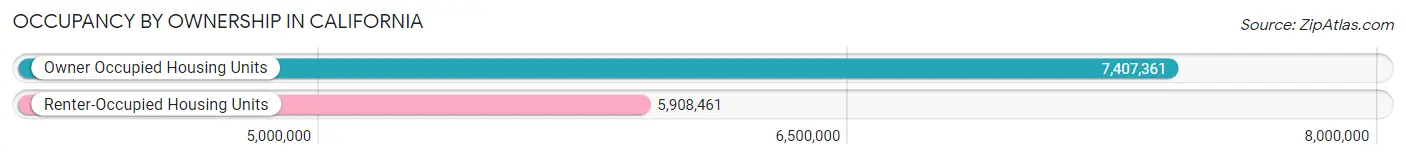
| Occupancy | # Housing Units | % Housing Units |
| Owner Occupied Housing Units | 7,407,361 | 55.6% |
| Renter-Occupied Housing Units | 5,908,461 | 44.4% |
| Total Occupied Housing Units | 13,315,822 | 100.0% |
Occupancy by Household Size in California
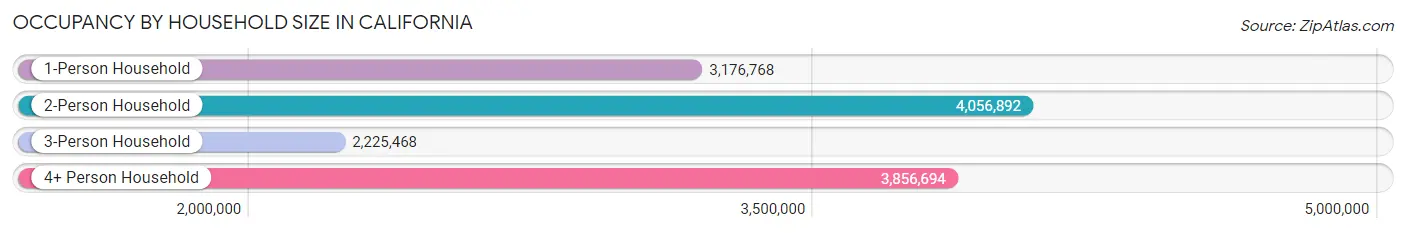
| Household Size | # Housing Units | % Housing Units |
| 1-Person Household | 3,176,768 | 23.9% |
| 2-Person Household | 4,056,892 | 30.5% |
| 3-Person Household | 2,225,468 | 16.7% |
| 4+ Person Household | 3,856,694 | 29.0% |
| Total Housing Units | 13,315,822 | 100.0% |
Occupancy by Ownership by Household Size in California
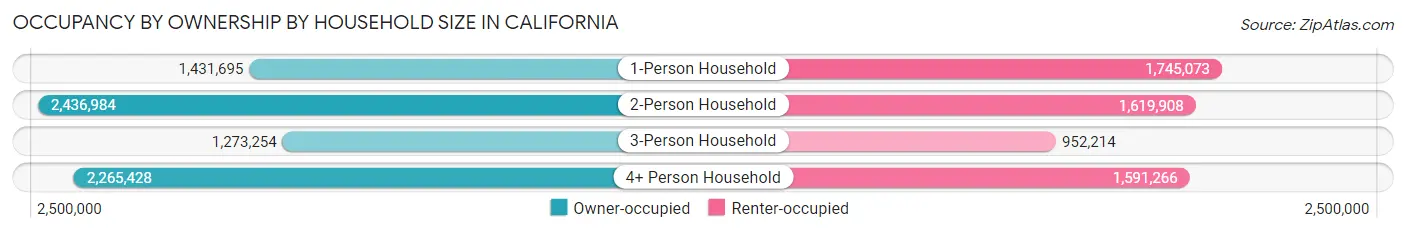
| Household Size | Owner-occupied | Renter-occupied |
| 1-Person Household | 1,431,695 (45.1%) | 1,745,073 (54.9%) |
| 2-Person Household | 2,436,984 (60.1%) | 1,619,908 (39.9%) |
| 3-Person Household | 1,273,254 (57.2%) | 952,214 (42.8%) |
| 4+ Person Household | 2,265,428 (58.7%) | 1,591,266 (41.3%) |
| Total Housing Units | 7,407,361 (55.6%) | 5,908,461 (44.4%) |
Occupancy by Educational Attainment in California
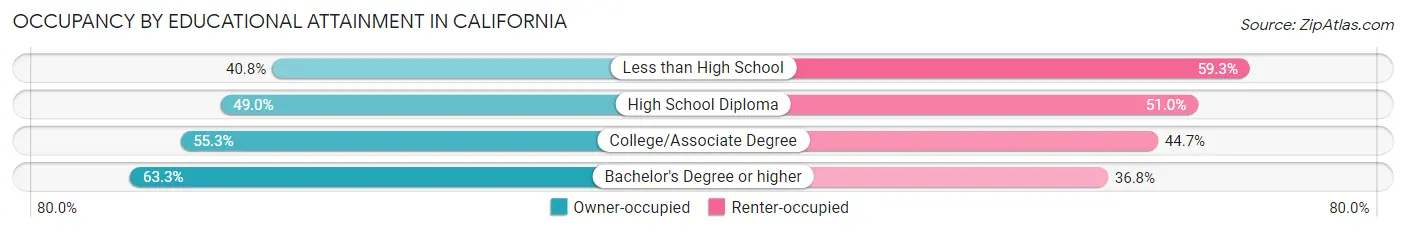
| Household Size | Owner-occupied | Renter-occupied |
| Less than High School | 674,658 (40.7%) | 980,775 (59.3%) |
| High School Diploma | 1,113,926 (49.0%) | 1,161,380 (51.0%) |
| College/Associate Degree | 2,208,935 (55.3%) | 1,784,922 (44.7%) |
| Bachelor's Degree or higher | 3,409,842 (63.2%) | 1,981,384 (36.7%) |
Occupancy by Age of Householder in California
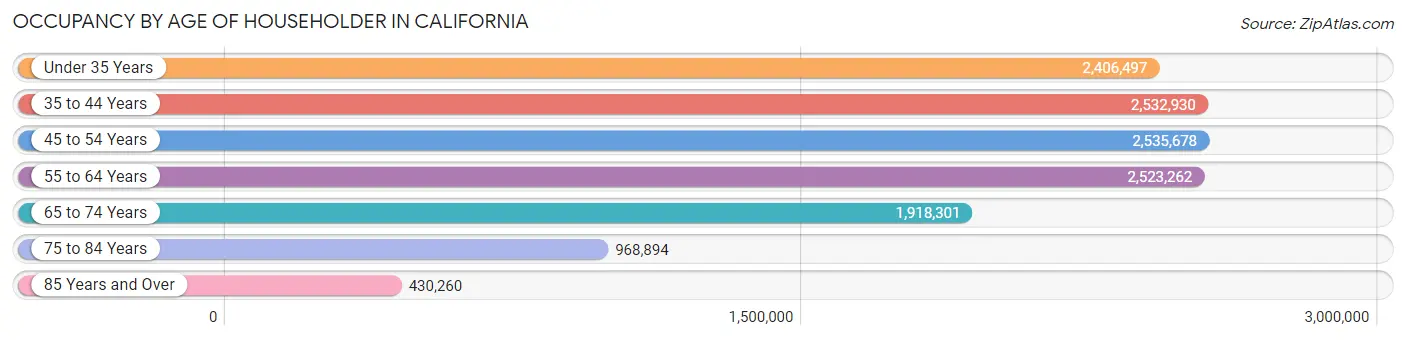
| Age Bracket | # Households | % Households |
| Under 35 Years | 2,406,497 | 18.1% |
| 35 to 44 Years | 2,532,930 | 19.0% |
| 45 to 54 Years | 2,535,678 | 19.0% |
| 55 to 64 Years | 2,523,262 | 19.0% |
| 65 to 74 Years | 1,918,301 | 14.4% |
| 75 to 84 Years | 968,894 | 7.3% |
| 85 Years and Over | 430,260 | 3.2% |
| Total | 13,315,822 | 100.0% |
Housing Finances in California
Median Income by Occupancy in California
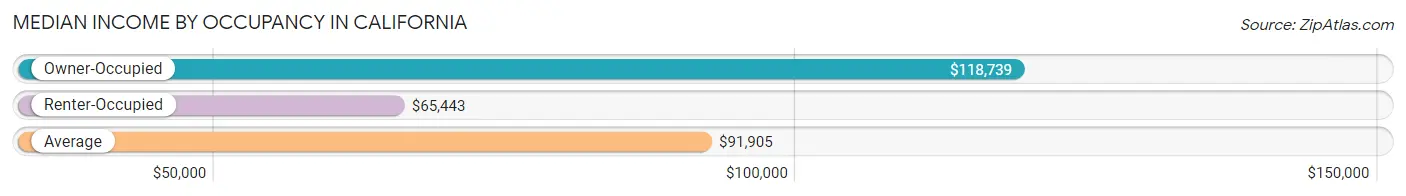
| Occupancy Type | # Households | Median Income |
| Owner-Occupied | 7,407,361 (55.6%) | $118,739 |
| Renter-Occupied | 5,908,461 (44.4%) | $65,443 |
| Average | 13,315,822 (100.0%) | $91,905 |
Occupancy by Householder Income Bracket in California
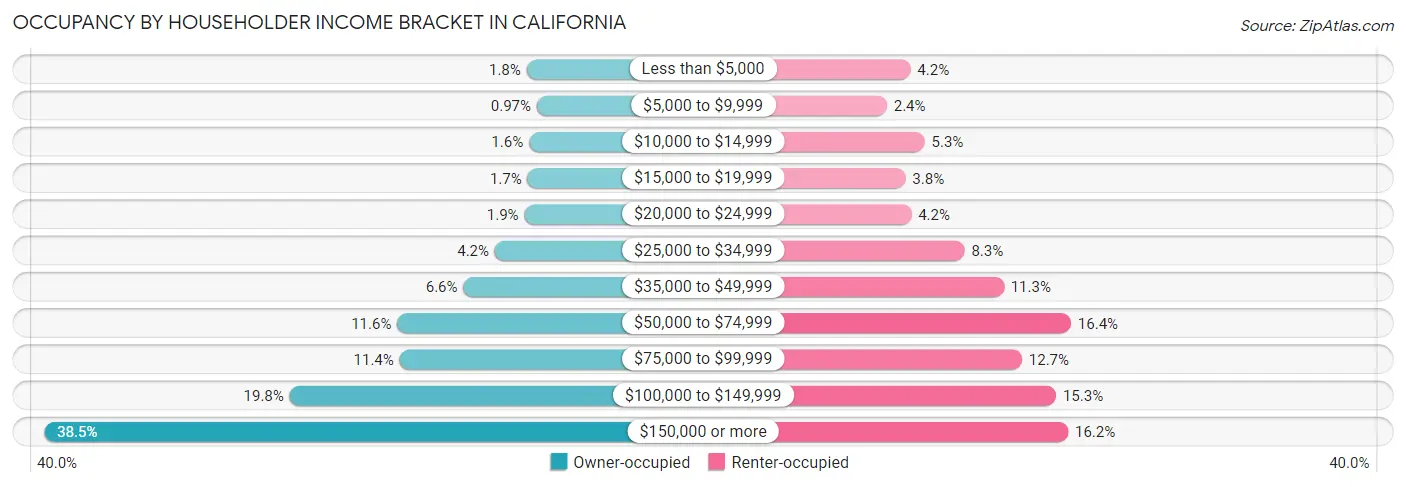
| Income Bracket | Owner-occupied | Renter-occupied |
| Less than $5,000 | 129,733 (1.8%) | 247,240 (4.2%) |
| $5,000 to $9,999 | 71,863 (1.0%) | 140,440 (2.4%) |
| $10,000 to $14,999 | 116,344 (1.6%) | 311,012 (5.3%) |
| $15,000 to $19,999 | 124,140 (1.7%) | 224,458 (3.8%) |
| $20,000 to $24,999 | 142,377 (1.9%) | 250,717 (4.2%) |
| $25,000 to $34,999 | 309,152 (4.2%) | 490,359 (8.3%) |
| $35,000 to $49,999 | 486,461 (6.6%) | 667,013 (11.3%) |
| $50,000 to $74,999 | 860,354 (11.6%) | 969,598 (16.4%) |
| $75,000 to $99,999 | 846,547 (11.4%) | 748,729 (12.7%) |
| $100,000 to $149,999 | 1,467,530 (19.8%) | 902,445 (15.3%) |
| $150,000 or more | 2,852,860 (38.5%) | 956,450 (16.2%) |
| Total | 7,407,361 (100.0%) | 5,908,461 (100.0%) |
Monthly Housing Cost Tiers in California
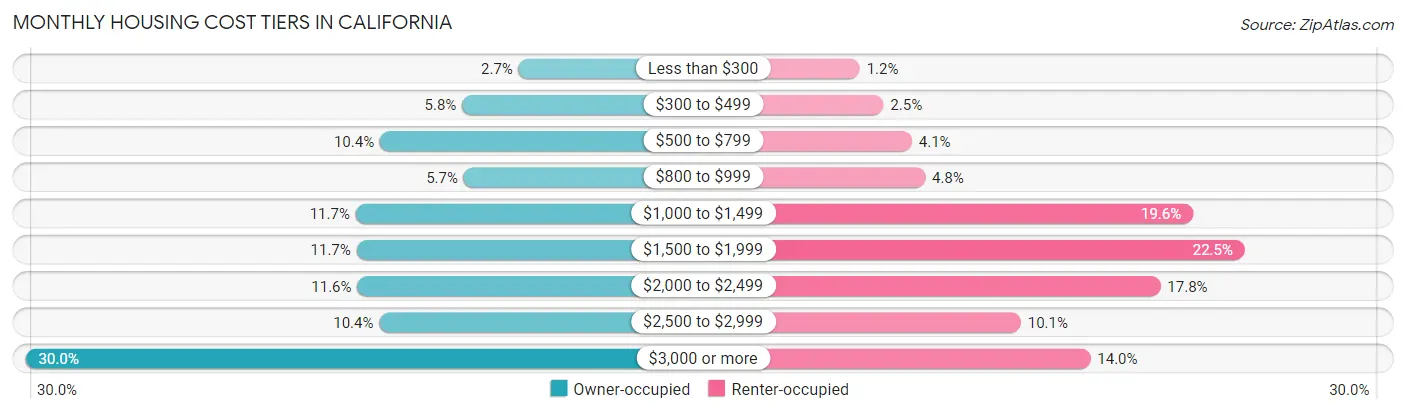
| Monthly Cost | Owner-occupied | Renter-occupied |
| Less than $300 | 200,649 (2.7%) | 72,967 (1.2%) |
| $300 to $499 | 431,770 (5.8%) | 150,058 (2.5%) |
| $500 to $799 | 767,970 (10.4%) | 242,706 (4.1%) |
| $800 to $999 | 425,216 (5.7%) | 285,714 (4.8%) |
| $1,000 to $1,499 | 867,529 (11.7%) | 1,160,165 (19.6%) |
| $1,500 to $1,999 | 863,390 (11.7%) | 1,329,650 (22.5%) |
| $2,000 to $2,499 | 861,044 (11.6%) | 1,054,290 (17.8%) |
| $2,500 to $2,999 | 771,137 (10.4%) | 598,478 (10.1%) |
| $3,000 or more | 2,218,656 (29.9%) | 825,216 (14.0%) |
| Total | 7,407,361 (100.0%) | 5,908,461 (100.0%) |
Physical Housing Characteristics in California
Housing Structures in California
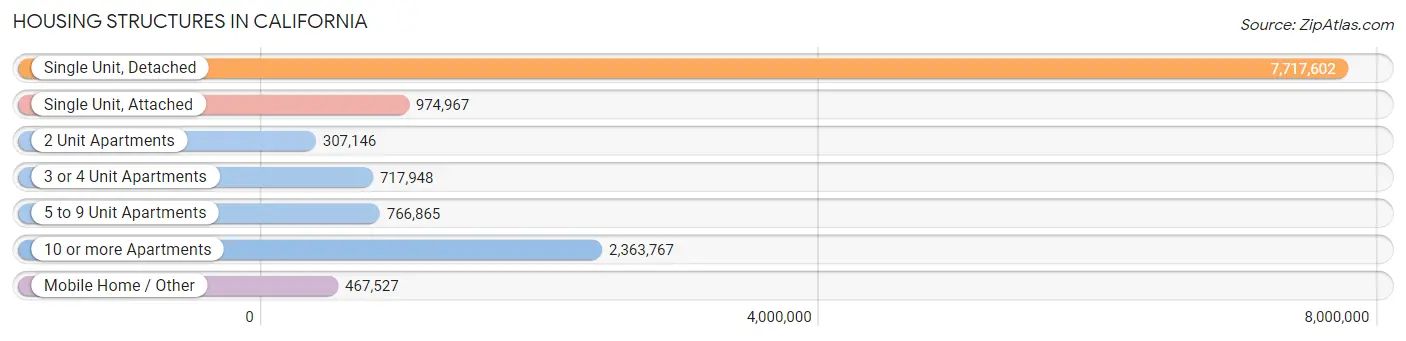
| Structure Type | # Housing Units | % Housing Units |
| Single Unit, Detached | 7,717,602 | 58.0% |
| Single Unit, Attached | 974,967 | 7.3% |
| 2 Unit Apartments | 307,146 | 2.3% |
| 3 or 4 Unit Apartments | 717,948 | 5.4% |
| 5 to 9 Unit Apartments | 766,865 | 5.8% |
| 10 or more Apartments | 2,363,767 | 17.7% |
| Mobile Home / Other | 467,527 | 3.5% |
| Total | 13,315,822 | 100.0% |
Housing Structures by Occupancy in California
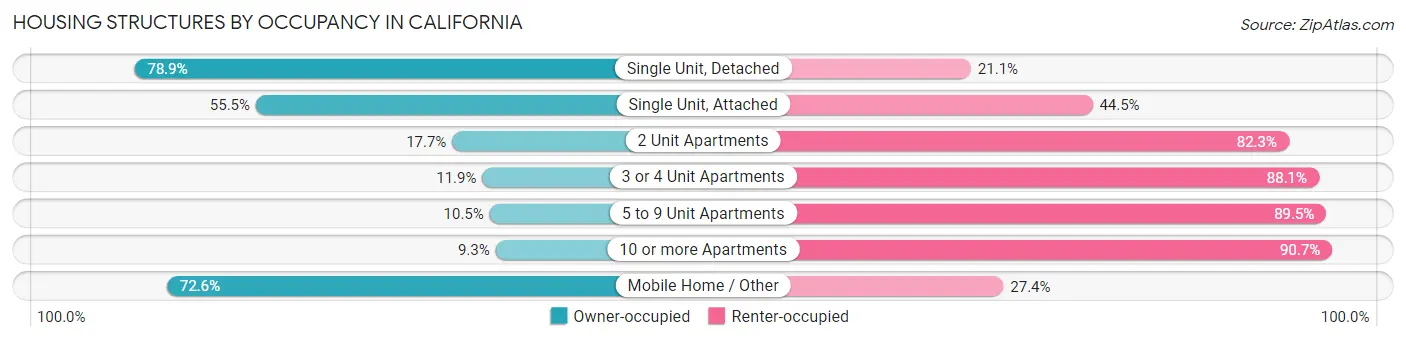
| Structure Type | Owner-occupied | Renter-occupied |
| Single Unit, Detached | 6,086,983 (78.9%) | 1,630,619 (21.1%) |
| Single Unit, Attached | 540,809 (55.5%) | 434,158 (44.5%) |
| 2 Unit Apartments | 54,259 (17.7%) | 252,887 (82.3%) |
| 3 or 4 Unit Apartments | 85,295 (11.9%) | 632,653 (88.1%) |
| 5 to 9 Unit Apartments | 80,317 (10.5%) | 686,548 (89.5%) |
| 10 or more Apartments | 220,189 (9.3%) | 2,143,578 (90.7%) |
| Mobile Home / Other | 339,509 (72.6%) | 128,018 (27.4%) |
| Total | 7,407,361 (55.6%) | 5,908,461 (44.4%) |
Housing Structures by Number of Rooms in California
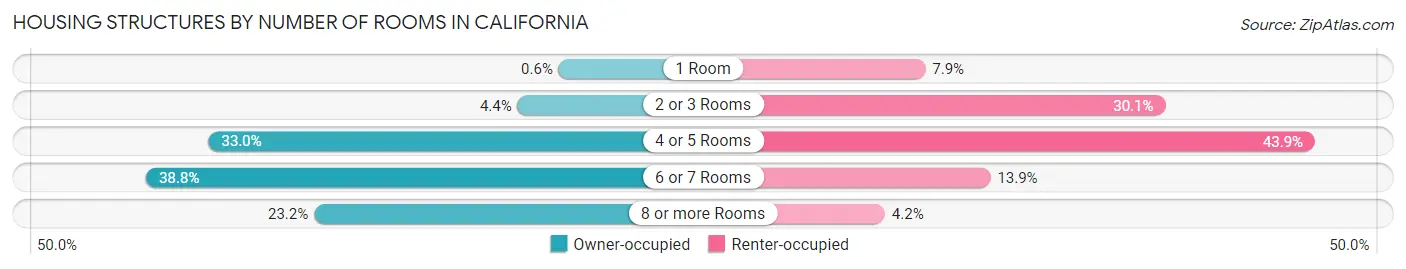
| Number of Rooms | Owner-occupied | Renter-occupied |
| 1 Room | 44,349 (0.6%) | 466,591 (7.9%) |
| 2 or 3 Rooms | 326,382 (4.4%) | 1,777,897 (30.1%) |
| 4 or 5 Rooms | 2,444,152 (33.0%) | 2,595,678 (43.9%) |
| 6 or 7 Rooms | 2,871,544 (38.8%) | 822,412 (13.9%) |
| 8 or more Rooms | 1,720,934 (23.2%) | 245,883 (4.2%) |
| Total | 7,407,361 (100.0%) | 5,908,461 (100.0%) |
Housing Structure by Heating Type in California
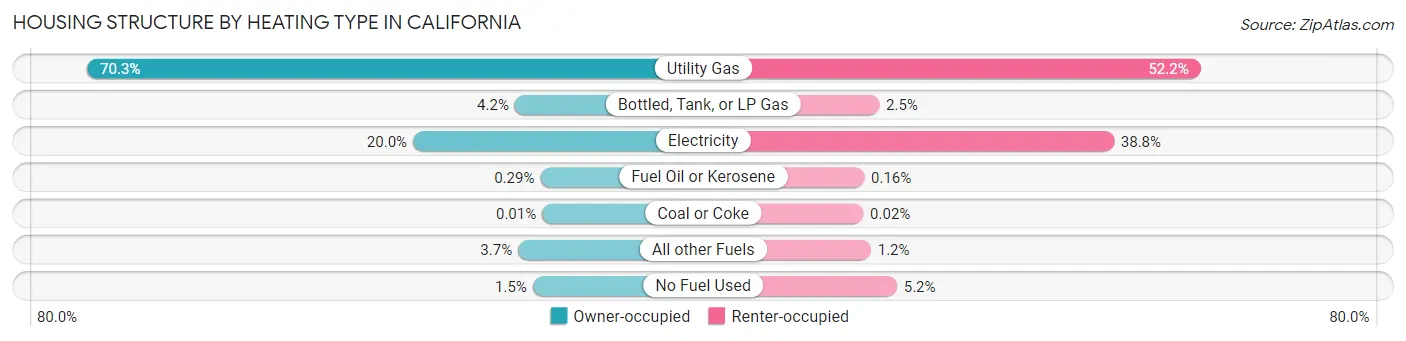
| Heating Type | Owner-occupied | Renter-occupied |
| Utility Gas | 5,209,399 (70.3%) | 3,081,781 (52.2%) |
| Bottled, Tank, or LP Gas | 313,427 (4.2%) | 146,369 (2.5%) |
| Electricity | 1,479,041 (20.0%) | 2,290,937 (38.8%) |
| Fuel Oil or Kerosene | 21,377 (0.3%) | 9,181 (0.2%) |
| Coal or Coke | 937 (0.0%) | 962 (0.0%) |
| All other Fuels | 275,959 (3.7%) | 70,843 (1.2%) |
| No Fuel Used | 107,221 (1.5%) | 308,388 (5.2%) |
| Total | 7,407,361 (100.0%) | 5,908,461 (100.0%) |
Household Vehicle Usage in California
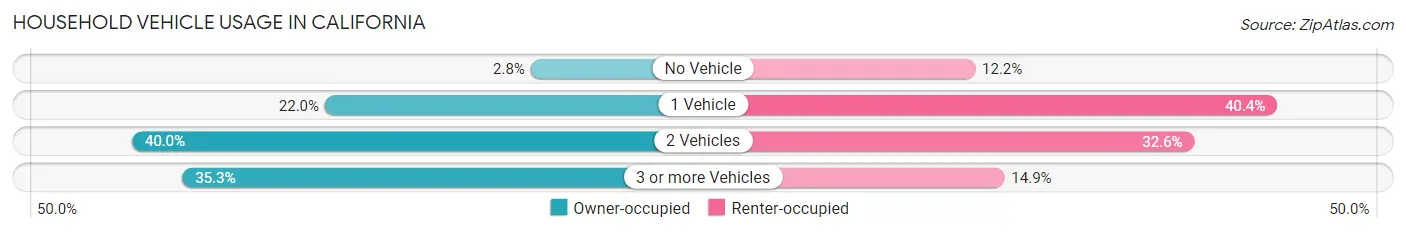
| Vehicles per Household | Owner-occupied | Renter-occupied |
| No Vehicle | 204,739 (2.8%) | 717,796 (12.1%) |
| 1 Vehicle | 1,627,283 (22.0%) | 2,383,819 (40.4%) |
| 2 Vehicles | 2,962,318 (40.0%) | 1,927,077 (32.6%) |
| 3 or more Vehicles | 2,613,021 (35.3%) | 879,769 (14.9%) |
| Total | 7,407,361 (100.0%) | 5,908,461 (100.0%) |
Real Estate & Mortgages in California
Real Estate and Mortgage Overview in California
| Characteristic | Without Mortgage | With Mortgage |
| Housing Units | 2,340,188 | 5,067,173 |
| Median Property Value | $606,100 | $679,200 |
| Median Household Income | $82,851 | $2,260,679 |
| Monthly Housing Costs | $732 | $2,174,667 |
| Real Estate Taxes | $3,432 | $87,083 |
Property Value by Mortgage Status in California
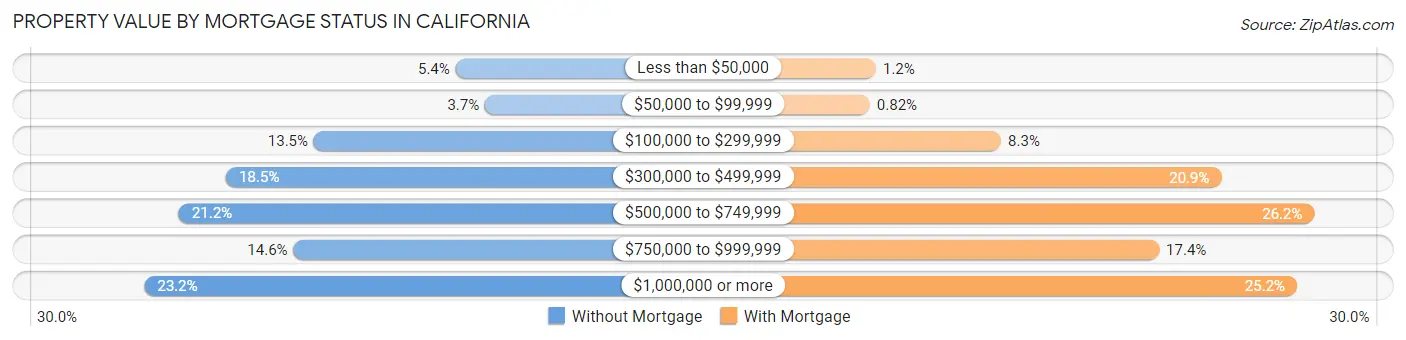
| Property Value | Without Mortgage | With Mortgage |
| Less than $50,000 | 125,613 (5.4%) | 59,210 (1.2%) |
| $50,000 to $99,999 | 86,279 (3.7%) | 41,587 (0.8%) |
| $100,000 to $299,999 | 315,166 (13.5%) | 421,821 (8.3%) |
| $300,000 to $499,999 | 432,697 (18.5%) | 1,059,205 (20.9%) |
| $500,000 to $749,999 | 495,711 (21.2%) | 1,327,905 (26.2%) |
| $750,000 to $999,999 | 342,695 (14.6%) | 879,352 (17.3%) |
| $1,000,000 or more | 542,027 (23.2%) | 1,278,093 (25.2%) |
| Total | 2,340,188 (100.0%) | 5,067,173 (100.0%) |
Household Income by Mortgage Status in California
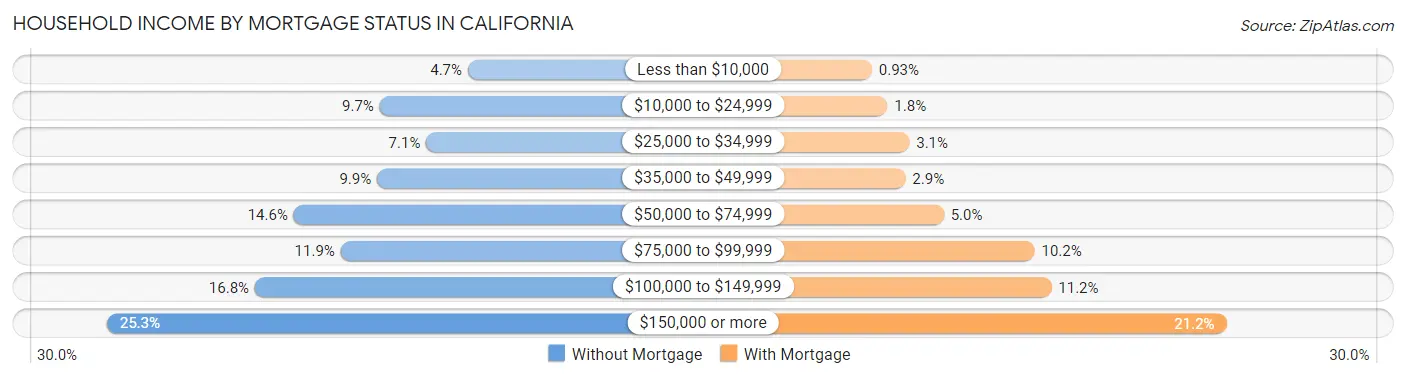
| Household Income | Without Mortgage | With Mortgage |
| Less than $10,000 | 109,219 (4.7%) | 47,153 (0.9%) |
| $10,000 to $24,999 | 227,305 (9.7%) | 92,377 (1.8%) |
| $25,000 to $34,999 | 164,984 (7.0%) | 155,556 (3.1%) |
| $35,000 to $49,999 | 230,846 (9.9%) | 144,168 (2.9%) |
| $50,000 to $74,999 | 342,119 (14.6%) | 255,615 (5.0%) |
| $75,000 to $99,999 | 279,511 (11.9%) | 518,235 (10.2%) |
| $100,000 to $149,999 | 394,023 (16.8%) | 567,036 (11.2%) |
| $150,000 or more | 592,181 (25.3%) | 1,073,507 (21.2%) |
| Total | 2,340,188 (100.0%) | 5,067,173 (100.0%) |
Property Value to Household Income Ratio in California
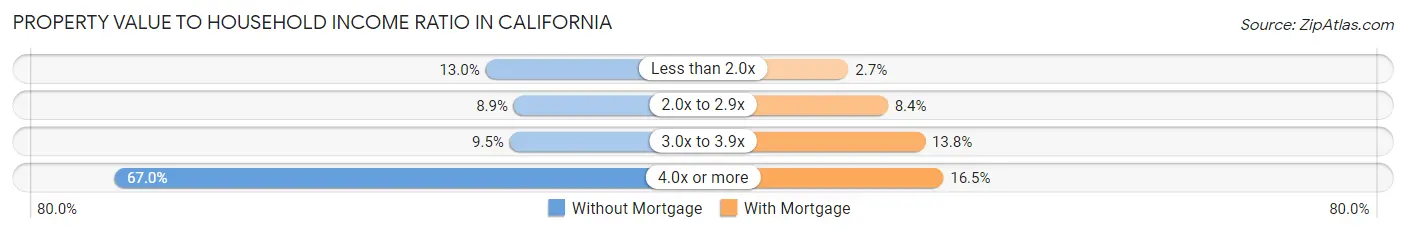
| Value-to-Income Ratio | Without Mortgage | With Mortgage |
| Less than 2.0x | 305,265 (13.0%) | 136,094 (2.7%) |
| 2.0x to 2.9x | 208,931 (8.9%) | 425,813 (8.4%) |
| 3.0x to 3.9x | 222,792 (9.5%) | 699,909 (13.8%) |
| 4.0x or more | 1,568,050 (67.0%) | 834,716 (16.5%) |
| Total | 2,340,188 (100.0%) | 5,067,173 (100.0%) |
Real Estate Taxes by Mortgage Status in California
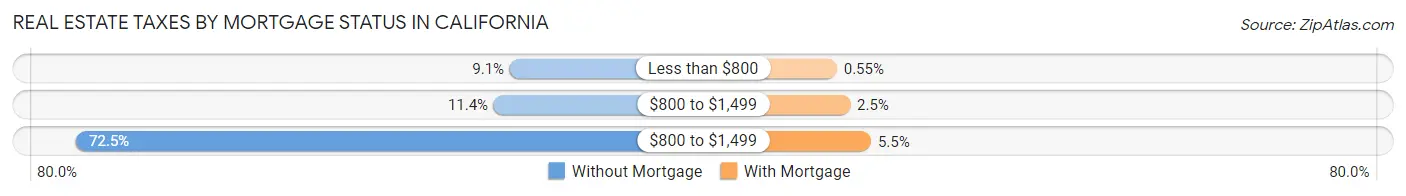
| Property Taxes | Without Mortgage | With Mortgage |
| Less than $800 | 212,389 (9.1%) | 27,619 (0.5%) |
| $800 to $1,499 | 267,161 (11.4%) | 126,028 (2.5%) |
| $800 to $1,499 | 1,696,496 (72.5%) | 280,949 (5.5%) |
| Total | 2,340,188 (100.0%) | 5,067,173 (100.0%) |
Health & Disability in California
Health Insurance Coverage by Age in California
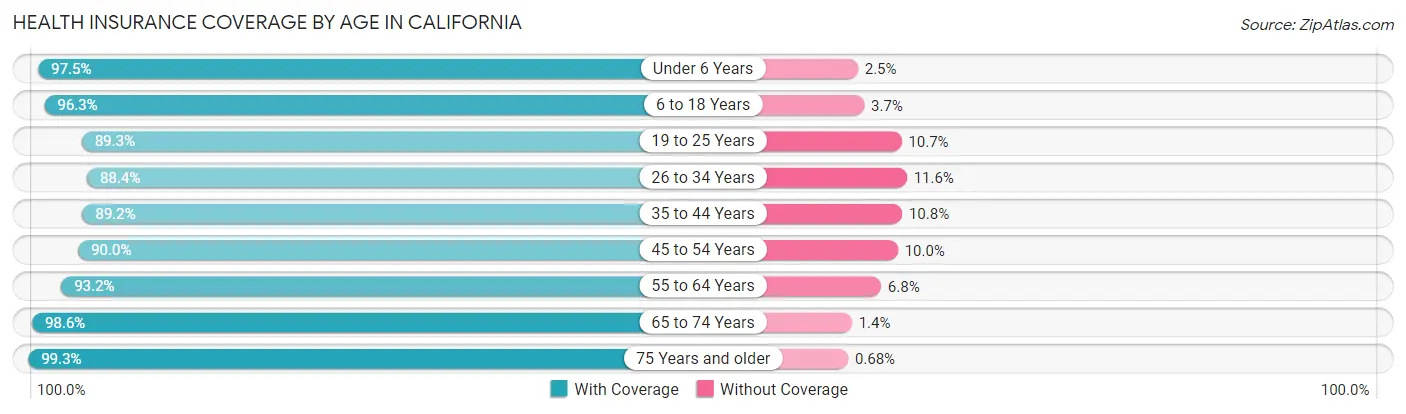
| Age Bracket | With Coverage | Without Coverage |
| Under 6 Years | 2,650,064 (97.5%) | 68,492 (2.5%) |
| 6 to 18 Years | 6,364,080 (96.3%) | 244,151 (3.7%) |
| 19 to 25 Years | 3,267,442 (89.3%) | 389,809 (10.7%) |
| 26 to 34 Years | 4,591,777 (88.4%) | 604,769 (11.6%) |
| 35 to 44 Years | 4,703,970 (89.2%) | 567,328 (10.8%) |
| 45 to 54 Years | 4,441,894 (90.0%) | 491,458 (10.0%) |
| 55 to 64 Years | 4,404,960 (93.2%) | 322,854 (6.8%) |
| 65 to 74 Years | 3,344,960 (98.6%) | 46,975 (1.4%) |
| 75 Years and older | 2,353,326 (99.3%) | 16,231 (0.7%) |
| Total | 36,122,473 (92.9%) | 2,752,067 (7.1%) |
Health Insurance Coverage by Citizenship Status in California
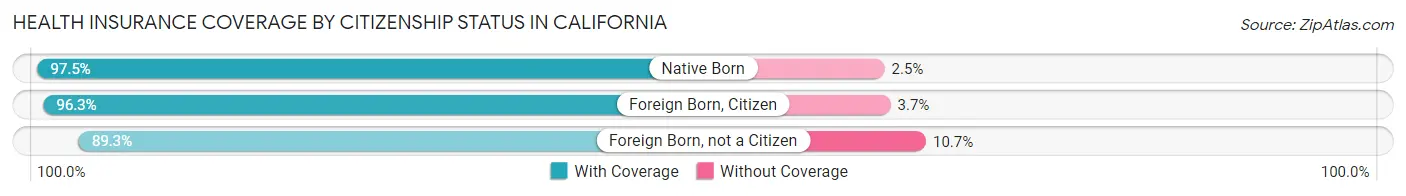
| Citizenship Status | With Coverage | Without Coverage |
| Native Born | 2,650,064 (97.5%) | 68,492 (2.5%) |
| Foreign Born, Citizen | 6,364,080 (96.3%) | 244,151 (3.7%) |
| Foreign Born, not a Citizen | 3,267,442 (89.3%) | 389,809 (10.7%) |
Health Insurance Coverage by Household Income in California
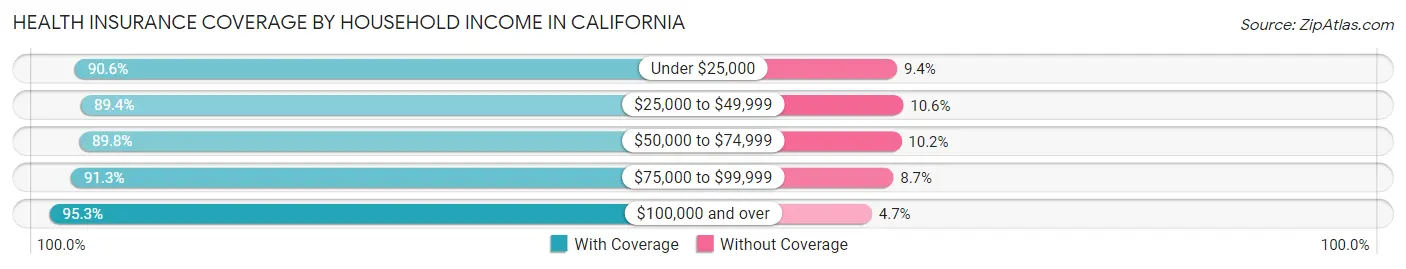
| Household Income | With Coverage | Without Coverage |
| Under $25,000 | 3,066,503 (90.6%) | 318,532 (9.4%) |
| $25,000 to $49,999 | 4,383,023 (89.4%) | 518,834 (10.6%) |
| $50,000 to $74,999 | 4,561,189 (89.8%) | 519,149 (10.2%) |
| $75,000 to $99,999 | 4,311,811 (91.3%) | 411,362 (8.7%) |
| $100,000 and over | 19,343,883 (95.3%) | 954,311 (4.7%) |
Public vs Private Health Insurance Coverage by Age in California
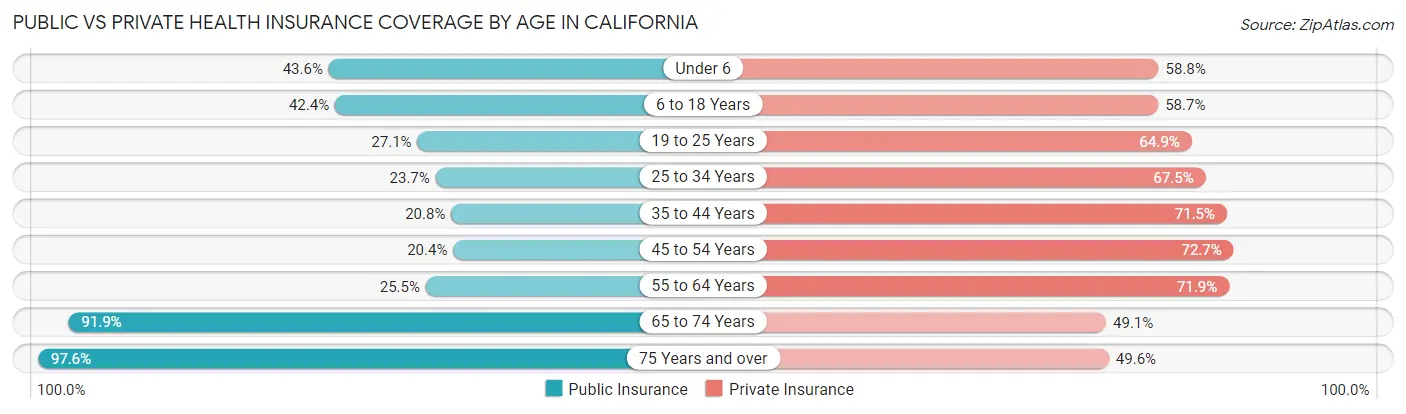
| Age Bracket | Public Insurance | Private Insurance |
| Under 6 | 1,183,935 (43.5%) | 1,598,309 (58.8%) |
| 6 to 18 Years | 2,801,010 (42.4%) | 3,881,466 (58.7%) |
| 19 to 25 Years | 990,721 (27.1%) | 2,374,665 (64.9%) |
| 25 to 34 Years | 1,232,017 (23.7%) | 3,508,420 (67.5%) |
| 35 to 44 Years | 1,096,823 (20.8%) | 3,767,564 (71.5%) |
| 45 to 54 Years | 1,008,299 (20.4%) | 3,587,472 (72.7%) |
| 55 to 64 Years | 1,207,410 (25.5%) | 3,398,375 (71.9%) |
| 65 to 74 Years | 3,115,685 (91.9%) | 1,664,083 (49.1%) |
| 75 Years and over | 2,311,618 (97.6%) | 1,174,737 (49.6%) |
| Total | 14,947,518 (38.5%) | 24,955,091 (64.2%) |
Disability Status by Sex by Age in California
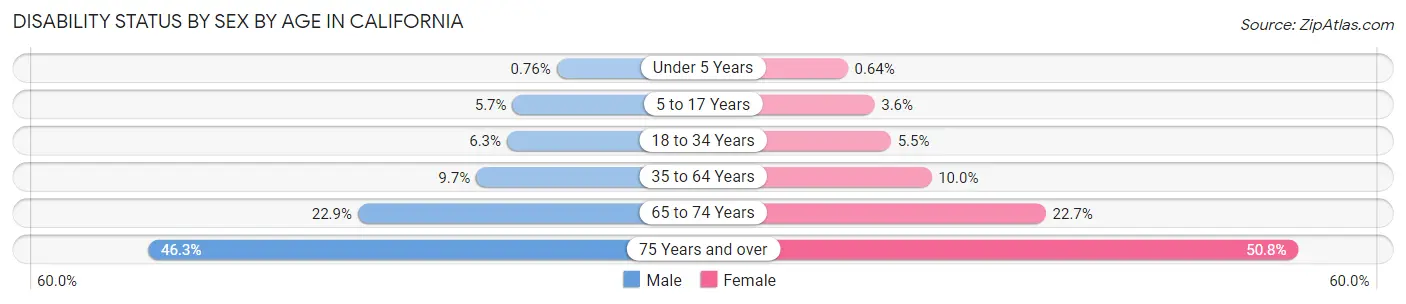
| Age Bracket | Male | Female |
| Under 5 Years | 8,825 (0.8%) | 7,025 (0.6%) |
| 5 to 17 Years | 189,289 (5.7%) | 115,012 (3.6%) |
| 18 to 34 Years | 300,826 (6.3%) | 252,266 (5.4%) |
| 35 to 64 Years | 728,212 (9.7%) | 741,499 (10.0%) |
| 65 to 74 Years | 364,604 (22.9%) | 408,397 (22.7%) |
| 75 Years and over | 457,469 (46.3%) | 701,734 (50.8%) |
Disability Class by Sex by Age in California
Disability Class: Hearing Difficulty
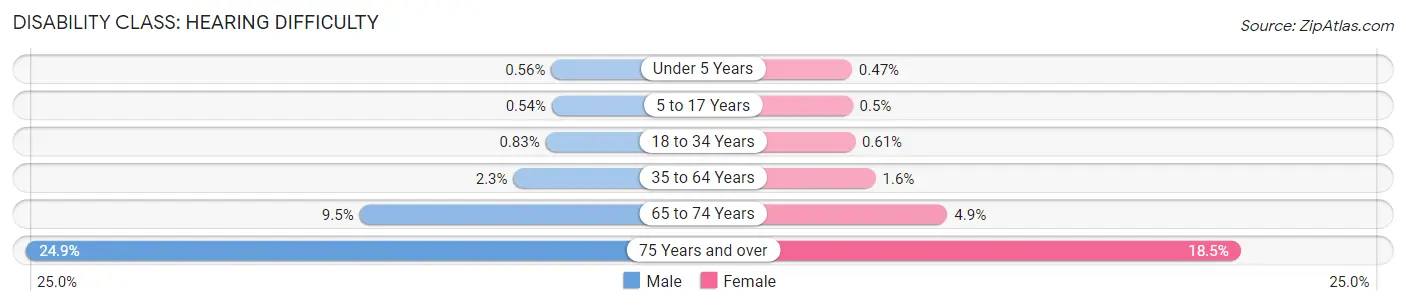
| Age Bracket | Male | Female |
| Under 5 Years | 6,467 (0.6%) | 5,214 (0.5%) |
| 5 to 17 Years | 17,952 (0.5%) | 15,857 (0.5%) |
| 18 to 34 Years | 39,473 (0.8%) | 28,102 (0.6%) |
| 35 to 64 Years | 173,875 (2.3%) | 116,909 (1.6%) |
| 65 to 74 Years | 150,687 (9.5%) | 88,158 (4.9%) |
| 75 Years and over | 246,487 (24.9%) | 255,372 (18.5%) |
Disability Class: Vision Difficulty
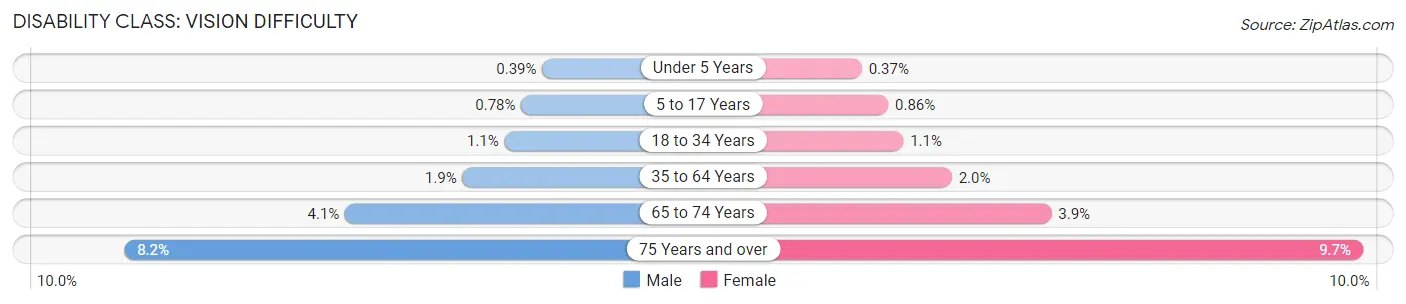
| Age Bracket | Male | Female |
| Under 5 Years | 4,564 (0.4%) | 4,048 (0.4%) |
| 5 to 17 Years | 26,139 (0.8%) | 27,250 (0.9%) |
| 18 to 34 Years | 52,227 (1.1%) | 52,993 (1.1%) |
| 35 to 64 Years | 139,800 (1.9%) | 151,857 (2.0%) |
| 65 to 74 Years | 64,535 (4.1%) | 70,050 (3.9%) |
| 75 Years and over | 80,626 (8.2%) | 133,459 (9.7%) |
Disability Class: Cognitive Difficulty
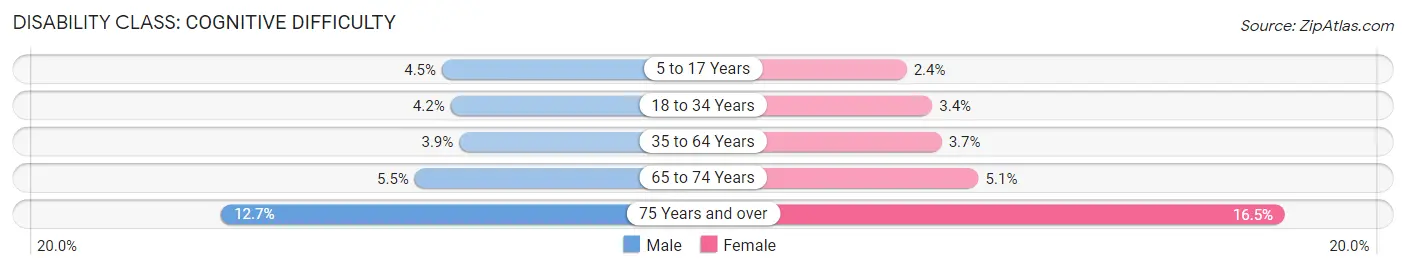
| Age Bracket | Male | Female |
| 5 to 17 Years | 150,173 (4.5%) | 76,692 (2.4%) |
| 18 to 34 Years | 200,495 (4.2%) | 155,720 (3.4%) |
| 35 to 64 Years | 289,855 (3.9%) | 276,362 (3.7%) |
| 65 to 74 Years | 87,920 (5.5%) | 91,396 (5.1%) |
| 75 Years and over | 125,590 (12.7%) | 227,065 (16.5%) |
Disability Class: Ambulatory Difficulty
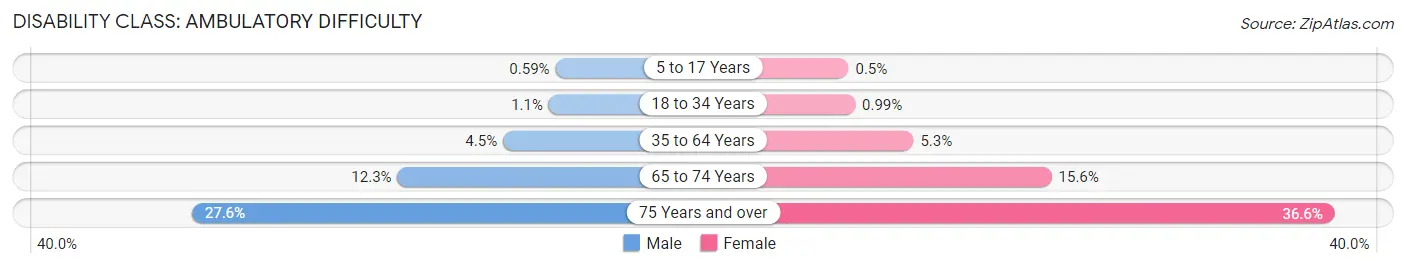
| Age Bracket | Male | Female |
| 5 to 17 Years | 19,560 (0.6%) | 16,012 (0.5%) |
| 18 to 34 Years | 51,859 (1.1%) | 46,066 (1.0%) |
| 35 to 64 Years | 335,030 (4.5%) | 395,897 (5.3%) |
| 65 to 74 Years | 196,224 (12.3%) | 280,252 (15.6%) |
| 75 Years and over | 272,848 (27.6%) | 505,099 (36.6%) |
Disability Class: Self-Care Difficulty
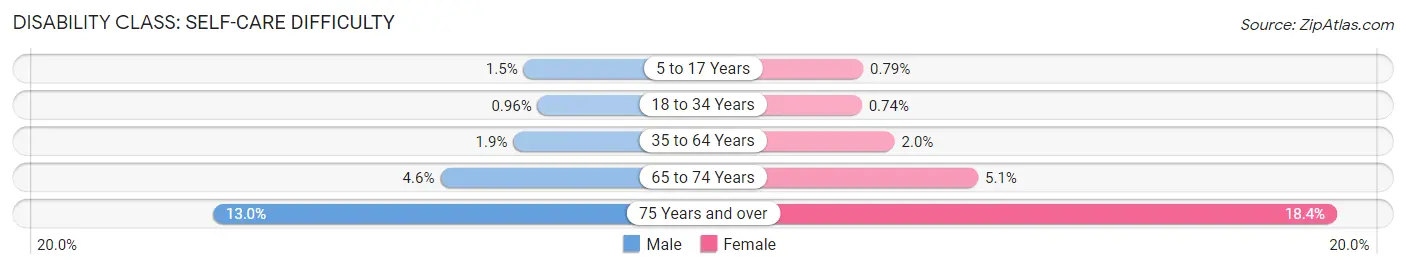
| Age Bracket | Male | Female |
| 5 to 17 Years | 49,169 (1.5%) | 25,237 (0.8%) |
| 18 to 34 Years | 45,931 (1.0%) | 34,286 (0.7%) |
| 35 to 64 Years | 139,573 (1.9%) | 145,994 (2.0%) |
| 65 to 74 Years | 72,787 (4.6%) | 91,100 (5.1%) |
| 75 Years and over | 128,706 (13.0%) | 253,720 (18.4%) |
Technology Access in California
Computing Device Access in California
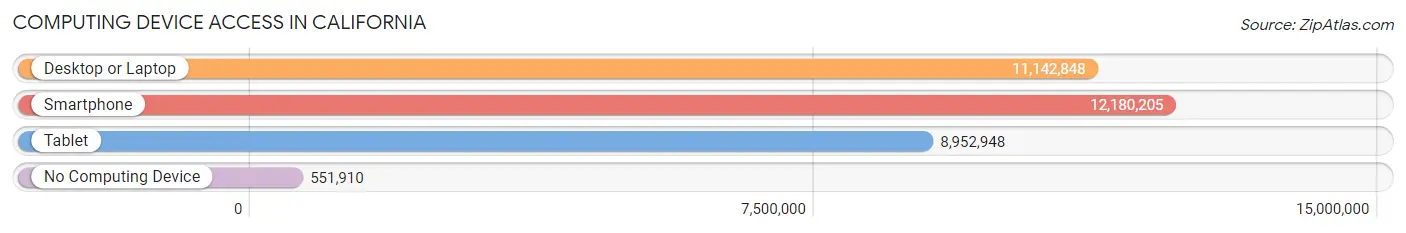
| Device Type | # Households | % Households |
| Desktop or Laptop | 11,142,848 | 83.7% |
| Smartphone | 12,180,205 | 91.5% |
| Tablet | 8,952,948 | 67.2% |
| No Computing Device | 551,910 | 4.1% |
| Total | 13,315,822 | 100.0% |
Internet Access in California
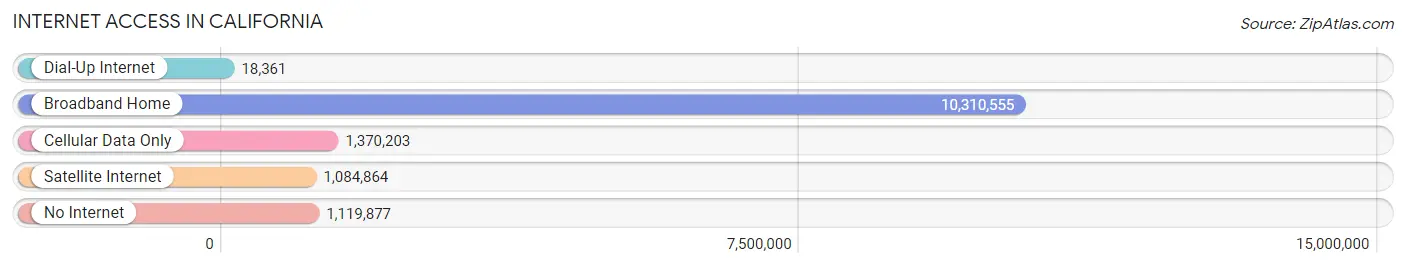
| Internet Type | # Households | % Households |
| Dial-Up Internet | 18,361 | 0.1% |
| Broadband Home | 10,310,555 | 77.4% |
| Cellular Data Only | 1,370,203 | 10.3% |
| Satellite Internet | 1,084,864 | 8.2% |
| No Internet | 1,119,877 | 8.4% |
| Total | 13,315,822 | 100.0% |
California Summary
California is a state located on the West Coast of the United States. It is the most populous state in the country, with a population of over 39 million people as of 2020. California is bordered by Oregon to the north, Nevada and Arizona to the east, and the Pacific Ocean to the west. It is the third-largest state in the country by area, and the most geographically diverse.
History
California has a long and rich history, beginning with the first inhabitants of the region, the Native American tribes. These tribes included the Chumash, the Miwok, the Pomo, and the Yurok. The first Europeans to explore the area were Spanish explorers, who arrived in the late 18th century. The Spanish established a number of missions and settlements in the area, and eventually claimed the region as part of the Spanish Empire.
In 1821, Mexico gained independence from Spain, and California became part of the newly formed Mexican Republic. The Mexican government granted large tracts of land to settlers, and the population of California began to grow. In 1846, the United States declared war on Mexico, and by 1848, the Mexican-American War had ended with the signing of the Treaty of Guadalupe Hidalgo. California was ceded to the United States, and in 1850, it became the 31st state in the Union.
Geography
California is a large and geographically diverse state. It is bordered by Oregon to the north, Nevada and Arizona to the east, and the Pacific Ocean to the west. It is the third-largest state in the country by area, and the most geographically diverse.
The state is divided into four distinct regions: the Coastal Region, the Central Valley, the Sierra Nevada Mountains, and the Desert Region. The Coastal Region is home to the state’s major cities, including Los Angeles, San Francisco, and San Diego. The Central Valley is a large agricultural region, and the Sierra Nevada Mountains are home to some of the highest peaks in the country. The Desert Region is home to the Mojave and Sonoran Deserts.
Economy
California has a large and diverse economy. It is the most populous state in the country, and it is home to some of the largest and most successful companies in the world. The state’s economy is driven by a number of industries, including technology, entertainment, tourism, agriculture, and manufacturing.
California is the largest agricultural producer in the country, and it is home to some of the most productive farms in the world. The state is also a major producer of wine, and it is home to some of the most renowned wineries in the world.
The state is also a major center for technology and innovation. Silicon Valley, located in the San Francisco Bay Area, is home to some of the world’s largest and most successful technology companies, including Apple, Google, and Facebook.
Demographics
As of 2020, California has a population of over 39 million people. The state is home to a diverse population, with a variety of ethnic and racial backgrounds. The largest ethnic group in the state is Hispanic or Latino, making up 39.4% of the population. White people make up 36.2% of the population, while Asian people make up 14.9%. African Americans make up 6.5% of the population, and Native Americans make up 1.5%.
California is also home to a large immigrant population. Over 10 million people in the state are foreign-born, making up 25.5% of the population. The largest immigrant groups in the state are from Mexico, China, and the Philippines.
Conclusion
California is a large and diverse state with a rich history and a vibrant economy. It is home to a diverse population, with a variety of ethnic and racial backgrounds. The state is a major agricultural producer, and it is home to some of the world’s largest and most successful technology companies. California is an important part of the United States, and it is sure to remain a major player in the country for years to come.
Common Questions
When was California Incorporated?
California was Incorporated into the Union on Sep 9, 1850.
What is the Total Area of California?
Total Area of California is 163,694 Square Miles.
What is the Total Land Area of California?
Total Land Area of California is 155,766 Square Miles.
What is the Total Water Area of California?
Total Water Area of California is 7,928 Square Miles.
What is the Average Elevation in California?
Average Elevation in California is 2,900 Feet.
What is the Highest Elevation in California?
Highest Elevation in California is 14,494 Feet.
What is the Lowest Elevation in California?
Lowest Elevation in California is -282 Feet.
What is the Population Density in California?
Population Density in California is 252.7 People per Square Mile.
What is Per Capita Income in California?
Per Capita income in California is $45,591.
What is the Median Family Income in California?
Median Family Income in California is $105,010.
What is the Median Household income in California?
Median Household Income in California is $91,905.
What is Income or Wage Gap in California?
Income or Wage Gap in California is 25.7%.
Women in California earn 74.3 cents for every dollar earned by a man.
What is Family Income Deficit in California?
Family Income Deficit in California is $11,258.
Families that are below poverty line in California earn $11,258 less on average than the poverty threshold level.
What is Inequality or Gini Index in California?
Inequality or Gini Index in California is 0.49.
What is the Total Population of California?
Total Population of California is 39,356,104.
What is the Total Male Population of California?
Total Male Population of California is 19,708,947.
What is the Total Female Population of California?
Total Female Population of California is 19,647,157.
What is the Ratio of Males per 100 Females in California?
There are 100.31 Males per 100 Females in California.
What is the Ratio of Females per 100 Males in California?
There are 99.69 Females per 100 Males in California.
What is the Median Population Age in California?
Median Population Age in California is 37.3 Years.
What is the Average Family Size in California
Average Family Size in California is 3.5 People.
What is the Average Household Size in California
Average Household Size in California is 2.9 People.
How Large is the Labor Force in California?
There are 20,161,988 People in the Labor Forcein in California.
What is the Percentage of People in the Labor Force in California?
63.8% of People are in the Labor Force in California.
What is the Unemployment Rate in California?
Unemployment Rate in California is 6.4%.