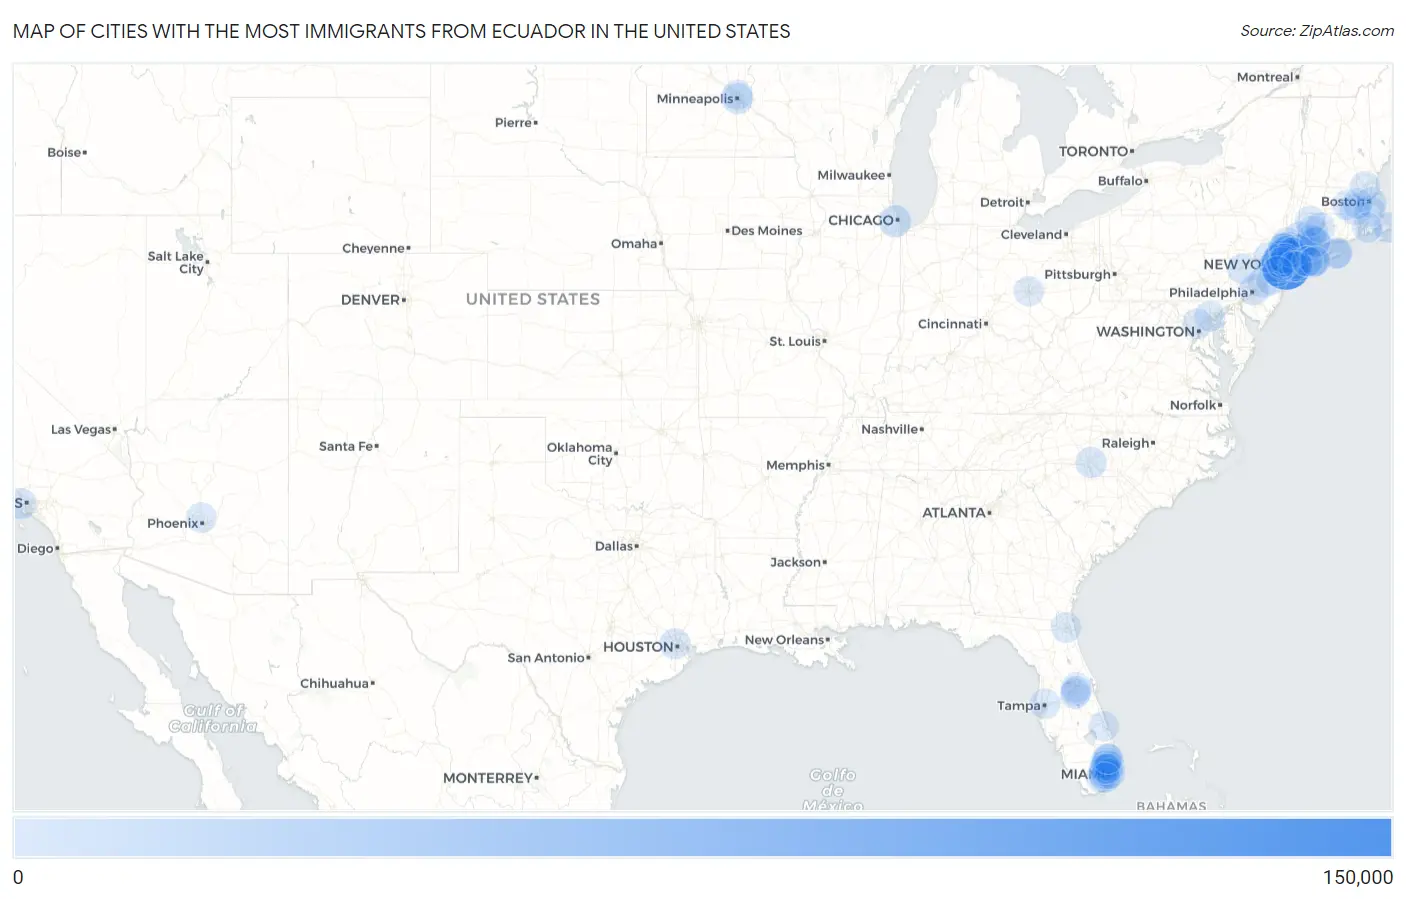
Cities with the Most Immigrants from Ecuador in the United States
RELATED REPORTS & OPTIONS
Ecuador
United States
Compare Cities
Map of Cities with the Most Immigrants from Ecuador in the United States
0
150,000
Cities with the Most Immigrants from Ecuador in the United States
| City | Ecuador | vs State | vs National | |
| 1. | New York | 125,959 | 177,448(70.98%)#1 | 480,873(26.19%)#1 |
| 2. | Newark | 18,452 | 95,275(19.37%)#1 | 480,873(3.84%)#2 |
| 3. | Chicago | 11,340 | 16,844(67.32%)#1 | 480,873(2.36%)#3 |
| 4. | Elizabeth | 6,572 | 95,275(6.90%)#2 | 480,873(1.37%)#4 |
| 5. | Danbury | 6,051 | 24,026(25.19%)#1 | 480,873(1.26%)#5 |
| 6. | Los Angeles | 4,496 | 21,276(21.13%)#1 | 480,873(0.93%)#6 |
| 7. | Union City | 4,491 | 95,275(4.71%)#3 | 480,873(0.93%)#7 |
| 8. | Minneapolis | 4,068 | 8,438(48.21%)#1 | 480,873(0.85%)#8 |
| 9. | Hackensack | 3,613 | 95,275(3.79%)#4 | 480,873(0.75%)#9 |
| 10. | Yonkers | 3,386 | 177,448(1.91%)#2 | 480,873(0.70%)#10 |
| 11. | Charlotte | 3,353 | 7,765(43.18%)#1 | 480,873(0.70%)#11 |
| 12. | Jersey City | 2,922 | 95,275(3.07%)#5 | 480,873(0.61%)#12 |
| 13. | Houston | 2,644 | 12,456(21.23%)#1 | 480,873(0.55%)#13 |
| 14. | Ossining | 2,616 | 177,448(1.47%)#3 | 480,873(0.54%)#14 |
| 15. | Miami | 2,584 | 54,585(4.73%)#1 | 480,873(0.54%)#15 |
| 16. | Stamford | 2,528 | 24,026(10.52%)#2 | 480,873(0.53%)#16 |
| 17. | Kearny | 2,527 | 95,275(2.65%)#6 | 480,873(0.53%)#17 |
| 18. | West New York | 2,500 | 95,275(2.62%)#7 | 480,873(0.52%)#18 |
| 19. | Port Chester | 2,307 | 177,448(1.30%)#4 | 480,873(0.48%)#19 |
| 20. | Peekskill | 2,091 | 177,448(1.18%)#5 | 480,873(0.43%)#20 |
| 21. | Bridgeport | 2,039 | 24,026(8.49%)#3 | 480,873(0.42%)#21 |
| 22. | Philadelphia | 1,775 | 10,035(17.69%)#1 | 480,873(0.37%)#22 |
| 23. | Paterson | 1,775 | 95,275(1.86%)#8 | 480,873(0.37%)#23 |
| 24. | Nanuet | 1,770 | 177,448(1.00%)#6 | 480,873(0.37%)#24 |
| 25. | Plainfield | 1,657 | 95,275(1.74%)#9 | 480,873(0.34%)#25 |
| 26. | Brentwood | 1,649 | 177,448(0.93%)#7 | 480,873(0.34%)#26 |
| 27. | Medford | 1,556 | 177,448(0.88%)#8 | 480,873(0.32%)#27 |
| 28. | Doral | 1,412 | 54,585(2.59%)#2 | 480,873(0.29%)#28 |
| 29. | Springs | 1,377 | 177,448(0.78%)#9 | 480,873(0.29%)#29 |
| 30. | New Haven | 1,357 | 24,026(5.65%)#4 | 480,873(0.28%)#30 |
| 31. | Hialeah | 1,297 | 54,585(2.38%)#3 | 480,873(0.27%)#31 |
| 32. | Allentown | 1,212 | 10,035(12.08%)#2 | 480,873(0.25%)#32 |
| 33. | Sunrise | 1,163 | 54,585(2.13%)#4 | 480,873(0.24%)#33 |
| 34. | Norwalk | 1,153 | 24,026(4.80%)#5 | 480,873(0.24%)#34 |
| 35. | Spring Valley | 1,137 | 177,448(0.64%)#10 | 480,873(0.24%)#35 |
| 36. | Milford | 1,130 | 11,727(9.64%)#1 | 480,873(0.23%)#36 |
| 37. | Sleepy Hollow | 1,069 | 177,448(0.60%)#11 | 480,873(0.22%)#37 |
| 38. | Barnstable Town | 1,062 | 11,727(9.06%)#2 | 480,873(0.22%)#38 |
| 39. | Brockton | 1,046 | 11,727(8.92%)#3 | 480,873(0.22%)#39 |
| 40. | Waterbury | 1,006 | 24,026(4.19%)#6 | 480,873(0.21%)#40 |
| 41. | Baltimore | 988 | 6,211(15.91%)#1 | 480,873(0.21%)#41 |
| 42. | Lodi Borough | 988 | 95,275(1.04%)#10 | 480,873(0.21%)#42 |
| 43. | Worcester | 966 | 11,727(8.24%)#4 | 480,873(0.20%)#43 |
| 44. | Linden | 955 | 95,275(1.00%)#11 | 480,873(0.20%)#44 |
| 45. | Hillcrest | 944 | 177,448(0.53%)#12 | 480,873(0.20%)#45 |
| 46. | Pembroke Pines | 941 | 54,585(1.72%)#5 | 480,873(0.20%)#46 |
| 47. | The Hammocks | 941 | 54,585(1.72%)#6 | 480,873(0.20%)#47 |
| 48. | Orlando | 940 | 54,585(1.72%)#7 | 480,873(0.20%)#48 |
| 49. | Ansonia | 934 | 24,026(3.89%)#7 | 480,873(0.19%)#49 |
| 50. | Trenton | 932 | 95,275(0.98%)#12 | 480,873(0.19%)#50 |
| 51. | Boston | 927 | 11,727(7.90%)#5 | 480,873(0.19%)#51 |
| 52. | East Hampton North | 922 | 177,448(0.52%)#13 | 480,873(0.19%)#52 |
| 53. | Framingham | 913 | 11,727(7.79%)#6 | 480,873(0.19%)#53 |
| 54. | North Plainfield Borough | 901 | 95,275(0.95%)#13 | 480,873(0.19%)#54 |
| 55. | Twin Rivers | 888 | 95,275(0.93%)#14 | 480,873(0.18%)#55 |
| 56. | Coconut Creek | 835 | 54,585(1.53%)#8 | 480,873(0.17%)#56 |
| 57. | Bayonne | 816 | 95,275(0.86%)#15 | 480,873(0.17%)#57 |
| 58. | Port St Lucie | 814 | 54,585(1.49%)#9 | 480,873(0.17%)#58 |
| 59. | West Haven | 797 | 24,026(3.32%)#8 | 480,873(0.17%)#59 |
| 60. | Guttenberg | 791 | 95,275(0.83%)#16 | 480,873(0.16%)#60 |
| 61. | Jacksonville | 785 | 54,585(1.44%)#10 | 480,873(0.16%)#61 |
| 62. | Clifton | 775 | 95,275(0.81%)#17 | 480,873(0.16%)#62 |
| 63. | Dover | 774 | 95,275(0.81%)#18 | 480,873(0.16%)#63 |
| 64. | Pearl River | 771 | 177,448(0.43%)#14 | 480,873(0.16%)#64 |
| 65. | East Newark Borough | 770 | 95,275(0.81%)#19 | 480,873(0.16%)#65 |
| 66. | Torrington | 765 | 24,026(3.18%)#9 | 480,873(0.16%)#66 |
| 67. | Davie | 757 | 54,585(1.39%)#11 | 480,873(0.16%)#67 |
| 68. | Kissimmee | 750 | 54,585(1.37%)#12 | 480,873(0.16%)#68 |
| 69. | Hempstead | 743 | 177,448(0.42%)#15 | 480,873(0.15%)#69 |
| 70. | Cliffside Park Borough | 710 | 95,275(0.75%)#20 | 480,873(0.15%)#70 |
| 71. | Columbia Heights | 696 | 8,438(8.25%)#2 | 480,873(0.14%)#71 |
| 72. | Harrison | 696 | 95,275(0.73%)#21 | 480,873(0.14%)#72 |
| 73. | Hollywood | 692 | 54,585(1.27%)#13 | 480,873(0.14%)#73 |
| 74. | New Britain | 692 | 24,026(2.88%)#10 | 480,873(0.14%)#74 |
| 75. | Fall River | 691 | 11,727(5.89%)#7 | 480,873(0.14%)#75 |
| 76. | White Plains | 688 | 177,448(0.39%)#16 | 480,873(0.14%)#76 |
| 77. | Phoenix | 682 | 1,911(35.69%)#1 | 480,873(0.14%)#77 |
| 78. | Miami Beach | 680 | 54,585(1.25%)#14 | 480,873(0.14%)#78 |
| 79. | Miramar | 678 | 54,585(1.24%)#15 | 480,873(0.14%)#79 |
| 80. | Silver Lake Cdp Essex County | 678 | 95,275(0.71%)#22 | 480,873(0.14%)#80 |
| 81. | Patchogue | 669 | 177,448(0.38%)#17 | 480,873(0.14%)#81 |
| 82. | Tampa | 667 | 54,585(1.22%)#16 | 480,873(0.14%)#82 |
| 83. | Ampere North | 666 | 95,275(0.70%)#23 | 480,873(0.14%)#83 |
| 84. | Little Ferry Borough | 635 | 95,275(0.67%)#24 | 480,873(0.13%)#84 |
| 85. | Miami Gardens | 633 | 54,585(1.16%)#17 | 480,873(0.13%)#85 |
| 86. | Aspen Hill | 631 | 6,211(10.16%)#2 | 480,873(0.13%)#86 |
| 87. | Kendall | 617 | 54,585(1.13%)#18 | 480,873(0.13%)#87 |
| 88. | Ridgefield Park | 617 | 95,275(0.65%)#25 | 480,873(0.13%)#88 |
| 89. | Freeport | 614 | 177,448(0.35%)#18 | 480,873(0.13%)#89 |
| 90. | Coral Springs | 611 | 54,585(1.12%)#19 | 480,873(0.13%)#90 |
| 91. | Valley Stream | 604 | 177,448(0.34%)#19 | 480,873(0.13%)#91 |
| 92. | Central Islip | 595 | 177,448(0.34%)#20 | 480,873(0.12%)#92 |
| 93. | Meadow Woods | 594 | 54,585(1.09%)#20 | 480,873(0.12%)#93 |
| 94. | Perth Amboy | 591 | 95,275(0.62%)#26 | 480,873(0.12%)#94 |
| 95. | Roselle Borough | 571 | 95,275(0.60%)#27 | 480,873(0.12%)#95 |
| 96. | Methuen Town | 564 | 11,727(4.81%)#8 | 480,873(0.12%)#96 |
| 97. | North Bellport | 561 | 177,448(0.32%)#21 | 480,873(0.12%)#97 |
| 98. | North Arlington Borough | 558 | 95,275(0.59%)#28 | 480,873(0.12%)#98 |
| 99. | Hightstown Borough | 552 | 95,275(0.58%)#29 | 480,873(0.11%)#99 |
| 100. | Columbus | 544 | 1,918(28.36%)#1 | 480,873(0.11%)#100 |
Common Questions
What are the Top 10 Cities with the Most Immigrants from Ecuador in the United States?
Top 10 Cities with the Most Immigrants from Ecuador in the United States are:
#1
125,959
#2
18,452
#3
11,340
#4
6,572
#5
6,051
#6
4,496
#7
4,491
#8
4,068
#9
3,613
#10
3,386
What city has the Most Immigrants from Ecuador in the United States?
New York has the Most Immigrants from Ecuador in the United States with 125,959.
What is the Total Immigrants from Ecuador in the United States?
Total Immigrants from Ecuador in the United States is 480,873.